Abstract
The air-management system of a proton exchange membrane fuel cell (PEMFC) is responsible for supplying the fuel cell stack with ambient air at appropriate conditions. The compressor of the air-management system can be partly driven by utilizing the fuel cell exhaust gas in a turbine. The fuel cell exhaust is partially or fully saturated with water vapor. When the exhaust gas is expanded in the turbine, supersaturation occurs. This leads to the nucleation of droplets and their subsequent growth by condensation. This study provides an overview and understanding of the various phenomena caused by condensation and liquid water in the turbine of a PEMFC air-management system. The basis for this work is previously published numerical simulations that focused on individual aspects of the above phenomena. The present work revisits these results and puts them in context to provide a comprehensive understanding. Important phenomena are the effects of condensation on turbine performance through phase change losses, release of latent heat and thermal throttling. In addition, the released latent heat offers a power potential for downstream turbine stages. Through these effects, condensation can also impact the entire air-management system. However, condensation may occur unevenly, causing a circumferential asymmetry of the turbine outflow. Liquid water in the turbine can lead to droplet erosion, corrosion, and water-induced damage. In summary, it is essential to consider condensation and liquid water when developing turbines for PEMFC air-management systems.
1. Introduction
Proton exchange membrane fuel cells (PEMFCs) are a key element for a sustainable mobility sector. In addition to the fuel cell stack itself, the air-management system is the most expensive subsystem of a fuel cell. It also has the highest power demand [1]. The air-management system is responsible for supplying air to the fuel cell at the right conditions and for handling the fuel cell outflow of humid air and liquid water. Figure 1 shows a schematic of an electrically turbocharged air-management system for a PEMFC. The compressor provides an increase in the working pressure of the fuel cell and, thus, increases the cell voltage of the stack. This advantage is countered by the power required for compression. However, a turbine can be added downstream of the fuel cell stack. This allows the partial recovery of the compression power. The compressor, motor, and turbine, together, form the PEMFC turbocharger. In automotive applications, the turbine provides about one-third of the compressor power [2]. Thus, the turbine significantly increases the system efficiency, but is not essential for a functioning system. In contrast, a turbine is a strict prerequisite for high-altitude fuel cell aircraft operations because of the greater pressures ratios involved. Without a turbine, the compressor would demand a major part of the power of the fuel cell [3].
Several authors have investigated the optimal machine type for both compressor and turbine in an automotive PEMFC application and concluded that radial turbomachines are best suited for both tasks [4,5,6,7]. Accordingly, only radial turbines are considered for this study. The outflow from the fuel cell stack consists of air and water in two states, vapor and liquid. A large amount of the liquid water, but not all, is separated upstream of the turbine. Thus, the turbine inflow also consists of air, water vapor, and to some extent liquid water. In addition, the expansion in the turbine causes the water vapor to condense, forming more liquid water. The water vapor, condensation, and liquid water affect the turbine in various ways, from reduced efficiency to water droplet erosion. These effects have been studied in great detail as part of the ARIEL (Charging for Fuel Cell Systems by Interdisciplinary Electric Air Compressors) project, which deals with the development of an automotive electric fuel cell turbocharger [8]. The findings of ARIEL regarding condensation and liquid water were discussed by the authors in several studies [9,10,11,12]. However, these publications focused on single aspects and were intended for turbine experts. In contrast, this work is aimed at designers of fuel cell turbochargers, air-management systems, and fuel cell systems. It is intended to provide an overview and understanding of the broad spectrum of phenomena caused by condensation and liquid water. For this reason, no new simulations or experiments were carried out for this work. Instead, the individual phenomena discussed and published previously [9,10,11,12] are put into context to provide said overview and understanding. This includes a summary of the effects that a turbine affected by condensation can have on the entire air-management system, see Section 3.6. This summary was provided by Lück et al. [13], who used the results of Wittmann et al. [10] as input data for their transient system analysis of an entire PEMFC air-management system with condensation in the turbine.

Figure 1.
Electrically turbocharged air-management system for a proton exchange membrane fuel cell (PEMFC). Adapted from [12]. Copyright 2022 ASME.
Figure 1.
Electrically turbocharged air-management system for a proton exchange membrane fuel cell (PEMFC). Adapted from [12]. Copyright 2022 ASME.

In addition to some general considerations by Cunningham et al. [14], and more recently by Filsinger et al. [15], the authors are not aware of any other work that deals in detail with condensation and liquid water in the turbine of a fuel cell turbocharger. The same is true for other expansion devices discussed for PEMFC air-management systems, such as screw [16] or scroll expanders [17]. However, there is research on condensation and liquid water in radial turbines for other applications. Schuster et al., for example, have studied droplet deposition and wall film motion in stationary radial turbines for the process industry [18]. Additionally, condensation and liquid water are common and well researched issues in steam turbines. Hesketh and Walker provide an overview of the effects of steam wetness [19]. Specifically, they discuss thermofluid effects, erosion, corrosion, and water-induced damage. The latest wet steam Special Issues provide a comprehensive overview of the state of research on condensation in steam turbines [20,21,22,23]. Other examples of condensation in turbomachinery include supercritical carbon dioxide compressors [24] and turbofans [25]. Although there are many similarities to steam turbines, there are three key differences to wetness in a fuel cell turbocharger. First, the relative humidity representing the gas mixture is an additional degree of freedom that is not present in the classic pure steam turbine. Second, the pressure ratio in a fuel cell turbocharger is much smaller than in a multistage steam turbine. This means that the occurrence of condensation is not always certain and can be significantly influenced by the specific operating point. Third, radial turbines experience much more secondary flow. This is due to the inherent radial asymmetry and the relatively small channel height, whereas steam turbines are usually built axially and with large channel diameters.
As will be shown in the following, condensation and liquid water is an important aspect of the system architecture introduced in Figure 1. However, the discussion of the optimal PEMFC system architecture is not yet settled and several other system architectures have the possibility to greatly reduce the impact of condensation and liquid water, or abolish it all together. Fröhlig et al. [26] proposed an air-management system in which the fuel cell exhaust gas is dehumidified and also heated in exchange with the compressor outflow. This would result in a hot and dry turbine inflow, avoiding the effects discussed in this paper. Barchewitz et al. investigated a system where hydrogen or other fuels are burnt upstream of the turbine to increase its power [27]. This would also prevent any condensation or liquid water in the turbine. Cruz Champion and Kabelac [28] designed a system in which the fuel cell exhaust was dehumidified through compression, cooling, and subsequent water separation.
The structure of this work is as follows. First, the theory of condensation in turbines and the corresponding numerical representation are briefly introduced. Then, the turbine test case of this and all previous works of the authors is presented. In the main part of the paper, the phenomena caused by condensation and liquid water are discussed and put into context. Finally, conclusions are drawn.
2. Materials and Methods
2.1. Condensation Theory and Numerics
Several of the phenomena discussed later depend on the non-equilibrium condensation of water vapor. This occurs when the humid fuel cell exhaust gas expands in the turbine and, thus, the static temperature of the flow and the saturation temperature of the water vapor decrease. When the gas temperature falls below the saturation temperature of the water vapor, the flow is subcooled. Subcooling is calculated from the saturation temperature minus the gas temperature. No nuclei for heterogeneous droplet formation are present in a fuel cell outflow. Hence, the subcooling increases up to approximately 30 . Here, the formation probability of stable homogeneous nuclei increases strongly. These nuclei consist purely of water molecules and agglomerate due to Brownian motion. The nuclei provide a large surface area that allows for strong condensation of water vapor on them, creating droplets and releasing large amounts of latent heat. Due to this phase change and heating, the gas flow approaches thermodynamic equilibrium. Thus, non-equilibrium condensation can be considered as an interdependent problem of nucleation and condensation. A more detailed explanation has been presented, for example, by Starzmann et al. [29]. Typically, this phenomenon is modeled based on the classical nucleation theory. A comprehensive review of this theory is provided by Bakhtar et al. [30]. The classical homogeneous nucleation rate per unit volume of mixture is given by:
Nuclei must have a certain size to be able to grow into a droplet. Smaller nuclei dissolve back into vapor. The critical radius of a droplet in unstable equilibrium with the surrounding vapor is:
The critical radius decreases with increasing subcooling, which is represented by a rising supersaturation ratio S. This, in turn, increases the nucleation rate . The classical nucleation theory does not account for the temperature difference between the droplet and the surrounding vapor. Thus, the non-isothermal correction (NISO) of Kantrowitz [31] is commonly used. It has the form
with
The above model for nucleation is combined with a model for droplet growth representing the condensation of vapor onto the droplet. Reviews on this issue were published by Young [32] and Lamanna [33]. More recently, Wiśniewski et al. [34,35] have discussed condensation models for humid air. This study employs the droplet growth model by Young [32] which, in turn, is based on an older model by Gyarmathy [36]:
with
Most of the results discussed later were obtained numerically with 3D Reynolds-averaged Navier–Stokes (RANS) simulations. The above outlined theory can be implemented in an Euler–Euler or an Euler–Lagrange framework. The latter treats the droplets as discrete particles, while Euler–Euler models the dispersed droplet phase as a continuum. Euler–Lagrange provides higher accuracy for the calculation of the droplet phase, but the computation time is considerably longer. Detailed comparisons of the application of both approaches for condensing steam flows were published by White [37] and Hughes et al. [38]. All numerical results discussed in this study were obtained using the Euler–Lagrangian Discrete Phase Model (DPM) framework of Ansys Fluent. Other works employing an Euler–Lagrange approach for condensing steam flows include Young [39], Gerber [40], Fakhari [41], Sasao et al. [42], and Schuster et al. [43]. The calculation process in this study is as follows. Each cell of the numeric mesh is evaluated for the criterion of a minimal nucleation rate of . A discrete phase parcel is generated in each mesh cell where the criterion is met. Such a parcel represents all droplets nucleating in a mesh cell. The droplets within the parcel are initialized with the critical radius and a velocity equal to the vapor phase. Then, the Discrete Phase Model calculates the trajectories of the parcels, as well as the droplet growth due to condensation. The trajectory calculation accounts for the droplet drag in the surrounding gas according to Schiller and Naumann [44], including the correction for submicroscopic particles by Cunningham [45], as well as for the thermophoretic force. The latter considers the force acting on a droplet subjected to a temperature gradient of the surrounding flow. In this work, the continuous gas phase and the disperse droplet phase are two-way coupled. Hence, the Discrete Phase Model also calculates the effect of the droplet phase on the gas phase. According to Gyarmathy, the quasi-steady droplet temperature during condensation can be approximated with
Condensation is highly sensitive to the material properties. Hence, all properties are calculated with real gas equations, especially with those of the International Association for the Properties of Water and Steam (IAPWS) [46]. Humid air is assumed to be an ideal mixture of water vapor and air. All simulations use the SST-k- turbulence model with viscous heating. More comprehensive discussions of the model were published earlier [47,48]. Due to the high sensitivity to material properties and modeling parameters, a thorough validation of the condensation model is of high importance. Typically, condensation models are validated with supersonic nozzle flows. The expansion rate, Mach number, and subcooling along a nozzle flow resembles real turbine flows. However, nozzles are much more accessible for measurements.
The nozzle by Moses and Stein, case 252 [49], is often used for validation purposes. It has inlet stagnation conditions of = 40,050 Pa and and a throat height of 10 . In particular, it was one of the main validation cases of the International Wet Steam Modelling Project (IWSMP) [29]. There, a large number of international research groups compared their models for the same nozzle test cases. The IWSMP also provided the meshes and data for the validation cases used for this work. As an example, Figure 2 shows the result of the model used for this study (blue) and the results of the IWSMP (gray) for the Moses and Stein nozzle. Typically, condensation models are calibrated with experimental data. The model applied in this study uses the classical nucleation theory with NISO Correction, Young’s growth law with , and the surface tension of planar water scaled by a factor of 1.04. This calibration shows a very good agreement with the experimental results both for the pressure and for the mean Sauter droplet radius. Detailed results for the validation of this model were published earlier [48].
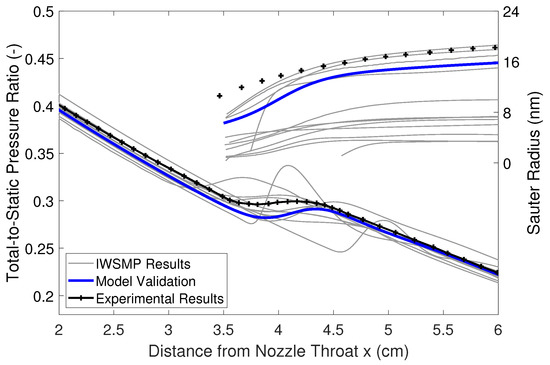
Figure 2.
Validation of the nucleation and condensation model with the Moses and Stein nozzle, case 252. Adapted from [12]. Copyright 2022 ASME.
2.2. Turbine Test Case
The phenomena discussed in this paper were investigated for an automotive fuel cell turbocharger presented in this section. However, all phenomena can be expected to occur in other applications of PEMFC turbochargers, including aviation. The turbine studied in the ARIEL project is shown in Figure 3. It consists of a volute, 10 stator vanes, and 13 rotor blades. The main operating point is defined with a constant total pressure of 1850 , a total temperature of 345 Kelvin at the turbine inlet (blue) and ambient pressure at the turbine outlet (red). The mass fraction of water vapor at the volute inlet varies between 0% and 14%. The latter value corresponds to a relative humidity of 110% at the turbine inlet and, thus, indicates a subcooled turbine inflow. All relative humidity values given in this study refer to the stagnation condition of the turbine inlet. The stator-rotor interface is modeled with a frozen rotor approach. A mixing plane is not feasible as DPM trajectories cannot be transferred across it. Furthermore, the circumferential asymmetries discussed later would be concealed by the mixing. There is no significant heat transfer from the turbine, so the walls are assumed to be adiabatic. The main analysis plane (green) for this study is directly downstream of the turbine rotor. The fully structured hexahedral stator and rotor meshes consist of 492 k nodes for each stator vane and 756 k nodes for each rotor blade, respectively. The unstructured tetrahedral volute mesh consists of 1764 k nodes with 25 prism layers. For all mesh domains, Y+ is less than one. For the grid independence study, performance parameters, such as pressure ratio and mass flow rate, as well as flow profiles, especially temperature and subcooling, were considered. The maximum grid convergence index (GCI) achieved is 3% with a cell number refinement factor of two. All simulations were performed at steady state. Fakhari has shown that the location of the condensation zones fluctuates and that the steady-state simulation underestimates the condensation losses [50].
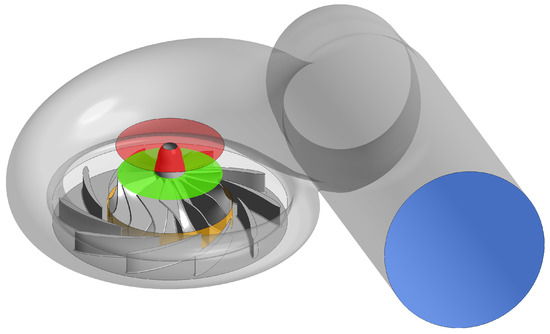
Figure 3.
Full-annulus domain with inlet (blue), frozen rotor interface (orange), outlet (red), and analysis plane (green). Adapted from [12]. Copyright 2022 ASME.
Despite these inaccuracies, steady-state simulations provide good flow results, while maintaining computational efficiency. Most of the data discussed in this paper were obtained using the full annulus computational domain shown in Figure 3. However, a large number of simulations were required for the performance map discussed in Section 3.3. To avoid the otherwise excessive calculation times, a reduced computational domain with three stator vanes, four rotor blades, no volute, and with a frozen rotor interface was used (see Figure 4). The width of the stator channel was slightly increased in order to achieve an exact stage matching of stator and rotor. The inflow of the stator is assumed with a zero incidence at the leading edges of the stator vanes. The influence of the volute on the rotor is limited for turbines with a vaned stator [51]. As will be shown in Section 3.5, condensation phenomena are concentrated in the rotor. Therefore, the simplification of the stage matching approach is justified.
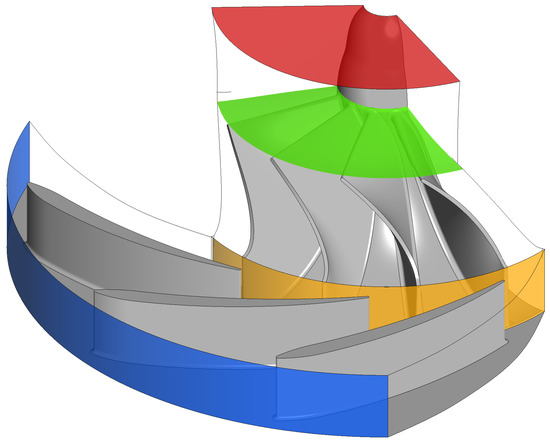
Figure 4.
Stage matching domain with inlet (blue), frozen rotor interface (orange), outlet (red), and analysis plane (green). Adapted from [10]. Copyright 2021 ASME.
3. Results and Discussion
This chapter covers all phenomena relevant to the design of a PEMFC air-management system that are caused by or related to condensation and liquid water in the turbine. The list starts with phenomena affecting turbine performance and aero-thermodynamics, continues with effects on the air-management system and concludes with possible damage to the turbine.
3.1. Phase Change of Water Vapor to Liquid Water
The most obvious effect of condensation is certainly the phase transition from water vapor to liquid water. As described above, condensation does not occur at equilibrium, but requires significant subcooling for homogeneous nucleation. Figure 5 shows the subcooling and the condensed fraction of water vapor directly after the turbine in the green analysis plane of Figure 3. It can be seen that up to a relative humidity of 60% at the turbine inlet, the turbine outflow is highly subcooled but no condensation occurs. At higher humidities, the subcooling is sufficient for nucleation and condensation sets in. The corresponding release of latent heat reduces the subcooling. The point of maximum subcooling, also called the Wilson point, is reached at 75% relative humidity in this test case. At 100% relative humidity, the turbine outflow has not yet reached thermodynamic equilibrium. However, these data were obtained directly downstream of the rotor blades. The droplets continue to grow downstream of the turbine and the flow reaches thermodynamic equilibrium while still within the simulated domain. At 100% relative humidity, the computational fluid dynamics (CFD) predict that almost 5% of the water vapor present at the turbine inlet has condensed. An earlier study [10] showed that the condensed vapor fraction depends mainly on the relative humidity at the turbine inlet and on the pressure ratio of the turbine. From the turbine performance maps published there, it can be concluded that up to 15% of the water vapor can condense in a typical automotive application. The liquid water can be separated from the gas flow and is then available for humidification and evaporative cooling of the fuel cell system.
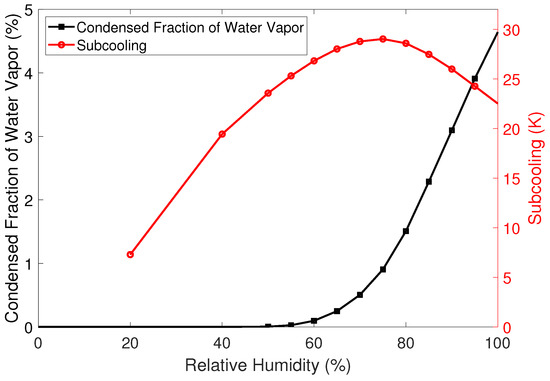
Figure 5.
Condensed fraction of water vapor and subcooling after the turbine. Data taken from [12].
3.2. Release of Latent Heat
An essential phenomenon of condensation is the release of latent heat. In the test case studied here, the specific enthalpy of condensation is about 2060 /. When released, this enthalpy has a strong effect on the temperature field of the turbine flow. Figure 6 presents the already shown subcooling, as well as the static temperature of the turbine outflow. It can be seen that with the onset of condensation at relative humidities greater than 60%, the outflow temperature increases sharply. This corresponds with the drop in subcooling and increase in the fraction of condensed vapor in Figure 5.
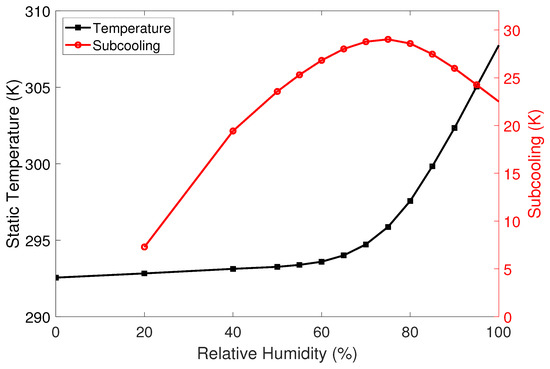
Figure 6.
Static temperature and subcooling after the turbine in dependence of the relative humidity. Adapted from [12]. Copyright 2022 ASME.
At 100% relative humidity, the outflow temperature is more than 15 higher than in the dry case. Again, these data were obtained right after the turbine blades. When the flow reaches equilibrium due to the continuing condensation, the temperature increase can be as high as 30 compared to the dry case. This means that the temperature difference between the turbine inlet and outlet is rather small. In the test case investigated here, it can be as low as 15 . The release of latent heat also changes the appearance of the performance characteristics. Figure 7 shows the turbine outlet temperature for five turbine rotor speeds as a function of the total-to-static pressure ratio of the turbine. The curves were obtained by varying the mass flow rate while keeping all other boundary conditions constant. The calculations were performed with the previously introduced stage matching setup without a volute, see Figure 4. Without a volute, condensation sets in at slightly lower relative humidities. In other words, the same operating point has higher outlet temperatures without a volute. However, the findings are not affected by this difference. For a typical dry turbine flow with constant inlet temperature, the static temperature at the outlet decreases with increasing pressure ratio. However, the results in Figure 7 show that this does not generally apply to a humid turbine flow. As the pressure ratio increases, the outlet temperature rises abruptly as soon as the subcooling is large enough for nucleation followed by condensation. The gradient becomes less steep when thermodynamic equilibrium is reached after the turbine. Naturally, higher humidities at the turbine inlet lead to the onset of condensation at lower pressure ratios. Interestingly, the operating points with the same humidity and pressure ratio overlap, regardless of the rotor speed. This shows that condensation is mainly a function of the pressure ratio and the available water vapor. The detailed aerodynamics of the turbine flow is less important.
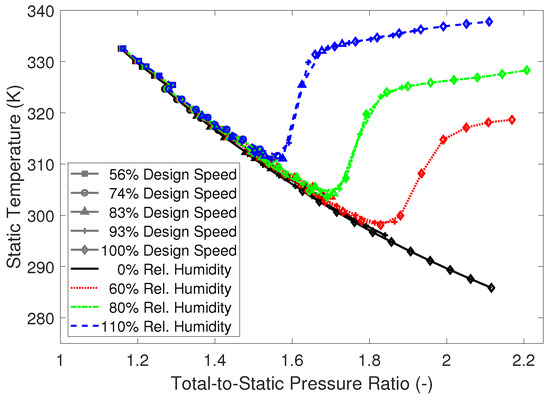
Figure 7.
Static temperature of the turbine outlet for five turbine rotor speeds in dependence of the total-to-static pressure ratio. Adapted from [10]. Copyright 2021 ASME.
3.3. Thermal Throttling
The release of latent heat also leads to thermal throttling of the turbine. This means that, for a constant mass flow, the pressure ratio of a turbine increases with condensation. Or, for a given constant pressure ratio, the mass flow decreases, as shown in Figure 8. Here, thermal throttling is superimposed by the effect of the variable gas mixture. Between 0% and 60% relative humidity, no condensation takes place and the mass flow decreases linearly due to the decreasing density of the gas mixture. With the onset of condensation at 60% relative humidity, the mass flow decline becomes much steeper. The quantitative effect of thermal throttling depends on the operating conditions and the turbine geometry. In the test case shown in Figure 8, the mass flow at 100% relative humidity is about 4.5% smaller than in the dry case. About half of this decrease can be attributed to thermal throttling. Figure 8 also shows the efficiency of the turbine. This will be discussed in the next Section 3.4. Of course, the variable gas mixture and thermal throttling due to condensation also affect the turbine performance map. The former can be corrected using an approach introduced by the Advisory Group for Aerospace Research and Development (AGARD) [52].
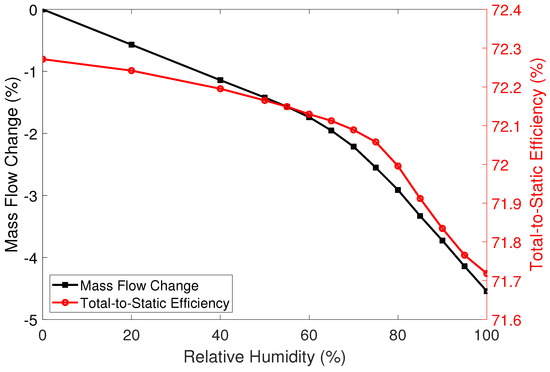
Figure 8.
Total-to-static pressure ratio and efficiency in dependence of the relative humidity. Data taken from [12].
For this purpose, the speed and mass flow of the turbine are corrected as follows:
However, the effect of thermal throttling is the result of a phase change bound to a saturation function and cannot be corrected. Figure 9 shows a section of the turbine performance map. The data were obtained with the same stage matching approach already described for Figure 7. In Figure 9, the same speed lines are plotted for four different humidities, ranging from dry flow to 110% relative humidity at the turbine inlet.
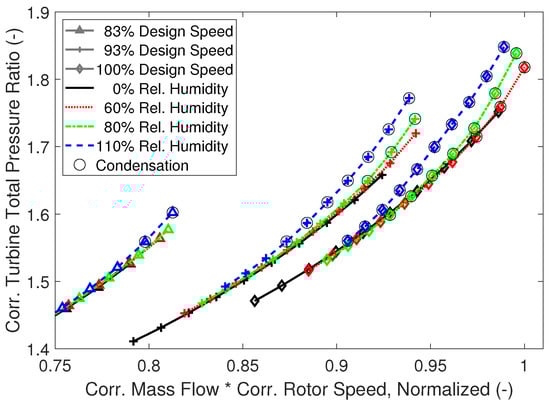
Figure 9.
Section of the turbine performance map. Data taken from [10].
Grey circles indicate operating points with condensation of at least 0.1% of the vapor mass flow. The operating points of the same speed line overlap when there is no condensation. However, as soon as condensation sets in, the speed lines with condensation split off from the others to higher pressure ratios. This shows the influence of thermal throttling on the turbine performance map. The higher the pressure ratio and the humidity, the earlier and stronger is the condensation and the earlier and more pronounced is the split-off between the speed lines of different humidities. Consequently, a turbine with condensation cannot be represented with one performance map for all humidities. Instead, a performance map is only valid for one specific humidity. More detailed discussions of this phenomenon were published earlier [10,13].
3.4. Efficiency Reduction
It is known from steam turbine research that condensation losses reduce turbine efficiency. At low to medium steam wetness, aerothermal losses due to supersaturation and condensation have the greatest effect on steam turbines [53,54]. The same can be assumed for the turbines of fuel cell turbochargers, since the fraction of liquid water in these is also low. Other aerothermal losses are profile losses due to wetted surfaces and condensation-induced pressure changes. Greater degrees of wetness would increase the effect of mechanical losses. These include drag losses due to acceleration of slow droplets, braking losses due to impact of droplets on the turbine rotor, momentum losses due to deposition of droplets on other surfaces, and pumping losses due to centrifugation of water films on the rotor blades [53]. The release of latent heat distorts all characteristic values dependent on temperature and enthalpy. The efficiency is therefore calculated with the turbine power. The total-to-static efficiency is given by:
with the output power P, the mass flow and the isentropic total-to-static enthalpy difference . The latter is calculated assuming an ideal gas and a constant ratio of specific heats . This yields:
with the index 0 indicating the inlet and the index 2 being the outlet [10]. The efficiency shown in Figure 8 decreases slightly between 0% and 70% relative humidity. This is due to the changing gas mixture. The reason for the steeper decline between 70% and 100% relative humidity is the losses described above. As the humidity increases, the condensation zones move upstream through the turbine. When the condensation is located sufficiently upstream, the release of latent heat provides a power potential that can partially offset the losses due to condensation. This is the reason for the less steep gradient between 95% and 100% relative humidity.
3.5. Circumferential Asymmetry of the Turbine Flow
Nucleation and condensation in the turbine do not occur uniformly, but depend on the turbine geometry and local flow phenomena. The greater the subcooling, the stronger the nucleation. Therefore, the highest nucleation rates are found in areas with high flow velocities. The higher the humidity at the turbine inlet, the further upstream in the turbine nucleation occurs. Therefore, with increasing humidity, nucleation begins in the rotor tip gap and on the suction side of the rotor blade. Subsequently, nucleation occurs over the entire cross-section of the rotor blade channel. With further increasing humidity, the nucleation zones move upstream through the rotor blade channel. The same behavior was observed by Schuster et al. during their studies of radial turbines for stationary applications [18]. In the turbine studied here, no nucleation was detected in the stator at any of the operating points investigated. Nucleation in the stator would require much higher pressure ratios, which would provide sufficient subcooling already in the stator channels. A detailed discussion of the nucleation zones and subsequent droplet growth by condensation has been published previously [9]. Figure 10 shows the full annulus flow for the design operating point at 80% relative humidity at the inlet. Rotor and stator channels are marked ‘R’ and ‘S’, respectively, and are counted counterclockwise from the volute tongue. Blue isosurfaces mark a nucleation rate of which is higher than the actual nucleation onset in the model. This makes the nucleation zones appear smaller and the variations of the nucleation zones between the blade channels are better visible. Slight differences are to be expected due to the frozen rotor interface. However, the nucleation zones in the rotor blade channels R9 to R13 are significantly smaller than in the other blade channels. In particular, R10 and R11 do not cover the entire cross-section of the blade channel. The reason for this is flow separation at the upstream stator vanes. The Mach contour curve and the flow vectors in the mid span of the stator show a separated flow at S6 and S7, which allows an attached flow in S8 and another separated flow in S9. These flow separations are the result of a non-optimal turbine design and are not caused by the condensing flow. However, a flow separation partially blocks the respective stator channel, reducing the mass flow through the channel and, thus, the velocity at the channel outlet. In addition, losses are added to the flow. Both phenomena increase the static temperature at the outlet of the stator channel and, thus, reduce subcooling. This is the reason for the lower nucleation in the downstream rotor blade channels R9 to R13.
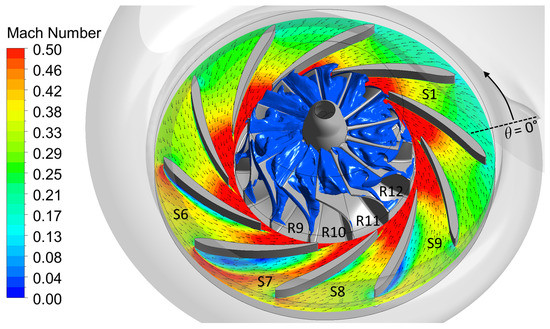
Figure 10.
Mach contour and normalized tangential flow vectors at the stator mid span and isosurfaces of nucleation in the rotor for the design operating point at 80% relative humidity. Adapted from [12]. Copyright 2022 ASME.
Smaller and weaker nucleation zones reduce the number of droplets formed and, thus, the amount of water vapor condensation downstream of the nucleation. This results in a circumferential asymmetry where less latent heat is released in some rotor blade channels than in others. In Figure 11, the static temperature at the turbine exit is plotted versus the circumferential angle , where 0° at the volute tongue. The wakes of the rotor blades are indicated by vertical dashed lines, and the blade channel labels correspond to those in Figure 10. The dry case with 0% relative humidity at the turbine inlet shows small variations with higher temperatures in the blade wakes due to the lower velocity and boundary layer losses there. The static temperature in channels R9 to R13 is slightly higher than average. This is an effect of the separations mentioned above. In contrast, the case with 80% relative humidity shows large variations, both within the blade channel and over the entire circumference. The overall temperature is much higher than in the dry case, which is obviously due to condensation. Interestingly, the static temperature in the case with a relative humidity of 100% is almost constant and shows smaller variations than in the dry case. The explanation why condensation causes large temperature variations in one case and smooths the variations in the other case is the following. At a relative humidity of 80%, the flow separations described above can determine whether condensation occurs or is suppressed. Therefore, blade channels without upstream separations such as R1 to R8 experience a much higher temperature rise than R9 to R13. In addition, the lower subcooling in the boundary layer and in the wakes of the blades lead to less condensation and, thus, to greater variations within a blade channel. Of course, separations also have an effect on the case of 100% relative humidity. There, however, they are not able to suppress the onset of nucleation, as the subcooling is large enough even despite their influence. Rather, in case of 100% relative humidity, condensation reduces the variations due to the following mechanism. Flow regions that are warmer in the dry case have less subcooling and, therefore, experience less condensation with less release of latent heat. The opposite is true for flow areas that are colder in the dry case. This leads to a reduction in temperature variations. Such variations as described above are only found for the temperature of the turbine outflow. Other variables, such as velocity and pressure, are hardly affected. Detailed discussions of the aero-thermodynamics discussed in this section have been published previously [12].
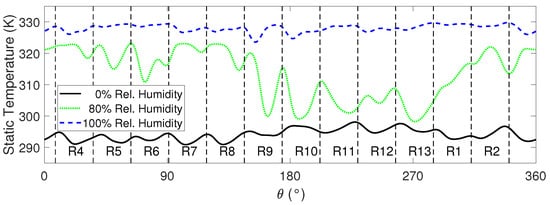
Figure 11.
Circumferential plot of the static temperature for three different relative humidities at the turbine outlet at 50% span. Adapted from [12]. Copyright 2022 ASME.
3.6. Effects on the Air-Management System as a Whole
The turbine is mechanically connected to the compressor via a shaft. In addition, the airflow that passes through the compressor, fuel cell stack, and other components of the air-management system must also pass through the turbine. Therefore, any effects of condensation on the turbine performance will also affect the entire air-management system. As mentioned above, Lück et al. [13] have performed transient simulations of an air-management system, including the turbine performance map introduced in Section 3.3. They found two ways in which condensation can interact with the turbine. First, the components downstream of the turbine may behave differently under the influence of the increased temperature in the exhaust path. Second, the operating point of the turbine changes as the humidity increases. At a constant pressure ratio, the corrected turbine speed and the mass flow rate decrease. As a result, the upstream components, such as the compressor, are throttled. Consequently, the surge margin for operating points with the same net system power is significantly reduced as the steady-state operating line is shifted toward the stability line. The surge margin is reduced by up to 5% due to the change in gas composition. Once the relative humidity at the turbine inlet exceeds 80%, strong condensation occurs in the turbine, causing an additional decrease in mass flow due to thermal throttling, see Section 3.3. This effect is particularly important during dynamic maneuvers, such as rapid deceleration. In this case, a reduced margin can cause the compressor to surge, which can result in significant damage to the system. At relative humidity levels of 80% or less, the reduction in surge margin is less pronounced. However, under these operating conditions, further condensation can occur downstream of the turbine in the exhaust tract due to the thermodynamic non-equilibrium at the turbine outlet. To achieve the same system net power at high relative humidity, the turbocharger must operate at higher speeds, thus with lower mass flows and higher pressure ratios. The impact on the overall system efficiency is small, since the reduction in mass flow and the increase in pressure ratio result in almost equal parasitic power consumption by the compressor. In short, condensation must be taken into account when designing the operating line of the system and matching the turbomachinery components. Particularly during transient operation, attention must be paid to humidity, which can compromise the operational safety of the system. Special attention must be paid to fast operating maneuvers, such as purging the fuel cell stack. In such a scenario, the release of water from the stack increases even further, so that the effects mentioned above can be amplified.
3.7. Performance Increase for Multistage Turbines
The enthalpy released by condensation provides a significant power potential in multistage turbine configurations. This will be shown in the following by a simple example. A turbine with a static pressure ratio of 8, evenly divided into two stages, is considered. At the inlet of the first turbine, , bar, a saturated gas mixture and a mass flow of 110.8 g s−1 are assumed. This corresponds to an aircraft application with a 118 fuel cell with an excess air ratio of 2 at a flight altitude of about 10 . The condensation calculation is performed with a simplified version of the approach of Roumeliotis and Mathioudakis [55]. In this approach, a polytropic expansion calculation without condensation is carried out first, followed by a calculation of the thermodynamic equilibrium with isentropic condensation. This method is discussed in more detail by [3,13]. The calculation assumes that the liquid water is completely separated after each turbine stage, that the turbine stages have a polytropic efficiency of 90% and that the flow velocity at the inlet and outlet of the turbines is 50 m s−1 in each case. Table 1 shows the comparison of a realistic fully saturated inflow (wet) with a hypothetical pure air inflow (dry). The outlet temperatures of the turbine stages are much higher in the wet case than in the dry case. The hypothetical dry flow expands to temperatures far below 0 °C, while the wet flow does not reach freezing conditions. Clearly, this is due to the latent heat released by condensation. The mass flow is constant in the dry case, while the condensation and subsequent separation of liquid water reduces the gas flow by 6.9% after the second stage in the wet case. Both turbine stages have a higher power output in the wet case. This is due to two superimposing effects. First, the specific heat capacity of humid air is higher than that of dry air. Second, the latent heat released by condensation can be utilized by downstream turbine stages. The first stage is only affected by the first effect as the model used adds the latent heat due to condensation only after a turbine stage. However, the 8.7% higher power output of the first stage in the wet case is still significant. The second stage has a 47.4% higher power output in the wet case, despite the 3.8% smaller gas inflow. These effects intensify with higher flight altitudes due to the larger pressure ratios and numbers of stages. Therefore, it is essential to consider condensation when designing a multistage turbine for a PEMFC turbocharger. A detailed discussion on the importance of condensation for fuel cell air-management systems in aviation is provided by Wittmann et al. [3].

Table 1.
Comparison of turbine performance data for a dry and wet flow.
3.8. Water Droplet Erosion
Not only condensation, but also liquid water can affect the turbine. Figure 12 shows water droplet erosion (WDE) found after operation of the test turbine with humid air on a fuel cell test rig. The experiment was not designed for WDE, therefore no information is available on the properties of the water droplets and the duration of the erosive conditions. WDE can be seen in the last third of the suction side of all stator vanes (Figure 12a) and on a narrow vertical strip near the leading edge of the suction side of all rotor blades (Figure 12b). As part of the ARIEL project, Euler–Lagrange simulations were performed to determine which droplet trajectories are responsible for this erosion [11]. The simulations showed that droplets formed by condensation occur too far downstream to be the cause of the WDE. This contradicts the results of Schuster et al. [18]. However, they studied larger turbines with higher pressure ratios that allowed the droplets to grow and deposit while still in the turbine rotor. For the PEMFC turbine studied in this work, a different hypothesis could be formulated which states that droplets stemming from the fuel cell, and thus already present at the turbine inlet, are responsible. These droplets deposit on the suction side of the stator vanes and form wall films. Large droplets, originating from the disintegration of these wall films at the trailing edge of the stator vanes, impact on the rotor blades, and cause erosion. There are two possible trajectories responsible for the WDE at the stator. First, droplets from the trailing edges of the stator vanes can be accelerated in the rotor, then leave the rotor and, finally, impact the stator vanes. Second, splashed droplets and droplets from the trailing edge of the stator vanes can form wall films on the rotor blades. These wall films are transported toward the leading edge of the rotor blades. The disintegration of the rotor wall films at the leading edges creates large droplets, which are then propelled outwards and impact the stator vanes. The best way to reduce WDE in the turbine studied would be to remove the wall films on the suction side of the stator vanes. Another possibility is a protective surface coating. Obviously, the droplet trajectories responsible for erosion in a turbine depend on the turbine geometry. Therefore, the findings on WDE presented above do not necessarily apply to all radial turbines of fuel cell turbochargers. Especially in turbines for larger applications or with higher pressure ratios, the droplets formed by condensation can become relevant for erosion.
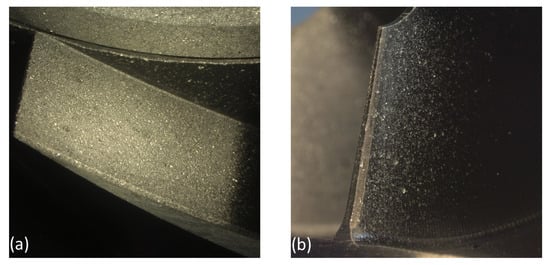
Figure 12.
Droplet erosion in a fuel cell turbocharger turbine. (a) Eroded suction side near the stator vane trailing edge. (b) Eroded suction side near the leading edge of a rotor blade. Adapted from [11].
3.9. Corrosion
Corrosion is another detrimental aspect caused by the presence of liquid water in the turbine. This phenomenon is included for completeness, although it was not investigated within the ARIEL project. The following findings are, therefore, derived from theoretical considerations and have not yet been investigated by simulations or experiments. According to Hesketh et al., the main form of corrosion in steam turbines is flow accelerated corrosion (FAC) [19]. FAC means that a water flow over a surface increases the dissolution of the surface material and, thus, the corrosion rate. The main parameters favoring FAC are high wall flow velocities, low levels of dissolved oxygen, and neutral or slightly alkaline pH values. An analysis of the product water of the fuel cell used for test runs in the ARIEL project showed acidic pH values. In addition, a fuel cell and its turbocharger turbine operate on humid air, while steam turbines operate on pure steam. Hence, the dissolved oxygen content should be much higher in the case of the fuel cell. It is, therefore, reasonable to assume that the corrosion in a fuel cell turbocharger is weaker than in a steam turbine. However, the actual corrosion rate is strongly determined by the choice of materials and the protective surface coating. A turbine design for a fuel cell turbocharger should, therefore, take into account the possibility of corrosion on all surfaces where a water film is to be expected.
3.10. Water Induced Damage
Accumulations of liquid water can cause severe damage and must, therefore, be strictly avoided. Several possible water-induced damage scenarios are conceivable for fuel cell turbochargers. However, bearing damage stands out among them. Fuel cells are very sensitive to oil contamination by oil bearings. Therefore, air bearings are commonly used for fuel cell turbochargers. These bearings are usually ventilated by sealing air that is routed from the compressor to the turbine, see Figure 13. If liquid water enters the sealing airway and reaches the bearings, a major failure is to be expected. For this scenario to occur, there must be an accumulation of liquid water between the stator and rotor. This is not unlikely because liquid water originating from the fuel cell can become trapped between the aerodynamic force of the stator flow and the centrifugal force of the rotor. Therefore, the sealing air flow should be chosen to be strong enough to prevent liquid water from entering the sealing air path. This example and other damage scenarios can be avoided by proper design and operation. In general, as little liquid water as possible should enter the turbine from the fuel cell.
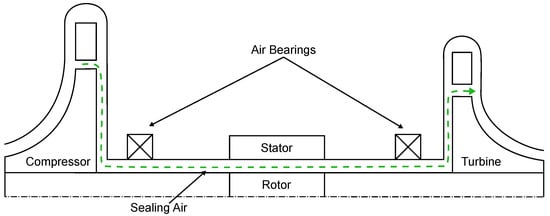
Figure 13.
Sealing air path in a fuel cell turbocharger.
4. Conclusions
This section provides a summary of the findings of this work, followed by a discussion of the implications and conclusions to be drawn from the findings. The objective of this study is to provide an overview and understanding of the phenomena caused by condensation and liquid water in the radial turbine of a fuel cell turbocharger as part of a PEMFC air-management system. The study revisited several previously published numerical analyses that examined the radial turbine of an automotive PEMFC application as part of the ARIEL project. The humid saturated fuel cell exhaust gas, which expands in the turbine, cools considerably before homogeneous nucleation forms droplets that subsequently grow by condensation. In this automotive test case, significant condensation begins at about 60% relative humidity at the turbine inlet. Condensation releases large amounts of latent heat, causing the turbine outlet temperature to almost reach the inlet temperature. The release of latent heat also leads to thermal throttling of the turbine. This results in a splitting of the performance characteristics in the performance map of the turbine. Performance characteristics with condensation have a higher pressure ratio for the same mass flow than those without condensation. In other words, a given performance map is only valid for a certain humidity at the turbine inlet. Furthermore, the efficiency of the turbine is reduced by the condensation losses. The results also show that condensation does not occur uniformly in the turbine. The flow areas most susceptible to condensation are the rotor tip gaps and the rotor fast flow zones in general. In addition, flow separation in the stator can, under certain circumstances, suppress the onset of condensation in the downstream rotor blade channels. Moreover, condensation in the turbine can affect other components of the air-management system. Therefore, condensation must be considered when matching components during development. However, in multistage applications, the increased outlet temperature of the first turbine stage offers significant power potential for the downstream turbine stages. The inflow of liquid droplets can damage the turbine and must, therefore, be avoided as far as possible. Droplets can lead to erosion on the stator vanes and rotor blades. They also deposit and form wall films that can contribute to corrosion. Finally, accumulations of liquid water can lead to water-induced damage. In particular, the air bearings of a fuel cell turbocharger are prone to major failures due to liquid water.
Clearly, it is interesting whether the adverse effects of condensation and liquid water can be avoided. The occurrence and extent of condensation depend on the relative humidity and inlet temperature at the turbine inlet, as well as the turbine pressure ratio. In the automotive test case studied in this work, condensation begins at a relative humidity of 60% at the inlet and, consequently, is unlikely to be avoided. Liquid water formed by condensation thus also cannot be avoided. Liquid water originating from the fuel cell stack can be separated from the flow upstream of the turbine. However, this cannot be successful for droplets of all sizes. Therefore, designers of fuel cell turbochargers and air-management systems must consider the aforementioned effects of condensation and liquid water.
The relative importance of the various effects caused by condensation depends on the application. Ground-based applications, such as cars or trains, are characterized by moderate pressure ratios and single-stage turbines. Here, thermal throttling due to the release of latent heat is important because it affects the matching between the turbine and other components along the gas path of the air-management system. In applications with a high share of dynamic operation, such as automobiles, the transient behavior of the condensing turbine flow should also be considered. Aviation is a PEMFC application that requires higher pressure ratios and more than one turbine stage due to the lower ambient pressure at high altitude. Here, the release of latent heat results not only in thermal throttling, but also in a significant power increase and warmer gas inflow for the downstream turbine stages. The necessity to consider these effects in the design of an aerospace PEMFC air-management system is obvious. In addition, the transient system behavior is further complicated by two or more turbine stages with condensation. Although the aforementioned effects are essential for system design, others appear to be less important. The efficiency drop due to condensation is less than 1%. Additionally, the circumferential asymmetry of turbine outflow appears to be relevant only when the inlet of another component of the air-management system is installed very close to the turbine outlet. Liquid water in the turbine must be avoided as far as possible. The risk of water droplet erosion can be mitigated by blade coatings or internal water removal. However, water accumulation can cause severe damage, including system failure. Corrosion does not appear to be the most pressing problem, but can occur with long-term operation. Future developments of PEMFC systems will influence the effects of condensation and liquid water. One important aspect is the water content in the fuel cell exhaust gas. A common effort is to improve fuel cell efficiency and enable better cooling by increasing the operating temperature of the PEMFC. At constant operating pressure, air mass flow, and relative humidity, this would increase the water content of the fuel cell exhaust gas and thus amplify condensation.
This work is intended to serve as a basis for further research and to highlight the most interesting aspects for future work. Most importantly, the results discussed need to be validated by extensive experiments. In addition, other fuel cell applications, such as heavy machinery and marine propulsion, could provide additional findings. Another interesting aspect to be investigated is different system architectures with dehumidification and heating of the turbine inlet. Further, turbine design theory needs to be developed further to account for the effects of condensation and liquid water in humid air. This should include variable geometry turbines, such as those proposed by Menze et al. for PEMFC applications [56].
Author Contributions
Conceptualization, T.W., S.L., C.B. and J.F.; methodology, T.W. and S.L.; software, T.W. and S.L.; validation, T.W. and S.L.; formal analysis, T.W. and S.L.; investigation, T.W. and S.L.; resources, C.B. and J.F.; data curation, T.W. and S.L.; writing—original draft preparation, T.W.; writing—review and editing, T.W., S.L., C.B. and J.F.; visualization, T.W.; supervision, C.B. and J.F.; project administration, C.B. and J.F.; funding acquisition, C.B. and J.F. All authors have read and agreed to the published version of the manuscript.
Funding
This research was funded by the German Federal Ministry of Transport and Digital Infrastructure (BMVI) as part of the project ARIEL, grant number 03B10105D2. The authors are responsible for the content of this publication.
Institutional Review Board Statement
Not applicable.
Informed Consent Statement
Not applicable.
Data Availability Statement
No new data were created or analyzed in this study. Data sharing is not applicable to this article.
Acknowledgments
Daniel Grundei, Markus Bartsch, and Manuel Meier from Volkswagen AG are gratefully acknowledged for their support and helpful discussions. The authors would like to thank Marco Menze from the Institute of Fluid Dynamics and Turbomachinery, Leibniz Universität Hannover for providing the volute mesh of the turbine. The student assistants Lars Hinz, Tim Hertwig, Nerea Meinicke, and Catherine Rau are gratefully acknowledged for their contributions to this study. We acknowledge support by the Open Access Publication Funds of Technische Universität Braunschweig.
Conflicts of Interest
The authors declare no conflict of interest.
Nomenclature
The following symbols and abbreviations are used in this manuscript:
| Latin characters | |
| c | Velocity |
| Specific heat capacity of the vapor | |
| h | Enthalpy |
| Latent heat | |
| Classical homogeneous nucleation rate | |
| Boltzmann constant | |
| Knudsen number | |
| Mass flow | |
| Molecule mass | |
| N | Rotational speed |
| P | Power |
| p | Pressure |
| Prandtl number | |
| Condensation coefficient | |
| R | Gas constant |
| r | Droplet radius |
| Critical droplet radius | |
| S | Supersaturation ratio |
| T | Temperature |
| Subcooling | |
| Greek characters | |
| Total-to-static efficiency | |
| Modeling parameter of Young’s growth law | |
| Modeling parameter of Young’s growth law | |
| Heat capacity ratio | |
| Circumferential angle | |
| Thermal conductivity | |
| Young’s correction factor | |
| Density | |
| Surface tension | |
| Subscripts | |
| Isentropic | |
| 0 | Turbine inlet |
| 2 | Turbine outlet |
| Corrected | |
| Dry flow without water vapor | |
| f | Saturated liquid phase |
| g | Vapor phase |
| Isentropic | |
| l | Droplet |
| s | Static |
| t | Total |
| Abbreviations | |
| AGARD | Advisory Group for Aerospace Research and Development |
| ARIEL | Charging for Fuel Cell Systems by Interdisciplinary Electric Air Compressors |
| (translated from German) | |
| CFD | Computational fluid dynamics |
| DPM | Discrete phase model |
| FAC | Flow accelerated corrosion |
| GCI | Grid convergence index |
| IAPWS | International Association for the Properties of Water and Steam |
| IWSMP | International Wet Steam Modelling Project |
| NISO | Non-isothermal correction |
| PEMFC | Proton-exchange membrane fuel cell |
| RANS | Reynolds-averaged Navier–Stokes |
| WDE | Water droplet erosion |
References
- Venturi, M.; Sang, J.; Knoop, A.; Hornburg, G. Air Supply System for Automotive Fuel Cell Application. In SAE Technical Paper Series; SAE International: Warrendale, PA, USA, 2012. [Google Scholar] [CrossRef]
- Kerviel, A.; Pesyridis, A.; Mohammed, A.; Chalet, D. An Evaluation of Turbocharging and Supercharging Options for High-Efficiency Fuel Cell Electric Vehicles. Appl. Sci. 2018, 8, 2474. [Google Scholar] [CrossRef]
- Wittmann, T.; Lück, S.; Hertwig, T.; Friedrichs, J. On the Importance of Condensation for the Thermodynamic Cycle of Fuel Cell Turbochargers in Aviation. In Proceedings of the ISABE 2022 Conference (in Print), International Society of Air Breathing Engines, Ottawa, ON, Canada, 25–30 September 2022. [Google Scholar]
- Kulp, G.W.; Gurski, S.; Nelson, D.J. PEM Fuel Cell Air Management Efficiency at Part Load. In SAE Technical Paper Series; SAE International: Warrendale, PA, USA, 2002. [Google Scholar] [CrossRef]
- Bao, C.; Ouyang, M.; Yi, B. Modeling and optimization of the air system in polymer exchange membrane fuel cell systems. J. Power Sources 2006, 156, 232–243. [Google Scholar] [CrossRef]
- Blunier, B.; Miraoui, A. Proton Exchange Membrane Fuel Cell Air Management in Automotive Applications. J. Fuel Cell Sci. Technol. 2010, 7, 727. [Google Scholar] [CrossRef]
- Traverso, A.; Magistri, L.; Massardo, A.F. Turbomachinery for the air management and energy recovery in fuel cell gas turbine hybrid systems. Energy 2010, 35, 764–777. [Google Scholar] [CrossRef]
- German Federal Ministry of Transport and Digital Infrastructure. Project ARIEL: (Aufladung für Brennstoffzellensysteme Durch Interdisziplinär Entwickelte Elektrische Luftverdichter–Charging for Fuel Cell Systems by Interdisciplinarilly Developed Electric Air Compressors): Verbundvorhaben 01183541/1–NIP II-ARIEL. Grant Number 03B10105D2. Available online: https://www.enargus.de/pub/bscw.cgi/?op=enargus.eps2&q=%2201183541/1%22&v=10&s=11&id=989361 (accessed on 7 June 2022).
- Wittmann, T.; Lück, S.; Bode, C.; Friedrichs, J. Modelling the Condensation Phenomena within the Radial Turbine of a Fuel Cell Turbocharger. Int. J. Turbomach. Propuls. Power 2021, 6, 23. [Google Scholar] [CrossRef]
- Wittmann, T.; Lück, S.; Hertwig, T.; Bode, C.; Friedrichs, J. The Influence of Condensation on the Performance Map of a Fuel Cell Turbocharger Turbine. In Proceedings of the ASME Turbo Expo 2021, American Society of Mechanical Engineers, Online, 7–11 June 2021. [Google Scholar] [CrossRef]
- Wittmann, T.; Lück, S.; Bode, C.; Friedrichs, J. Investigation of Water Droplet Erosion in the Radial Turbine of a Fuel Cell Turbocharger. In Proceedings of the Global Power & Propulsion Society, Xi’an, China, 18–20 October 2021. [Google Scholar] [CrossRef]
- Wittmann, T.; Wiśniewski, P.; Lück, S.; Dykas, S.; Friedrichs, J. Analysis of the Condensation Phenomena within the Radial Turbine of a Fuel Cell Turbocharger. In Proceedings of the ASME Turbo Expo 2022, American Society of Mechanical Engineers, Rotterdam, The Netherlands, 13–17 June 2022. [Google Scholar]
- Lück, S.; Wittmann, T.; Göing, J.; Bode, C.; Friedrichs, J. Impact of Condensation on the System Performance of a Fuel Cell Turbocharger. Machines 2022, 10, 59. [Google Scholar] [CrossRef]
- Cunningham, J.M.; Hoffman, M.A.; Eggert, A.R.; Friedman, D.J. The Implications of Using an Expander (Turbine) in an Air System of a PEM Fuel Cell Engine. In Proceedings of the Electric Vehicle Symposium 17, Portland, OR, USA, 14–17 June 2000. [Google Scholar]
- Filsinger, D.; Kuwata, G.; Ikeya, N. Tailored Centrifugal Turbomachinery for Electric Fuel Cell Turbocharger. Int. J. Rotating Mach. 2021, 2021, 3972387. [Google Scholar] [CrossRef]
- Wang, C.; Xing, Z.; Sun, S.; Chen, W.; He, Z. Experimental study on the performance of oil-free twin-screw expanders for recovering energy in fuel cell systems. Appl. Therm. Eng. 2020, 165, 114613. [Google Scholar] [CrossRef]
- Yuanyang, Z.; Liansheng, L.; Pengcheng, S. Thermodynamic Simulation of Scroll Compressor/Expander Module in Automotive Fuel Cell Engine. Proc. Inst. Mech. Eng. Part J. Automob. Eng. 2006, 220, 571–577. [Google Scholar] [CrossRef]
- Schuster, S.; Brillert, D.; Benra, F.K. Condensation in Radial Turbines—Part II: Application of the Mathematical Model to a Radial Turbine Series. J. Turbomach. 2018, 140, 289. [Google Scholar] [CrossRef]
- Hesketh, J.A.; Walker, P.J. Effects of Wetness in Steam Turbines. Proc. IMechE Part C J. Mech. Eng. Sci. 2005, 219, 1301–1314. [Google Scholar] [CrossRef]
- Bakhtar, F. Special Issue on Wet Steam-Part 1. Proc. IMechE Part C J. Mech. Eng. Sci. 2004, 218, i–iii. [Google Scholar] [CrossRef]
- Bakhtar, F. Special Issue on Wet Steam-Part 2. Proc. IMechE Part C J. Mech. Eng. Sci. 2005, 219, i–iii. [Google Scholar] [CrossRef]
- Young, J.B.; White, A.J. Special Issue on the Baumann Wet Steam Conference. Proc. IMechE Part A J. Power Energy 2014, 228, 108–109. [Google Scholar] [CrossRef]
- Bartoš, O.; Kolovratník, M. Editorial for the special issue on wet steam. Proc. Inst. Mech. Eng. Part J. Power Energy 2018, 232, 451. [Google Scholar] [CrossRef]
- Lettieri, C.; Yang, D.; Spakovszky, Z. An Investigation of Condensation Effects in Supercritical Carbon Dioxide Compressors. J. Eng. Gas Turbines Power 2015, 137, 40. [Google Scholar] [CrossRef]
- Young, J.B. Condensation in Jet Engine Intake Ducts during Stationary Operation. J. Eng. Gas Turbines Power 1995, 117, 227–236. [Google Scholar] [CrossRef]
- Fröhlig, F.; Flohr, A.; Männle, T.; Kech, J. Future Fuels and Drive Concepts—A Challenge for Turbocharging on the Way to Net Zero. In Proceedings of the 26th Supercharging Conference, Dresden, Germany, 20–21 September 2022; Zellbeck, H., Ed.; Technische Universität Dresden: Dresden, Germany, 2022. [Google Scholar]
- Barchewitz, L.P.; Seume, J.R. Conceptual Analysis of Air Supply Systems For In-Flight PEM-FC. In Proceedings of the ASME Turbo Expo 2006, Barcelona, Spain, 6–11 May 2006; pp. 229–238. [Google Scholar] [CrossRef]
- Cruz Champion, H.; Kabelac, S. Multifunctional fuel cell system for civil aircraft: Study of the cathode exhaust gas dehumidification. Int. J. Hydrogen Energy 2017, 42, 29518–29531. [Google Scholar] [CrossRef]
- Starzmann, J.; Hughes, F.R.; Schuster, S.; White, A.J.; Halama, J.; Hric, V.; Kolovratník, M.; Lee, H.; Sova, L.; Št’astný, M.; et al. Results of the International Wet Steam Modeling Project. Proc. IMechE Part A J. Power Energy 2018, 232, 550–570. [Google Scholar] [CrossRef]
- Bakhtar, F.; Young, J.B.; White, A.J.; Simpson, D.A. Classical Nucleation Theory and Its Application to Condensing Steam Flow Calculations. Proc. IMechE Part C J. Mech. Eng. Sci. 2005, 219, 1315–1333. [Google Scholar] [CrossRef]
- Kantrowitz, A. Nucleation in Very Rapid Vapor Expansions. J. Chem. Phys. 1951, 19, 1097–1100. [Google Scholar] [CrossRef]
- Young, J.B. Spontaneous Condensation of Steam in Supersonic Nozzles: N81-13307; Whittle Laboratory, University of Cambridge: Cambridge, UK, 1980. [Google Scholar]
- Lamanna, G. On Nucleation and Droplet Growth in Condensing Nozzle Flows. Ph.D. Thesis, Technische Universiteit Eindhoven, Eindhoven, The Netherlands, 2000. [Google Scholar] [CrossRef]
- Wiśniewski, P.; Dykas, S.; Yamamoto, S. Importance of Air Humidity and Contaminations in the Internal and External Transonic Flows. Energies 2020, 13, 3153. [Google Scholar] [CrossRef]
- Wiśniewski, P.; Majkut, M.; Dykas, S.; Smołka, K.; Zhang, G.; Pritz, B. Selection of a steam condensation model for atmospheric air transonic flow prediction. Appl. Therm. Eng. 2022, 203, 117922. [Google Scholar] [CrossRef]
- Gyarmathy, G. Grundlagen Einer Theorie der Nassdampfturbine. Ph.D. Thesis, Eidgenössische Technische Hochschule Zürich, Zurich, Switzerland, 1962. [Google Scholar] [CrossRef]
- White, A.J. A comparison of modelling methods for polydispersed wet-steam flow. Int. J. Numer. Methods Eng. 2003, 57, 819–834. [Google Scholar] [CrossRef]
- Hughes, F.R.; Starzmann, J.; White, A.J.; Young, J.B. A Comparison of Modeling Techniques for Polydispersed Droplet Spectra in Steam Turbines. J. Eng. Gas Turbines Power 2016, 138, 143. [Google Scholar] [CrossRef]
- Young, J.B. Two-Dimensional, Nonequilibrium, Wet-Steam Calculations for Nozzles and Turbine Cascades. J. Turbomach. 1992, 114, 569–579. [Google Scholar] [CrossRef]
- Gerber, A.G. Two-Phase Eulerian/Lagrangian Model for Nucleating Steam Flow. J. Fluids Eng. 2002, 124, 465–475. [Google Scholar] [CrossRef]
- Fakhari, K. Development of a Two-Phase Eulerian/Lagrangian Algorithm for Condensing Steam Flow. In Proceedings of the 44th AIAA Aerospace Sciences Meeting, Reno, Nevada, 9–12 January 2006; p. 229. [Google Scholar] [CrossRef]
- Sasao, Y.; Miyake, S.; Okazaki, K.; Yamamoto, S.; Ooyama, H. Eulerian-Lagrangian Numerical Simulation of Wet Steam Flow Through Multi-Stage Steam Turbine. In Proceedings of the ASME Turbo Expo 2013, San Antonio, TX, USA, 3–7 June 2013. [Google Scholar] [CrossRef]
- Schuster, S.; Brillert, D.; Benra, F.K. Condensation in Radial Turbines—Part I: Mathematical Modeling. J. Turbomach. 2018, 140, 768. [Google Scholar] [CrossRef]
- Schiller, L.; Naumann, A. A Drag Coefficient Correlation. Z. Des Vereins Dtsch. Ingenieure 1935, 77, 318–320. [Google Scholar]
- Cunningham, E. On the velocity of steady fall of spherical particles through fluid medium. Proc. R. Soc. London Ser. Math. Phys. Eng. Sci. 1910, 83, 357–365. [Google Scholar] [CrossRef]
- The International Association for the Properties of Water and Steam. Revised Release on the IAPWS Industrial Formulation 1997 for the Thermodynamic Properties of Water and Steam. 2012. Available online: https://www.teos-10.org/pubs/IAPWS-08.pdf (accessed on 7 June 2022).
- Wittmann, T.; Lück, S.; Bode, C.; Friedrichs, J. Numerical Simulation of Nucleation and Condensation in Nozzles and Radial Turbines. In Proceedings of the CADFEM ANSYS Simulation Conference 2019, Kassel, Germany, 16–17 October 2019. [Google Scholar]
- Wittmann, T.; Bode, C.; Friedrichs, J. The Feasibility of an Euler–Lagrange Approach for the Modeling of Wet Steam. J. Eng. Gas Turbines Power 2021, 143, 1301. [Google Scholar] [CrossRef]
- Moses, C.A.; Stein, G.D. On the Growth of Steam Droplets Formed in a Laval Nozzle Using Both Static Pressure and Light Scattering Measurements. J. Fluids Eng. 1978, 100, 311. [Google Scholar] [CrossRef]
- Fakhari, K. On the Effects of Unsteadiness on the Condensation Process in Low-Pressure Steam Turbines. In Proceedings of the ASME Turbo Expo 2009, Orlando, FL, USA, 8–12 June 2009. [Google Scholar] [CrossRef]
- Hellstrom, F.; Fuchs, L. Effects of Inlet Conditions on the Turbine Performance of a Radial Turbine. In Proceedings of the ASME Turbo Expo 2008, Berlin, Germany, 9–13 June 2008. [Google Scholar] [CrossRef]
- AGARD. Recommended Practices for the Assessment of the Effects of Atmospheric Water Ingestion on the Performance and Operability of Gas Turbine Engines: AGARD ADVISORY REPORT NO. 332; AGARD: Neuilly-sur-Seine, France, 1995. [Google Scholar]
- Kawagishi, H.; Onoda, A.; Shibukawa, N.; Niizeki, Y. Development of moisture loss models in steam turbines. Heat Transf.-Asian Res. 2013, 42, 651–664. [Google Scholar] [CrossRef]
- Starzmann, J.; Casey, M.M.; Mayer, J.F.; Sieverding, F. Wetness loss prediction for a low pressure steam turbine using computational fluid dynamics. Proc. Inst. Mech. Eng. Part J. Power Energy 2014, 228, 216–231. [Google Scholar] [CrossRef]
- Roumeliotis, I.; Mathioudakis, K. Analysis of moisture condensation during air expansion in turbines. Int. J. Refrig. 2006, 29, 1092–1099. [Google Scholar] [CrossRef]
- Menze, M.; Schoedel, M.; Seume, J.R. Numerical investigation of a radial turbine with variable nozzle geometry for fuel cell systems in automotive applications. In Proceedings of the 14th European Conference on Turbomachinery Fluid Dynamics and Thermodynamics, European Turbomachinery Society, Online, 12–16 April 2021. [Google Scholar] [CrossRef]


Publisher’s Note: MDPI stays neutral with regard to jurisdictional claims in published maps and institutional affiliations. |
© 2022 by the authors. Licensee MDPI, Basel, Switzerland. This article is an open access article distributed under the terms and conditions of the Creative Commons Attribution (CC BY) license (https://creativecommons.org/licenses/by/4.0/).