Article

Weak Fault Feature Extraction of Axle Box Bearing Based on Pre-Identification and Singular Value Decomposition

1
School of Traffic and Transportation, Shijiazhuang Tiedao University, Shijiazhuang 050043, China
2
State Key Laboratory of Mechanical Behavior and System Safety of Traffic Engineering Structures, Shijiazhuang Tiedao University, Shijiazhuang 050043, China
*
Author to whom correspondence should be addressed.
Machines 2022, 10(12), 1213; https://doi.org/10.3390/machines10121213
Submission received: 12 November 2022 / Revised: 2 December 2022 / Accepted: 12 December 2022 / Published: 14 December 2022
(This article belongs to the Section Vehicle Engineering)

Abstract

:
The axle box bearing is one of the core rotating components in high-speed trains, having served in complex working conditions for a long time. With the fault feature extraction of the vibration signal, the noise interference caused by the interaction between the wheels and rails becomes apparent. Especially when there is a shortwave defect in the rail, the interaction between wheels and rails will produce high-amplitude impulse interference. To solve the problem of the collected vibration signals of axle box bearings containing strong noise interference and high amplitude impact interference caused by rail shortwave irregularities, this paper proposes a method based on pre-identification via singular value decomposition technology to select the signals in sections and filter the noise, followed by feature extraction and fault diagnosis. The method is used to analyze the axle box bearing fault simulation signal and the weak fault signal collected by the railway bearing comprehensive experimental platform, and these signals are then compared with the random screening signal and the manual screening signal to verify the effectiveness of the method.

1. Introduction

The axle box bearing is one of the core rotating parts of a high-speed train [1,2]. It plays the role of support for the wheel’s rotation and bears the combined load of a series of suspension and wheel pairs [3,4]. Axle box bearing performance affects the dynamic performance of the entire system of a high speed train Once the axle box bearing is in bad condition, its failure can have serious consequences, such as burning shaft or train derailment or overturning, which can cause casualties and make maintenance difficult, causing huge economic losses [5,6]. Therefore, the study of the state of monitoring methods and fault diagnosis technology of the axle box bearing is helpful to make a more reasonable maintenance plan, which can improve the safety and reliability of high-speed train operation, avoid major accidents, and reduce economic losses [7,8,9,10].
Usually, the amount of data collected by the vibration acceleration sensor is relatively large. When researchers get the signal collected by the vibration acceleration sensor, they usually select 1 s or 2 s data from the initial position of data collection, or first observe the time domain signal with the naked eye, focus on the vibration form and amplitude of the signal, and then manually select 1 s or 2 s data of the collected data for analysis. Feature extraction and fault diagnosis of bearing are carried out. For the fault diagnosis of ordinary rolling bearings, this selection method may have little impact on the final results, but for axle box bearings, when high-speed trains are running on rails with shortwave defects, the data collected may include not only the fault impulse signal of bearings, but also the high amplitude random impulse signal caused by the shortwave defects. The vibration noise and environmental noise of axle box bearing are also collected by the sensor. How to extract the fault features of bearings from the data with strong noise interference has always been a difficult problem in the field of fault diagnosis [11,12,13,14]. For the problem of strong noise interference, [15] proposed a weighted combined envelope spectrum based on spectral coherence. A new double cross-correlation algorithm for noise reduction was proposed by [16]. Strong noise and other irrelevant interference will usually submerge the fault characteristics of axle box bearings, which is particularly serious in the time domain. The fault characteristics of axle box bearings can be easily extracted in the frequency domain through the method of resonance demodulation. An adaptive boundary determination method based on time delay peak (TDK) was proposed by [17]. The adaptive Kurtogram (AK) method, which optimized the method of boundary division in the frequency domain was proposed by [18]. However, the above methods also have shortcomings of low accuracy. For this reason, ref. [19] proposed a variational mode decomposition method based on parameter optimization, and [20] proposed an adaptive bearing fault diagnosis method based on envelope spectrum kurtosis optimization. When the amplitude caused by railway shortwave defects is very high, it accounts for a large proportion of signal energy, which has a serious impact on the fault feature extraction of axle box bearings [21,22,23]. If the above data selection method is used for analysis and identification, the final results of fault feature extraction and fault diagnosis will not be ideal.
The vibration amplitude of the axle box bearing changes with the change of speed, showing a monotonous increasing trend. Moreover, the axle box bearing has a strong impulse at low speeds and strong cyclostationarity at high speeds [24,25,26]. Based on the above analysis, in order to reduce the influence of high amplitude impulse interference caused by railway shortwave defects on fault feature extraction of axle box bearings, fault feature extraction ability of algorithm must be improved [27,28]. In this paper, a method of weak fault feature extraction of axle box bearings based on pre-identification via singular value decomposition (SVD) is proposed. The process of pre-identification via singular value decomposition is shown in Figure 1. First, segment the signal by seconds, calculate the kurtosis value of each segment of the signal, arrange the signal segments according to the kurtosis value from large to small, and screen the signal segment with the smallest kurtosis value. Then, construct a Hankel matrix, use the singular value decomposition algorithm to select the maximum component of the singular value difference spectrum for noise reduction, and calculate the envelope spectrum of the noise reduction signal to diagnose the bearing fault.
The organizational structure of the rest of this paper is as follows. Section 2 introduces the pre-identifying singular value decomposition method. Section 3 shows the simulation analysis and experimental validation. Section 4 is the discussion part. Conclusions are drawn in Section 5.

2. Pre-Identifying Singular Value Decomposition Method

2.1. Failure Characteristic Frequency of Axle Box Bearings

Generally, the vibration attenuation signal caused by the fault of axle box bearings can be constructed by a mathematical description. Generally, the fault signal of the bearing is simulated by the combination of an exponential function and sine function, that is, the vibration attenuation signal. When a rolling bearing fails, its fault diagnosis is mostly based on the bearing parameters and speed information, and then the fault characteristic frequency is calculated by a mathematical formula, such as Formula (1). Then, the advanced signal processing technology is used to filter the noise and extract the characteristics. Finally, the results containing frequency domain information are analyzed and diagnosed by comparing the fault characteristic frequency calculated by the mathematical formula [29].
{ Rotation   frequency   f a = v b / 60 Fault   frequency   of   inner   f i = 1 2 z ( 1 + d D cos α ) f a Fault   frequency   of   outer   f o = 1 2 z ( 1 d D cos α ) f a Fault   frequency   of   roller   f b = 1 2 ( 1 d 2 D 2 cos 2 α ) D d f a
In the formula, v b represents the rotational speed of the bearing, D is the diameter of the bearing, d is the rolling diameter, z is the number of rolling bodies, α is the contact angle, and fa represents the rotation.
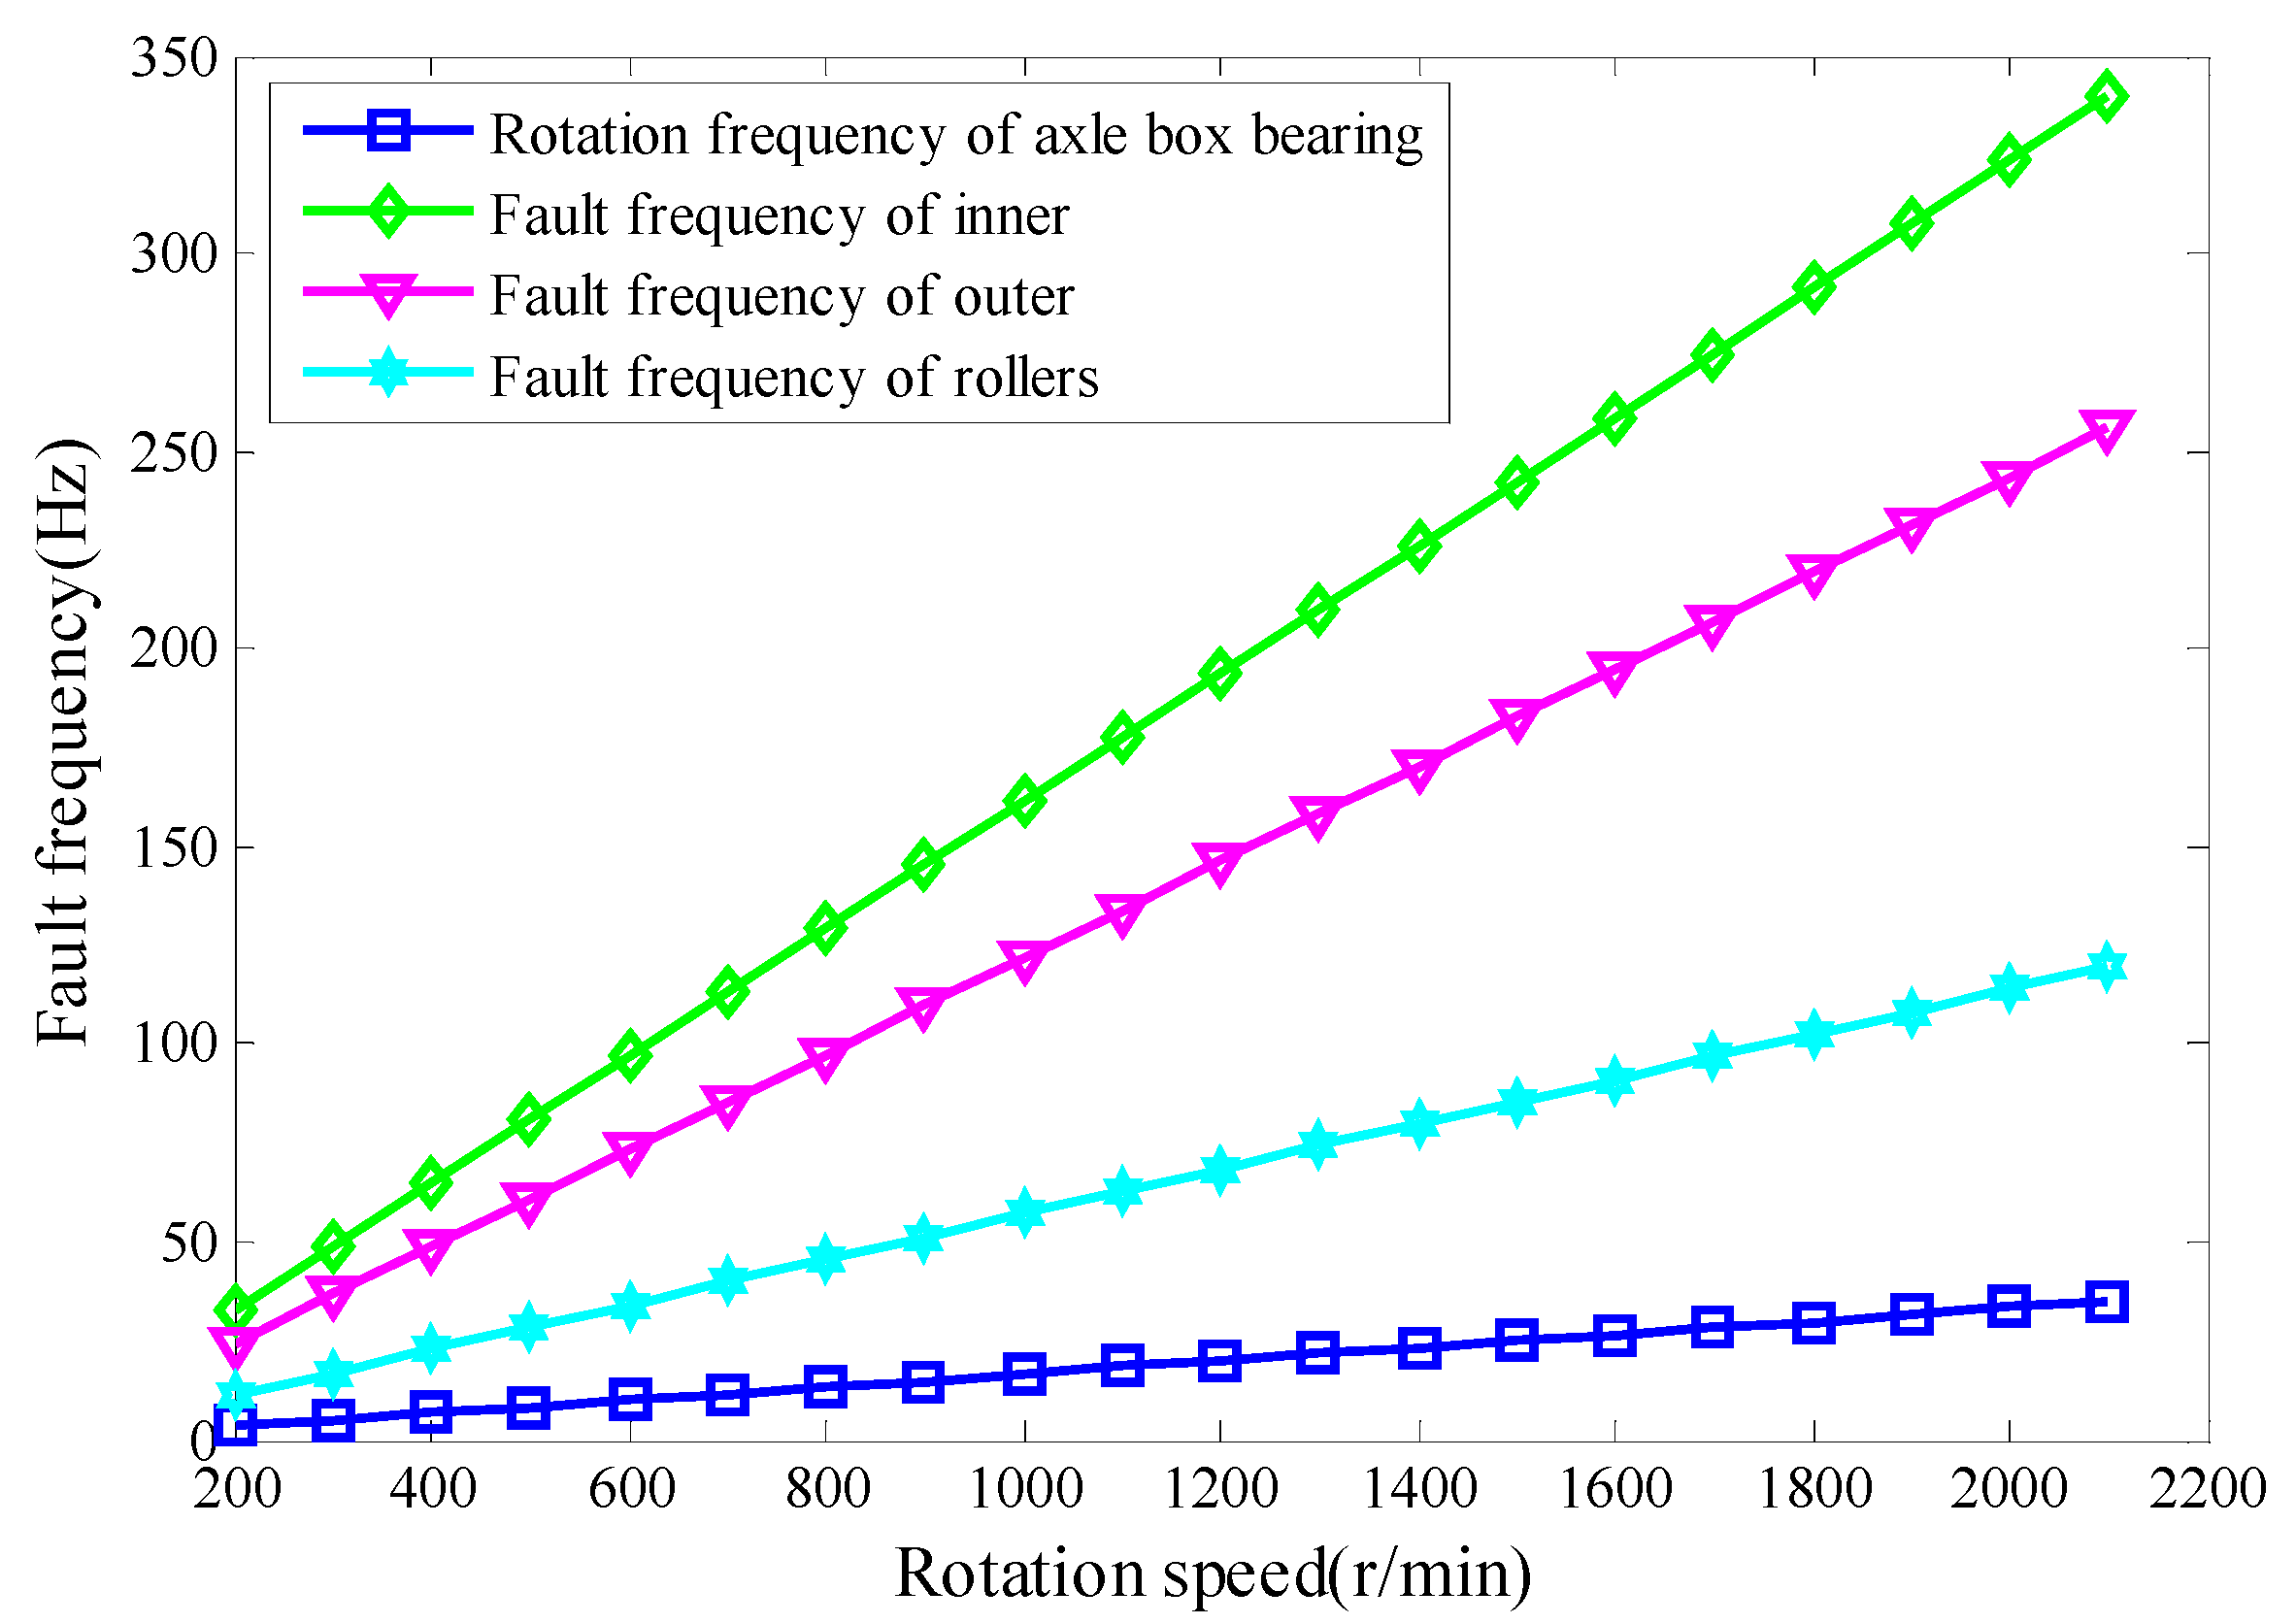
At present, the axle box bearings used by different types of high-speed trains are also different. The axle box bearings in service are basically SKF bearings from Sweden, FAG bearings from Germany, and NSK and NTN bearings from Japan. This section mainly analyzes and introduces the axle box bearing of Germany’s FAG; the model is F-80 781 109 TAROL, and the specific bearing parameters are an outer diameter of 240 mm, an inner diameter of 130 mm, a pitch diameter of 185 mm, a roller diameter of 26.5 mm, 17 rollers, and a 10 degree pressure angle. As shown in Figure 2, the single fault of the axle box bearing includes outer ring fault, inner ring fault, and rolling element fault. Through the known bearing parameter information and the above Formula (1), the characteristic frequency of axle box bearing fault at different speed levels can be calculated. As shown in Figure 3, all single fault characteristic frequencies increase monotonously with the increase of speed.
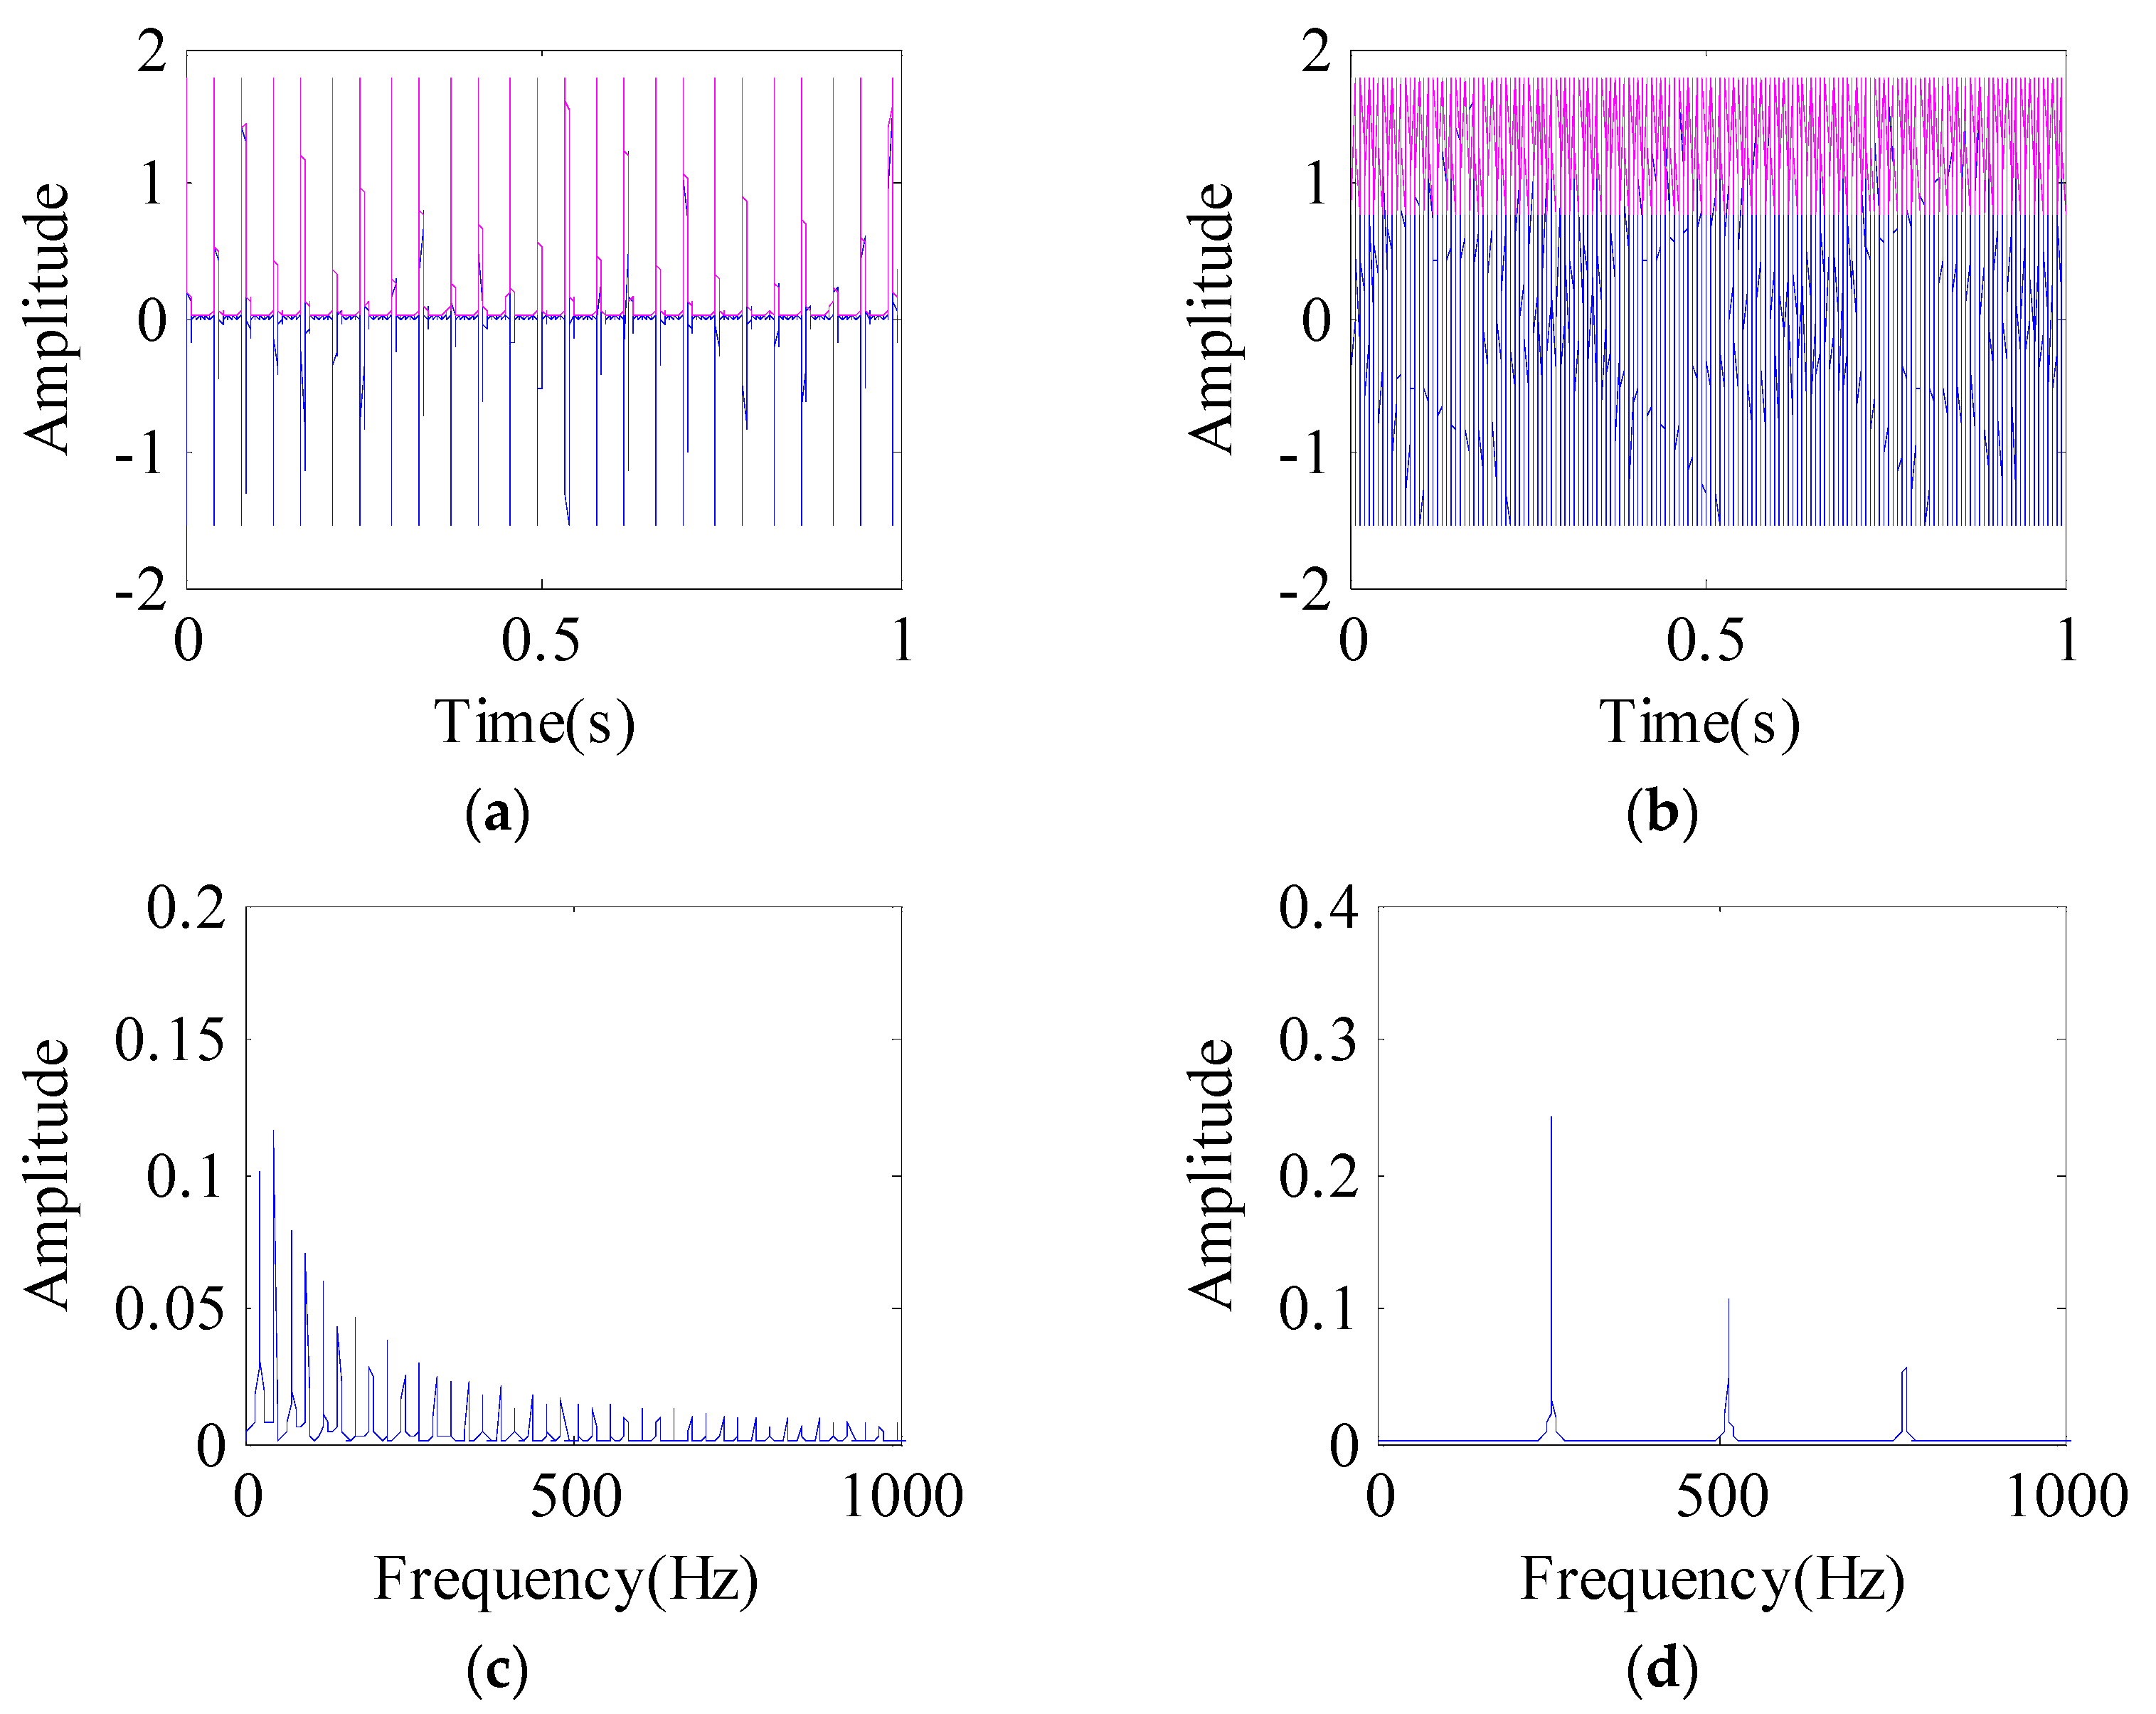
The axle box bearing fault characteristic frequency is calculated as above, and the impulse oscillation failure signal is obtained by the product of an exponential function and a sinusoidal function, such as Equation (2). With two speed levels, respectively, the outer ring fault characteristic frequency at 200 r/min is 24.3 Hz, and the outer ring fault characteristic frequency at 2100 r/min is 255.5 Hz, as shown in Figure 4.
x ( t ) = k A k e λ t sin [ ( 2 π f 0 ) ( t i T τ k ) ] ,
In the formula, x ( t ) indicates the impulse fault signal, f 0 indicates the natural frequency of the bearing, λ represents the damping of the system, T represents the fault period, and τ k represents the random sliding of the rolling body.
Due to the random sliding of the rolling element, the performance of the bearing fault impact signal in the time domain is not strictly a periodic signal, with periodic time-varying characteristics, non-stationary characteristics, and a cyclostationary signal. Therefore, after the bearing fault occurs, the performance in the time domain has impact and cyclostationarity. Through the above calculation formula of bearing fault characteristic frequency, combined with the simulation in Figure 4 generated by the bearing parameter information of Schaeffler (FAG), it can be found that when the bearing is rotating at low speed, the impact is stronger in the time domain; that is, the impact signal generated is sparse, as shown in Figure 4a, and the spectral line signal in the envelope spectrum is dense, as shown in Figure 4c. When the bearing is in high-speed rotating motion, the cyclostationarity is stronger in the time domain, and the impact signal is denser, as shown in Figure 4b. The spectral lines in the envelope spectrum are sparse, as shown in Figure 4d.

2.2. Singular Value Decomposition Theory

Singular value decomposition is a matrix decomposition method in linear algebra, which is widely used in signal processing and fault diagnosis. This method has an early origin [30]. The industry recognized its origin in 1873 and 1874. At first, it was the singular value decomposition of the real square matrix. Later, through development, it extended the singular value decomposition to the complex square matrix, and then further extended the singular value decomposition to the general complex matrix. The definition of singular value decomposition is that for a real matrix X R m × k , there must be orthogonal matrix U R m × m and orthogonal matrices V R k × k , so that the following formula holds:
X = U Σ V T ,
where U R m × m and V R k × k are left and right singular vector matrices of the matrix. Σ = [ diag ( σ 1 , σ 2 , , σ p ) ] R m × n is a diagonal matrix, where p = min ( m , n ) and diagonal elements are singular values of matrix X , satisfying σ 1 σ 2 σ p 0 . By using singular values and left and right singular vectors, the matrix X can be expressed as follows:
X m = σ 1 μ 1 ν 1 + σ 2 μ 2 ν 2 + + σ m μ m ν m ,
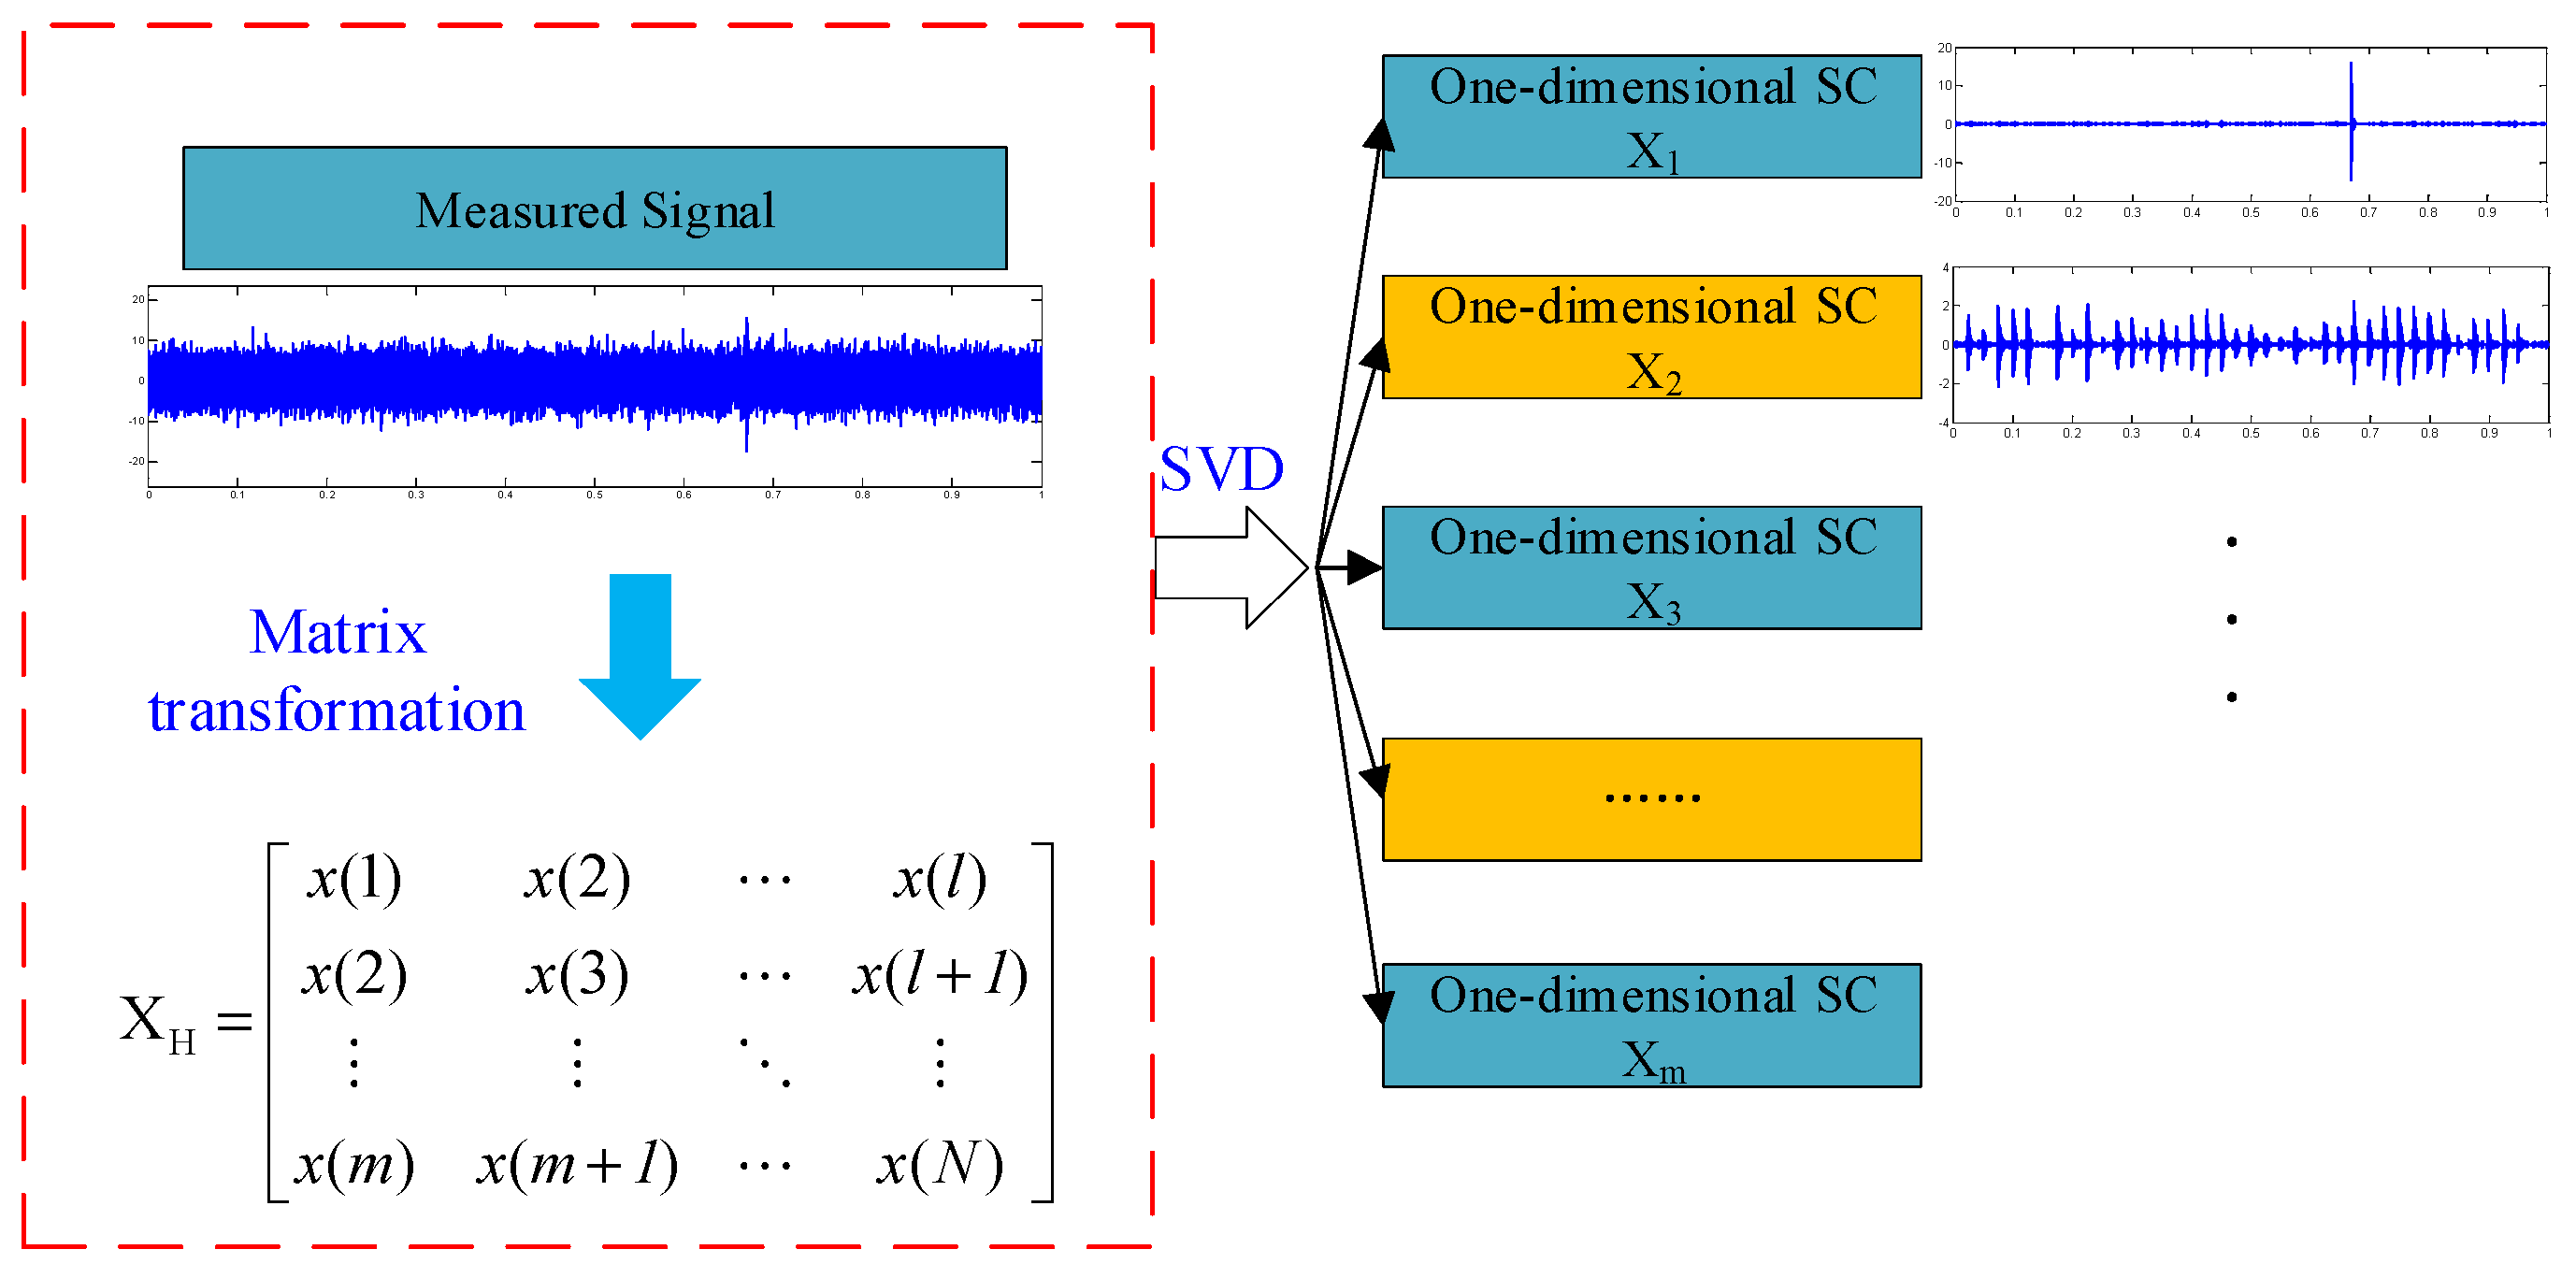
The specific process of singular value decomposition is shown in Figure 5. For one-dimensional vibration signal X = [ x 1 , x 2 , x N ] , the one-dimensional vibration signal must be converted into a matrix before singular value decomposition can be carried out [31,32]. At present, there are two ways to transform the matrix. The first is to construct a Hankel matrix, as shown in Figure 5, where m is the embedded dimension of the matrix, and m + l 1 = N . The other is to construct the matrix by periodic truncation. As shown in Formula (5), t is the truncation period, and k t N .
X = [ x ( 1 ) x ( t + 1 ) x ( ( k 1 ) t + 1 ) x ( 2 ) x ( t + 2 ) x ( ( k 1 ) t + 2 ) x ( t ) x ( 2 t ) x ( k t ) ] ,
Using periodic truncation to construct the matrix will result in an error accumulation, which will increase with the number of columns of the matrix, that is, the number of cycles, so it will affect the final diagnosis result. Singular value decomposition is carried out by constructing Hankel matrix. Although the periodic vibration and noise in the vibration signal can be well separated, according to the signal characteristics of the axle box bearing, this method has the following problems.
During the service process of axle box bearing, the operating conditions are complex, and the vibration signal does not contain strong noise interference. When the track has shortwave defects and the train runs at high speeds, a large impulse will be formed between the wheel and rail, which is reflected in the time domain signal as a high amplitude impulse interference with large energy. At this time, the effective rank screening based on Hankel matrix cannot effectively identify the impulse interference and the impulse caused by bearing fault, which will affect the final diagnosis results. Based on this, this study proposes a method based on pre-identifying singular value decomposition to filter the high amplitude impulse caused by rail shortwave irregularity in the time domain signal.

2.3. Pre-Identification of Singular Value Decomposition

Generally, the amount of data collected by the vibration acceleration sensor is relatively large. When researchers get the signal collected by the vibration acceleration sensor, they usually select 1 s or 2 s data from the initial position of data collection, or first observe the time domain signal with the naked eye, focus on the vibration form and amplitude of the signal, and then manually select 1 s or 2 s data of the collected data for analysis. Feature extraction and fault diagnosis of bearing are carried out. For the fault diagnosis of ordinary rolling bearings, this selection method may have little impact on the final results, but, for axle box bearings, when high-speed trains are running on rails with shortwave defects, the data collected may include not only the fault impulse signal of the bearings, but also the high amplitude random impulse signal caused by shortwave defects. The vibration noise and the environmental noise is also collected by the sensor. If the above data selection method is used for analysis and identification, the final result of singular value decomposition will still contain high amplitude impulse, affecting the final diagnosis effect.
Kurtosis index is a dimensionless statistical index, which is an effective way to describe the peak shape of the waveform in the vibration signal [33,34]. It is sensitive to the impulse signal generated by the fault of rotating parts, so it is used by many scholars as the evaluation index for early fault diagnosis of bearing surface damage. However, with the increase of axle box bearing speeds, the repetitive transient impulse generated by bearing faults becomes more and more intensive in the time domain, and the cyclostationarity of vibration signal becomes stronger and stronger [35]. At this time, the kurtosis index is not sensitive to the cyclostationarity signal, but when there is a high amplitude impulse caused by rail shortwave defects in the signal, the kurtosis index is very sensitive to this single or a few high amplitude transient impulses; showing very good performance, kurtosis values are usually large. The calculation formula is as follows:
K = E ( x μ ) 4 σ 4 ,
where μ is the mean value of signal x , and σ is the standard deviation of signal x .
According to Figure 3, the rotation frequency of the axle box bearing at each speed and the formula for generating the simulation signal of the axle box bearing in Equation (2), the kurtosis value of the simulation signal of the axle box bearing outer ring at different speeds is calculated, as shown in the following Table 1:
According to the characteristics of the above kurtosis index and the kurtosis value calculated from the bearing simulation signal, the kurtosis value characterizing the bearing impulse characteristics becomes smaller and smaller with the increase in speed, which is just opposite to the increasing trend of the wheel rail impulse amplitude caused by the rail shortwave defects, and the kurtosis index is extremely sensitive to such high amplitude impulse. Therefore, when the axle box bearing is running at a high speed, as long as the kurtosis value is minimum, it can not only find the signal segment representing the cyclostationarity of bearing fault impulse, but also avoid the interference of high amplitude impulse.
Therefore, according to the running speed of the bearing, when the speed is greater than 900 r/min, it is determined that the signal has a stronger cyclostationarity. This paper proposes a method to pre-identify the signal segment with kurtosis index in the time domain and select the minimum kurtosis value signal segment, so that the high amplitude impulse caused by rail shortwave defects can be automatically discharged, and then the signal segment where it is located will not be used as the data analysis signal to find the signal segment representing the bearing cyclostationarity. This can also solve the problem that the singular value decomposition method based on Hankel matrix cannot effectively identify the high amplitude impulse interference and the impulse caused by the bearing fault, when screening the effective ranks.
The pseudo-code for pre-identification is shown in Algorithm 1.
Algorithm 1 Pre-identification
Inputs: X-input data
1: Segment X in seconds Xi (i = 1, 2, 3, … t)
2: For i = 1 to t do
3:   Ki←kurtosis (Xi)
4: end for
5: Sort Ki from small to large
6: if the bearing speed ≥900 r/min
7:   return the signal segment with the smallest kurtosis value
8: else
9:   return the signal segment with the kurtosis value in the middle
10: end if
Output: Xi
The specific algorithm is as follows:
First, segment the collected signal by seconds, then calculate the kurtosis value of each segment signal, and arrange the kurtosis value from small to large. When the bearing speed is greater than or equal to 900 r/min, the signal with strong cyclostationarity is selected as the signal segment with the smallest kurtosis value. When the bearing speed is less than 900 r/min, the signal with a strong impulse is selected as the signal segment with the kurtosis value in the middle.
Then, a Hankel matrix is constructed for the selected signal segment, and singular value decomposition is performed. The parity of the embedding dimension is determined, as the signal segment length N is (N + 1)/2 or N/2. The effective rank is selected according to the location of the maximum value of the singular value difference spectrum. If the singular value sequence is { σ 1 , σ 2 , , σ i } , and its corresponding difference sequence is C = σ i σ i + 1 , then the new sequence composed of { C } is the singular value difference spectrum.
Finally, the envelope spectrum of the new noise reduction signal is calculated, and its fault diagnosis is carried out in the envelope spectrum.

3. Simulation Analysis and Experimental Validation

3.1. Simulation Analysis Based on the Formula

To verify the effectiveness of the algorithm, first construct a simulation signal through Formula (7), as shown in Figure 6. This includes repetitive transient impulse caused by bearing failure, high amplitude impulse interference caused by rail short wave defects, and Gaussian white noise.
{ x ( t ) = k A k e λ t sin [ ( 2 π f 0 ) ( t i T τ k ) ] δ 1 ( t ) = 16.8 ( e 480 t sin ( 2 π × 7900 t ) ) δ 2 ( t ) = 26.8 ( e 480 t sin ( 2 π × 7900 t ) ) δ 3 ( t ) = 29.8 ( e 480 t sin ( 2 π × 7900 t ) ) y ( t ) = x ( t ) + δ 1 ( t ) + δ 2 ( t ) + δ 3 ( t ) + n ( t ) ,
where x ( t ) represents the impulse fault signal, δ ( t ) represents a single high amplitude impulse, and n ( t ) represents Gaussian white noise. Set the sampling frequency to 25,600 Hz, the sampling time to 10 s, and the attenuation rate λ to 550. The bearing fault characteristic frequency is 50 Hz, and the simulation signal is as shown in the figure below, where τ k is the random sliding of the rolling element set at 2% of the fault cycle. A k is the amplitude of bearing fault impulse, which is set as random distribution, with a range of 1.32~1.72. n ( t ) is Gaussian white noise, and the signal-to-noise ratio is −10 dB.
Envelope demodulation is one of the most commonly used methods for fault diagnosis. First, envelope demodulation analysis is carried out on the 10 s clock data collected, as shown in Figure 7. From the envelope spectrum, it can be seen that near the fault characteristic frequency, the spectral line is wrapped by other interference frequencies, and the octave spectral line is not very clear. The envelope spectrum is seriously interfered with by noise and high amplitude impulse.
Then, a Hankel matrix is constructed by using the 10 s full signal segment, and noise is reduced by singular value decomposition. The noise reduction signal is shown in Figure 8. Although the amplitude has decreased, the impulses of three high amplitude signals are more obvious. Then, the envelope spectrum of the noise reduction signal is solved, as shown in Figure 9. Although fault characteristic frequency and the first three order octaves can be found in the envelope spectrum, the clutter interference is still very serious. In addition, the Hankel matrix is constructed with a full signal for singular value decomposition, which is inefficient. The model of the central processing unit used is Intel (R) Core (TM) [email protected] GHz, with a memory capacity of 16 G. The operating system is Windows 10, and the calculation software is MATLAB 2014a. In such a configuration environment, run for 2488.74 s before calculating the results.
In general, the amount of data obtained by the vibration acceleration sensor is large, and the whole signal segment is analyzed and processed with low efficiency. When experts and scholars get the data, a small part of them will randomly select 1–2 s of data for fault diagnosis. Most scholars will conduct visual identification, and then manually select a segment of data for analysis and processing to determine whether the bearing is faulty. Next, select a segment of signal at random, as shown in Figure 9 and Figure 10. If the data segment containing large amplitude impulse interference caused by rail shortwave disease is selected, the diagnosis result will be seriously affected, and the fault characteristic frequency can hardly be found in the envelope spectrum. The diagnosis is invalid. Then, identify the time domain signal with the naked eye, and select a new number segment from which seems is ideal for analysis, as shown in Figure 11 and Figure 12. The noise reduction signal can observe the impulse characteristics caused by the bearing fault in the time domain. In the envelope spectrum, you can clearly find the 1st, 2nd, 3rd, 5th, 6th, and 7th octaves of the fault frequency, but the 4th octave is not obvious, as shown in the red dotted box position in Figure 13. In addition, there is an interference frequency with high amplitude between the 3rd and 4th order octaves.
The proposed algorithm is used to diagnose the generated simulation signal. First, the kurtosis value of the segmented signal is determined, as shown in Table 2. It can be concluded that the kurtosis value is the lowest at the sixth second. Therefore, the signal segment at the sixth second is selected for further processing and analysis, as shown in Figure 14. From the time domain, it can be seen that there is no high amplitude impulse interference caused by rail shortwave defects in this signal segment. By constructing the Hankel matrix, the embedded dimension selects 1/2 of the signal length, and uses singular value decomposition to reduce noise. The effective rank is based on the location of the maximum value of the singular value difference spectrum. The noise reduction signal is shown in Figure 15. The envelope spectrum of the noise reduction signal is calculated. It can be found in the envelope spectrum that the first eight octaves of the bearing fault frequency are clearly visible, as shown in Figure 16.
To sum up, this algorithm combines the fault impulse characteristics of the axle box bearing itself, takes into account the large wheel–rail impulse interference and strong background noise interference caused by rail shortwave defects in the operating conditions, and proposes pre-identification via singular value decomposition noise reduction processing, which is simple and effective for the high amplitude impulse caused by rail shortwave defects or other large amplitude abnormal data in the time domain. Compared with using the whole signal segment to construct a Hankel matrix for singular value decomposition noise reduction, this method has higher efficiency and better noise reduction effect, and is more stable and reliable than the random selection signal or manual selection signal.

3.2. Data Validation Based on the Railway Bearing Comprehensive Test Bench

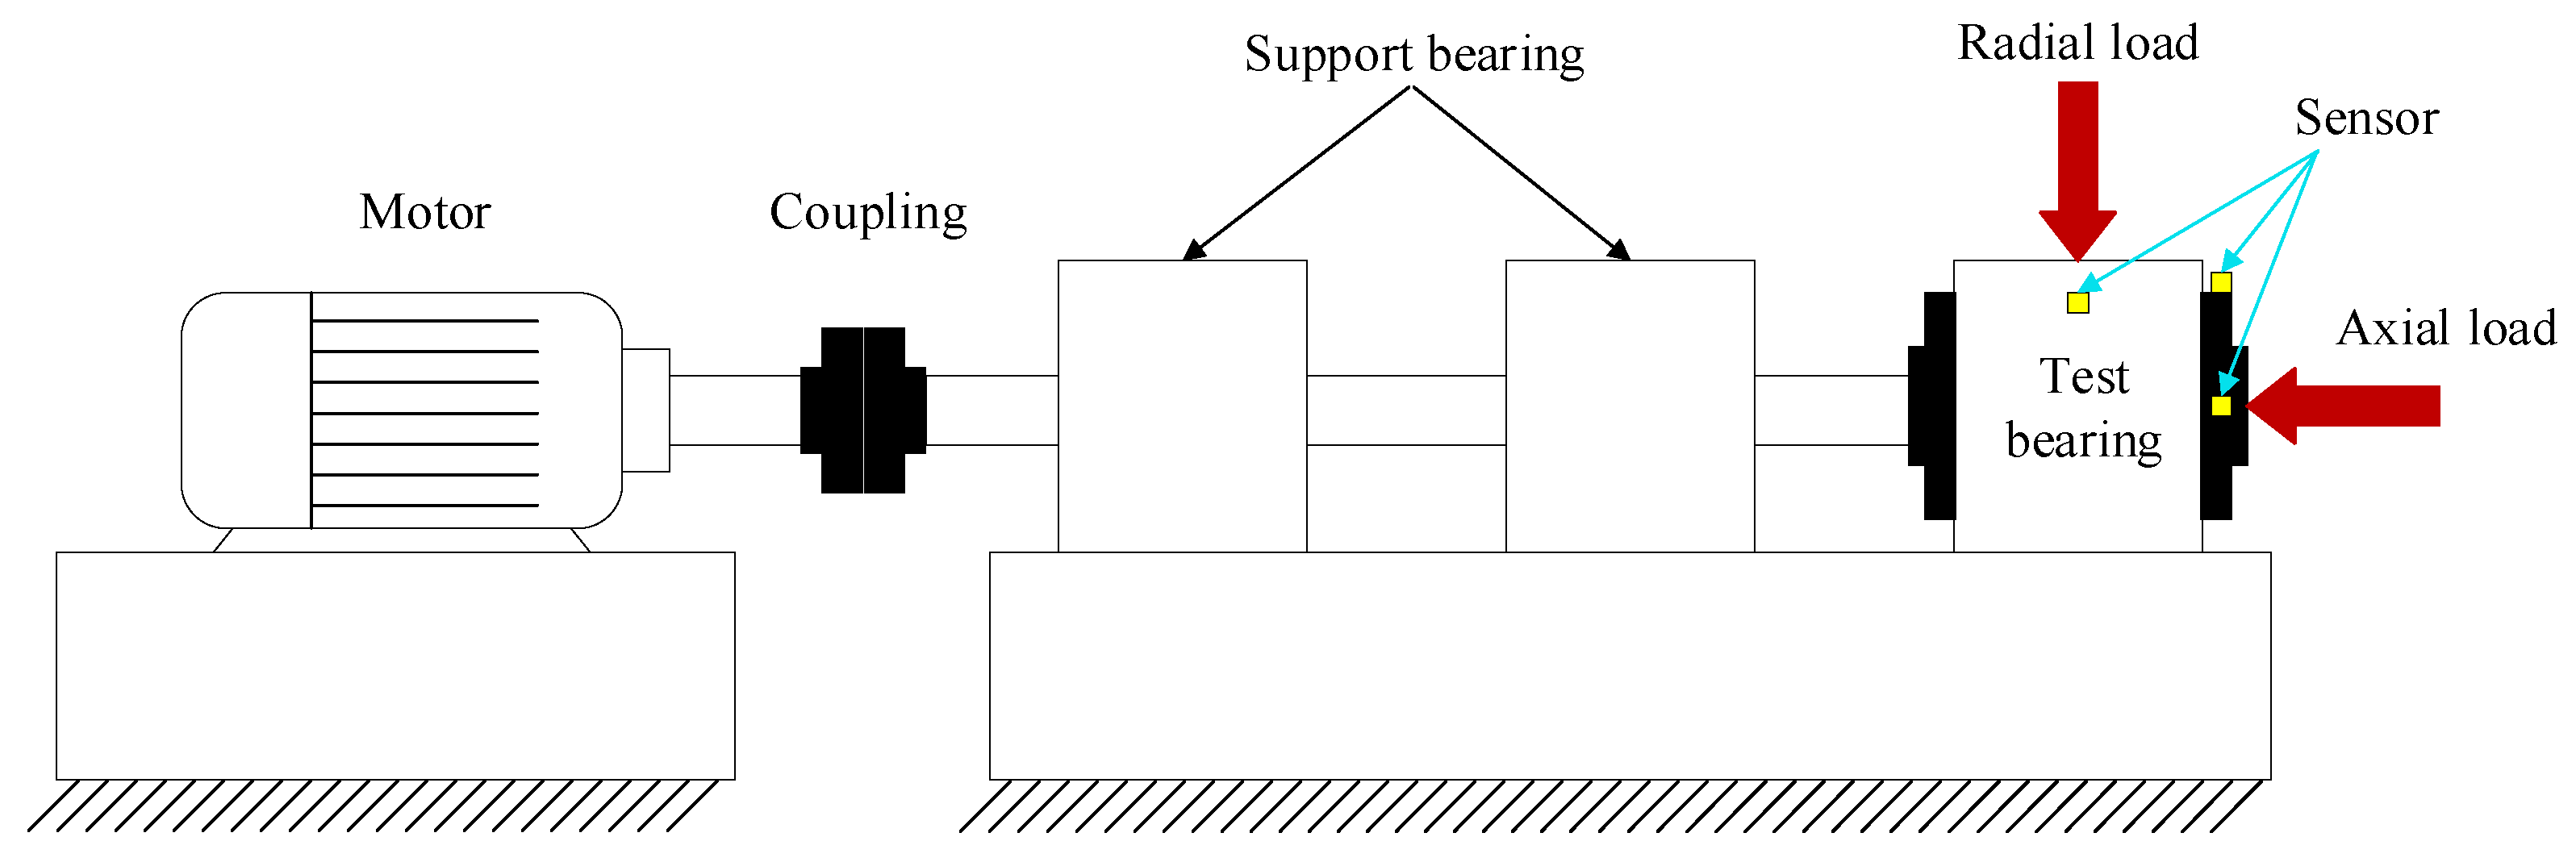
The above verified the simulation signal. Generally, the simulation signal is more ideal than the experimental signal. In order to further verify the effectiveness of the proposed method, this paper selects the railway bearing comprehensive experimental platform for experimental verification. The specific structure of the railway bearing comprehensive test bed is shown in Figure 17. The servo motor is connected with the optical shaft through a coupling. There are two support bearings and a test bearing on the optical shaft. The vertical and axial test bearings have two actuators to simulate the load conditions of the axle box bearing during actual operation. The driving mode of the test bed is motor driving, and the maximum running speed can reach 500 km/h, which is equivalent to a shaft speed of 3000 r/min. During the running process, vertical and axial loads can be carried out through manual adjustment mode, pre-compiled load spectrum mode, or road spectrum input mode. The maximum vertical load under high-speed operation is 10 t, and the maximum axial load is 4 t.
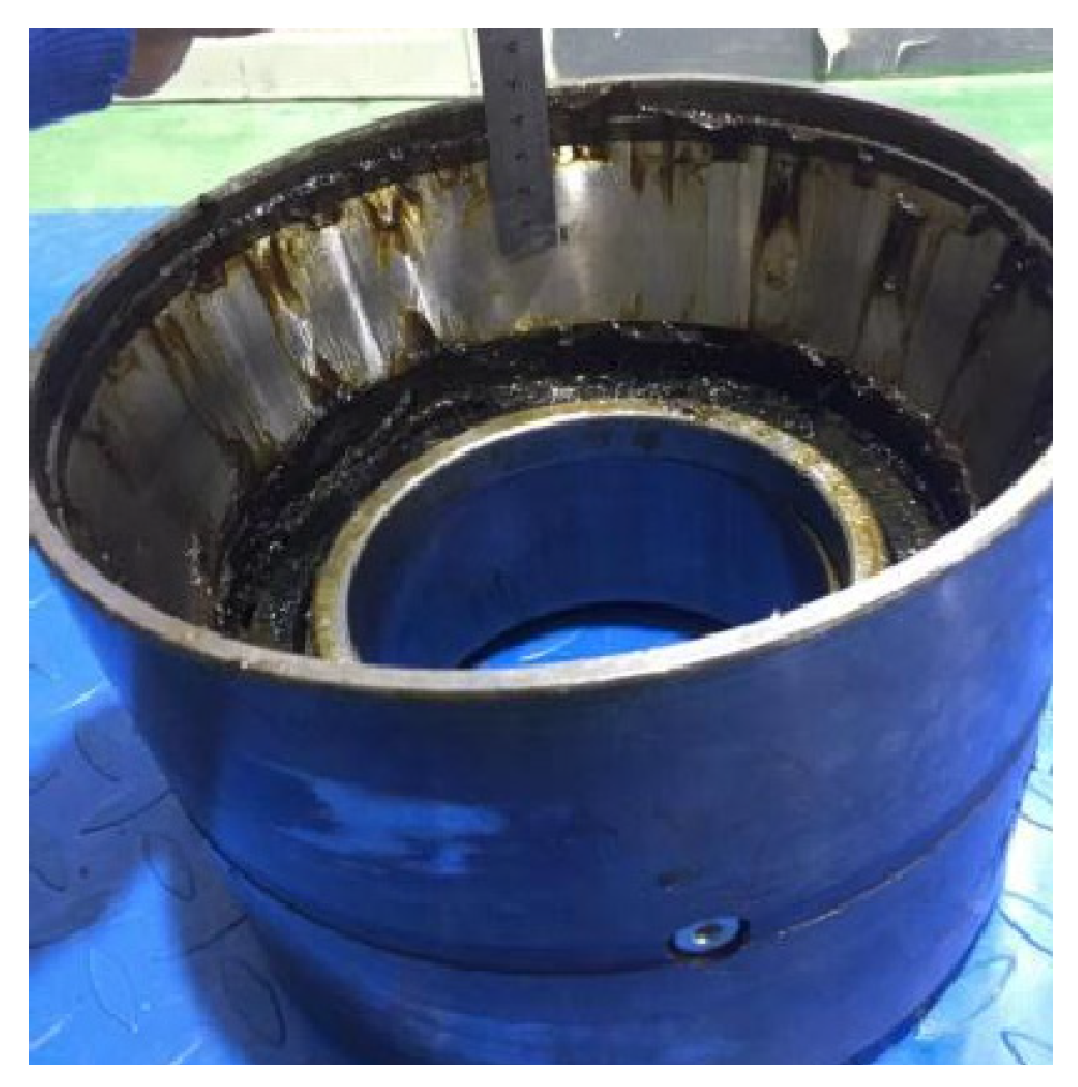
The tested axle box bearing is FAG F-80781109 from Germany, and it comes from a real service bearing. After 2.4 million kilometers of operation, the outer ring of the axle box bearing was artificially processed by electric spark technology, and a fault area of 5 mm long, 1 mm wide, and 0.7 mm deep was machined. As shown in Figure 18, this fault area is classified as a weak fault according to the classification proposed in this paper. The sampling frequency of the acquisition equipment is set to 51,200 Hz; the sampling time is 60 s; the rotational speed of the test condition is set to 1200 r/min, 1500 r/min, 1800 r/min, and2100 r/min; and the loading mode is set to three modes: no load, fixed load, and dynamic load. The fixed load applies 8.5 t vertically, 5 t axially; the variable load applies 8 t vertically, 4 t axially, and the load frequency is 0.2–20 Hz.
By selecting one of the above experimental conditions, namely 1800 r/min rotating speed and no-load experimental conditions, the performance of the pre-identification via singular value decomposition algorithm is verified. The time domain diagram of the collected vibration signal is shown in Figure 19. According to the bearing fault frequency calculated at the above different speeds, in view of the disadvantage of full signal section comparison in the above simulation signals, the experimental signals are mainly compared with the random selection and the manual visual selection.
First, a segment of signals for comparison is selected in a random way, and the signal segment randomly selected by the computer is located at the position of 15 s. It can be seen from the time domain of the signal that the amplitude of this segment of signal fluctuates greatly, as shown in Figure 20, which will inevitably affect the fault diagnosis of the bearing. Through the construction of the Hankel matrix and the singular value decomposition noise reduction processing, although the amplitude of the vibration signal after noise reduction is reduced, as shown in Figure 21, it is difficult to find the fault characteristic frequency of the bearing in the envelope spectrum, as shown in Figure 22.
Next, through visual observation of the vibration form of the signal, a segment of the signal is manually selected for comparison. In the visual identification of the full signal segment, the amplitude fluctuation of the 55 s data position signal is relatively gentle, which conforms to the relatively good signal observed by the naked eye. The time domain waveform is shown in Figure 23. After the singular value decomposition noise reduction processing, as shown in Figure 24, the envelope spectrum is calculated. As shown in Figure 25, the amplitude of the fundamental frequency of the fault characteristic frequency in the envelope spectrum is low. It is interfered with by an unrelated frequency with high amplitude, and the second harmonic generation is relatively clear.
Finally, the proposed method is used to screen the signal segment to be analyzed. As shown in Figure 26, the amplitude of the time domain vibration waveform is relatively stable. The Hankel matrix is constructed, and singular value decomposition is performed for noise reduction. The noise reduction signal is reconstructed by the inverse diagonal average method. As shown in Figure 27, the vibration amplitude is reduced by about one time, and envelope spectrum analysis is performed on it. As shown in Figure 28, although there are interference frequencies near the fault frequency, the first three times of the fault characteristic frequency can be clearly found.

4. Discussion

The proposed method in this paper provides an idea for data selection and filtering noise reduction for axle box bearing fault diagnosis, and has a good effect in most cases, but it still fails to collect vibration signals under some extreme conditions. For example, when the train runs on a section of track with intensive shortwave defects, the high amplitude impulse of the collected vibration signals will become intensive. This may lead to a failure to select high-quality signal segments after the pre-identification signal, and subsequent diagnosis is still difficult.

5. Conclusions

In the process of high-speed train operation, when there are shortwave defects on the track, it will cause a large amplitude wheel–rail impulse in the collected vibration signal, which will interfere with the fault diagnosis. In this study, a pre-identifying singular value decomposition algorithm is proposed. According to the characteristics of time domain signals that are cyclostationary and strong during the high-speed operation of axle box bearings, a method is proposed to use the kurtosis index to be sensitive to a single impulse. The signal is segmented by seconds, and the kurtosis index of each signal segment is calculated separately. Then, the kurtosis index is arranged in order from small to large, and the signal segment corresponding to the minimum kurtosis value is selected. Then a Hankel matrix is constructed, and the Hankel matrix is denoised by singular value decomposition. Finally, the denoised Hankel matrix is reconstructed according to the inverse diagonal average method.
This method can successfully avoid the high amplitude impulse interference in the vibration signal, and avoid the tedious process of identifying and filtering the vibration signal through prior knowledge in the post-processing process. In addition, this method carries out pre-identification in the time domain, replacing the shortcomings of manual selection of signal segments, and can select signal segments that can better characterize the bearing’s cyclostationarity, which is simple and easy to implement. Especially when the bearing has a weak fault and the fault characteristics are submerged, the signal segment excluding high amplitude impulse is screened out, which is more conducive to fault feature extraction of bearings.

Author Contributions

Conceptualization, L.Z. and S.Y.; methodology, L.Z.; software, Y.L.; validation, L.Z., S.Y. and Y.L.; investigation, L.Z.; data curation, Y.L.; writing—original draft preparation, L.Z.; writing—review and editing, S.Y. and Y.L.; visualization, S.Y.; supervision, S.Y. All authors have read and agreed to the published version of the manuscript.

Funding

The present work is supported by the National Key R&D Program (2020YFB2007700), National Natural Science Foundation of China (Nos. 11790282; 12032017; 12002221 and 11872256), S&T Program of Hebei (20310803D) and Natural Science Foundation of Hebei Province (No A2020210028).

Data Availability Statement

Research data are not shared.

Conflicts of Interest

The authors declare no conflict of interest.

References

  1. Papaelias, M.; Amini, A.; Huang, Z.; Vallely, P.; Dias, D.C.; Kerkyras, S. Online condition monitoring of rolling stock wheels and axle bearings. Proc. Inst. Mech. Eng. Part F J. Rail Rapid Transit 2016, 230, 709–723. [Google Scholar] [CrossRef]
  2. Ding, J. Fault detection of a wheelset bearing in a high-speed train using the shock-response convolutional sparse-coding technique. Measurement 2018, 117, 108–124. [Google Scholar] [CrossRef]
  3. Deng, F.; Qiang, Y.; Yang, S.; Hao, R.; Liu, Y. Sparse representation of parametric dictionary based on fault impact matching for wheelset bearing fault diagnosis. ISA Trans. 2021, 110, 368–378. [Google Scholar] [CrossRef] [PubMed]
  4. Zheng, Z.; Song, D.; Xu, X.; Lei, L. A Fault Diagnosis Method of Bogie Axle Box Bearing Based on Spectrum Whitening Demodulation. Sensors 2020, 20, 7155. [Google Scholar] [CrossRef] [PubMed]
  5. Liu, Z.; Yang, S.; Liu, Y.; Lin, J.; Gu, X. Adaptive correlated Kurtogram and its applications in wheelset-bearing system fault diagnosis. Mech. Syst. Sig. Process. 2021, 154, 107511. [Google Scholar] [CrossRef]
  6. Liu, Z.; Peng, D.; Zuo, M.J.; Xia, J.; Qin, Y. Improved Hilbert-Huang transform with soft sifting stopping criterion and its application to fault diagnosis of wheelset bearings. ISA Trans. 2022, 125, 426–444. [Google Scholar] [CrossRef] [PubMed]
  7. Li, Y.; Song, H.; Miao, B.; Zhang, W.; Xiong, Q. Improved multiscale weighted-dispersion entropy and its application in fault diagnosis of train bearing. Meas. Sci. Technol. 2021, 32, 075002. [Google Scholar] [CrossRef]
  8. Gu, X.; Yang, S.; Liu, Y.; Hao, R.; Liu, Z. Multi-sparsity-based blind deconvolution and its application to wheelset bearing fault detection. Measurement 2022, 199, 111449. [Google Scholar] [CrossRef]
  9. Ding, J.; Zhao, W.; Miao, B.; Lin, J. Adaptive sparse representation based on circular-structure dictionary learning and its application in wheelset-bearing fault detection. Mech. Syst. Sig. Process. 2018, 111, 399–422. [Google Scholar] [CrossRef]
  10. Chen, H.; Jiang, B.; Ding, S.X.; Huang, B. Data-Driven Fault Diagnosis for Traction Systems in High-Speed Trains: A Survey, Challenges, and Perspectives. IEEE Trans. Intell. Transp. Syst. 2022, 23, 1700–1716. [Google Scholar] [CrossRef]
  11. Entezami, M.; Roberts, C.; Weston, P.; Stewart, E.; Amini, A.; Papaelias, M. Perspectives on railway axle bearing condition monitoring. Proc. Inst. Mech. Eng. Part F J. Rail Rapid Transit 2020, 234, 17–31. [Google Scholar] [CrossRef]
  12. Zhang, Q.; Ding, J.; Zhao, W. An Adaptive Demodulation Band Segmentation Method to Optimize Spectral Boundary and Its Application for Wheelset-Bearing Fault Detection. IEEE Trans. Instrum. Meas. 2022, 71, 1–10. [Google Scholar] [CrossRef]
  13. Yi, C.; Li, Y.; Huo, X.; Tsui, K.-L. A promising new tool for fault diagnosis of railway wheelset bearings: SSO-based Kurtogram. ISA Trans. 2022, 128, 498–512. [Google Scholar] [CrossRef] [PubMed]
  14. Wang, S.; Selesnick, I.; Cai, G.; Feng, Y.; Sui, X.; Chen, X. Nonconvex Sparse Regularization and Convex Optimization for Bearing Fault Diagnosis. IEEE Trans. Ind. Electron. 2018, 65, 7332–7342. [Google Scholar] [CrossRef]
  15. Chen, B.; Song, D.; Zhang, W.; Cheng, Y. A novel spectral coherence-based envelope spectrum for railway axle-box bearing damage identification. Struct. Health Monit. 2022. [Google Scholar] [CrossRef]
  16. Li, Y.; Liang, X.; Chen, Y.; Chen, Z.; Lin, J. Wheelset bearing fault detection using morphological signal and image analysis. Struct. Control Health Monit. 2020, 27, e2619. [Google Scholar] [CrossRef]
  17. Zhang, Q.; Ding, J.; Zhao, W. An adaptive boundary determination method for empirical wavelet transform and its application in wheelset-bearing fault detection in high-speed trains. Measurement 2021, 171, 108746. [Google Scholar] [CrossRef]
  18. Xu, Y.; Zhang, K.; Ma, C.; Cui, L.; Tian, W. Adaptive Kurtogram and its applications in rolling bearing fault diagnosis. Mech. Syst. Sig. Process. 2019, 130, 87–107. [Google Scholar] [CrossRef]
  19. Jin, Z.; He, D.; Wei, Z. Intelligent fault diagnosis of train axle box bearing based on parameter optimization VMD and improved DBN. Eng. Appl. Artif. Intell. 2022, 110, 104713. [Google Scholar] [CrossRef]
  20. He, L.; Yi, C.; Zhou, Q.; Lin, J.-H. Fast Convolutional Sparse Dictionary Learning Based on LocOMP and Its Application to Bearing Fault Detection. IEEE Trans. Instrum. Meas. 2022, 71, 1–12. [Google Scholar] [CrossRef]
  21. Xing, Z.; Yi, C.; Lin, J.; Zhou, Q. Multi-component fault diagnosis of wheelset-bearing using shift-invariant impulsive dictionary matching pursuit and sparrow search algorithm. Measurement 2021, 178, 109375. [Google Scholar] [CrossRef]
  22. Lei, Y.; Yang, B.; Jiang, X.; Jia, F.; Li, N.; Nandi, A.K. Applications of machine learning to machine fault diagnosis: A review and roadmap. Mech. Syst. Sig. Process. 2020, 138, 106587. [Google Scholar] [CrossRef]
  23. Xin, G.; Li, Z.; Jia, L.; Zhong, Q.; Dong, H.; Hamzaoui, N.; Antoni, J. Fault Diagnosis of Wheelset Bearings in High-Speed Trains Using Logarithmic Short-Time Fourier Transform and Modified Self-Calibrated Residual Network. IEEE Trans. Ind. Inf. 2022, 18, 7285–7295. [Google Scholar] [CrossRef]
  24. Wang, X.; Lu, Z.; Wei, J.; Zhang, Y. Fault Diagnosis for Rail Vehicle Axle-Box Bearings Based on Energy Feature Reconstruction and Composite Multiscale Permutation Entropy. Entropy 2019, 21, 865. [Google Scholar] [CrossRef] [Green Version]
  25. Sun, R.; Yang, J.; Yao, D.; Wang, J. A New Method of Wheelset Bearing Fault Diagnosis. Entropy 2022, 24, 1381. [Google Scholar] [CrossRef]
  26. Peng, D.; Liu, Z.; Wang, H.; Qin, Y.; Jia, L. A Novel Deeper One-Dimensional CNN With Residual Learning for Fault Diagnosis of Wheelset Bearings in High-Speed Trains. IEEE Access 2019, 7, 10278–10293. [Google Scholar] [CrossRef]
  27. Lin, R.; Liu, Z.; Jin, Y. Instantaneous frequency estimation for wheelset bearings weak fault signals using second-order synchrosqueezing S-transform with optimally weighted sliding window. ISA Trans. 2021, 115, 218–233. [Google Scholar] [CrossRef] [PubMed]
  28. Huang, C.; Lin, J.; Ding, J.; Huang, Y. A Novel Wheelset Bearing Fault Diagnosis Method Integrated CEEMDAN, Periodic Segment Matrix, and SVD. Shock Vib. 2018, 2018, 1382726. [Google Scholar] [CrossRef]
  29. Huang, D.; Yang, J.; Zhou, D.; Litak, G. Novel Adaptive Search Method for Bearing Fault Frequency Using Stochastic Resonance Quantified by Amplitude-Domain Index. IEEE Trans. Instrum. Meas. 2020, 69, 109–121. [Google Scholar] [CrossRef]
  30. Jiang, H.; Chen, J.; Dong, G.; Liu, T.; Chen, G. Study on Hankel matrix-based SVD and its application in rolling element bearing fault diagnosis. Mech. Syst. Sig. Process. 2015, 52–53, 338–359. [Google Scholar] [CrossRef]
  31. Duan, R.; Liao, Y. Impulsive feature extraction with improved singular spectrum decomposition and sparsity-closing morphological analysis. Mech. Syst. Sig. Process. 2022, 180, 109436. [Google Scholar] [CrossRef]
  32. Cui, L.; Liu, Y.; Zhao, D.; Zhen, D. Egram Based SVD Method for Gear Fault Diagnosis. IEEE Sens. J. 2022, 22, 13188–13200. [Google Scholar] [CrossRef]
  33. Antoni, J.; Randall, R.B. The spectral kurtosis: Application to the vibratory surveillance and diagnostics of rotating machines. Mech. Syst. Sig. Process. 2006, 20, 308–331. [Google Scholar] [CrossRef]
  34. Yu, L.; Antoni, J.; Leclere, Q. Spectral matrix completion by Cyclic Projection and application to sound source reconstruction from non-synchronous measurements. J. Sound Vib. 2016, 372, 31–49. [Google Scholar] [CrossRef]
  35. Buzzoni, M.; Antoni, J.; D’Elia, G. Blind deconvolution based on cyclostationarity maximization and its application to fault identification. J. Sound Vib. 2018, 432, 569–601. [Google Scholar] [CrossRef]
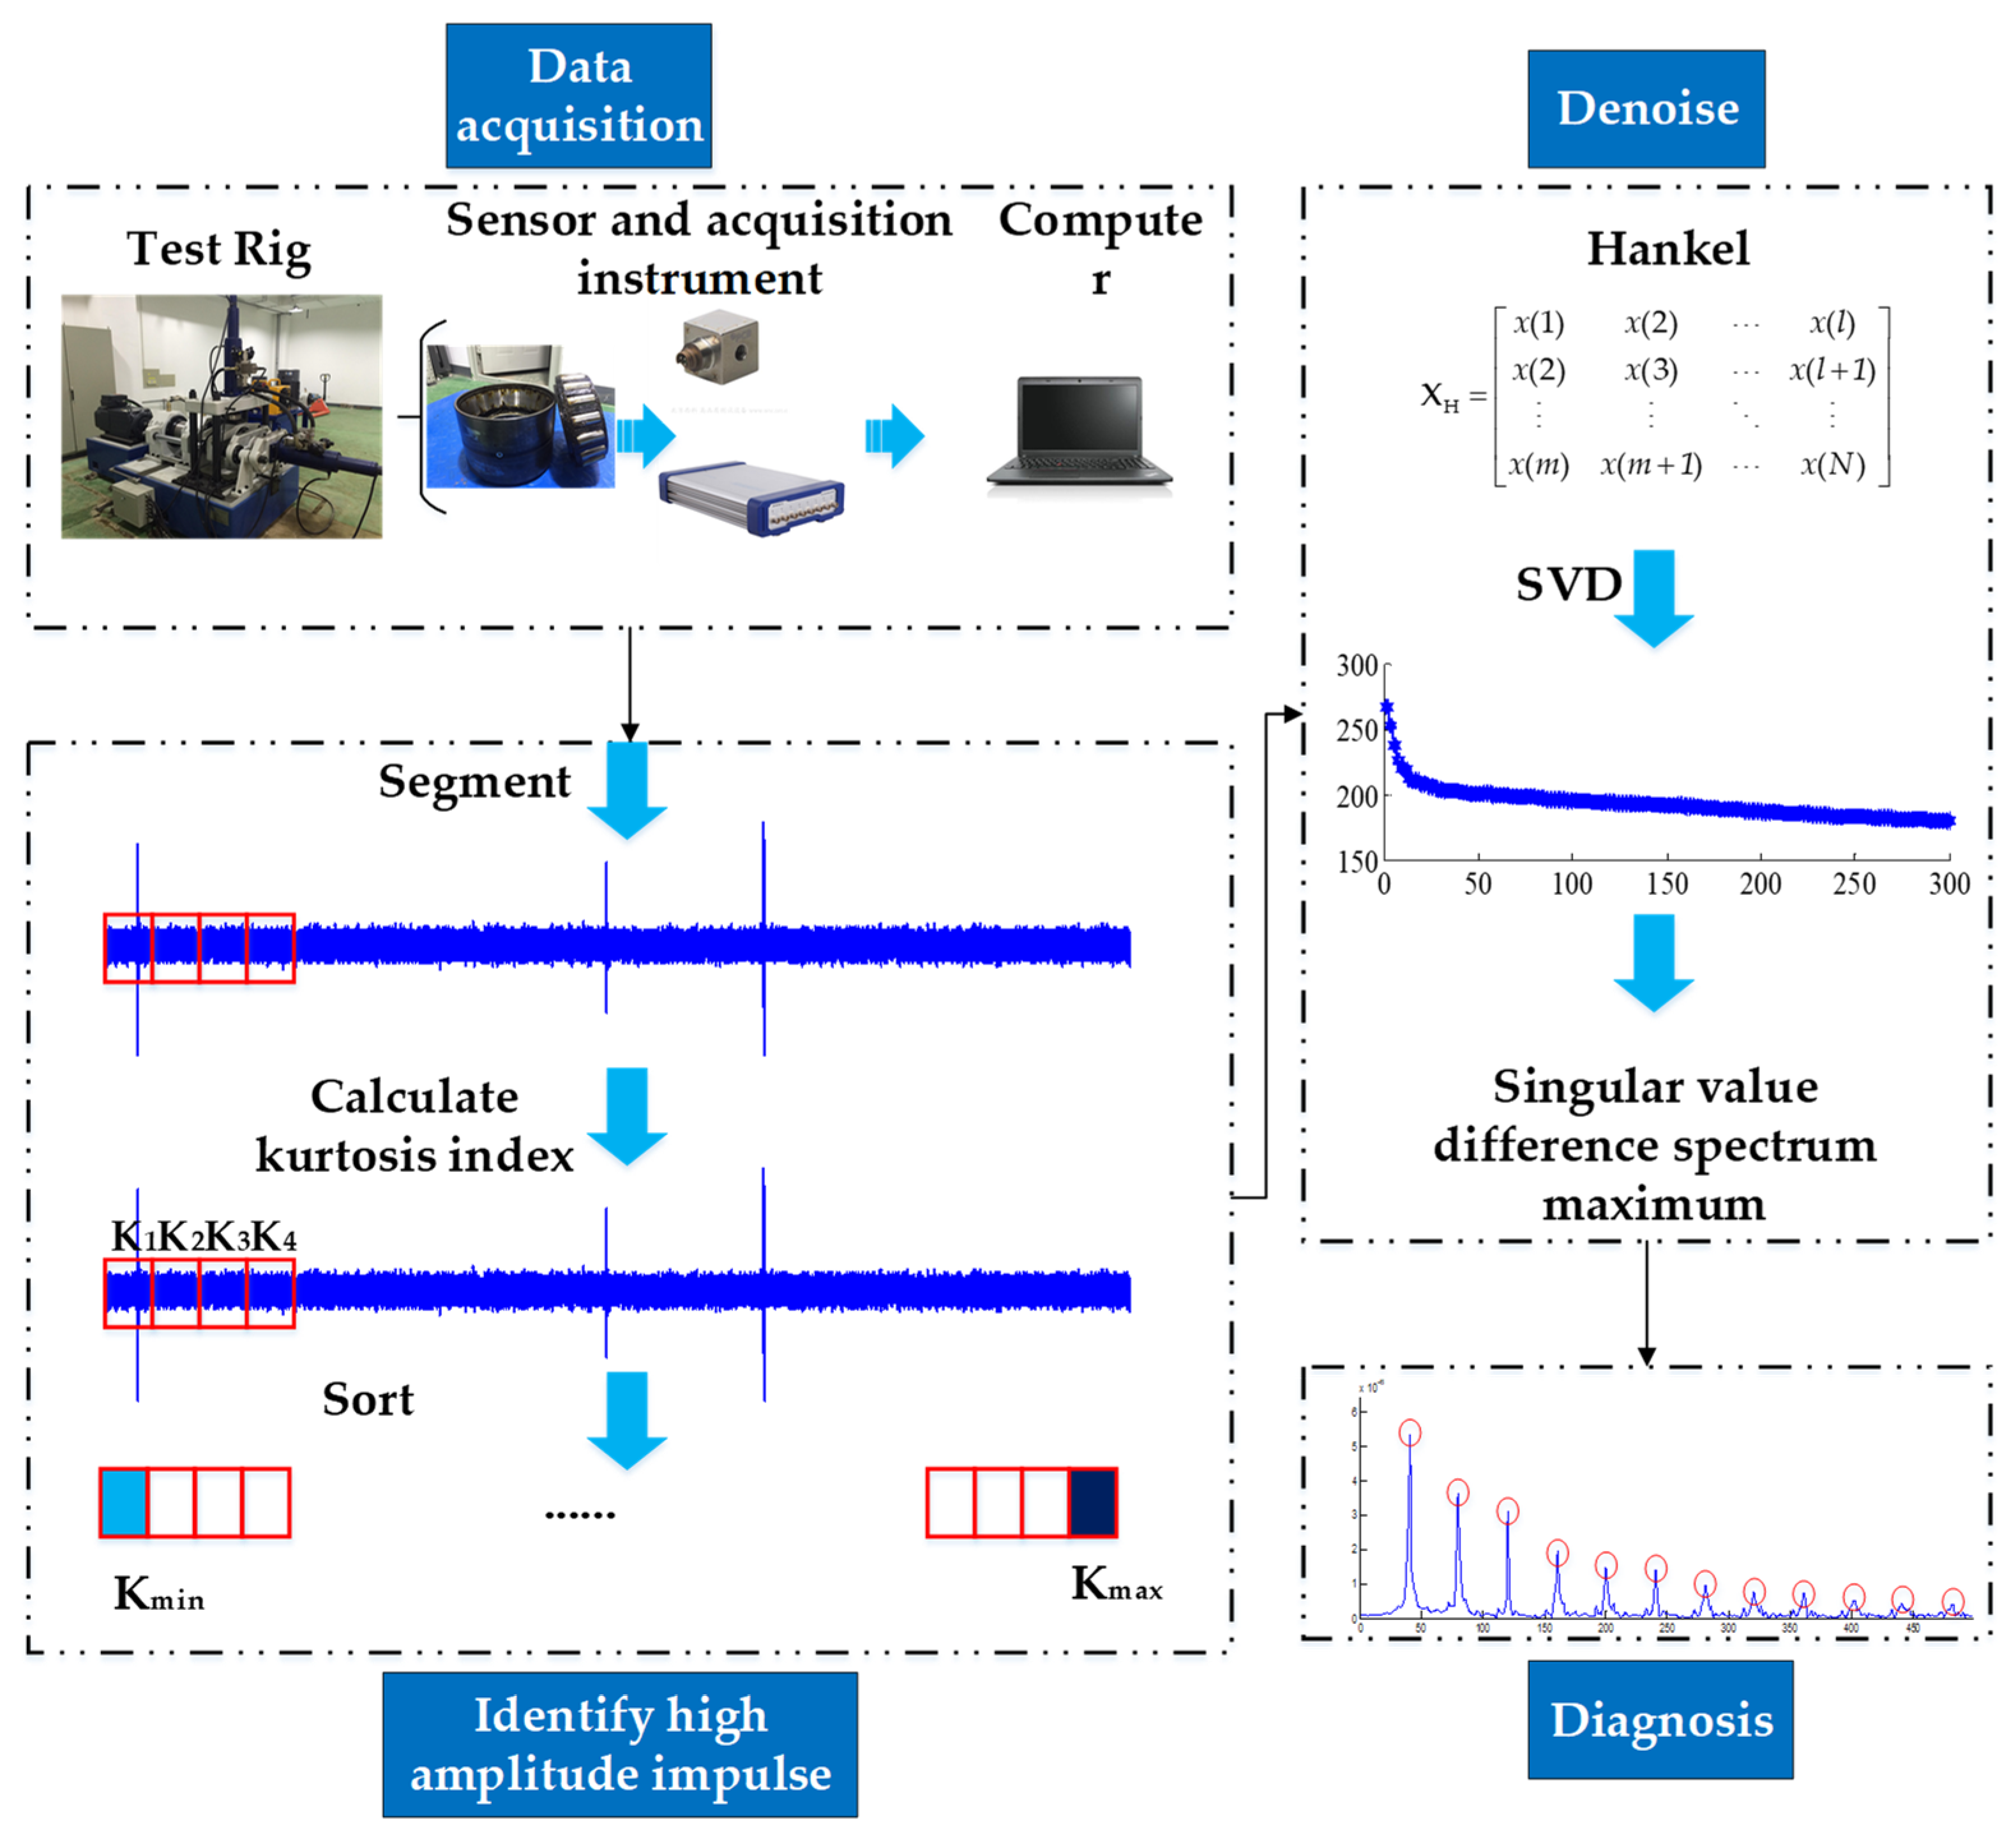
Figure 1. A flow chart of the algorithm for pre-identifying singular value decomposition.
Machines 10 01213 g001
Figure 2. Schematic diagram of axle box bearing: (a) schematic diagram of normal Bearing; (b) schematic diagram of outer ring fault bearing; (c) schematic diagram of inner ring fault bearing; (d) schematic diagram of roller fault bearing.
Machines 10 01213 g002
Figure 3. Failure characteristic frequency of axle box bearings at different rotational speeds.
Machines 10 01213 g003
Figure 4. Fault characteristic frequency of axle box bearing at different speeds: (a) time domain diagram of outer ring fault characteristic frequency of 24.3 Hz; (b) time domain diagram of outer ring fault characteristic frequency of 255.5 Hz; (c) envelope spectrum of outer ring fault characteristic frequency of 24.3 Hz; (d) envelope spectrum of outer ring fault characteristic frequency of 255.5 Hz.
Machines 10 01213 g004
Figure 5. Schematic diagram of the singular value decomposition process.
Machines 10 01213 g005
Figure 6. Simulation signal: (a) outer circle fault signal; (b) high-amplitude impulse interference caused by rail shortwave defects; (c) synthetic signal.
Machines 10 01213 g006
Figure 7. The envelope spectra of the simulated signals.
Machines 10 01213 g007
Figure 8. Singular value decomposition for noise reduction of Hankel matrix constructed by full signal.
Machines 10 01213 g008
Figure 9. Singular value decomposition of Hankel matrix constructed by full signal to reduce the envelope spectrum of noise signals.
Machines 10 01213 g009
Figure 10. Signal segment with random value at 7 s to construct singular value decomposition noise reduction signal of Hankel matrix.
Machines 10 01213 g010
Figure 11. Signal segment with random value at 7 s to construct singular value decomposition of Hankel matrix to reduce envelope spectrum of noise signal.
Machines 10 01213 g011
Figure 12. Manual selection of the signal segment of 2 s to construct the singular value decomposition and noise reduction signal of the Hankel matrix.
Machines 10 01213 g012
Figure 13. Manual selection of the signal segment at 2 s to construct the envelope spectrum of the noise reduction signal of the Hankel matrix.
Machines 10 01213 g013
Figure 14. Time domain diagram of the selected signal segments of this algorithm.
Machines 10 01213 g014
Figure 15. Noise reduction diagram of the signal segments selected by this algorithm.
Machines 10 01213 g015
Figure 16. Noise-reducing envelope spectrum diagram of the signal segments selected by this algorithm.
Machines 10 01213 g016
Figure 17. Schematic diagram of railway bearing comprehensive experimental bench.
Machines 10 01213 g017
Figure 18. Weak fault morphology and the dimension of the outer ring of the axle box bearing.
Machines 10 01213 g018
Figure 19. Time domain vibration signal of axle box bearing.
Machines 10 01213 g019
Figure 20. Time domain map of the randomly selected signal segment.
Machines 10 01213 g020
Figure 21. Noise reduction diagram of the randomly selected signal segment.
Machines 10 01213 g021
Figure 22. The envelope spectrum map of the randomly selected signal segments.
Machines 10 01213 g022
Figure 23. Time domain diagram of the manually selected signal segment.
Machines 10 01213 g023
Figure 24. Noise reduction diagram of the manually selected signal segment.
Machines 10 01213 g024
Figure 25. Noise-reducing envelope spectrum diagram of the manually selected signal segments.
Machines 10 01213 g025
Figure 26. Time domain diagram of the signal segment selected by the algorithm in this paper.
Machines 10 01213 g026
Figure 27. Noise reduction diagram of the signal segment selected by the algorithm in this paper.
Machines 10 01213 g027
Figure 28. The noise reduction envelope spectrum of the signal segment selected by the algorithm in this paper.
Machines 10 01213 g028
Table 1. Bearing simulation signal cliff at different speeds.
Speed/(r/min)2003006009001200150018002100
Kurtosis21.82414.5457.2764.8873.7223.0522.6422.322
Table 2. The kurtosis values of segment signals.
Position/(s)12345678910
Kurtosis36.623.0313.0233.03210.7112.94847.082.9812.9992.991
Publisher’s Note: MDPI stays neutral with regard to jurisdictional claims in published maps and institutional affiliations.