Abstract
Electrode material used in wire electric discharge machining (WEDM/wire EDM) plays a vital role in determining the machined component quality. In particular, when machining hard materials like nickel titanium/NiTi (NiTiNOL) shape memory alloy, the quality of electrode material is important as it may have adverse effects on the surface properties of the alloy. Different electrode materials give different performances, as each electrode material is made up of different conductivity, compositions and tensile strength. Therefore, detailed experimental studies have been carried out to understand the effect of diffusion annealed coated wires (X-type and A-type) on NiTiNOL SMA during the wire EDM process. The tool wear rate and surface roughness responses have been studied for both the electrode materials against different wire EDM variables such as pulse time, pause time, wire feed and spark gap set voltage. The impact of these process parameters on the stated output responses has been analyzed and further surface and subsurface analysis of the machined component has been carried out to understand the impact of diffusion annealed electrode materials during the wire EDM process. The investigation reveals that an A-type diffusion annealed coated wire is found to be most suitable in terms of tool wear rate, surface roughness and surface integrity during machining of NiTiNOL shape memory alloy compared to X-type and traditional brass-based electrode materials. Surface topographical properties were studied using confocal microscopic analysis and scanning electron microscope (SEM) with energy-dispersive spectroscopy (EDS) analysis. The subsurface analysis like microhardness and recast layer thickness was also studied for both the wires against different machining conditions.
1. Introduction
Nickel titanium/NiTi (NiTiNOL) is the special class of shape memory alloys (SMAs) used for biomedical and surgical applications. Biocompatibility is the crucial factor for the usage of NiTiNOL SMAs in the human body [1]. Some of the biomedical applications of NiTiNOL include orthodontic wires, braces, mandible fracture plates, spinal implants, vertebrae discs, etc. [2,3]. As NiTiNOL SMAs are used for biomedical applications, conventional machining such as milling, drilling, turning, etc., cause various problems such as formation of work-hardened layer, frequent tool breakage, burr formation, etc., as the NiTiNOL SMA is a hard and difficult to cut alloy and is characterized by various other peculiar properties [4,5]. Biomedical implants or surgical tools consist of intricate and complex shapes, which are hard to produce using conventional machining processes. Among the different non-conventional machining processes, wire electric discharge machining (WEDM/wire EDM) is found to be the most appropriate and sophisticated process to machine hard and difficult to cut conductive alloys such as NiTiNOL and produce the required intricate shapes for different applications [6,7]. Wire EDM uses a thin wire electrode material to cut the conductive work material or an alloy. The wire electrode is rapidly charged and hence it produces high-intensity sparks to melt the material from the workpiece, which is further flushed away by coolant, preferably deionized water. Along with different process variables in wire EDM such as pulse and pause times, wire feed rate, spark gap set voltage, current, etc., the wire electrode material plays a vital role in the quality of the finished parts. As the sparks are generated from the electrode materials, the type of electrode material used for the operations decides the finish of the machined component. Plain brass (PB) wire and zinc-coated brass wire (ZBW) are the most frequently used wire electrode materials during the wire EDM process and most of the works carried out by researchers during wire EDM of nickel titanium alloys have used either brass or zinc-coated brass wire as electrode material for their experimentation purpose [7,8,9,10].
As copper has high electrical conductivity, it was formerly supposed to be the EDM wire, but the flushability and tensile strength of copper wire electrode were found to be low and therefore, brass wire, which is an alloy of copper and zinc with good flushability, tensile strength and reasonable conductivity, is used as WEDM electrode. Plain brass wire electrode consisting of 65% copper and 35% zinc is categorized under the soft electrode category as its tensile strength is 420 MPa. Few researchers have worked on machining of NiTi SMAs using plain brass wire as electrode material. Liu and Guo [11] used plain brass wire as electrode for machining NiTiNOL SE508 work material and observed that during the machining process both the electrode and workpiece materials were eroded and various compounds such as titanium oxides and titanium carbides were formed due to complex chemical reactions. The top surface of the recast layer was characterized by large depositions of copper (Cu) and zinc (Zn). Elemental diffusion was mainly between electrode and workpiece and there was not much detection of diffusion from dielectric. Many microcracks were also observed on the machined surface. Brass wire of 0.25 mm diameter was used as electrode material in WEDM for machining an equiatomic NiTi SMA by Manjaiah et al. [12]. Much surface oxidation and carbonization were observed over the white layer. The surface hardness of the alloy was more due to the surface oxidation, which is because of disassociation of brass electrodes at higher temperatures. Confocal analysis showed many peaks and valleys, and huge debris on the machined surface was observed through scanning electron microscopic (SEM) analysis. Bisaria and Shandilya [13] used brass wire for WEDM of Ni-rich NiTi SMA and observed that higher pulse time caused higher discharge, resulting in larger material erosion. Huge craters, globules and microcracks were observed in SEM analysis. Compared to lower pulse time, the higher pulse time produced 1.2 times thicker white layer thickness and elements of brass wire such as Cu and Zn were found to be deposited on the machined surface. Soni et al. [14] studied the effects of WEDM process parameters on the machined ternary NiTiCu SMA with PB wire. Surface roughness (SR) increased with increase in pulse time, and as spark gap set voltage (SV) increases, SR was found to decrease. At higher cutting speed, the surface crack density of machined alloy was higher. Brass wire produced poor surface quality at higher pulse time. Kulkarni et al. [15] studied tool wear rate (TWR) of the brass wire electrode during WEDM of NiTiNOL alloy and observed that the wire topography of worn-out electrode showed many craters and crack formations on the surface of the wire electrode at higher TWR. At lower TWR, the craters were less and cracks were insignificant.
If the zinc content in brass electrode is increased, it results in higher cutting speed, but due to the limitations of the cold drawing process, it is difficult to increase the Zn content above 40% and therefore, the half hard wire electrode with just above 440 MPa tensile strength was introduced, which has a coating of Zn over the core brass. Such electrode materials are termed as Zn-coated brass wire electrodes. Few researchers worked on machinability studies of NiTi SMA using ZBW as electrode material during WEDM. Daneshmand et al. [16] investigated WEDM of NiTi60 using ZBW and studied the SR output response. Depth craters with huge debris were observed on the machined alloy through SEM analysis. The SR was increased rapidly at higher pulse time and at the same time the electrode material was found to be worn out. The various deposited elements formed the layer of 10–20 microns on the machined surface and had their effect on change of base properties of smart alloy. Ali Akbar and Saeed [17] studied the effect of WEDM process parameters on NiTiNOL alloy using ZBW as electrode material. The microhardness of the machined surface was found to be increased several times compared to the base materials’ microhardness and different hard oxides and metal oxides were formed. Manjaiah et al. [18] used both brass and zinc-coated brass wire for machining ternary NiTiCu SMA and concluded that SV is the most influential process parameter for minimizing SR, and ZBW electrode was found to be better than plain brass wire electrode in increasing material removal and minimizing SR. Kulkarni et al. [19] used ZBW electrode for machining NiTiNOL and observed that Cu and Zn depositions of electrode material were found to be very high on the machined surface for higher TWR compared to the machined surface of the lower TWR.
Although some research work has been carried out in WEDM of different grades of NiTi SMA using brass wire and ZBW electrode materials, there is plenty of scope to carry out the experiments in WEDM of NiTiNOL SMA using the latest diffusion annealed coated electrode materials. Diffusion annealed coated electrode materials have many advantages over conventional plain brass and ZBW electrode materials. Therefore, in the present experimental studies, WEDM of NiTiNOL SMA has been carried out with two different types of diffusion annealed coated wire electrode materials. The electrodes TWR and machined alloys SR are studied using response surface methodology (RSM). Detailed surface integrity (SI) studies have been carried out using confocal, energy-dispersive spectroscopy (EDS), microhardness and recast layer thickness analysis. Further, the performances of two different diffusion annealed coated wire electrode materials are compared with each other and the performances of diffusion annealed electrodes are compared with the performances of plain brass and ZBW electrode materials to suggest the most feasible wire electrode material to machine medical grade NiTiNOL SMA.
2. Materials and Methods
2.1. Work Material
The medical grade NiTiNOL (Ni with 55.74% and Ti as remainder) shape memory alloy with ASTM F 2063 Standard has been used as work material for the present experimental studies. The work material has been procured from HongKong Hanz Material Technology Co., Ltd., Baoji, China. This material can be used for production of different implant applications such as bone plates, mandible fracture plates, etc.
2.2. Wire Electrode Materials
In many cases, zinc from the ZBW blasts off the surface due to higher spark intensity and zinc coating does not live up to its potential. Therefore, zinc needs to be metallurgically bonded to the core material and have a high melting point. Such heat-treated Zn-coated wires are called diffusion annealed coated wires. Two types of diffusion annealed coated wire electrodes (X-type and A-type) have been used as wire electrode materials in the present experimental studies.
X-type wire (DX) is the first of its kind in diffused annealed wire sections. It is basically called by other names such as Bronco Cut-X or Beta Cut-X and it consists of coating of beta brass (Cu and Zn alloy with Zn % of 40 to 53%) over a pure copper core. It is an excellent combination of high conductivity and tenacious zinc-rich coating. This type of wire is considered to be half hard wire as its tensile strength is 520 MPa. On the other hand, A-type wire (DA) has good tensile strength compared to X-type diffused annealed wire. It is well known, with a brand name of Cobra Cut. A-type wire consists of a brass core, which is an alloy of copper and zinc with 80:20 proportions and has the coating of beta brass. This type of wire is considered to be hard wire as it has the tensile strength of 900 MPa and has the advantage of improved conductivity of copper core (80:20) and tenacious zinc-rich coating.
2.3. Experimental Setup
The experiments were performed in Electronica make Ecocut Elpuls-15 model CNC wire EDM at KLE Technological University’s central MakerSpace facility. The NiTiNOL alloy plate of (800 × 160 × 2) mm3 was cut into (100 × 160 × 2) mm3 size. The alloy samples were annealed at temperatures of 350 °C for a duration of one hour using an electric furnace in a controlled argon atmosphere at a heating rate of 10 °C/minute.
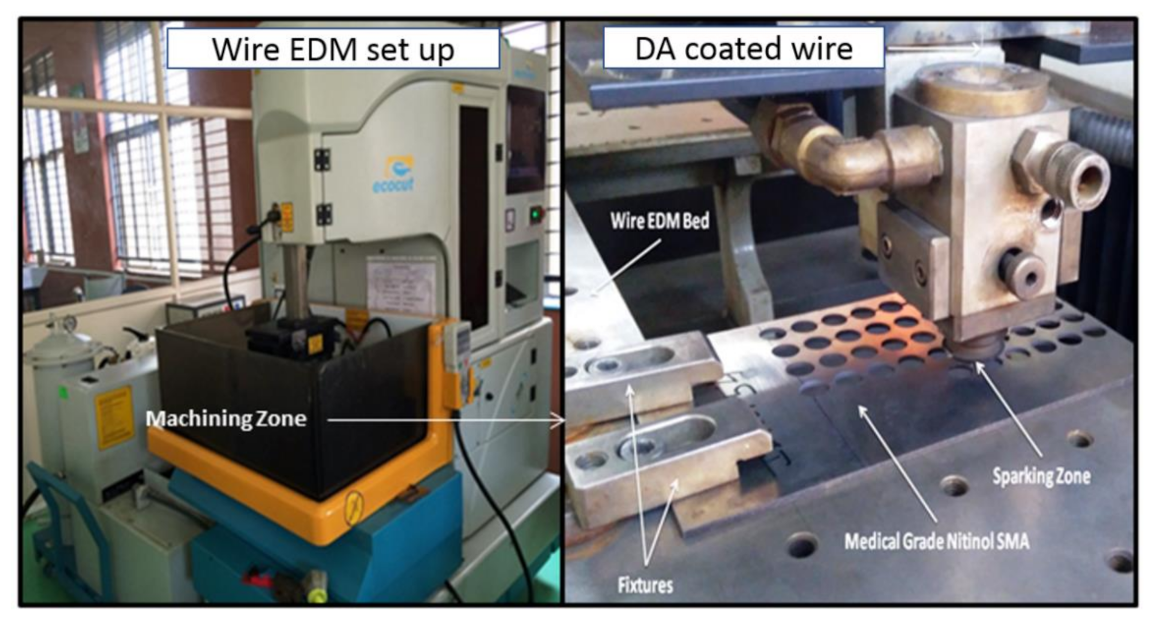
Two types of wire electrodes such as diffused annealed wires (X-type Bronco cut and A-type Cobra cut) with 0.25 mm diameter were used as wire electrode materials for machining the NiTiNOL components using wire EDM. The wire EDM used for experimentation purposes along with medical grade SMA mounted on the wire EDM bed can be seen in Figure 1.

Figure 1.
Wire EDM experimental set up for machining NiTiNOL alloy using diffusion annealed coated electrodes. (Courtesy: KLE Technological University, Hubballi, India.).
2.4. Process Variables and Output Responses
The process variables such as pulse time (spark on time/pulse on time/Ton) with three levels (105 µs, 115 µs and 125 µs), pause time (spark off time/pulse off time/Toff) with three levels (25 µs, 40 µs and 55 µs), wire feed rate (WF) with three levels (4 m/min, 6 m/min and 8 m/min) and spark gap set voltage (servo voltage/SV) with three levels (20 V, 40 V and 60 V) were chosen for the present experimental studies. The levels and ranges of the process variables were identified based on earlier experimentation and studies by Kulkarni et al. [20,21].
TWR and SR are the output responses studied in the present study. The difference between the weight of electrode material before machining and the weight of electrode material after machining (weight loss method) has been adopted for the present experimental study. The SR of the machined NiTiNOL circular components was measured using Zeiss SURFCOM 1500SD2 tester which is used over the sampling length of probe 1.6 mm. Average SR (Ra) was considered for the initial studies and surface integrity (SI) studies were carried out to analyze the surface and subsurface of the machined component in the later sections. The surface analysis was carried out using confocal microscopic, SEM and EDS analysis, whereas the subsurface analysis was carried out using recast layer thickness and microhardness testing analysis procedures.
The machined surface morphology was analyzed by scanning electron microscopy (SEM) from Zeiss (GEMINI FESEM Technology). The SEM is equipped with an energy-dispersive X-ray spectrometer (EDS) to provide information on the elemental identification and the quantitative composition. Unlike in optical microscope, where light is used, SEM uses a beam of electrons at a shorter wavelength to extract the information from the specimens, based on the relationship of the atoms in the samples with the beam. The X-ray detector of the EDS measures the amount of emitted X-ray that is in opposition to the energy when samples placed in the sample holder are exposed to a beam of electrons in a vacuum. The X-ray energy provides information about the elements from which it was emitted, and it enables the qualitative and quantitative analysis of the elements present by an evaluation of the energy of the specimen in opposition to the energy of the detected X-rays. The SEM images and the quantitative analysis were acquired and stored by using preinstalled software. Olympus Confocal microscope offers numerous benefits over the wide field optical microscope, and has the capability to regulate field depth and eliminate background information and the ability to collect serial optical section thick specimens. The confocal microscope was used to measure the 3D surface profile and surface roughness parameters of machined samples.
In confocal microscopic analysis, one can understand the nature of the surface topography of the machined NiTiNOL sample in terms of average height deviations (surface average roughness) (Sa), maximum height of the peak in the entire area under study (Sz), skewness (Ssk) and kurtosis (Sku). Skewness is the measure of asymmetry of surface deviations about the mean plane and kurtosis is the measure of peakedness of the surface height distribution [22,23]. Sa, Sz, Ssk and Sku are considered for the present study, as Sa is required to understand the overall average deviation and Sz, Ssk and Sku are important factors for biomedical applications [24,25].
The microhardness (MH) samples were prepared by using the standard metallographic procedure. The smooth surface helps to improve the accuracy of the microhardness values. MH in the present study have been carried out using Vickers MH Tester as per ASTM E384 standards and the hardness values are measured in HV 0.025 from the outside surface of the machined alloy. Starting from 10 µm, the indentation of the measurement was up to 120 µm. For every 10 µm indentation, the MH value was captured and 12 readings were taken from each sample to understand the MH value in RLZ, HAZ and CLZ regions. The machine uses a pyramid-shaped diamond indenter to make indentations on the recast layer and heat-affected zone cross-section by using a load of 200 g and a dwell time of 15 s. Based on the pulse time and other important process parameters, the microhardness (MH) in the recast layer zone (RLZ) and heat-affected zone (HAZ) region changes and remains unaltered in the converted layer zone (CLZ) region.
To justify the MH values especially at RLZ region, the field emission scanning microscopy (FESEM) of the same alloys used for MH measurements was carried out for measuring the recast layer thickness (RLT). FESEM of Carl Zeiss’ model—NEON 40 35 33, Germany has been used for the present work to calculate the RLT.
The performances of both the diffusion annealed wire electrode materials are compared with performances of plain and coated brass wire electrode materials. The analyses of both surface and subsurface studies are used for comparative studies wherever required. The SR, TWR and SI study results of both the diffusion annealed electrodes experiments are compared and then the most feasible and suitable wire electrode for machining NiTiNOL SMA has been mentioned in the concluding section.
As most of the biomedical applications in general have a round and curved profile, a circular hole of 10 mm diameter was considered as the machining profile. The number of experiments was planned based on the full factorial design (FFD) with four different input variables and three different levels. Table 1 shows the detailed experimental plan for WEDM of NiTiNOL alloy using both the diffusion annealed wire electrode materials. Three trials were conducted for each experimental condition and average value has been considered for the purpose of analysis.

Table 1.
Experimental plan and readings of TWR and SR for DX and DA electrode materials.
2.5. Methodology
The empirical mathematical models are developed using the response surface methodology (RSM) approach [26]. The functional relationship between the chosen output responses such as TWR and SR with different process variables like pulse and pause time, wire feed and spark gap set voltage is established by second-order quadratic mathematical models and the adequacy of the models has been verified.
The functional relationship between the performance criteria and input process variables is expressed as:
where Z = performance, f = surface function and y1, y2, y3, …, yn = factors.
Z = f (y1, y2, y3, …, yn)
RSM-based second-order quadratic mathematical model for performance criterion with four input process variables K, L, M and N in general form is [27]:
where, c0, …, c34 = regression coefficients for the proposed model to be determined. The least squares method has been employed to determine the regression coefficients. The regression coefficients for the projected model are calculated as shown in Equation (3), where C = matrix of regression coefficient estimator, Y = matrix of process parameters, Y′ = transpose matrix of Y and Z = matrix of response or desired output.
Z = c0 + c1K + c2L + c3M + c4N + c11K2 + c22L2 + c33M2 + c44N2 + c12KL + c13KM + c14KN + c23LM + c24LN + c34MN
C = (Y′Y)−1Y′Z
In this present experimental study, the second-order quadratic mathematical models for TWR and SR for experiments of X-type and A-type electrodes, based on developed RSM models, have been fitted with pulse time (Ton), pause time (Toff), wire feed (WF) and spark gap set voltage (SV) as the input process parameters. For the proposed WEDM characteristics, the following mathematical models for both the diffusion annealed electrode experiments are generated using Equation (2).
TWR DX = 0.16511 − 0.00127 Ton − 0.00386 Toff + 0.00444 WF − 0.00106 SV − 0.000002 Ton × Ton − 0.000001 Toff × Toff − 0.00018 WF × WF − 0.000001 SV × SV + 0.000034 Ton × Toff + 0.00005 Ton × WF + 0.00001 Ton × SV + 0.000025 Toff × WF − 0.000003 Toff × SV − 0.000055 WF × SV
SR DX = 30.07495 − 0.67829 Ton + 0.01708 Toff − 0.35813WF + 0.34807 SV − 0.00401 Ton × Ton+ 0.00017 Toff ×Toff − 0.03935 WF × WF + 0.00015 SV × SV − 0.00082 Ton × Toff + 0.00607 Ton × WF − 0.00353 Ton × SV + 0.00470 Toff × WF + 0.00052 Toff × SV − 0.00126 WF × SV
TWR DA = 0.43365 − 0.00823 Ton − 0.00053 Toff + 0.00314 WF + 0.00160 SV + 0.00004 Ton × Ton − 0.00001 Toff × Toff − 0.00026 WF × WF − 0.00003 SV × SV + 0.00001 Ton × Toff + 0.00005 Ton × WF + 0.000006 Ton × SV + 0.00005 Toff × WF + 0.000005 Toff × SV − 0.000075 WF × SV
SRDA = 20.95954 − 0.52202 Ton + 0.06774 Toff − 0.00232 WF + 0.27711 SV + 0.00333 Ton × Ton + 0.00031 Toff × Toff + 0.03293 WF × WF + 0.00026 SV × SV − 0.00071 Ton × Toff − 0.00310 Ton × WF − 0.00276 Ton × SV − 0.00182 Toff × WF − 0.00001 Toff × SV + 0.00096 WF × SV
The suitability of the developed mathematical models (Equations (4)–(7)) has been checked using analysis of variance (ANOVA). The ANOVA for all three output responses of all the four models, namely, TWR and SR of WEDM of NiTiNOL SMA using X-type (DX) and A-type (DA) wire electrodes has been performed at 95% confidence interval. F-ratio for TWR DX (112.28), SR DX (141.26) and TWR DA (237.68), SR DA (88.13) is found to be greater than F (14.66) 0.05 = 1.80, which indicates that the planned mathematical models are significant for the preferred confidence level. The competency of each of the developed models is also justified through R2, as the R2 values for TWR and SR responses are found to be TWR DX (96%), SR DX (96.8%) and TWR DA (98.1%), SR DA (94.9%), respectively.
3. Results and Discussions
Equations (4)–(7) are used to envisage the characteristics of TWR and SR for the results achieved during WEDM of NiTiNOL using both X- and A-types of diffusion annealed coated electrode materials. The impact of process parameters like pulse time, pause time, WF and SV on the proposed output responses such as TWR and SR along with related SEM analysis are depicted in Figure 2, Figure 3, Figure 4, Figure 5, Figure 6, Figure 7, Figure 8 and Figure 9. For analyzing TWR and SR responses, the 3D plots have been plotted as a function of SV with lower, middle and higher hold values of pulse and pause times with three levels of WF conditions. Figure 2, Figure 4, Figure 6 and Figure 8 clearly show a strong relationship between input process variables on the chosen output responses.
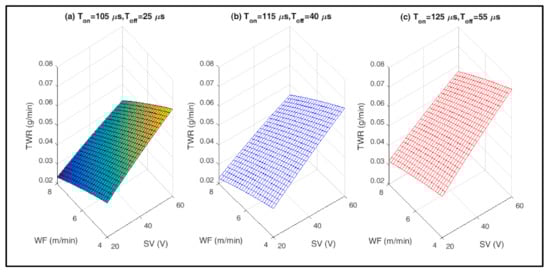
Figure 2.
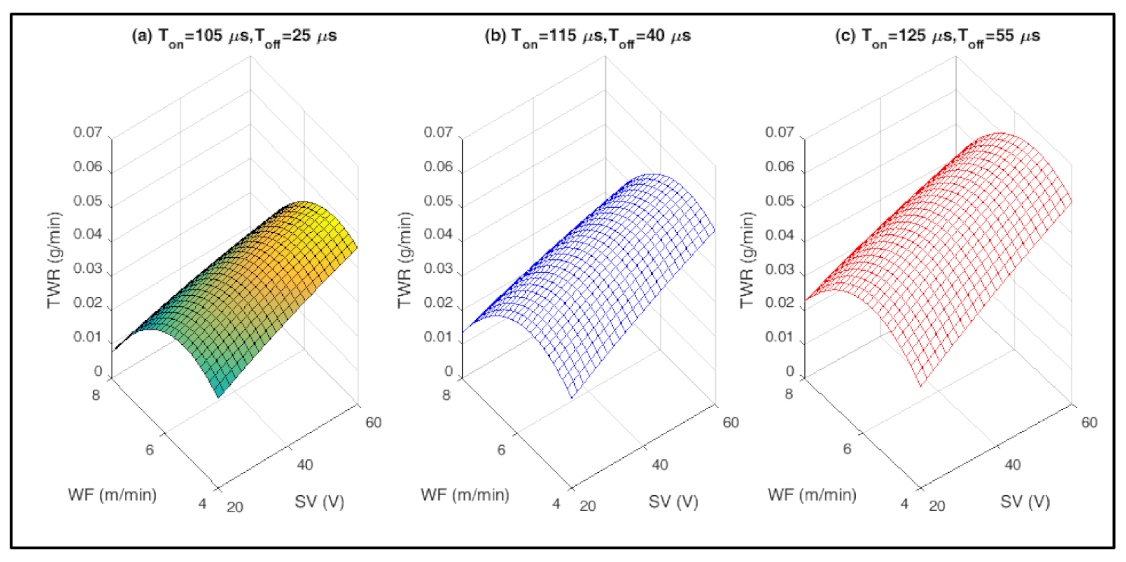
Interaction effects of input process variables on TWR of X-type electrode: (a) lower hold values of Ton and Toff; (b) middle hold values of Ton and Toff; (c) higher hold values of Ton and Toff.
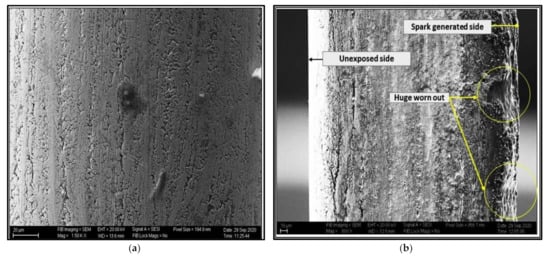
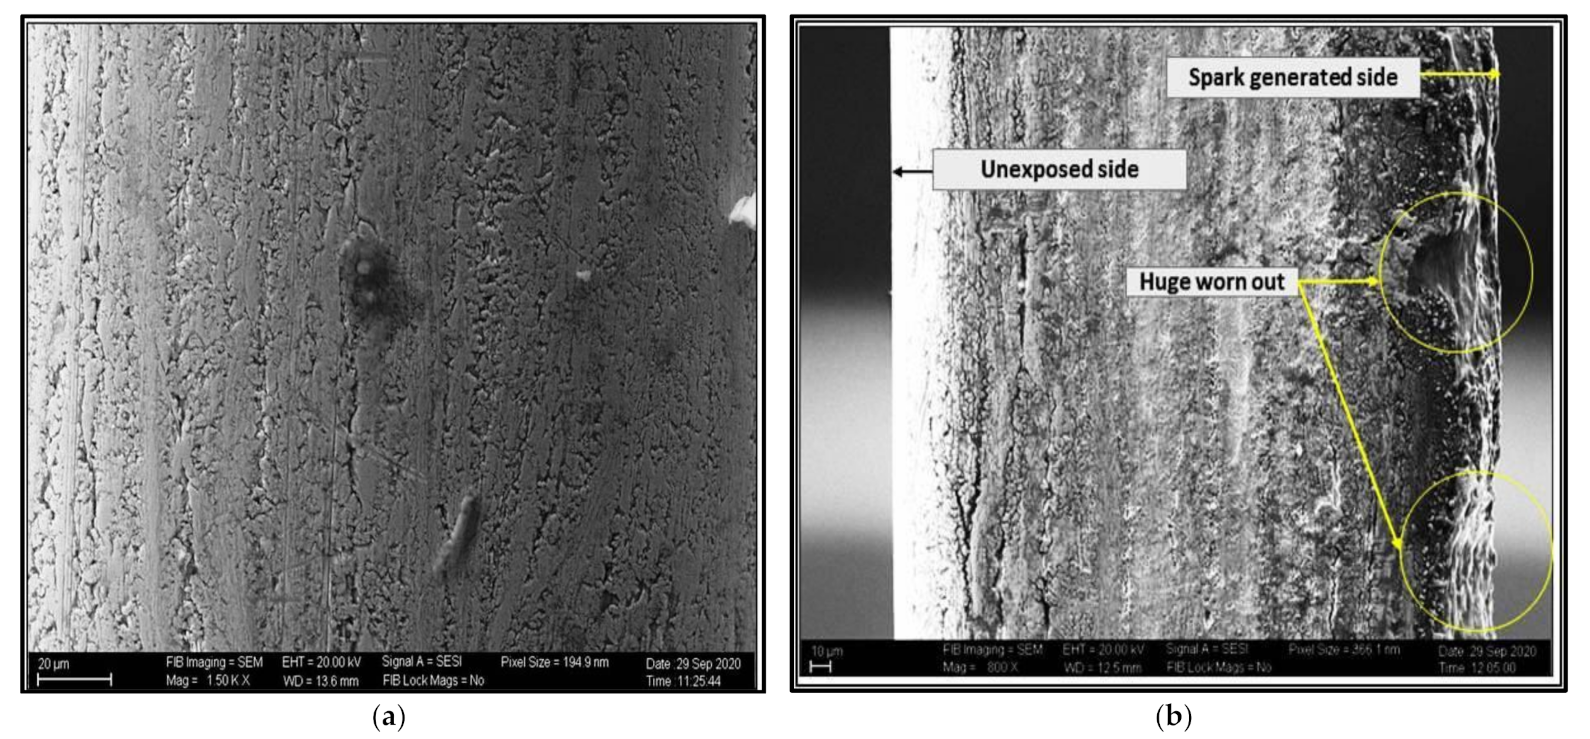
Figure 3.
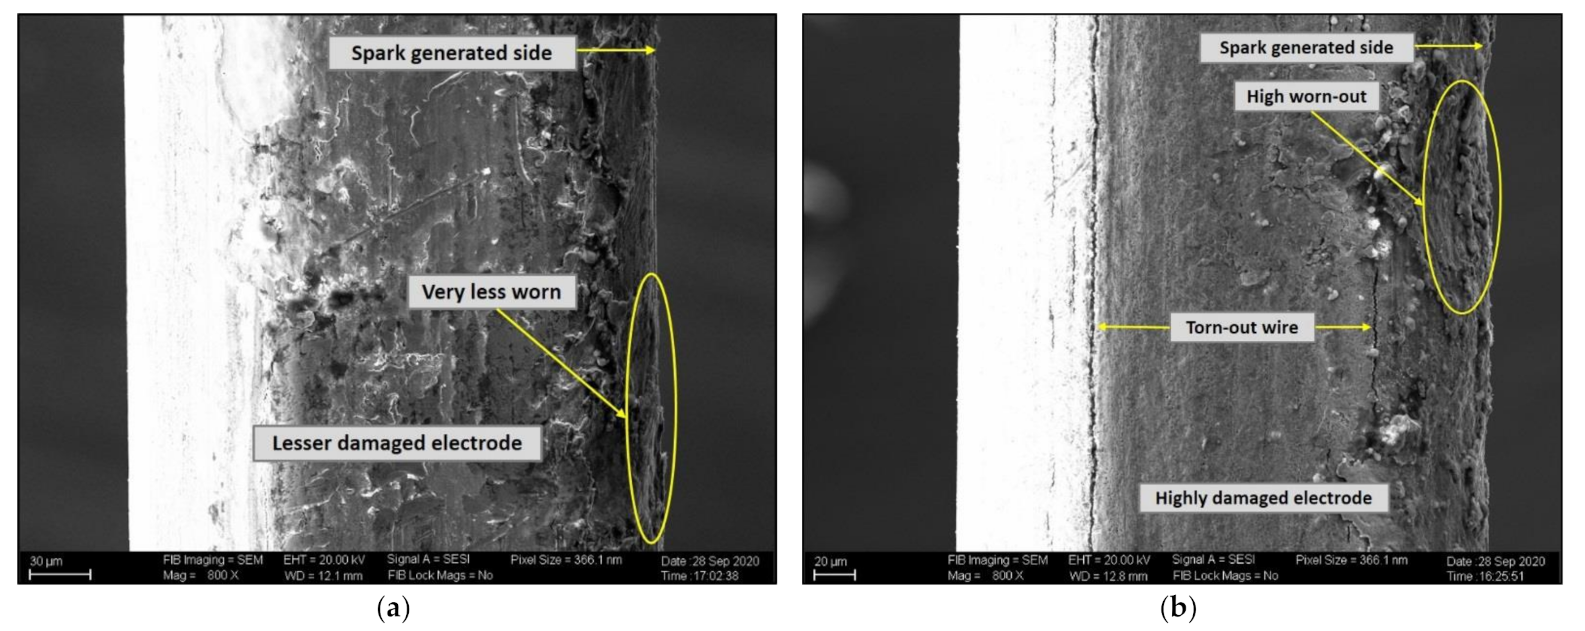
SEM morphology for unused and used X-type wire electrode material; (a) unused electrode; (b) used electrode.
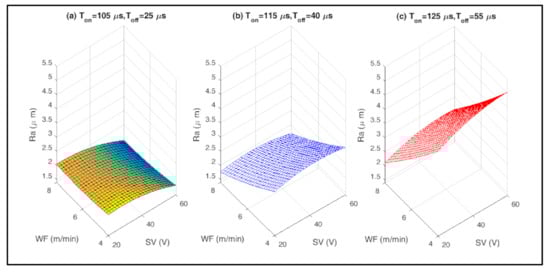
Figure 4.
Interaction effects of input process variables on SR of machined NiTiNOL SMA using X-type electrode: (a) lower hold values of Ton and Toff; (b) middle hold values of Ton and Toff; (c) higher hold values of Ton and Toff.
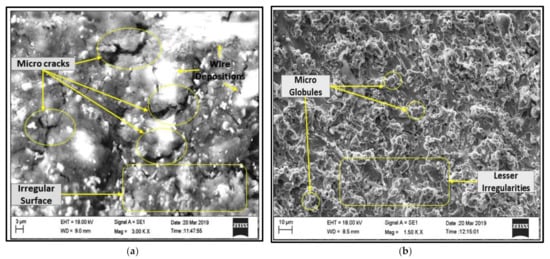
Figure 5.
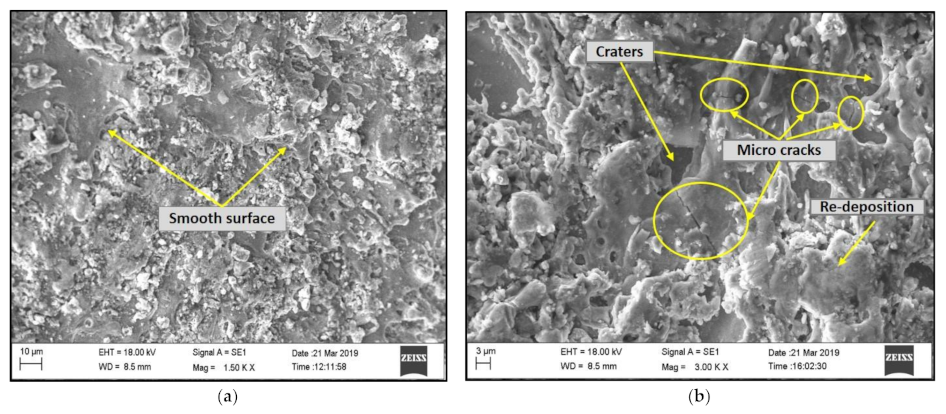
SEM morphology of machined NiTiNOL SMA using X-type wire electrode material; (a) higher SR; (b) lower SR.
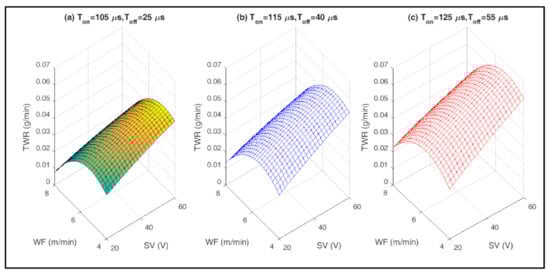
Figure 6.
Interaction effects of input process variables on TWR of A-type electrode: (a) lower hold values of Ton and Toff; (b) middle hold values of Ton and Toff; (c) higher hold values of Ton and Toff.

Figure 7.
SEM morphology for lower and higher TWR of A-type wire electrode material; (a) lower TWR; (b) higher TWR.
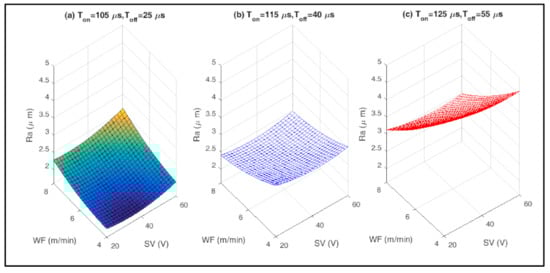
Figure 8.
Interaction effects of input process variables on SR of machined NiTiNOL SMA using A-type electrode: (a) lower hold values of Ton and Toff; (b) middle hold values of Ton and Toff; (c) higher hold values of Ton and Toff.
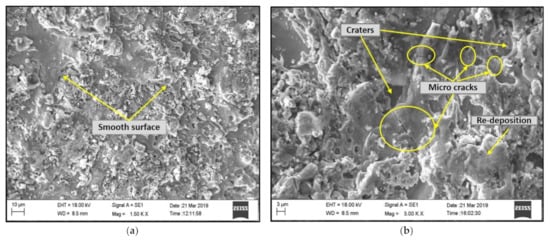
Figure 9.
SEM morphology of machined NiTiNOL SMA using A-type wire electrode material; (a) higher SR; (b) lower SR.
3.1. Analysis of TWR of X-Type Diffusion Annealed Coated Wire Electrode
Interaction effects of SV against TWR with varying WF rates for different hold values of Ton and Toff are plotted for machining NiTiNOL SMA using X-type wire electrode material and are shown in Figure 2a–c. Irrespective of hold values, TWR decreases with increase in SV and for all WF rates. It can also be observed that TWR is higher for higher WF rate for all the combinational hold values. TWR is found to be increasing from lower combinational hold values to higher combinational hold values of pulse and pause times for all WF rates of 4 m/min, 6 m/min and 8 m/min. Very low TWR of 0.039 g/min is seen for the combination of lower pulse and pause hold values (Ton—105 µs and Toff—25 µs) with low WF rate of 4 m/min and higher SV of 60 V. Very high TWR of 0.07 g/min is observed at the combination of higher hold values of pulse and pause times (Ton—125 µs and Toff—55 µs) with higher WF rate of 8 m/min and lower SV of 20 V. It is clearly evident that all the process parameters show visible influence on the results of TWR of X-type wire electrode material during WEDM of NiTiNOL SMA. Especially when SV is high, the gap between electrode and work material is greater; therefore, if pulse time is lower and SV is high, then the TWR is found to be very minimal.
The significance of higher TWR can be observed in Figure 3a,b, which shows the SEM images of both unused and used X-type wire electrode material. It is observed from Figure 3b that there is huge wear and tear on the surface of the used wire sample at high TWR, which is caused because of high spark generation from high pulse time. The wire becomes ruptured very soon when the TWR is high, for which the lower spark gap and higher pulse time are responsible. The exposed side of the X-type wire electrode from where the fresh spark generates and hits the work material has been torn due to heavy wear-out. Compared to machining of NiTiNOL using brass wire electrode, TWR of X-type electrode material is very minimal and TWR of X-type wire electrode is found to be almost the same as TWR of ZBW electrode material [15,19]. The ZBW and X-type electrodes have tensile strength of 500 and 520 MPa, respectively, and are called half hard wires, whereas plain brass wire electrode is a soft wire with tensile strength of 420 MPa.
3.2. Analysis of SR of Machined NiTiNOL SMA Using X-Type Wire Electrode
Interaction effects of SV against SR with varying WF rates for different hold values of Ton and Toff are plotted for machining NiTiNOL SMA using X-type wire electrode material and are shown in Figure 4a–c. In Figure 4a, for lower pulse and pause hold values, it can be observed that lower SR is witnessed at SV of 60 V and WF of 8 m/min. Figure 4b,c show that SR decreases with increased SV irrespective of WF rates. It is revealed that for lower and middle level hold values, WF of 8 m/min is found to be good for lower SR, whereas for higher hold values, WF of 4 m/min gives lower SR results. The highest SR is achieved at lower SV values and higher WF and higher hold values of pulse and pause times. When the SV is low, the spark generated from the wire electrode hits the workpiece with high intensity and thus damages the surface due to higher heat transfer on to the workpiece. Irrespective of WF rates, the higher hold values of pulse and pause times along with lower SV result in high SR. An almost similar kind of SR graph was observed while machining NiTiNOL SMA using brass wire electrode material [15]. Higher SR of 6.49 µm was observed at Ton—125 µs, Toff—55 µs, WF—8 m/min and SV of 20 V and the same can be witnessed in Figure 4.
Figure 5 shows the SEM analysis for the machined NiTiNOL samples with higher and lower SR values. A huge number of cracks followed by very high irregular surfaces can be observed in Figure 5a. The wire depositions on the workpiece can also be observed in Figure 5a. The microcracks, irregular surfaces and extra depositions from the wire cause higher SR for higher hold values of pulse and pause times. On the other hand, for lower hold value combinations along with higher SV, the SEM analysis from Figure 5b shows a comparatively smooth surface without any cracks and very few microglobules can be observed. Very low SR of 1.52 µm was achieved at Ton—105 µs, Toff—55 µs, WF—8 m/min and SV of 60 V as spark intensity reduces at higher levels of SV, which allows good flushing, leading to better surface finish.
3.3. Analysis of TWR of A-Type Diffusion Annealed Coated Wire Electrode
Interaction effects of SV against TWR with varying WF rates for different hold values of Ton and Toff are plotted for machining NiTiNOL SMA using A-type wire electrode material and are shown in Figure 6a–c. For all the three different hold values of pulse and pause times, the nature of graphs as observed from Figure 6a–c almost remains the same. TWR is found to be increasing as the hold value increases from lower level to higher level, i.e., from 105–25 µs (Ton-Toff) combinational value to 125–55 µs (Ton-Toff) combinational value. In all the three cases, it is clearly evident that TWR decreases as SV increases. TWR and SV are inversely proportional to each other. The higher the SV, the lower and better the TWR. WF rates have their impact on TWR, which can be justified from Figure 6a–c. Irrespective of lower, middle and higher pulse and pause combinational hold values, in all three cases, TWR increases as WF rate increases. The lower the feed rate, the lesser the tool wear. WF of 4 m/min causes lesser tool wear compared to wire feed rate of 8 m/min. The wire experiences uncontrolled movement and vibrations during higher feed rates, causing the tool to wear out quickly during lower SV, as the spark gap between the work material and tool material is less. The higher pulse time is also responsible for high tool wear as spark generated during high pulse time of 125 µs removes material for a longer duration compared to pulse time of 105 µs. When the TWR of A-type wire electrode is compared with the performances of the other types of electrode materials, it can be observed that the performance w.r.t. TWR is found to be better in most cases and is almost in line with the performance of ZBW and X-type wire electrode materials in some combinational values.
Figure 7a,b show the SEM analysis of A-type wire electrode samples with lower and higher TWR. The lower TWR for A-type wire electrode material is found to be 0.0054 g/min for the combinational value of Ton = 105 µs, Toff = 55 µs, WF = 4 m/min and SV = 60 V and this is because, when the spark generation time is at the lower level of 105 µs and the off time is at the higher level of 55 µs, the spark duration available for machining the material is less and also the intensity of heat generation is less. Along with this condition, the SV is large (60 V), where the distance between workpiece and electrode material results in lesser intensity. Therefore, less intensity of heat and more pause time along with large SV are responsible for lesser TWR. Lesser TWR results in lower SR. Figure 7a shows the SEM analysis of wire electrode samples with lower TWR. If the spark-generated side of the electrode is observed, it can be seen that the electrode has worn out to the minimum with lesser damage. The higher TWR using A-type electrode material is found to be 0.0694 g/min followed by 0.0678 g/min, which is achieved from high pulse time of 125 µs, larger off time of 55 µs and average SV of 40 V. Even the high tool wear rates can be observed for the combinational values of pulse time of 125 µs and lower SV value of 20 V. Figure 7b shows the SEM image of electrode material which has experienced high TWR. Compared to Figure 7a, the torn-out area and damage to the electrode are high in Figure 7b. However, when the SEM image of a higher TWR sample of A-type electrode is compared with other electrode materials, then there is very little deformation and less damage as the wire is considered to be hard wire with tensile strength of 900 MPa and it has beta brass coating.
3.4. Analysis of SR of Machined NiTiNOL SMA Using A-Type Wire Electrode
Interaction effects of SV against SR with varying WF rates for different hold values of Ton and Toff are plotted for machining NiTiNOL SMA using A-type wire electrode material and are shown in Figure 8a–c. SR is low for the lower combinational hold values of pulse and pause time compared to the other two hold values. As the hold value increases from middle level to higher level, the SR also increases proportionally. The increase in SV influences the SR of the machined alloy for middle and high hold values of Ton and Toff, whereas, interestingly, for lower hold values of Ton and Toff, SR increases as SV increases. This may be because even though there is less spark gap between workpiece and electrode material, the spark that is generated from electrode material is for a lesser time period, as pulse time is just 105 µs. The lesser the spark time, the better the flushing; SR is found to be lower. As the pulse time increases from 105 µs to 115 µs to 125 µs, the spark generation happens for longer duration, and therefore, the heat transferred on to the workpiece is greater, resulting in higher SR.
When the SR is compared w.r.t. performance of wire feed rate, then moderate wire feed of 6 m/min has the upper hand, although there is not much difference between the SR performances w.r.t. different wire feed rates of 4 m/min, 6 m/min and 8 m/min. The nature of all three different WF rates is found to be the same against varying SV from all three different pulse and pause hold conditions.
Figure 9a,b show the SEM analysis for higher and lower SR values. The lowest SR of 1.66 µm is attained at Ton = 105 µs, Toff = 25 µs, WF = 6 m/min and SV = 20 V. The machined sample with the lowest SR values has been analyzed using SEM in Figure 8a. It can be seen in the SEM image that the surface of the machined sample is free from cracks and craters. Even the redeposition of the melted metal after machining is very minimal due to lesser spark intensity generated from lower pulse time of 105 µs. The higher SR of 5.36 µm is seen in the machined sample produced from the combination of Ton =125 µs, Toff = 25 µs, WF = 4 m/min and SV = 20 V and the SEM analysis of the same sample has been depicted in Figure 9b. The SEM analysis reveals that the machined sample has many cracks and huge craters throughout the surface, which are formed due to high sparks hitting the workpiece at higher pulse time of 125 µs and lower SV of 20 V. The lower WF of 4 m/min provides low movement of electrode material, hence flushing reduces and therefore redepositions of melted material after machining can be seen in the form of huge debris all over the surface.
3.5. Surface Integrity Studies of Machined NiTiNOL SMA
Both surface and subsurface analysis of the wire electric discharge machined NiTiNOL samples has been carried out in the surface integrity studies. The details of the methods followed to conduct surface integrity studies have been mentioned in Section 2.3.
3.5.1. Surface Analysis of Machined NiTiNOL SMA—X-Type Electrode Material
Figure 10 shows the 3D topographical surface roughness analysis of machined NiTiNOL samples and Figure 11 depicts the summary of EDS analysis results indicating the elemental analysis for the same set of machined NiTiNOL samples, where X-type diffusion annealed wire has been used as electrode material during the wire EDM process.

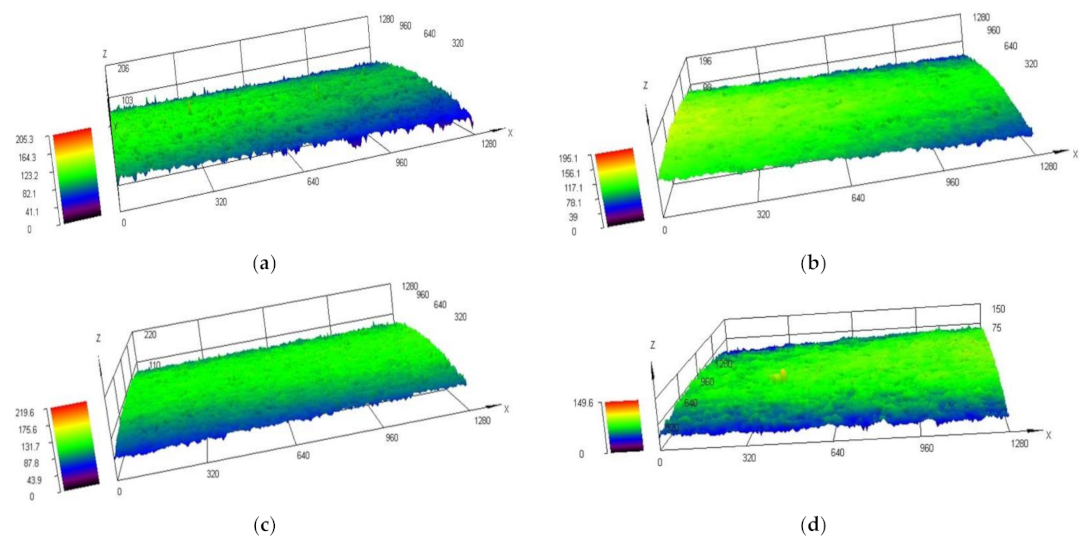
Figure 10.
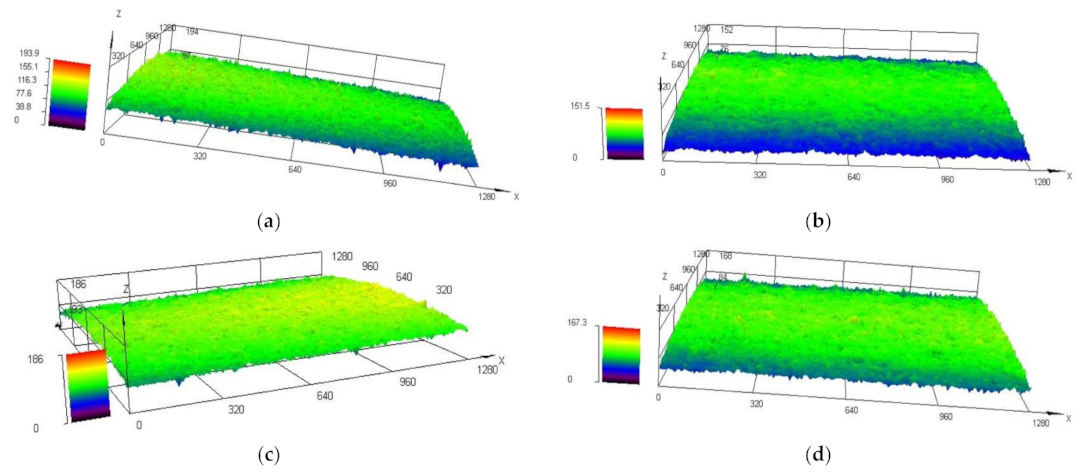
Surface analysis of machined NiTiNOL SMA-X-type electrode: (a) input conditions Ton = 105 µs, Toff = 55 µs, WF = 4 m/min and SV = 20 V; (b) input conditions Ton = 125 µs, Toff = 25 µs, WF = 6 m/min and SV = 20 V; (c) input conditions Ton = 115 µs, Toff = 40 µs, WF = 8 m/min and SV = 40 V; (d) input conditions Ton = 125 µs, Toff = 55 µs, WF = 8 m/min and SV = 60 V.

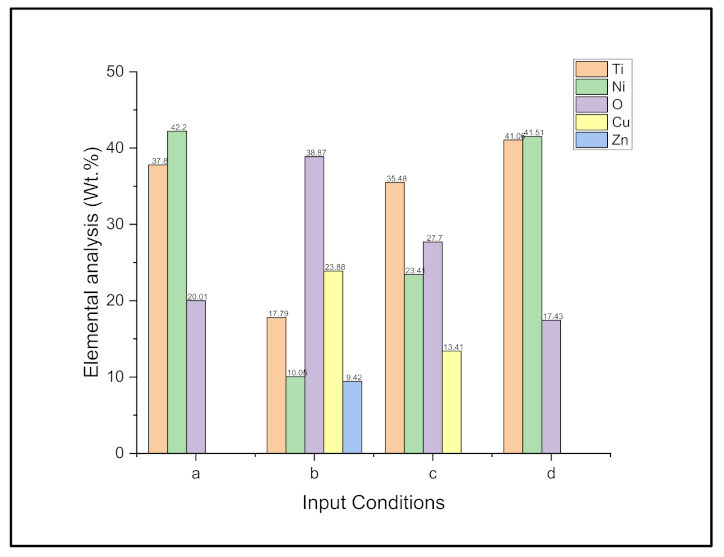
Figure 11.
Summary of EDS analysis results of machined NiTiNOL SMA-X-type electrode: (a) input conditions Ton = 105 µs, Toff = 55 µs, WF = 4 m/min and SV = 20 V; (b) input conditions Ton = 125 µs, Toff = 25 µs, WF = 6 m/min and SV = 20 V; (c) input conditions Ton = 115 µs, Toff = 40 µs, WF = 8 m/min and SV = 40 V; (d) input conditions Ton = 125 µs, Toff = 55 µs, WF = 8 m/min and SV = 60 V.
Figure 10a indicates the surface analysis for the input process parameter combinations of Ton = 105 µs, Toff = 55 µs, WF = 4 m/min and SV = 20 V with Sa of 12 µm and comparatively higher Sz of 116.06 µm. The skewness (Ssk) and kurtosis (Sku) values are found to be −0.418 and 2.633, respectively. The average SR and maximum peak heights are moderately high as the diffusion annealed wire electrode material is hard when compared with plain brass wire electrode material. Although there is sufficient time for flushing, the sparks produced in X-type electrodes are comparatively high and, most importantly, the gap between electrode and workpiece is very minimal. The effect of the intensity of the sparks because of the lesser gap between workpiece and electrode material can be observed in the form of valleys in Figure 10a. As seen in Figure 11a, interestingly, there are no depositions of the electrode contents on the machined surface. The time available for flushing is very good and the sparks generated from electrodes are low due to lower pulse time and as the wire is diffusion annealed, the machined surface is free from depositions of Cu and Zn.
Figure 10b indicates the surface roughness analysis for the input process parameter combinations of Ton = 125 µs, Toff = 25 µs, WF = 6 m/min and SV = 20 V with higher Sa of 15.67 µm and higher Sz of 122.76 µm. The Ssk and Sku values are found to be −0.555 and 2.383, respectively. Both average SR and maximum peak height are found to be very high for this particular combination, as pulse time is very high and pause time is very low along with lesser gap voltage. As the gap voltage is far less and pulse time is larger, the sparks generated from X-type diffusion annealed electrode materials are of high intensity. It can be seen in Figure 10b that the peaks and valleys are high and SR is not uniformly distributed. The high-intensity sparks hitting the workpiece for longer durations from a very close position is the main reason for higher average SR and higher peak height. This value of average SR is found to be the highest among all the combinations of process parameters across all the electrode materials [15,19]. Even though the wire is diffusion annealed, due to very high intensity and high quality of sparks generated because of higher pulse time, the Cu and Zn content from the electrode material splashed over the machined surface with 23.88 and 9.42 wt.%, respectively. The deposition of Cu and Zn can be seen in Figure 11b. Among the different input combinational values in wire EDM of NiTiNOL using X-type electrode material, this particular combination of higher pulse time, lower pause time and lower SV results in higher wear and tear of the wire, leading to higher depositions of Cu and Zn over the surface of the machined sample, consequently leading to higher SR.
Figure 10c indicates the surface analysis for the input process parameter combinations of Ton = 115 µs, Toff = 40 µs, WF = 8 m/min and SV = 40 V with average Sa of 11.08 µm and lower Sz of 92.73 µm. The Ssk and Sku values are found to be −0.581 and 2.647, respectively. The maximum peak height is comparatively low in this combination due to appropriate machining conditions of moderate pulse and pause time along with moderate spark gap set voltage. Except wire feed rate, all other parameters are maintained at middle value in this particular combination. As compared to Figure 10a,b, the valleys and peaks in Figure 10c are very negligible. It can also be observed in Figure 11c that the Zn content from the electrode material is not splashed onto the machined surface. Cu content with 13.41 wt.% can be observed, which is still a far better condition compared to the EDS results indicated in Figure 11b; this is because apart from WF, the other three process parameters are at middle range.
Figure 10d indicates the surface roughness analysis for the input process parameter combinations of Ton = 125 µs, Toff = 55 µs, WF = 8 m/min and SV = 60 V with lower Sa of 10.76 µm and Sz of 103.37 µm. The Ssk and Sku values are found to be −0.551 and 2.914, respectively. The skewness values for the samples machined with X-type electrode are almost fairly symmetrical and few of them are moderately skewed. The surface texture height of the machined samples is found to be platykurtically distributed.
The average surface roughness is found to be minimal among all other input combinations as observed in Figure 10a–c. Although the pulse time and intensity of the sparks generated are higher in this particular input setting, the average SR is found to be minimal because the spark gap between the workpiece and electrode material is also high. Another main reason is the contribution of the pause time. There is sufficient time for the flushing as pause time is maintained for a higher period of 55 µs. Some peaks are observed nearer to the corners as feed rate is very high and there are chances that the wire electrode generates fresh sparks due to high feed rate and these sparks are not uniformly transferred to the workpiece material due to larger spark gap set voltage of 60 V. Figure 11d supports the average surface roughness results obtained in Figure 10d. It can be seen that the surface of the machined NiTiNOL alloy is completely free from the depositions of wire electrode material and some oxidation is observed because the wire EDM process happens in the dielectric water medium. More contact of workpiece material with deionized water results in the oxidation process.
3.5.2. Surface Analysis of Machined NiTiNOL SMA—A-Type Electrode Material
Figure 12 shows the 3D topographical surface roughness analysis of machined NiTiNOL samples and Figure 13 depicts the results of EDS analysis for the same set of machined NiTiNOL samples, where A-type diffusion annealed wire has been used as electrode material during the wire EDM process.

Figure 12.
Surface analysis of machined NiTiNOL SMA-A-type electrode: (a) input conditions Ton = 105 µs, Toff = 25 µs, WF = 6 m/min and SV = 20 V; (b) input conditions Ton = 115 µs, Toff = 40 µs, WF = 8 m/min and SV = 20 V; (c) input conditions Ton = 115 µs, Toff = 40 µs, WF = 4 m/min and SV = 40 V; (d) input conditions Ton = 125 µs, Toff = 55 µs, WF = 8 m/min and SV = 40 V.
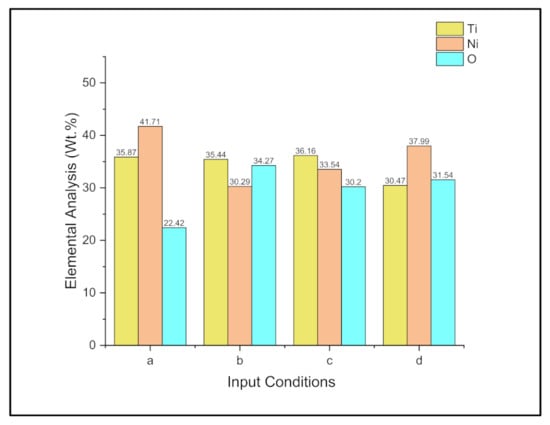
Figure 13.
Summary of EDS analysis results of machined NiTiNOL SMA-A-type electrode: (a) input conditions Ton = 105 µs, Toff = 25 µs, WF = 6 m/min and SV = 20 V; (b) input conditions Ton = 115 µs, Toff = 40 µs, WF = 8 m/min and SV = 20 V; (c) input conditions Ton = 115 µs, Toff = 40 µs, WF = 4 m/min and SV = 40 V; (d) input conditions Ton = 125 µs, Toff = 55 µs, WF = 8 m/min and SV = 40 V.
Figure 12a indicates the surface analysis for the input process parameter combinations of Ton = 105 µs, Toff = 25 µs, WF = 6 m/min and SV = 20 V with Sa of 10.99 µm and comparatively higher Sz of 119.33 µm. The Ssk and Sku values are found to be −0.635 and 2.619, respectively. For similar conditions of lower pulse time and lower SV combinations, it has been seen that the average surface roughness in the case of brass, Zn-coated brass and X-type wire electrode machining was found to be low [19]. The same trend is followed in A-type electrode machining also. The pulse time generates sparks and as the SV is in the lower position, the heat generated by sparks affects the workpiece component. Cooling of machined components and debris removal are very low as pause time is just 25 µs, resulting in insufficient flushing and therefore, the peaks and valleys are created on the machined surface.
Figure 12b indicates the surface roughness analysis for the input process parameter combinations of Ton = 115 µs, Toff = 40 µs, WF = 8 m/min and SV = 20 V with comparatively higher Sa of 11.98 µm and moderately lower Sz of 94.44 µm. The Ssk and Sku values are found to be −0.493 and 2.545, respectively. The average surface roughness increases because of an increase in the pulse time from 105 µs to 115 µs. The increase in Sa is not just dependent on pulse time increase, but instead an increase in wire feed rate may also contribute as fresh sparks are generated on the wire. Surprisingly, the maximum peak height shows improvement in Figure 12b. This is because the pause time has been increased from 25 µs to 40 µs and therefore the workpiece has comparatively more time for flushing away the debris. The valleys are almost negligible in Figure 12b when compared with Figure 12a.
Figure 12c indicates the surface roughness analysis for the input process parameter combinations of Ton = 115 µs, Toff = 40 µs, WF = 4 m/min and SV = 40 V with comparatively lower Sa of 10.99 µm and lower Sz of 86.22 µm. The Ssk and Sku values are found to be −0.552 and 2.387, respectively. The change in this particular input parameters combination is that the WF has been decreased from 8 m/min to 4 m/min and SV has been increased from 20 V to 40 V. This increase in SV creates a greater gap between the electrode material and the workpiece, and then the decrease in wire feed rate results in consistent machining performance. Therefore, an overall improvement in both average surface roughness as well as maximum peak height can be seen in Figure 12c. Sz of 86.22 µm is almost the lowest value that has been achieved compared to the performances of other electrode materials.
Figure 12d indicates the surface roughness analysis for the input process parameter combinations of Ton = 125 µs, Toff = 55 µs, WF = 8 m/min and SV = 40 V with comparatively lower Sa of 10.78 µm and moderate Sz of 104.49 µm. The Ssk and Sku values are found to be −0.793 and 2.897, respectively. The skewness values for the samples machined with A-type electrode are almost moderately skewed. The surface texture height of the machined samples is found to be platykurtically distributed. The pulse time, pause time and wire feed rate are all high for this combination of input parameters, whereas spark gap is maintained at the middle level. The higher feed rate might be the possible reason for increase in the maximum peak height. However, it can be observed that for low, middle and high pulse time, there is not much deviation in the range of average surface roughness. The valleys and peaks in Figure 12a,d are comparatively high, but average surface roughness has not much variation. A-type electrode has shown some consistency in the average surface roughness for different input settings. Observations from Figure 13a–d indicate that the machined surface is completely free from Cu and Zn contents of electrode material. As the tensile strength of the A-type diffusion annealed wire electrode is high compared to other wire electrode materials such as X-type wire or plain brass or zinc-coated brass wire electrodes, the special alloy of copper and zinc with 80:20 proportions and the coating of beta brass in a diffuse manner allows the wire to perform well for the combinational values of different process parameters. As observed in Figure 12a–d, the average surface roughness performance is found to be stable over the combinations of all the different input process parameters and as depicted by Figure 13a–d, none of the machined surfaces have the depositions of Cu and Zn from the electrode material. The Cu and Zn deposition on the machined surfaces is seen more in the case of machined NiTiNOL samples from plain brass and zinc-coated brass electrode materials [15,19]. The Cu and Zn depositions further reduced when NiTiNOL was machined using diffusion annealed X- and A-types of electrode materials during the wire EDM process. Although both X- and A-type wire electrode materials are good in terms of surface topographic performance, A-type electrode material is found to be much better compared to X-type electrode material both in terms of 3D surface and EDS analysis.
3.5.3. Subsurface Analysis of Machined NiTiNOL SMA—X-Type Electrode Material
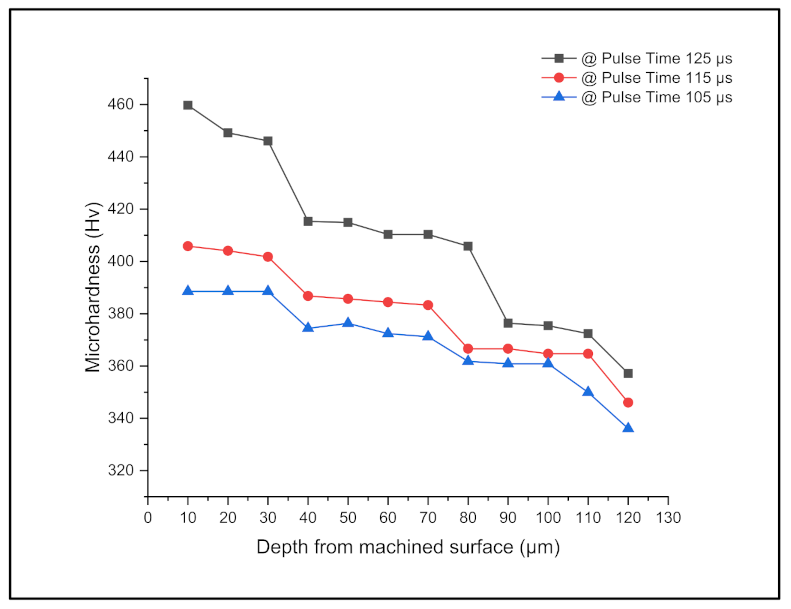
Figure 14 shows the microhardness (MH) analysis of machined NiTiNOL samples using X-type wire electrodes for three different pulse time conditions. The MH has been studied up to the depth of 120 µm for the varying pulse times of 105 µs, 115 µs and 125 µs. The highest microhardness (MH) of 460 Hv is attained at pulse time of 125 µs. The pattern of MH behavior against the depth of the machined alloy for all three different pulse times is found to be the same, but the MH values of alloy machined at 115 µs and 105 µs are lesser compared to the alloy machined at 125 µs. Recast layer zone (RLZ) is found up to the depth of 30 µm from the machined surface for all three pulse time conditions, which is less compared to the RLZ of alloys machined using plain brass wire and ZBW electrode materials [15,19]. The higher HAZ as observed from Figure 14 ranges from 40 µm to 70–80 µm depth of the machined alloy. From 80 µm onwards, as the depth of the alloy increases up to 120 µm, the HAZ tends to decrease but still does not reach the CLZ. The overall performance of the X-type electrode material in terms of MH values is found to be better than plain brass wire but is not as good as ZBW electrode material. However, although the MH values are higher compared to ZBW electrode performance, the RLZ and HAZ are lesser. This may be because of the quality of diffusion annealed wire. The temperature generated by X-type wire has comparatively less effect on the alloy to a certain depth.
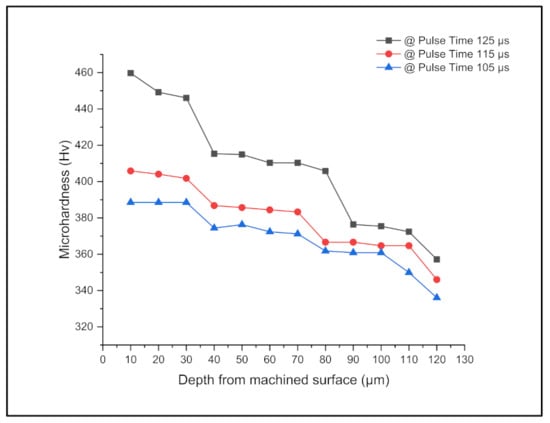
Figure 14.
Microhardness analysis (MH) of machined NiTiNOL SMA-X-type electrode.
The average MH at RLZ is found to be 41.14%, 26.21% and 21.42% higher than the MH of the base material for pulse time of 125 µs, 115 µs and 105 µs, respectively. Average MH in the HAZ up to the depth of 70–80 µm is found to be 28.54%, 19.14% and 16.01% greater than the MH of the base material for pulse time of 125 µs, 115 µs and 105 µs, respectively. Further, the decline in MH values is observed in the HAZ up to the depth of 120 µm and the MH is found to be 15.72%, 12.66% and 9.97% greater than the MH of the base material (320 Hv) for pulse time of 125 µs, 115 µs and 105 µs, respectively.
Figure 15 indicates the RLT analysis for the three different pulse time conditions during wire EDM of NiTiNOL using X-type wire as electrode material. The RLT is an electric spark melted material which is solidified and deposited on the surface of the workpiece without being evacuated and expelled by the dielectric fluids. The structure is extremely hard to remove, and it is examined at various magnification levels and the thickness is measured utilizing the SEM. The thermal zone lies below the recast layer. Figure 15a–c depict the varied recast layer thickness over the machined surface after the completion of the EDM process. RLT increases with increase in the pulse time parameter. The adhesion of melted molten material over the machined surface may be due to insufficient dielectric pressure, and it redeposits unevenly over the machined surface and rapid solidification creates shrinkage of molten material, which may induce high thermal tensile residual stresses resulting in microcracks.
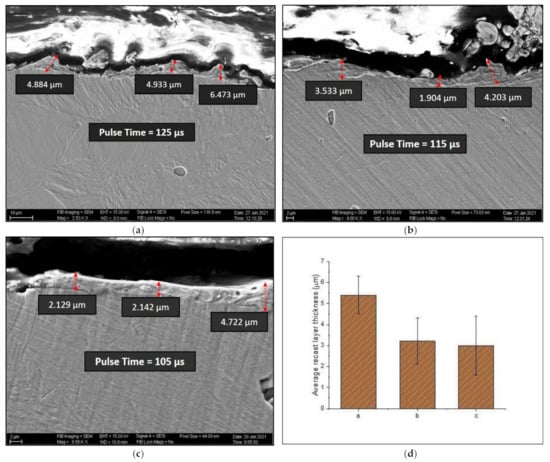
Figure 15.
Recast layer thickness analysis of machined NiTiNOL SMA-X-type electrode: (a) pulse time Ton = 125 µs; (b) pulse time Ton = 115 µs; (c) pulse time Ton = 105 µs; (d) average recast layer thickness of samples machined at Ton = 125 µs, Ton = 115 µs and Ton = 105 µs.
3.5.4. Subsurface Analysis of Machined NiTiNOL SMA—A-Type Electrode Material
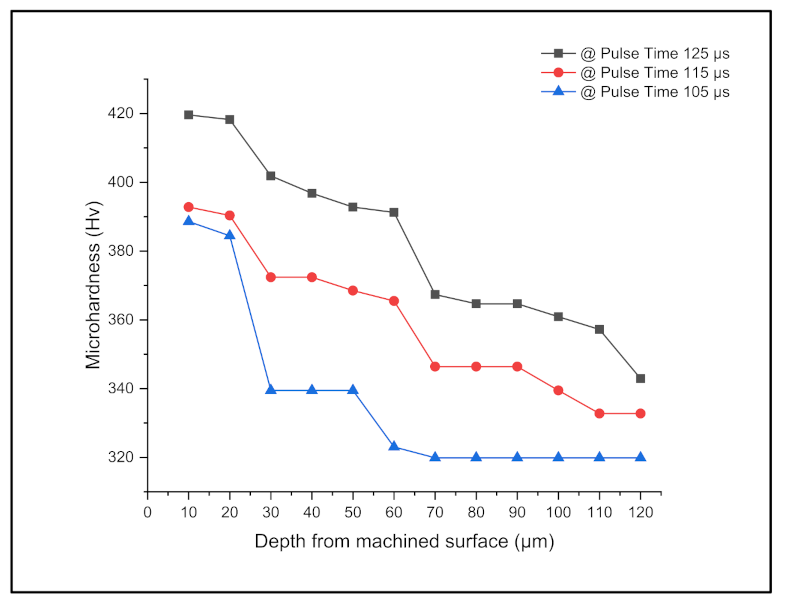
Figure 16 shows the MH analysis of machined NiTiNOL samples using A-type wire electrodes for three different pulse time conditions. The MH has been studied up to the depth of 120 µm for the varying pulse time of 105 µs, 115 µs and 125 µs. The highest MH of 420 Hv is attained at pulse time of 125 µs. Compared to all other electrode materials, MH of machined alloy using A-type wire electrodes is found to be the lowest. The RLZ in the machined alloy in this particular type of wire electrode machining is just up to 20 µm. The HAZ for pulse times of 125 µs and 115 µs is found up to the depth of 70 µm and for pulse time of 105 µs there is no much higher HAZ found. For pulse times of 125 µs and 115 µs, the HAZ declines from the depth of 80 µm to 120 µm, whereas, when the alloy is machined with 105 µs of pulse time, HAZ of the alloy ends at early depth of 60 µm and immediately the CLZ starts from the depth of 70 µm and, throughout the depth of 120 µm, the MH of the machined alloy matches the MH of the base alloy. It was observed in the EDS analysis from Figure 13 that the surface of the machined alloy which was machined using A-type electrode material did not have any carbide and oxide deposition.
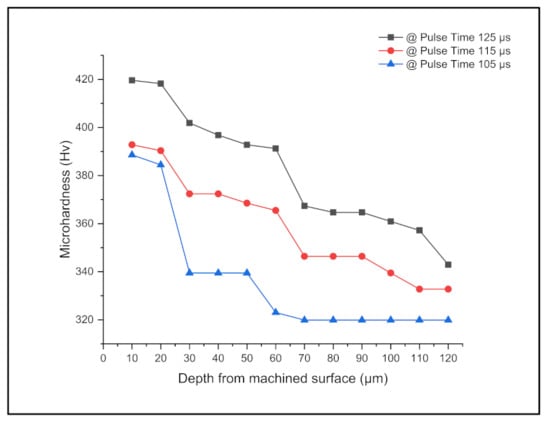
Figure 16.
Microhardness analysis of machined NiTiNOL SMA-A-type electrode.
The average MH at RLZ is found to be 30.90%, 22.36% and 20.78% higher than the MH of the base material for pulse times of 125 µs, 115 µs and 105 µs, respectively. Average MH in the HAZ up to the depth of 50–60 µm is found to be 23.64%, 15.52% and 4.79% greater than the MH of the base material for pulse time of 125 µs, 115 µs and 105 µs, respectively. Further, the decline in MH values is observed in the HAZ up to the depth of 120 µm and is found to be 12.37% and 6.46% greater than the MH of the base material for pulse time of 125 µs and 115 µs, respectively, whereas the MH of machined alloy equals the MH of the base alloy when machined with 105 µs pulse time.
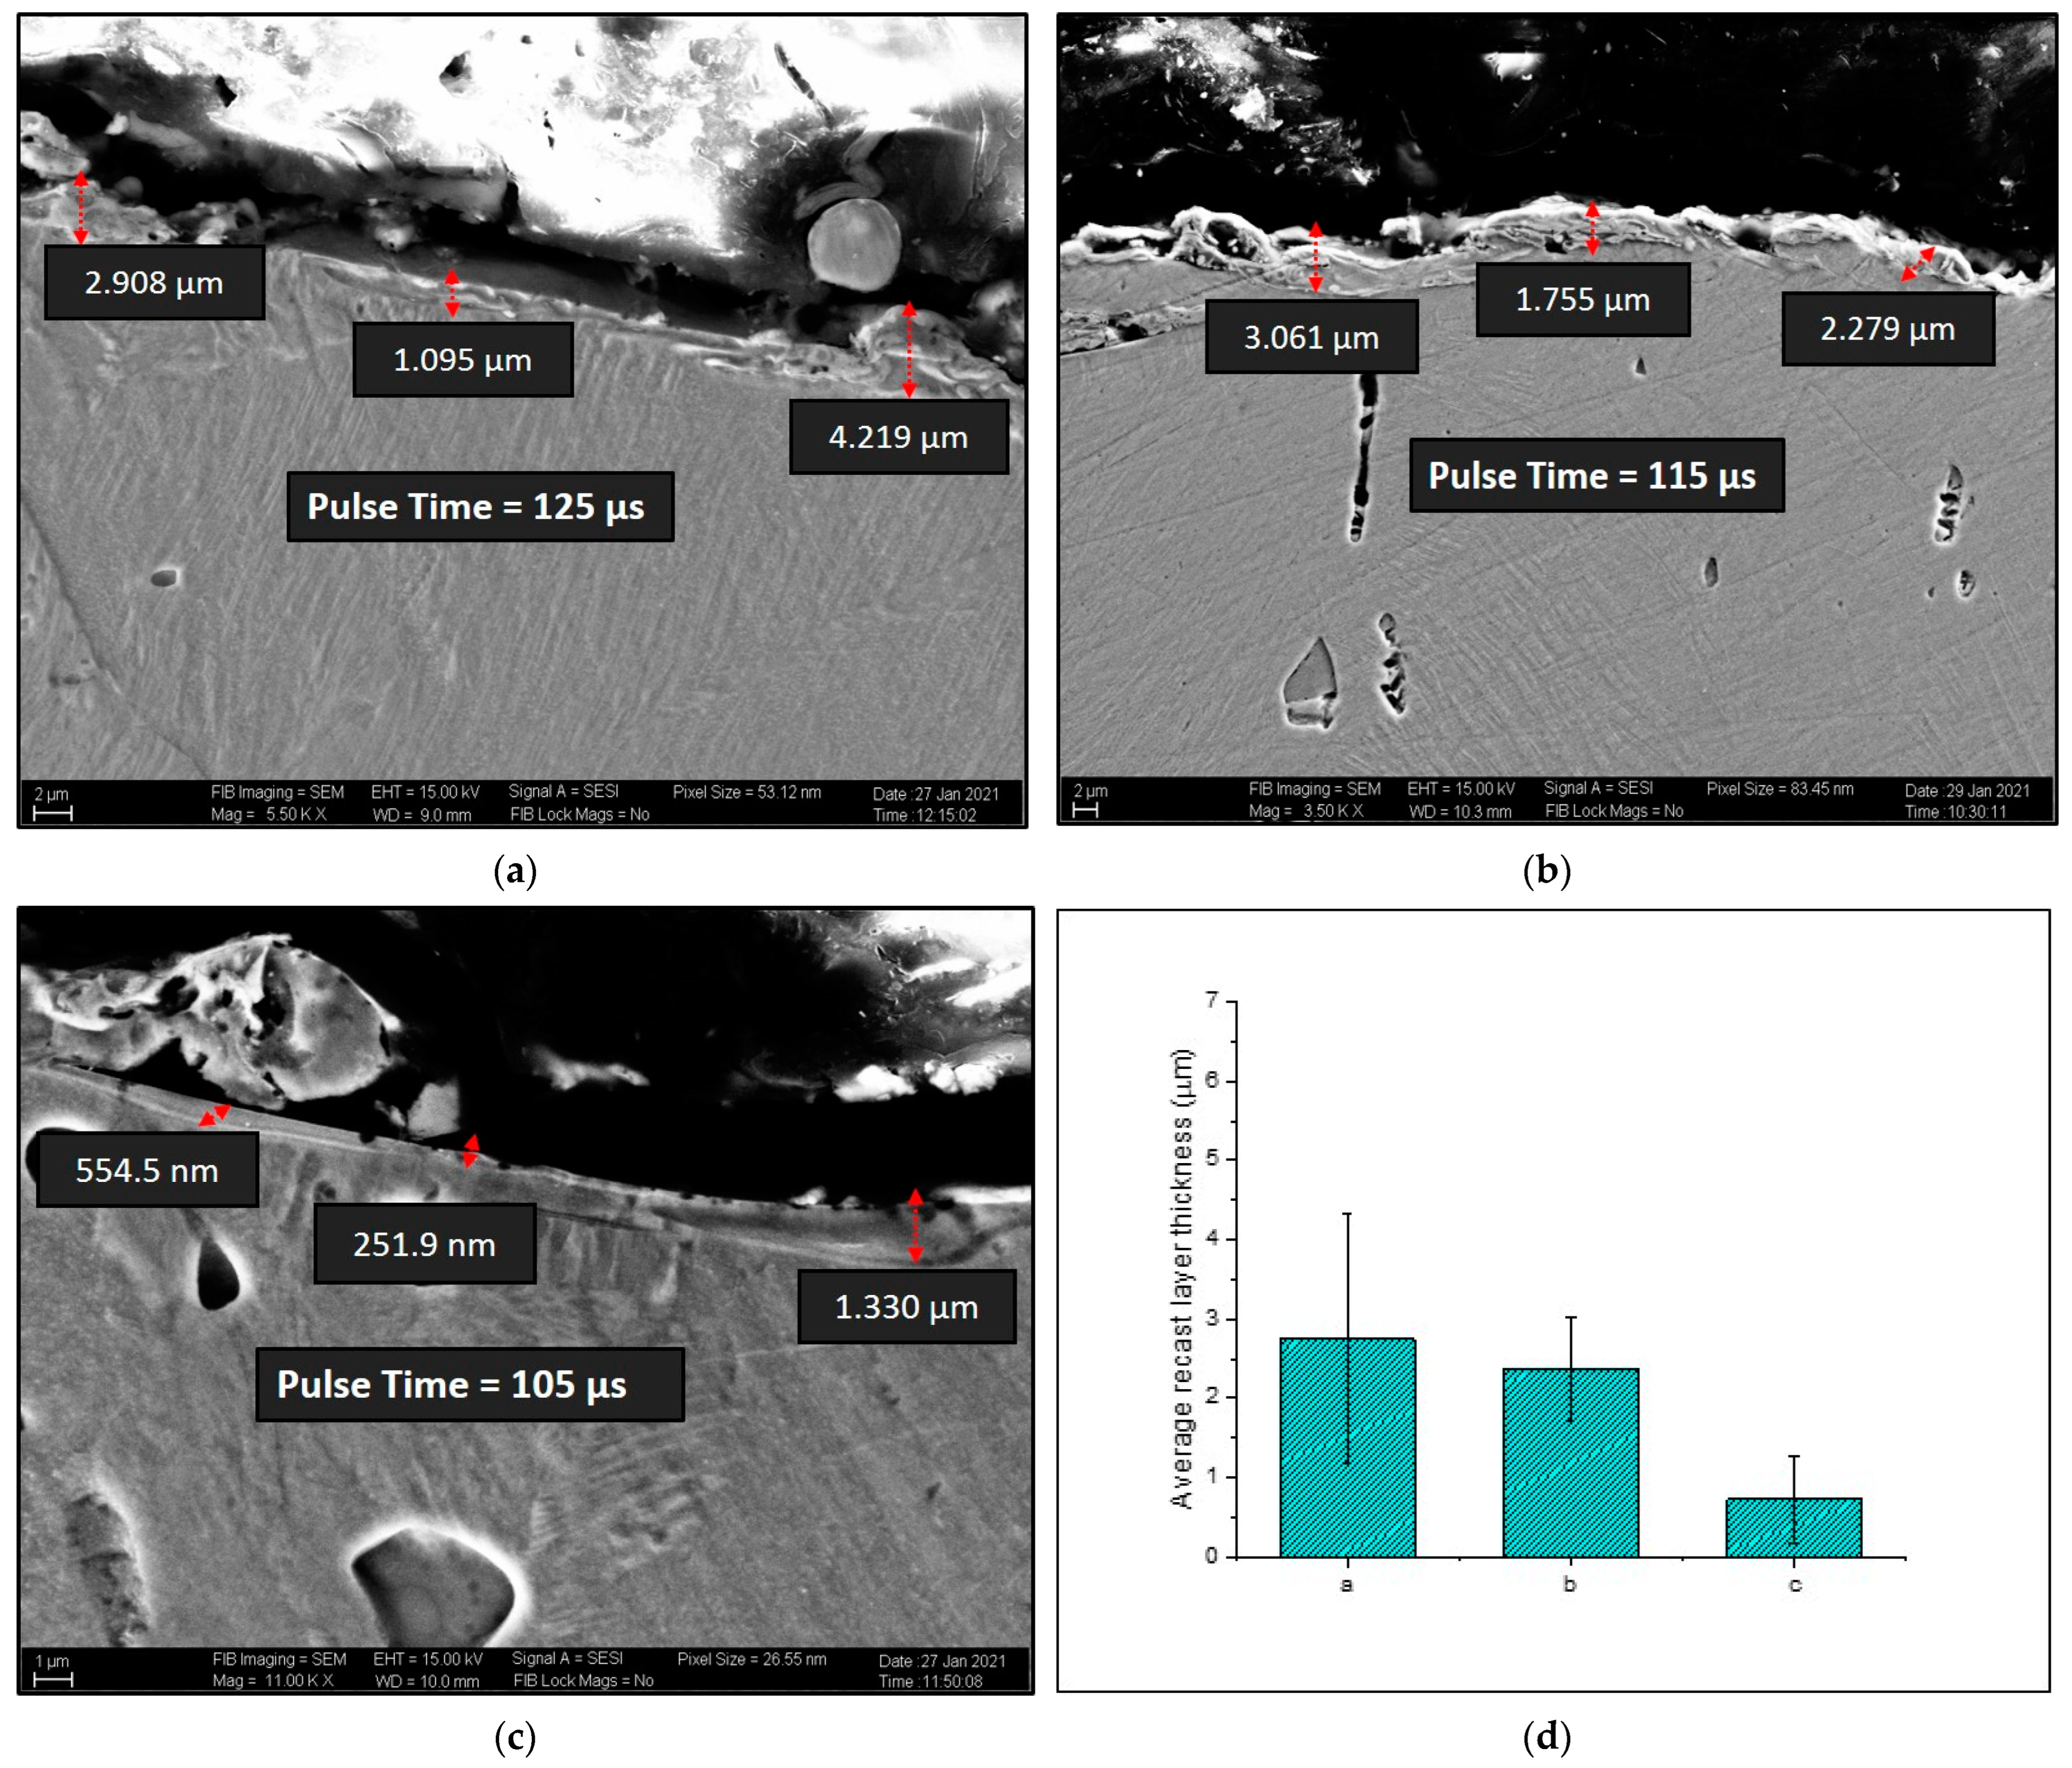
Figure 17 indicates the RLT analysis for the three different pulse time conditions during wire EDM of NiTiNOL using A-type wire as electrode material.

Figure 17.
Recast layer thickness analysis of machined NiTiNOL SMA–A-type electrode: (a) pulse time Ton = 125 µs; (b) pulse time Ton = 115 µs; (c) pulse time Ton = 105 µs; (d) average recast layer thickness of samples machined at Ton = 125 µs, Ton = 115 µs and Ton = 105 µs.
It can be seen in Figure 17a that the RLT formation is almost similar to the RLT seen in Figure 17b, whereas at the lower pulse time as observed in Figure 17c, the RLT is very minimal and in the range of nm. When the pulse time decreases to 115 µs, the average RLT is found to be 2.36 µm and at pulse time 105 µs, the minimal and negligible RLT of just 0.72 µm is observed. Even microvoids, small droplets and resolidified material were also present on the recast layer. Figure 17a–c illustrate that all of the melted material is not removed, and a residue is left over even after the ejection from the dielectric flushing. These residues are lightly welded to the machined surface and hence cause increases in surface hardness and residual stresses.
3.5.5. Comparing the Surface Integrity Performances of Brass, Zn-Coated Brass, DX and DA Electrodes
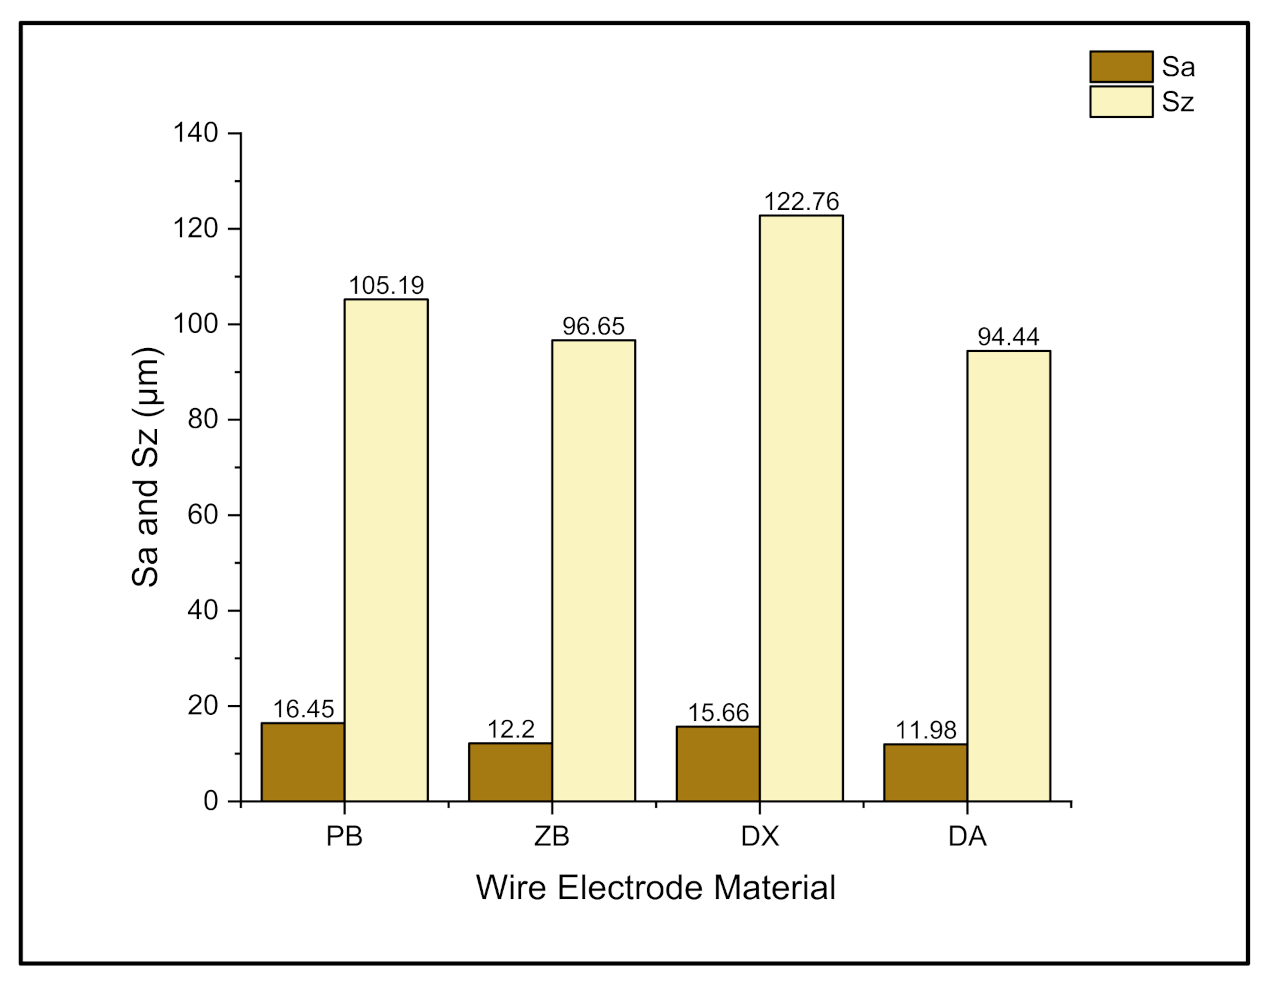
Figure 18 shows the average surface roughness (Sa) and maximum peak height (Sz) of the machined NiTiNOL for all four different electrode materials. The bar chart (Figure 18) clearly shows that the DA electrode gives better results in terms of both Sa and Sz compared to the other three electrode materials. When machined with pulse time of 125 µs, the sparks are very high and the highest erosion of work alloy takes place during the machining process. While machined with a DA electrode, the Sa and Sz are found to be 11.98 µm and 94.44 µm, respectively, which are the least values compared to the performances of other electrode materials. The second-best performance considering the values of Sa and Sz is found to be the performance of Zn-coated brass wire electrode material with Sa and Sz values of 12.20 µm and 96.65 µm, respectively, whereas the other two electrode materials, namely plain brass (PB) and DX wire electrodes, give very high Sa and Sz values when machined with 125 µs of pulse time condition.
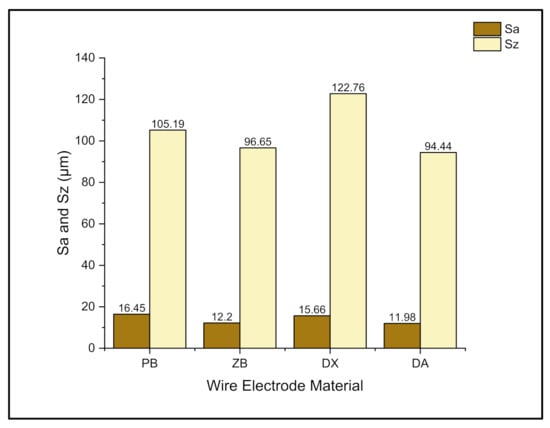
Figure 18.
Sa and Sz for different electrode materials at Ton 125 µs.
The values of Sa and Sz achieved in DA and other electrode materials can be justified using Figure 19, which shows the wire material deposition in terms of weight percentages for different electrode materials at 125 µs of pulse time condition.
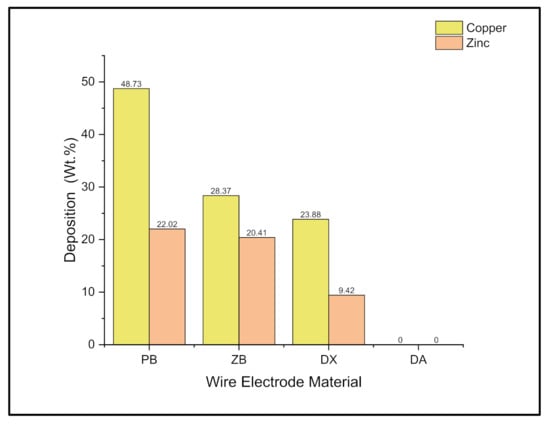
Figure 19.
Wire material deposition on machined alloy for different electrode materials at Ton 125 µs.
It is very much clear from Figure 19 that the copper and zinc contents have not been deposited over the machined alloy when machined with DA wire electrode, whereas huge weight % of copper and zinc depositions can be observed for PB, ZB and DX wire electrode materials.
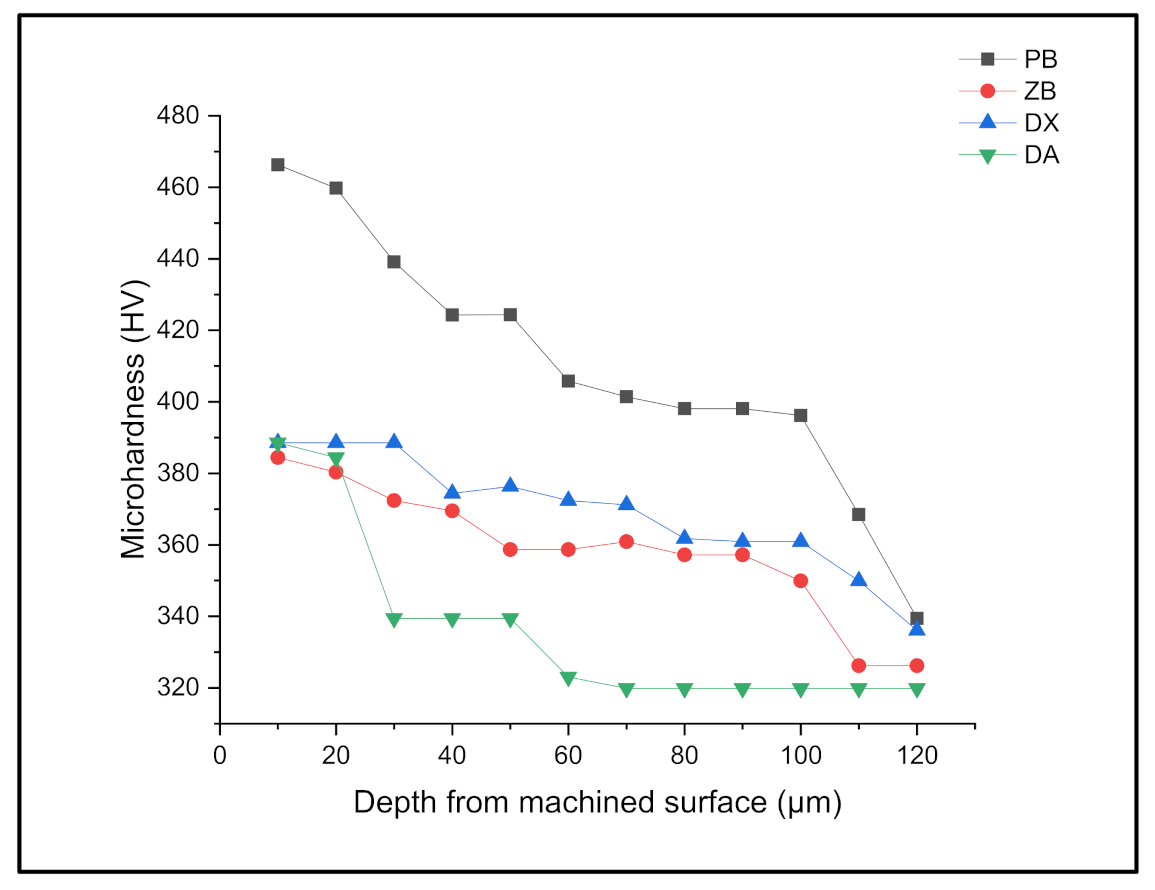
Figure 20 shows MH values of machined NiTiNOL alloy for all four electrode materials at pulse time of 105 µs. All the MH values of alloys machined from four different electrode materials at 105 µs are considered and compared in Figure 20. Out of four electrode materials, the MH values of alloy machined with PB and DX wire electrode materials are found to be high and the MH values of alloys machined with ZBW electrode are medium, whereas MH values of the alloys machined with DA electrode material are found to be the least of all. Although the MH value trends from all four electrode materials are found to be the same, the RLZ and HAZ are observed to be far less in the case of alloys machined with DA electrode.
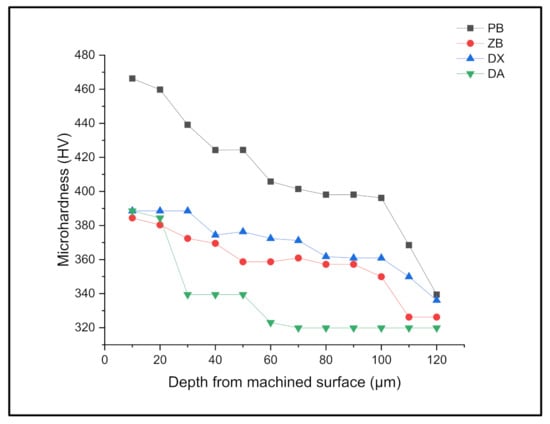
Figure 20.
Microhardness values of alloys machined from different electrode materials at Ton 105 µs.
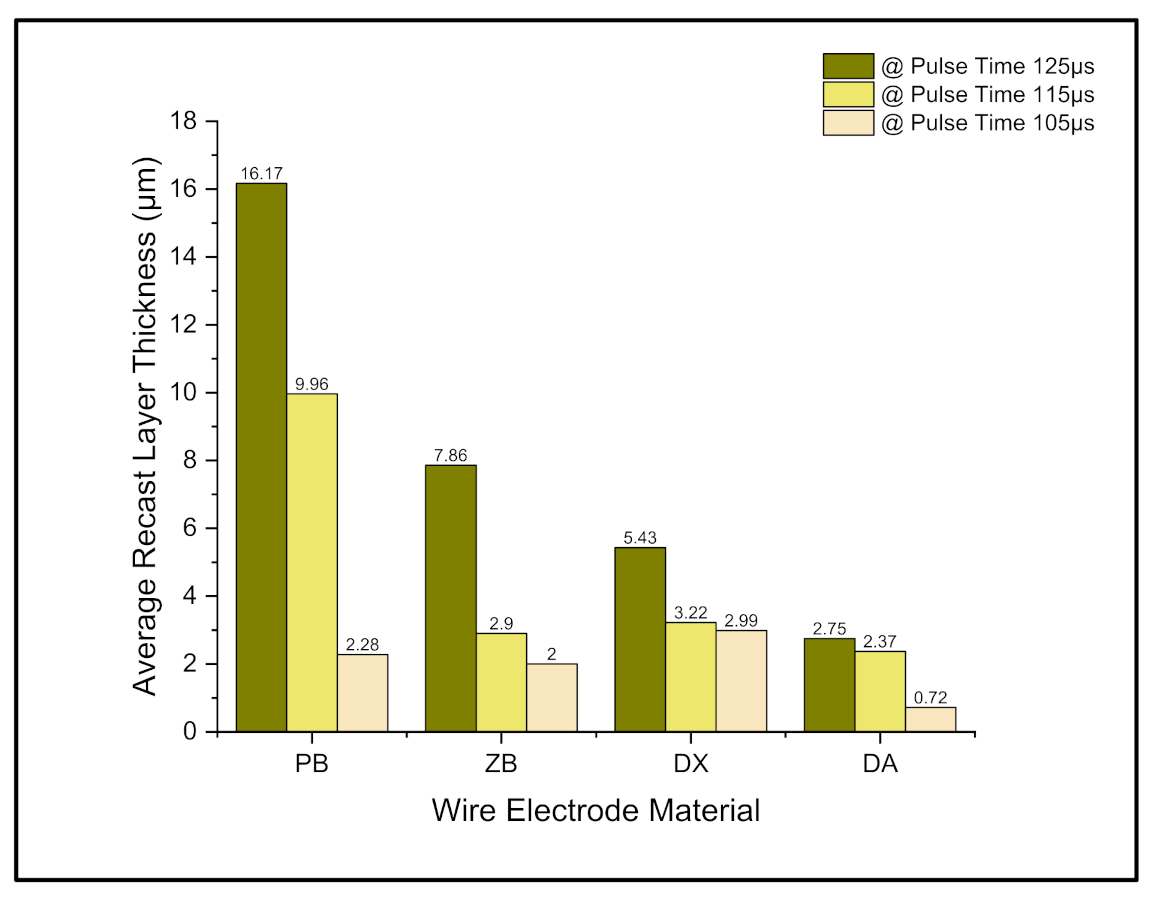
For any biomedical material, not just the surface roughness values matter; the surface and subsurface analysis of the machined alloy is also found to be important. In such a case, looking at the performances of all four different electrode materials, diffusion annealed A-type (DA) electrode material is found to be the better choice. The selection can also be justified from Figure 21, which shows the average RLT of machined NiTiNOL alloys for all four different electrodes and for all three different pulse time conditions. The average RLT in the alloys machined with DA electrode for all three pulse time conditions of 125 µs, 115 µs and 105 µs is found to be the least compared to the average RLT performances of the remaining three electrode materials.

Figure 21.
Average RLT of machined alloy for different electrode materials for all Ton conditions.
4. Conclusions
The wire EDM of NiTiNOL SMA with diffusion annealed coated wires has been studied in the present investigation. RSM models were developed to study the interaction effects of various input process variables on responses like TWR and SR. Detailed surface and subsurface analysis was carried out as a part of surface integrity studies. The experimental deviations were within ±5%. After comparing the performances of diffusion annealed wire electrodes w.r.t. TWR, SR and SI studies, the following are concluded.
- For higher values of pulse and pause times with higher WF rate and lower SV, a very high TWR of 0.07 g/min was observed when NiTiNOL was machined with X-type electrode material.
- Huge wire depositions and larger microcracks were observed on the machined NiTiNOL samples through SEM analysis when X-type wire electrode material was used.
- While machining NiTiNOL SMA, A-type electrodes showed lesser tool wear, as low as 0.0054 g/min for input combinational values of Ton = 105 µs, Toff = 55 µs, WF = 4 m/min and SV = 60 V, also resulting in lower SR (1.17 µm) of the machined sample.
- EDS analysis confirmed the higher depositions of 23.88 wt.% of Cu and 9.42 wt.% of Zn elements of wire electrode onto the machined sample for X-type electrode and no depositions of Cu and Zn were seen when the samples were machined with A-type electrode material.
- X-type diffusion annealed electrode showed the highest MH values for all three pulse time conditions compared to MH values of samples machined with A-type electrode material.
- The peaks and valleys during measurement of average surface roughness of the machined alloy were greater when the alloy was machined with X-type electrode material, with Sa of 15.66 µm and Sz of 122.76 µm compared to A-type electrode material, with Sa and Sz of 11.98 µm and 94.44 µm, respectively, for higher pulse time condition of 125 µs.
- For pulse time of 125 µs, the RLT was found to be high and medium for 115 µs and low for lower pulse time of 105 µs. As the pulse time decreases, the RLT was found to be low for all the samples and the trend was found to be the same for machining of NiTiNOL using all PB, ZB, DX and DA electrode material.
- Average recast layer thickness of NiTiNOL sample machined with A-type electrode materials was found to be much lower, almost 50–80% less than the average RLT of the sample machined with other electrode materials.
- A-type electrode material showed overall better performances for TWR, SR and surface integrity studies compared to the performances of all other electrode materials while machining NiTiNOL medical grade SMA. In the present investigations, the TWR results of A-type material were found to be 45%, 95% and 58% better than the plain brass, Zn-coated brass and X-type electrode materials. As shown in Figure 18, the Sa value of the sample machined with A-type electrode showed 37%, 2% and 31% better results as compared to plain brass, Zn-coated brass and X-type electrode values, respectively. Further, as seen from Figure 21, the average recast layer thickness of alloy machined with A-type electrode was less when compared to the alloys machined with plain brass, Zn-coated brass and X-type electrodes. Therefore, A-type diffusion annealed electrode is found to be a better choice for WEDM of NiTiNOL alloy on the basis of TWR, SR and surface integrity results and analysis.
Author Contributions
Conceptualization, V.N.G. and V.N.K.; methodology, R.S.K., V.N.G. and V.N.K.; software, R.S.K. and V.N.K.; validation, M.M., V.N.K. and V.N.G.; formal analysis, V.N.K.; investigation, V.N.K. and M.M.; resources, J.P.D. and V.N.G.; data curation, V.N.G. and V.N.K.; writing—original draft preparation, V.N.K. and M.M.; writing—review and editing, V.N.G. and R.S.K.; visualization, V.N.K. and M.M.; supervision, J.P.D. and V.N.G.; project administration, V.N.G. and J.P.D. All authors have read and agreed to the published version of the manuscript.
Funding
This research received no external funding.
Institutional Review Board Statement
Not applicable.
Informed Consent Statement
Not applicable.
Data Availability Statement
This study did not report any data.
Acknowledgments
The entire work has been funded by KLE Technological University, INDIA, under the capacity building fund scheme for the year 2020–2021 and we sincerely thank KLE society for the release of funds to carry out the research.
Conflicts of Interest
The authors declare no conflict of interest.
References
- Pelton, A.R.; Dicello, J.; Miyazaki, S. Optimization of processing and properties of medical grade Nitinol wire. Minim. Invasive Allied Technol. 2000, 9, 107–118. [Google Scholar] [CrossRef]
- Kadadevaru, S.G.; Kulkarni, V.N.; Gaitonde, V.N. A Review on Surface Integrity Studies in Machining of Biomedical Alloys. Mater. Today Proc. 2019, 18, 5494–5501. [Google Scholar] [CrossRef]
- Jani, J.M.; Leary, M.; Subic, A.; Gibson, M.A. A review of shape memory alloy research, applications and opportunities. Mater. Des. 2014, 56, 1078–1113. [Google Scholar] [CrossRef]
- Wu, S.K.; Lin, H.C.; Chen, C.C. A study on the machinability of a Ti49. 6Ni50. 4 shape memory alloy. Mater. Lett. 1999, 40, 27–32. [Google Scholar] [CrossRef]
- Lin, H.C.; Lin, K.M.; Chen, Y.C. A study on the machining characteristics of TiNi shape memory alloys. J. Mater. Process. Technol. 2000, 105, 327–332. [Google Scholar] [CrossRef]
- Liu, J.F.; Guo, Y.B.; Butler, T.M.; Weaver, M.L. Crystallography, compositions, and properties of white layer by wire electrical discharge machining of nitinol shape memory alloy. Mater. Des. 2016, 109, 1–9. [Google Scholar] [CrossRef] [Green Version]
- Satish, G.J.; Gaitonde, V.N.; Kulkarni, V.N. Traditional and non-traditional machining of nickel-based superalloys: A brief review. Mater. Today Proc. 2021, 44, 1448–1454. [Google Scholar] [CrossRef]
- Manjaiah, M.; Narendranath, S.; Basavarajappa, S. Review on non-conventional machining of shape memory alloy. Trans. Nonferrous Met. Soc. China 2014, 24, 12–21. [Google Scholar] [CrossRef]
- Sharma, N.; Raj, T.; Jangra, K.K. Parameter optimization and experimental study on wire electrical discharge machining of porous Ni40Ti60 alloy. Proc. Inst. Mech. Eng. B J. Eng. Manuf. 2017, 231, 956–970. [Google Scholar] [CrossRef]
- Takale, A.M.; Chougule, N.K. Effect of wire electro discharge machining process parameters on surface integrity of Ti49. 4Ni50. 6 shape memory alloy for orthopedic implant application. Mater. Sci. Eng. C 2019, 97, 264–274. [Google Scholar] [CrossRef]
- Liu, J.F.; Guo, Y.B. Process capability of wire-EDM of NiTi shape memory alloy at main cut and trim cut modes. Procedia Manuf. 2015, 1, 904–914. [Google Scholar] [CrossRef] [Green Version]
- Manjaiah, M.; Narendranath, S.; Basavarajappa, S.; Gaitonde, V.N. Wire electric discharge machining characteristics of titanium nickel shape memory alloy. Trans. Nonferrous Met. Soc. China 2014, 24, 3201–3209. [Google Scholar] [CrossRef]
- Bisaria, H.; Shandilya, P. Experimental studies on electrical discharge wire cutting of Ni-rich NiTi shape memory alloy. Mater. Manuf. Process. 2018, 33, 977–985. [Google Scholar] [CrossRef]
- Soni, H.; Ramesh, M.R. Effects of wire electro-discharge machining process parameters on the machined surface of Ti50Ni49Co1 shape memory alloy. Silicon 2019, 11, 733–739. [Google Scholar] [CrossRef]
- Kulkarni, V.N.; Gaitonde, V.N.; Karnik, S.R.; Manjaiah, M.; Davim, J.P. Performance studies on wire electric discharge machining of medical grade nickel titanium (niti) shape memory alloy. J. Manuf. Technol. Res. 2019, 11, 101–120. [Google Scholar]
- Daneshmand, S.; Hessami, R.; Esfandiar, H. Investigation of wire electro discharge machining of Nickel-Titanium shape memory alloys on surface roughness and MRR. Life Sci. 2012, 9, 2904–2909. [Google Scholar]
- Lotfi Neyestanak, A.A.; Daneshmand, S. The effect of operational cutting parameters on Nitinol-60 in wire electro discharge machining. Adv. Mater. Sci. Eng. 2013, 2013, 1–6. [Google Scholar] [CrossRef] [Green Version]
- Manjaiah, M.; Narendranath, S.; Basavarajappa, S.; Gaitonde, V.N. Effect of electrode material in wire electro discharge machining characteristics of Ti50Ni50− xCux shape memory alloy. Precis. Eng. 2015, 41, 68–77. [Google Scholar] [CrossRef]
- Kulkarni, V.N.; Gaitonde, V.N.; Karnik, S.R.; Manjaiah, M.; Davim, J.P. Machinability Analysis and Optimization in Wire EDM of Medical Grade NiTiNOL Memory Alloy. Materials 2020, 13, 2184. [Google Scholar] [CrossRef]
- Kulkarni, V.N.; Gaitonde, V.N.; Nalavade, K.S.; Doddamani, M.; Naik, G.M. Optimization of Wire EDM Process Parameters for Medical Grade Nickel Titanium Shape Memory Alloy. Stroj. J. Mech. Eng. 2020, 70, 69–80. [Google Scholar] [CrossRef]
- Kulkarni, V.N.; Gaitonde, V.N.; Aiholi, V.; Hadimani, V. Multi performance characteristics optimization in wire electric discharge machining of nitinol superelastic alloy. Mater. Today Proc. 2018, 5, 18857–18866. [Google Scholar] [CrossRef]
- Zeng, Q.; Qin, Y.; Chang, W.; Luo, X. Correlating and evaluating the functionality-related properties with surface texture parameters and specific characteristics of machined components. Int. J. Mech. Sci. 2018, 149, 62–72. [Google Scholar] [CrossRef]
- Czifra, Á.; Barányi, I. Sdq-Sdr Topological Map of Surface Topographies. Front. Mech. Eng. 2020, 6, 50. [Google Scholar] [CrossRef]
- Dijmărescu, M.R.; Abaza, B.F.; Voiculescu, I.; Dijmărescu, M.C.; Ciocan, I. Surface Roughness Analysis and Prediction with an Artificial Neural Network Model for Dry Milling of Co–Cr Biomedical Alloys. Materials 2021, 14, 6361. [Google Scholar] [CrossRef] [PubMed]
- Tavakoli, J.; Khosroshahi, M.E. Surface morphology characterization of laser-induced titanium implants: Lesson to enhance osseointegration process. Biomed. Eng. Lett. 2018, 8, 249–257. [Google Scholar] [CrossRef]
- Baş, D.; Boyacı, I.H. Modeling and optimization I: Usability of response surface methodology. J. Food Eng. 2007, 78, 836–845. [Google Scholar] [CrossRef]
- Myers, R.H.; Montgomery, D.C.; Anderson-Cook, C.M. Response Surface Methodology: Process and Product Optimization Using Designed Experiments; John Wiley & Sons: Hoboken, NJ, USA, 2016. [Google Scholar]


Publisher’s Note: MDPI stays neutral with regard to jurisdictional claims in published maps and institutional affiliations. |
© 2022 by the authors. Licensee MDPI, Basel, Switzerland. This article is an open access article distributed under the terms and conditions of the Creative Commons Attribution (CC BY) license (https://creativecommons.org/licenses/by/4.0/).