Article

Experimental Methods for Evaluating Components of Turbomachinery, for Use in Automotive Fuel Cell Applications

Institut für Fahrzeugbau (IFBW), Ostfalia University of Applied Sciences, 38440 Wolfsburg, Germany
*
Author to whom correspondence should be addressed.
Machines 2022, 10(3), 177; https://doi.org/10.3390/machines10030177
Submission received: 15 December 2021 / Revised: 15 February 2022 / Accepted: 22 February 2022 / Published: 27 February 2022
(This article belongs to the Special Issue High Speed Air Compressor for a Fuel Cell System for Use in a Vehicle)

Abstract

:
This paper describes methods and test beds for components of turbomachinery, for use in automotive fuel cell applications at the Ostfalia University of applied sciences. Turbomachinery for use in fuel cell applications is subject to different requirements than those of conventional turbochargers. Therefore, the turbine and the air bearings of an electrical turbocharger will be subject to evaluation. The different boundary conditions in comparison to conventional turbochargers, with less heat and high humidity from the fuel cell, are especially of interest. Air bearings affect the friction and the vibrations/oscillations of the shaft. The methods and test beds need to fulfill the requirements of these types of turbomachinery. The friction test bed is modified with a new coupling solution, to ensure that the driving electric motor in combination with the shaft of the test component complies with the strict tolerances. For this, a magnetic coupling, for use in high-speed applications, is developed and tested on the friction test bed. The fuel cell turbine was adapted to the hot gas test bed and extended turbine maps are determined. To reach high humidity conditions of a fuel cell application, a water injection system is integrated into the test bed.

1. Introduction

“The European Commission calls for a climate neutral Europe by 2050”. The EU policies and Paris Agreement goal is to lower overall emissions and keep the temperature increase well below 2 °C [1]. This target includes the whole transport sector; it covers cars and trucks for private or commercial use. The upcoming emission regulations focus on a socially and environmentally sustainable use of resources, which includes an increase in efficiency of current engines. Up until now the increased efficiency of combustion engines was realized through the combination of turbocharging and downsizing to eliminate the loss of power. Aside of battery electric vehicles (BEV), the research of alternative fuels and systems is necessary to adhere to future emissions standards. To realize these goals, the research of fuel cell systems (FCS) for cars and trucks has increased in recent years. The first manufacturers to offer cars with fuel cell systems are Honda, Hyundai and Toyota [2].
A fuel cell system is different from a conventional combustion engine and has other boundary conditions. To function properly, the fuel cell benefits from a certain amount of compressed air and mass flow. This is achieved with a compressing component. The focus of research for the fuel cell air system (FCAS) lies in the use of enthalpy energy through a turbine wheel, the integration of an electric motor and a spiral groove air bearing system.
With an integrated turbine wheel, a part of the exhaust gas enthalpy of the fuel cell can be converted into mechanical energy. This energy can be used to reduce the necessary power of the electric machine to propel the compressor and results in an overall improved efficiency of the FCAS [3,4,5,6,7,8,9,10,11,12]. A literature survey shows that only little experimental research is done on the determination of friction losses and rotor dynamics of complete FCA Systems; most of the research is focused on exhaust gas turbochargers for ICE. In this research project, the Ostfalia University of Applied Sciences is to measure the rotor dynamics in stationary and transient operation on its dynamic test bench. Based on these measurement results, simulations of the FCAS can be refined and an overall design of the shaft with a turbine wheel can be achieved and used for further designs. As part of the research work, the friction power is to be measured under real temperature, pressure and humidity conditions. Orbital diagrams, rotor vibrations and system accelerations can be measured using eddy current and acceleration sensors. For the evaluation, the gap height in the axial and radial bearing, as well as friction power or bearing friction torque can be calculated from the measured values. Furthermore, on Ostfalia’s electric hot gas test stand, the turbine is subjected to a flow of moist air and braked by an electric high-speed generator. The torque can be recorded highly dynamically, for example, in the event of load jumps or test cycles. The turbine can thus be mechanically tested and thermodynamically evaluated under real conditions. The research of this project can contribute to a better understanding of the rotor dynamics and thermodynamic behavior of state-of-the art FCAS.
Therefore, the friction test bed (FTB) and hot gas test bench (HGTB) for turbochargers need to be adapted to the boundary conditions of the FCAS. These adaptations and experimental methods are described in Section 2. In Section 3 the results of a new coupling system for the FTB and the conclusions of the first measurements of a turbine for FCAS on the HGTB are discussed.

2. Materials and Methods

Simulations and different test procedures can lead to greater efficiency of machines. Turbomachinery, especially turbochargers, are very complex with transient flow processes, for example, heat and flow transfers. There are correlations between the turbocharger and the combustion engine, like the pulsating air flow of the exhaust gases. This section specifies the test beds for turbomachinery at the Ostfalia University.

2.1. Friction Test Bed-FTB

Friction itself is omnipresent everywhere. Friction causes energy losses, wear and tear, friction-induced vibrations and therefore noise, vibration and harshness (NVH). In relation to the subject of turbomachinery, there are studies about friction pairs and tribological behavior of material pairings. The frictional coefficient is described as the quotient of tangential and the specific normal force, it has a crucial effect on the stability of a system. Under real conditions, this coefficient is highly transient and does not reach a steady state. Therefore, the friction test bed takes measurements of the turbomachinery under close to real boundary conditions, without the transient flow losses.
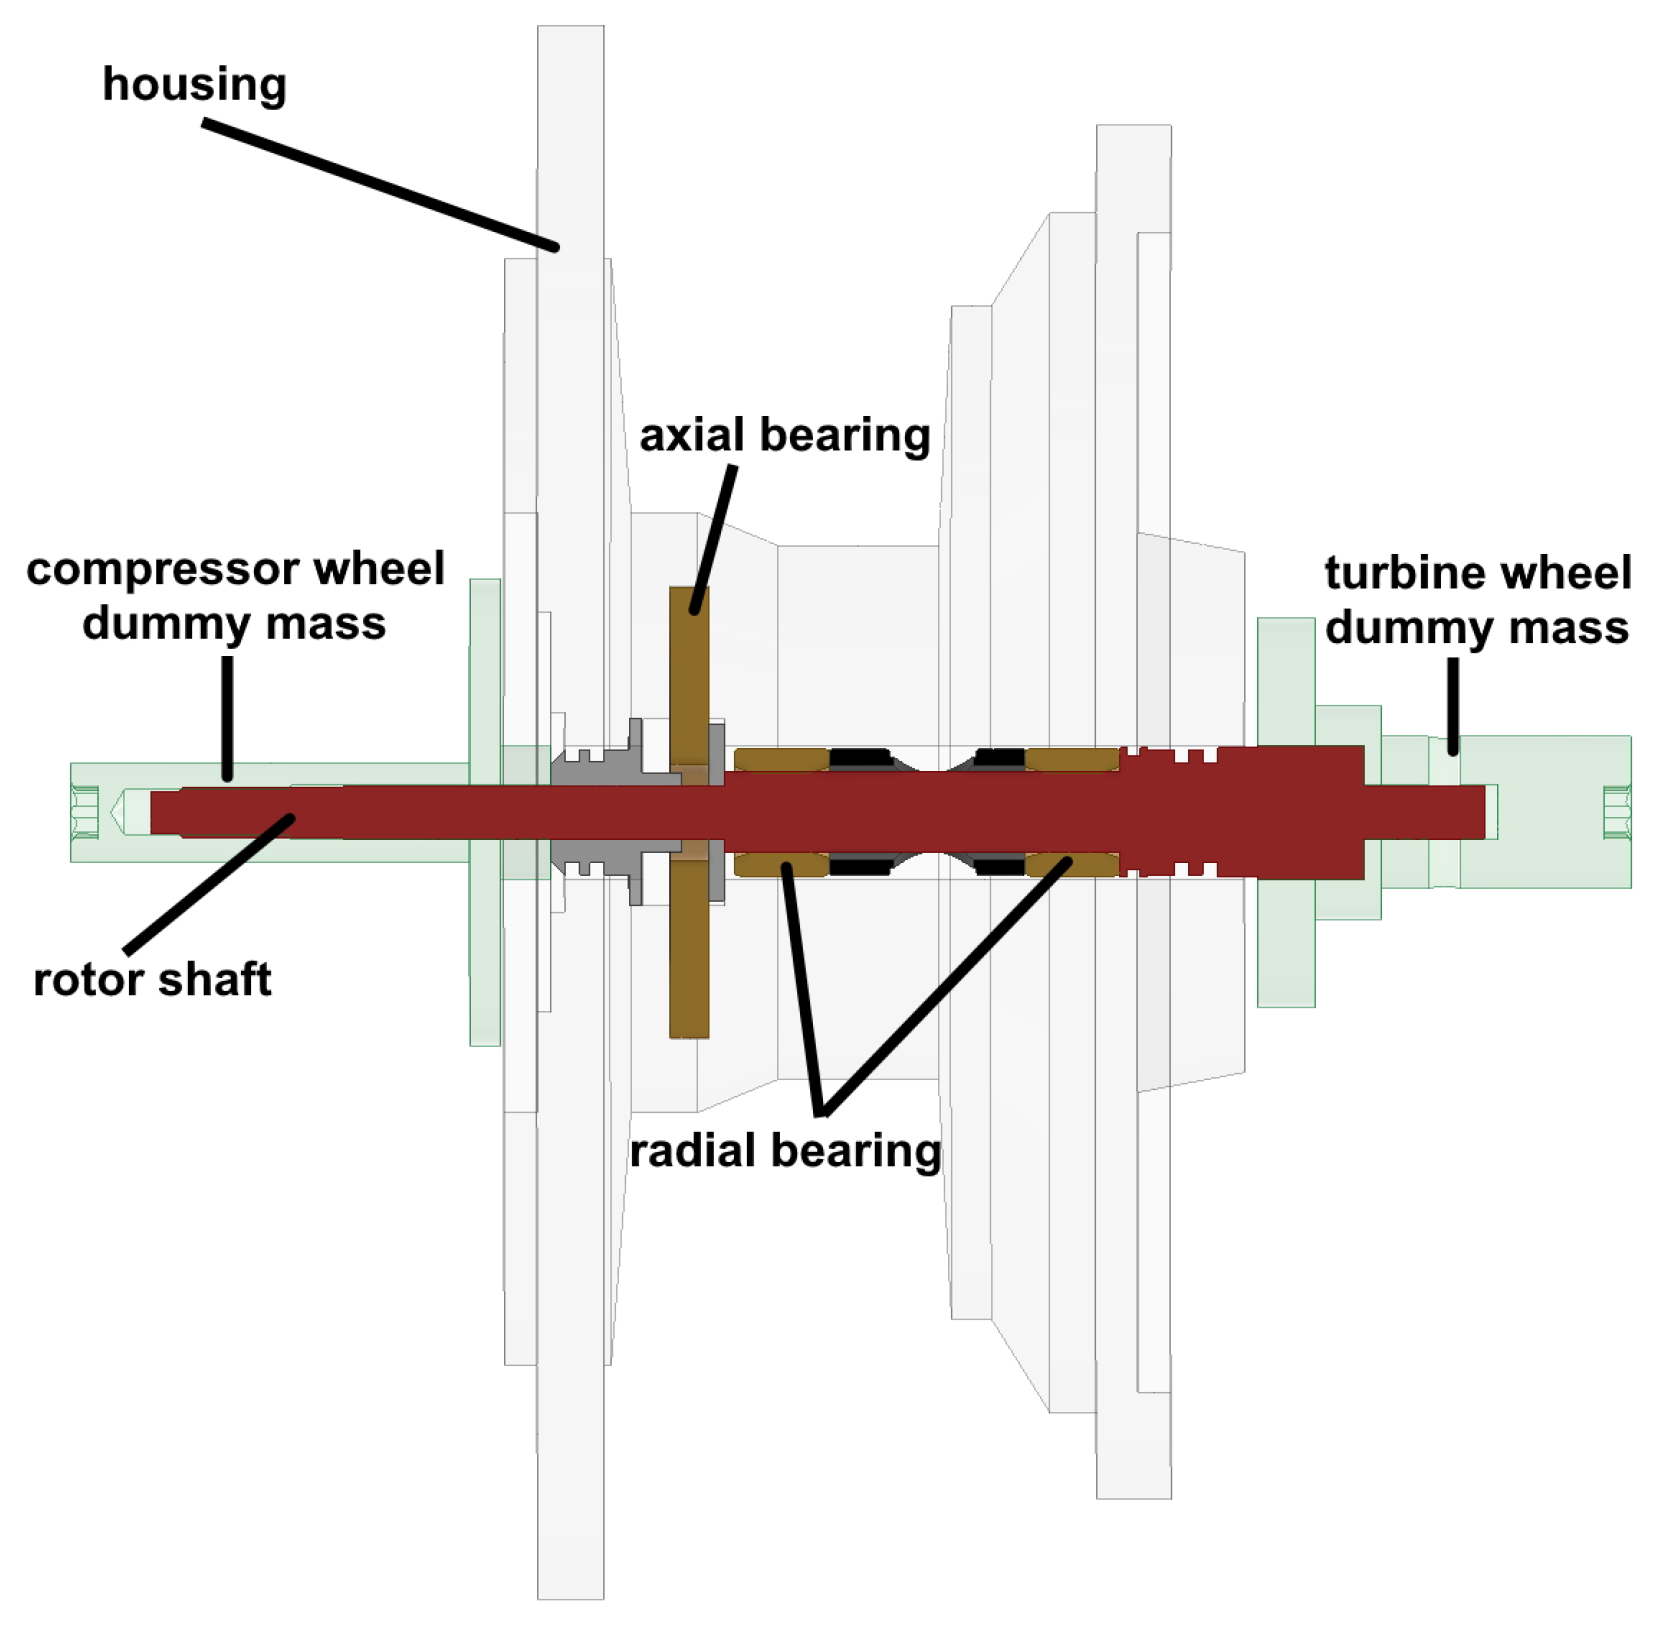
Only a select few state of the art bearing solutions are applied for modern turbomachinery applications. Turbochargers and similar turbomachinery predominantly apply oil bearings, the most common are radial fully floating bearings or single piece fixed floating bearings. For reference measurements, the Ostfalia uses a turbocharger by BorgWarner of the type BV35, which has a radial fully floating bearing, see Figure 1.
The market shows a slow shift towards alternative bearing systems, such as rolling bearings or air bearings. The fluid of oil and air bearings is not only lubricating but also has a dampening effect, which is very useful for stabilization and alignment of the rotor shaft. In comparison, the viscosity of air is around 17 µPas, which is about 500 times less than oil at 100 °C with a viscosity-class of SAE30. To get an impression of the three mentioned bearing systems, Figure 2 shows the friction power in contrast to a simulated start up procedure at different rotor speeds [3].
Air bearings are commonly used where contamination with other lubricants is not desired, like in an FCS. To achieve the dampening effect, air bearings have characteristically narrow rotor dynamic requirements due to the very tight tolerances.
To get a better understanding of the interferences and influences of bending and torsion modes, it is necessary to investigate the rotor dynamics. Grouped under this headline are the vibrations, resonance/critical frequencies and movements of the shaft or rather the whole system. A rotor shaft is not infinitely rigid, under circumstances it is able to bend or move independently. The bearings of a flexible rotor can be assumed as dampers and springs of the system. Certain frequencies of rotation contribute to critical vibrations [13]. CAD/CAE and FEA software can analyze these complex systems during the design process, although mostly under simplified assumptions and boundary conditions, this approach is taken to avoid damage to the system.
Figure 3 shows scaled, exemplary critical frequencies of the BW BV35 used on the FTB. The Ostfalia uses this method to check for potential influences for evaluation with the FTB and HGTB, at the stage of designing the dummy masses. The first critical resonance frequency of this shaft is at 623 Hz which equals 37,000 min−1, where the compressor side bends slightly. At 1413 Hz which equals 85,000 min−1, the compressor mass expands. These analyses are used to design the turbine/compressor dummy masses (TDM/CDM) and to detect and verify critical vibrations.
Special attention needs to be taken to the start-up behavior, lift off, stabilization and the alignment of the shaft when considering measurements of turbomachinery. Besides this, the differences and best operating conditions of a bearing system can be measured by the FTB. The setup and adaptations of the friction test bed are explained in the next section.

2.1.1. FTB Setup and Adaptations

The friction test bed consists of five major parts. First an electric motor is used to drive the shaft assembly and to eliminate the transient flow influences, that normally occur when hot gas is used to propel the shaft with a turbine. The electric motor has a nominal rotational speed of 100,000 min−1 and 0.04 Nm of torque.
Second, there is a coupling between the electric motor and shaft. This is a mandatory part of the test bed. The evaluation results of different coupling solutions are discussed in Section 3.
Next there is the housing of the turbomachinery for the bearing system and the shaft assembly, with dummy masses for compressor and turbine wheels. To reduce influences of the turbine and/or compressor wheel, dummy masses with similar characteristics, such as weight, center of gravity and moment of inertia are essential. Figure 4 shows exemplary dummy masses for a compressor and a turbine wheel, with integrated holes to insert balancing masses.
In addition, there are two integrated systems for water cooling the electric motor and, if necessary, the turbomachinery, as well as an oil conditioning system integrated into the test bed with indirect heating and circulation systems to provide pressurized and temperature-controlled oil for machines with oil bearings.
Sensors are applied to measure temperatures and mass flow of the liquids. Furthermore, strain gauges for torque and axial forces as well as acceleration sensors for vibrations and displacement sensors for two dimensions are used to measure shaft dynamics. This enables the FTB to measure not only orbital movements and shaft dynamics at high rotor speeds, but also frictional losses under real conditions, regardless of the bearing systems used. The measurements are performed with minimal losses of heat flow and other flow phenomena. The schematics of the friction test bed are shown in Figure 5.
With the FTB it is possible to measure applied axial forces in operation. There are a variety of different application methods of axial force, ranging from manually applying the force though the coupling by pushing the electric motor, up to specifically designed pressure housings for the dummy masses and electromagnetic solutions. At the time of writing these methods are in their final phases of evaluation and depend on turbomachinery and bearing system. The axial force solution influences the design of the dummy masses. In the next section follow the mathematical basics for the FTB.

2.1.2. Mathematical Methods of FTB

Due to the utilization of machined and unbalanced dummy masses for the compressor and turbine wheels, it is of importance to balance the new shaft assembly, so that an acceptable level of balancing quality can be achieved. The balancing quality G is determined according to the DIN ISO 21940-11: 2017 with the following equation, by dividing the imbalance U by the mass of the rotating assembly m and multiplying with the angular frequency ω [14]:
G = U m · ω .
For turbochargers, the balancing quality should be below G = 6.3 , for other fast rotating machines like turbo blowers or compressors (with air bearing for instance) it should be below G = 2.5 .
The initial balancing is conducted with rotational speeds below 20,000 min−1 on the friction test bed. This is required to realize higher speeds without causing damage to the bearings of the machine.
The final balancing of the full assembly at high rotational speeds is also conducted on the friction test bed. The process for balancing the assembly is based on the numerical balancing approach introduced by MacDuff and Curreri for operational balancing of rotating assemblies. Which based on polar multiplication and addition of complex numbers.
For balancing the rotating assembly, the shaft displacement and the acceleration is measured in two planes, these planes are the balancing planes on the turbine and compressor dummy masses.
The balancing procedure consists of three steps and can be repeated multiple times until a satisfactory balancing quality is obtained. In the first step the angle and amplitudes of the displacement or the acceleration of the rotating assembly are being measured. These measurements for the turbine dummy mass L ̲ ^ and for the compressor dummy mass R ̲ ^ are the basis for calculating the imbalance of the rotating assembly. After the initial run there are measurements conducted for the second and third run with trial weights. These trial weights are additional imbalances that are added to the rotating assembly. The first imbalance K ^ 1 is added to the turbine dummy mass for the second run, which results in the measurements L ̲ ^ 1 and R ̲ ^ 1 . Afterwards the first imbalance is removed and the second imbalance K ^ 2 is added to the compressor dummy mass. The third run results in the measurements for L ̲ ^ 2 and R ̲ ^ 2 , the total imbalance in each plane can be calculated with the following equations:
A U ̲ ^ 1 = R ^ L ^ ̲ 2 L ^ R ^ ̲ 2 R ̲ ^ L ̲ ^ 2 L ̲ ^ 1 R ̲ ^ 1 L ̲ ^ 2 L ̲ ^ + R ̲ ^ 2 L ̲ ^ 1 L ̲ ^ K ^ 1
A U ̲ ^ 2 = L ^ R ^ ̲ 1 R ^ L ^ ̲ 1 R ̲ ^ L ̲ ^ 2 L ̲ ^ 1 R ̲ ^ 1 L ̲ ^ 2 L ̲ ^ + R ̲ ^ 2 L ̲ ^ 1 L ̲ ^ K ^ 2 .
For the primary purpose of the FTB, the friction power is calculated based on the measured reactionary torque of the electric motor used to propel the shaft assembly. The following equation is used to calculate the friction power P f r i c t i o n :
P f r i c t i o n = M f r i c t i o n · n m a c h i n e · 2 π .
The reactionary torque M f r i c t i o n of the electric motor is measured by a torque sensor, which is equipped with four strain gauges. The resistances of these strain gauges are connected as a Wheatstone bridge by the measuring equipment, the corresponding torque values are calculated. The rotational speed n m a c h i n e of the electric motor is measured by the control electronics.
Additionally, the effective power of the electric motor is used in comparison with the friction power to ensure plausibility. In the next section follows the explanation of the hot gas test bed.

2.2. Hot Gas Test Bed-HGTB

To determine and categorize compressor or turbine wheels of turbomachinery and their overall efficiency, maps are used to describe their functionality, mostly with mass flow, pressure (ratio) and in relation to efficiency. For turbines, these maps are not normed or fully standardized. There are guidelines such as SAE J922 [15] or SAE J1826 [5], but these do not describe the exact setup of the test bench or the precise locations for sensors. This leaves them only as recommendations [4].
In practice, turbomachinery is subject to various and very complex influences that impact efficiency during the generation of maps. Thermodynamic and aerodynamic phenomena cause transient flow processes, that include heat and flow transfers and correlate within the used system [6]. Therefore, the general set up of the system, the boundary conditions, automation and instrumentation can influence the measurements, see Figure 6. The influencing factors include but are not limited to the ambient conditions, the adjustment and control mechanisms, the system boundaries and the geometric properties of the measuring tubes, the properties of the turbomachinery, the external influence of measurements methods and equipment and general measuring uncertainties [7].
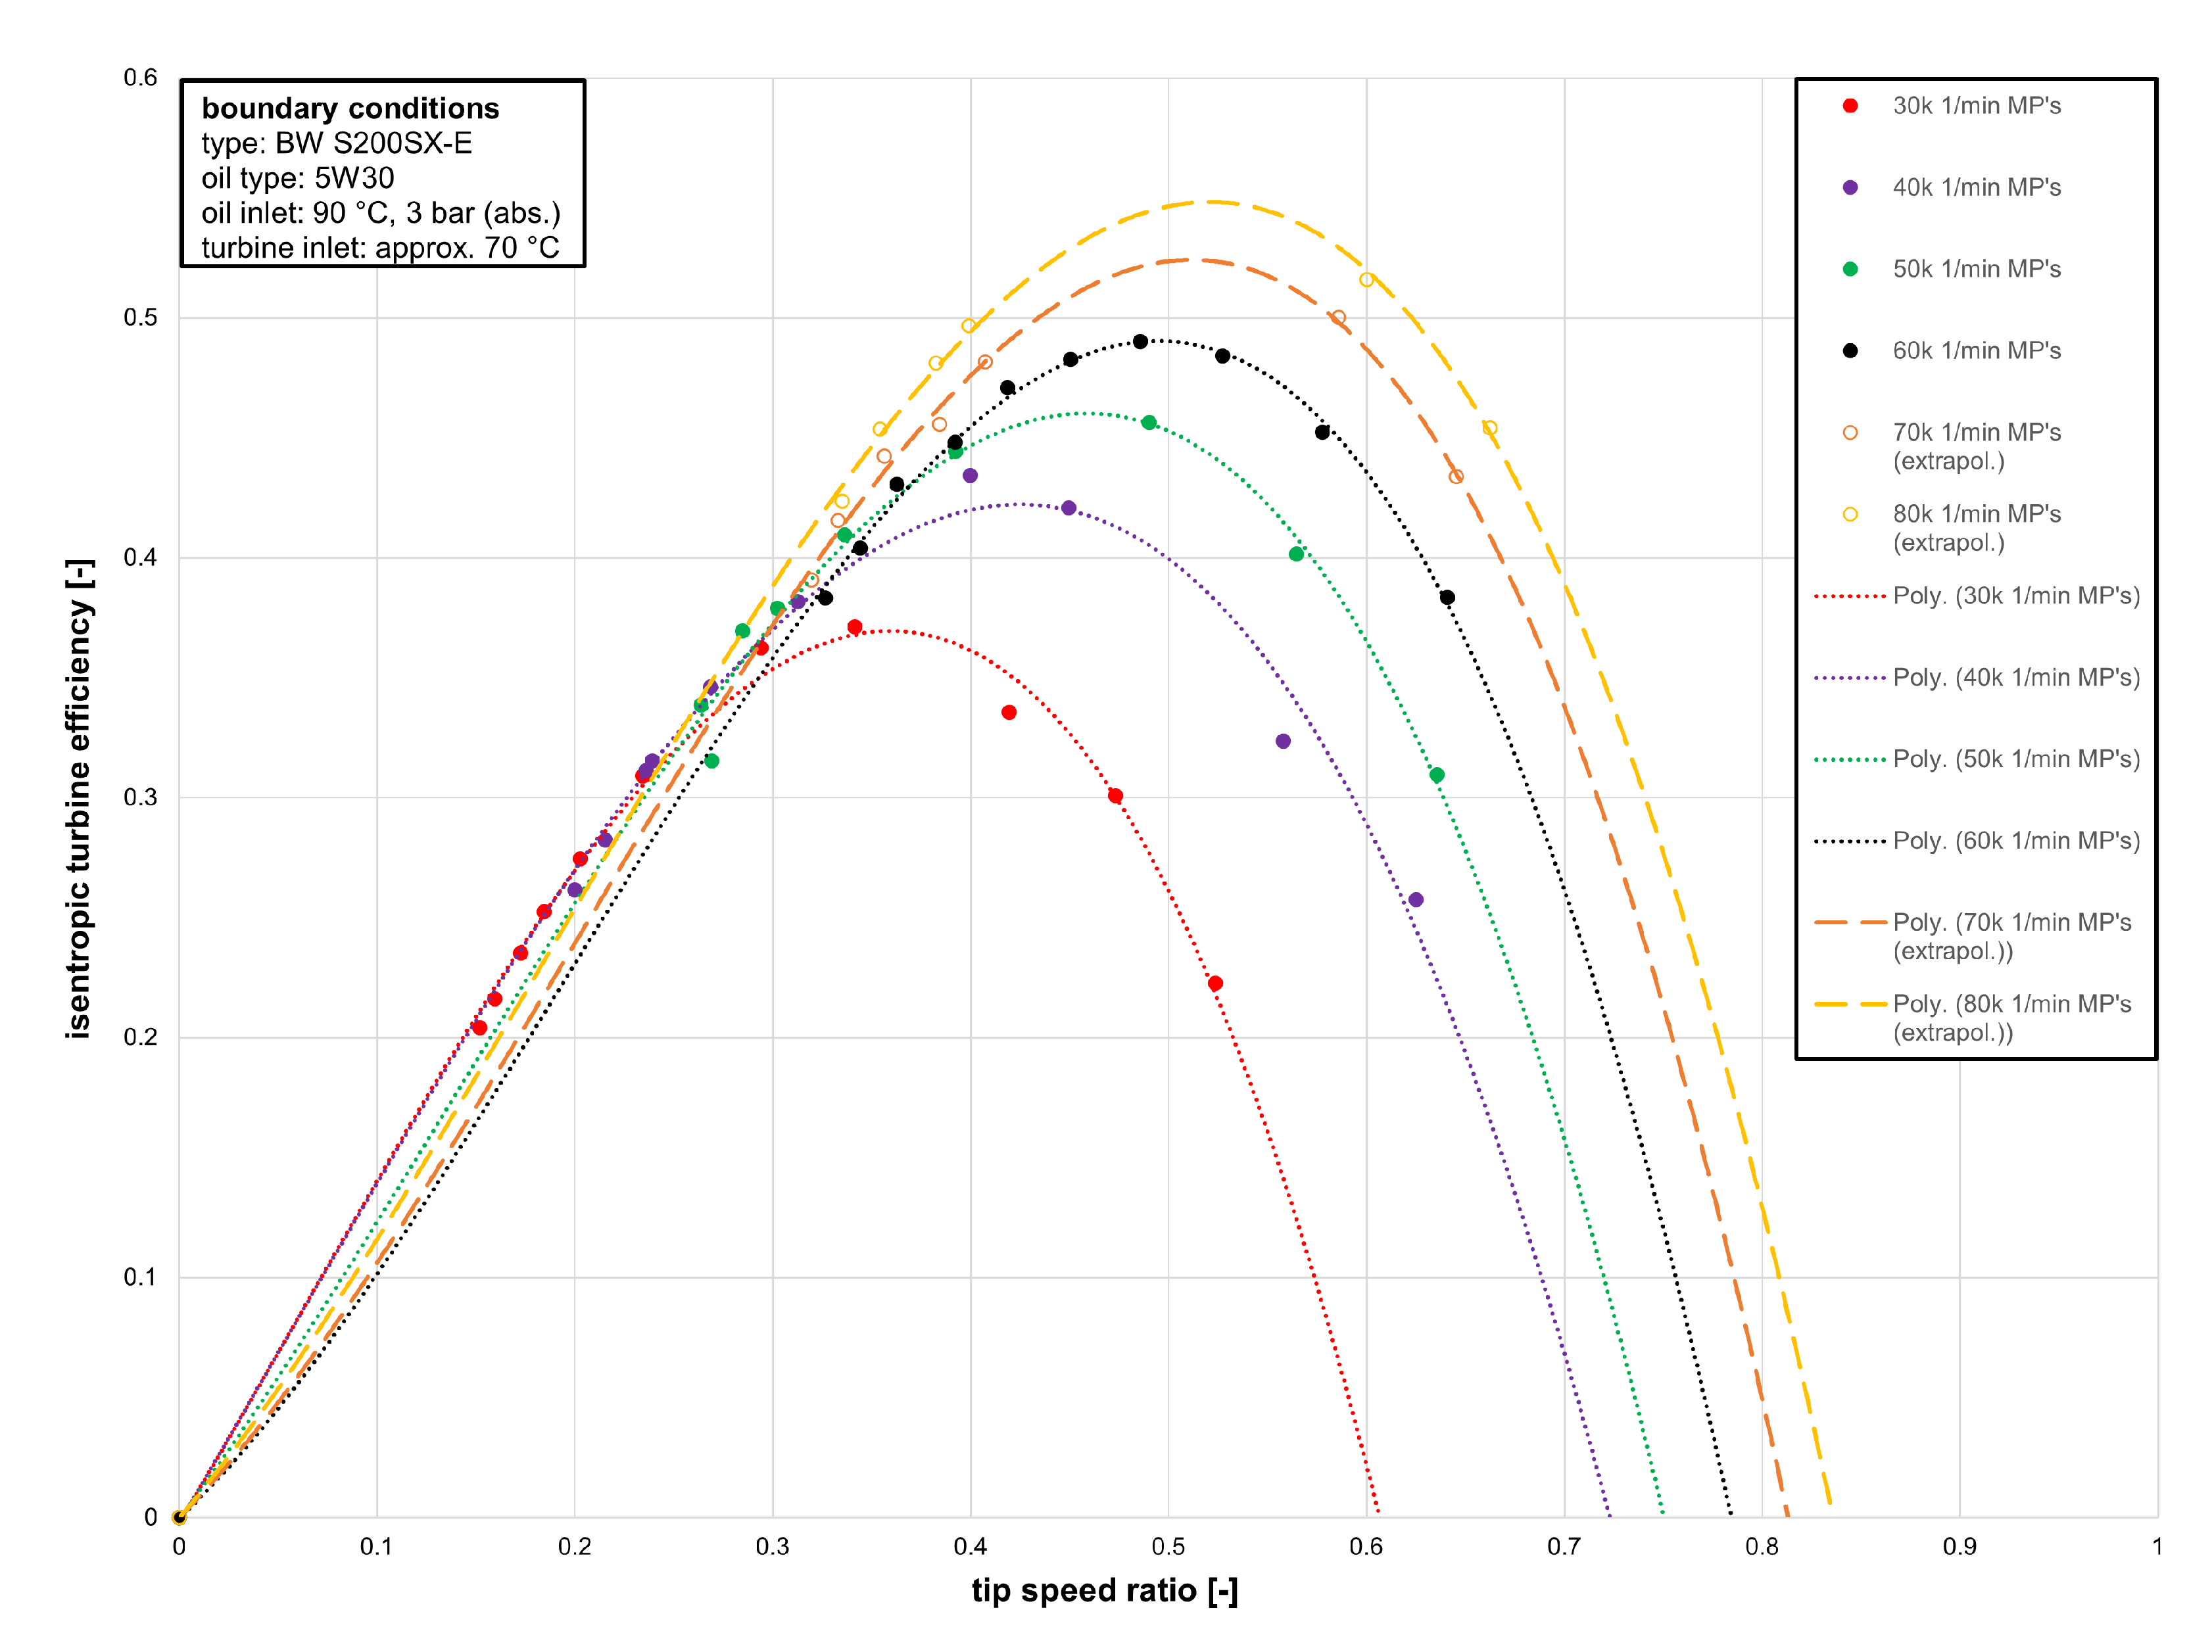
Due to changing ambient influences and boundary conditions it is difficult to compare different turbine wheels and their maps. To counteract these uncertainties and to evaluate performance, it is crucial that in front and behind the turbine, the mass flow, pressure and humidity are in a steady state. To simplify these calculation, compressor and turbine wheels are commonly declared as adiabatic. Measurements are taken by applying mass flow to the turbine wheel at different boundary conditions. There are different methods to determine turbine maps. The so-called “adiabatic” method simulates load by the compressor wheel. To achieve this, the turbine is slowed down, by reducing the mass flow towards the wheel. Only at high rotational speeds (less than 30% of maximum rotational speed) this is a reliable method [16]. At lower speeds, so called “extended turbine maps” are used, due to the requirement of special measuring methods to characterize the turbine wheel at low rotational speeds. Therefore, the load is simulated by slowing down the shaft with the electric motor generator unit (MGU). With this method the operating points can be measured and extrapolated to indicate the behavior of the turbine within the entire range of rotational speeds. The HGTB is set up specifically for these types of measurements, see the next section. To get a more in-depth explanation of these both measuring methods for turbine maps, see following scientific paper about the HGTB [7]. In the next section follows the mathematical methods and the test set up.

2.2.1. HGTB Setup and Adaptations

The hot gas test bench of the Ostfalia University bears similarity to the FTB with some modifications and other components carried over, for reference see Section 2.1.1. In contrast to the FTB the HGTB uses an electrical motor only as drive component to balance the rotary shaft before the actual measurements. After that, the motor acts as a generator and retards the shaft. The shaft is driven by the hot gas with the (adapted) turbine wheel components of the FCAS in this case, or with the original turbocharger and turbine wheel attached to the shaft. The air is compressed by an electrical compressor, heated with a filament heating and afterwards humidified by a water injection system. This allows the boundary conditions to be set up to simulate a FCS or an internal combustion engine. The schematics are shown in Figure 7.
To determine the thermodynamics of the fluid, sensors measure the temperature, pressure, mass flow and humidity in front, behind and in between air tube sections. Additionally, the rotor speeds and the torque of the shaft are measured, to calculate the efficiency of the turbine wheel by evaluating the inducted power of the electrical generator. The mathematical basics of the hot gas test bed are described in the next section.

2.2.2. Mathematical Methods of HGTB

For all measurements of the HGTB discussed in this paper, the fluid is assumed to be dry air. For all calculations the recorded quantities are used as mean values over the time of the measurement. Furthermore, all calculations of the HGTB use the total pressure. Therefore the measured static pressure needs to be converted. The following equation is used to determine the total pressure [17].
p t = p s + m ˙ T 2 2 · A 2 · p s R · T s .
The Equation (5) shows that the total pressure p t is dependent on the turbine mass flow m ˙ T , the flow cross section A, the static pressure p s and the temperature T s . As already mentioned, the flow medium is dry air, thus a value of R = 287   J / ( k g   K ) is applied for the specific gas constant [17].
The pipes adjacent to the turbine have an inner diameter of 60 mm with a cross section of 0.0028 m 2.
To calculate the isotropic turbine output, the total turbine pressure ratio and the isobaric heat capacity are calculated. The total turbine pressure ration π t T is formed as the total pressure p 3 , t before the turbine divided by the total pressure p 4 , t after the turbine.
π t T = p 3 , t p 4 , t .
The isobaric heat capacity is described as a function of pressure and temperature using the mass fraction of the dry air components. The following Table 1 shows the used values of the mass distribution of nitrogen X N 2 , oxygen X O 2 and other trace gases X C O 2 .
To calculate the isobaric heat capacity c p , the fraction of trace gases is completely attributed to carbon dioxide. This gas has the highest influence on the heat capacity of all trace gases. The isobaric heat capacity is calculated as shown in Equation (7).
c p = X N 2 · c p , N 2 + X O 2 · c p , O 2 + X C O 2 · c p , C O 2 .
With the total turbine pressure ratio and the isobaric heat capacity the isentropic turbine output is calculated. Thereby the isentropic turbine output P T , i s is formed as the product of the turbine mass flow, the isobaric heat capacity c p , 3 on the turbine entrance, the temperature T t , 3 on the turbine entrance and the total turbine pressure ratio. For the isentropic exponent κ , the value κ = 1.4 is assumed [18].
P T , i s = m ˙ T · c p , 3 · T t , 3 · π t , T κ 1 κ 1 .
The compressor wheel is replaced by a motor generator unit (MGU) on the Ostfalia HGTB. The MGU is slowing the rotor shaft down by generating electric power P M G U . The generated power is calculated by the measured torque M M G U and rotational speed of the shaft n E M o t .
P M G U = M M G U · 2 · π · n E M o t .
To determine the isentropic turbine efficiency η T , i s , the generated power is divided by the isentropic turbine power.
η T , i s = P M G U P T , i s .
For the creation of the turbine map the velocity ratio ϕ T is calculated based on [16].
ϕ T = u T c 0 .
The velocity ratio is described as the peripheral speed of the turbine wheel u T (tip speed) divided by the flow velocity c 0 . The flow velocity is calculated with the isentropic turbine power and the turbine air mass flow.
c 0 = 2 · P T , i s m ˙ T .
The tip speed is calculated by the diameter of the turbine wheel and the rotational speed of the turbine wheel. The used turbine wheel has a diameter of 40 mm.
u T = π · d T · n T .

3. Results

This section discusses the results of research and development of the planned coupling system of the FTB, which is especially important for bearing systems with very low tolerances, like air bearings. Furthermore, the measurement results of an FCAS turbine wheel on the HGTB are discussed.

3.1. FTB

All baseline measurements and test results shown from the FTB are taken under steady state conditions and referenced with a turbocharger by “BorgWarner” of the type “BV35”. Measurements shown are obtained with the following boundary conditions, oil temperature at the inlet of 90 °C, oil pressure of 3 bar (abs.) and without additional axial forces at varying speeds. Other boundary conditions and axial forces are not shown. Measurements of the FCAS are still being evaluated and not shown in this paper.
So far, a wide variety of coupling solutions, from rigid to flexible have been examined. None of them were able to perform at high rotor speeds, with the strict requirements of low torque and little mass. For this, a coupling solution with a T25 torx-bit was developed at the Ostfalia. It provides low mass, because the male T25 is integrated in the electric motor, and the shaft-side of the turbomachinery gets a screw nut with the female torx counterpart. Due to the shape of torx bits, there is enough play to allow the shaft to spin with some degree of freedom. Therefore, this torx coupling solution could be described as “semi-rigid”. It is necessary to introduce a new coupling method To achieve less interferences and better prediction in terms of rotor dynamics, see Section 2.1, and because the boundary conditions and tolerances of the air bearings within the FCAS are much tighter than those of conventional turbochargers with oil bearing systems. The best solution for this is a contactless magnetic coupling. The smallest commercially available magnetic couplings, with a containment shroud named “MINEX-S” by “KTR” and magnetic disc clutches from “Mobac” named “MTD-0.2” were considered for the FTB.
Tests with the MTD, which is designed for rotational speeds up to 50,000 min−1, have shown a different behavior of the shaft assembly in comparison with the torx coupling solution. Figure 8 shows the amplitudes of displacement in microns (distances between sensor and dummy mass, in one dimension on each side) of the MTD-0.2 and the torx coupling. The oil-based bearing of the turbocharger BV35 is in boundary or mixed friction at speeds up to 40,000 min−1. At this point, the mentioned damping takes effect. The rotor shaft stabilizes and orientates itself. With the torx coupling, the driven side (turbine) is held in place by the coupling, which suggests that the shaft cannot move uninhibited. This is a drawback with a rigid or this semi-rigid coupling solution. With the contactless magnetic coupling solution, the shaft is less restricted in its movement.
Although the amplitudes of displacement vary at some speeds, the friction power shown in Figure 9 is nearly identical. These measurements show, that the coupling solutions result in almost the same friction power. At 50,000 min−1 the magnetic coupling achieves a lower friction power than the torx coupling, which explains the lower amplitudes at this point. If this trend continues, there will be an overall lower frictional power at higher speeds as a result. This is a good sign to lower the influences of the coupling solution with the proposed system and may lead to even more realistic measurements under almost real conditions.
To get an impression of the rotor shaft dynamics and critical frequencies of the system, the measured amplitudes are used to create orbital diagrams. See Figure 10, which shows the turbine side at rotational speeds of 40,000 min−1 in comparison with torx and MTD coupling solutions. These orbitals show the deflection of the dummy mass, and therefore the movement of the corresponding side of the shaft. Furthermore, it is possible to estimate critical frequencies of the system and to verify previous simulations. These studies are mandatory to prevent failures, otherwise compressor/turbine wheels may scrape at their respective housing or fuse completely.
The turbine side is examined due to the high amplitude peaks of the displacement as seen in Figure 8. The orbital comparison of the turbine shows a significant difference at this mentioned rotational speed, where approximately the first critical frequency develops, see Section 2.1. The semi-rigid torx coupling clearly holds the shaft more in place and is mostly centered in comparison to the contactless magnetic coupling. The magnetic coupling on the other hand is not fully aligned and therefore off centered, it also has a more elliptic shape and is clearly oscillating. Which implies that the shaft or the side of the shaft has more freedom of motion.
The biggest downside of the magnet couplings is, that those available on the market are too big and heavy for the use case and only approved for rotational speeds up to 50,000 min−1. Additionally, the available couplings are designed to transfer ten times the amount of torque required for the propulsion of turbomachinery shaft assemblies, which explains the large dimensions of the available coupling systems. From previous examinations with turbochargers with oil bearings it is known that the maximal required torque during start up is around 0.04   Nm . Because of the mentioned limitations, a new front faced magnetic disc coupling (MDC) are developed. The MTD-0.2 has a ring magnet integrated, to achieve higher torque output, multiple reciprocally magnets are used. The number of magnets, dimensions, magnet material and the air gap determine the transferable torque. The version introduced for this project has 12 alternating neodymium iron boron (NdFeB) -N45 material–magnets each 5 mm × 5 mm on both sides. With an air gap of 3 mm to 3.5 mm it can apply a maximum of 0.045 Nm to 0.05 Nm of torque with an axial force of 7 N . A comparison between the own MDC and MTD-0.2 is shown in Figure 11.
With these adaptions, the newly designed MDC can achieve a reduction of size, mass and moment of inertia by almost 50% compared to the smallest and lightest commercially available systems, with the added benefit of a much smaller coupling. The following conclusion can be taken from the studies evaluating the improved coupling solution. It has become evident that the magnetic coupling is the best solution to obtain more realistic measurements regarding rotor dynamics. This is especially true for bearing systems with lower deflection, like air bearings used in FCAS, in comparison with a conventional oil-bearing system. Furthermore, any coupling affects the frictional power, these influences can be lowered by the MDC. The verification, of the newly designed MDC in comparison to the torx coupling, over the entire range of rotor speed is still pending. The conception of a new system, to produce axial force in two axes onto the rotor shaft in motion, is still under evaluation.

3.2. HGTB

All baseline measurements and test results shown from the HGTB are under steady state conditions and referenced with a turbocharger by BorgWarner of the type “S200SX-E”, with a very common radial fully floating bearing system. At the time of research there was no fully functional unit of the FCAS available to measure, therefore the turbine components of the FCAS were adapted to the aforementioned turbocharger. To obtain relevant information about the turbine efficiency, the bearing system is insignificant and has negligible influences. Because these turbine parts of the FCAS are not to be disclosed, the adaptation itself is not shown. The boundary conditions of the oil inlet are around 90 °C and 3 bar (abs.). Inlet flow of the turbine wheel is around 70 °C. Variations of the humidified fluid are still under evaluation and not shown in this paper.
To obtain turbine maps (see Figure 12) that shows the isentropic turbine efficiency over turbine pressure ratio, the measuring process is as follows. First, the lowest possible stable rotational speed of the turbine needs to be evaluated by applying pressurized airflow. If necessary, the mass flow gets heated or cooled to achieve a turbine inlet temperature of approximately 70 °C. The rotor speed is held constant by the generator applying braking forces, in the meantime the air mass flow gets increased to the next stable point. This is repeated for different rotational speeds. Measurements were taken with rotor speeds up to 60,000 min−1. The two last speed lines and measurement points are extrapolated. As the rotational speed increases, the turbine approaches the optimal range for its design. The turbine efficiency peaks at a very early pressure ratio and then slowly drops. The isentropic turbine efficiency also increases as the speed rises.
At the extrapolated rotor speeds of 70,000 min−1 and 80,000 min−1 there is an isentropic turbine efficiency of approximately 50%. The FCAS is designed to rotate up to 120,000 rotations per minute. The measured turbine map implies, that the turbine will probably achieve between 60% to 70% efficiency at higher speeds around 100,000 min−1. This is comparable to modern radial turbines of turbochargers with an oil-bearing system.
To get an overview of the efficiency in relation to the rotation of the turbine, Figure 13 shows the isentropic turbine efficiency over the tip speed ratio. As mentioned, the TSR gives a ratio of peripheral speed of the turbine to the applied air mass flow. The measurements at different speeds are shown. Between the points, a polynomial curve is drawn, which shows a slow increase up to a certain point, then a fast drop in efficiency. The tendency at a rotor speed of 30,000 min−1 deviates form other measurements. This effect is due to the mixed friction of the bearing system. The oil bearing and therefore the shaft is not fully aligned and floating. The turbine/machine is also not designed to operate in this range. This curve is therefore not representative. At higher speeds there is a steady increase of isentropic turbine efficiency and overall TSR. Because the predictions at higher speeds are very complex, only the characteristics for measurements of 70,000 min−1 and 80,000 min−1 are shown.

4. Conclusions

The measurements shown with the HGTB are comparable to modern turbochargers with a radial turbine and oil-bearing system. The remaining measurements of higher speeds are subject to further research. In the measured speed range a maximum efficiency of approximately 50% was determined. These results can be used as an input for stationary or dynamic operation of a complete fuel cell system, it provides detailed information on the efficiency increase FCAS. A water injection system will be integrated in the HGTB in front of the turbine inlet to achieve comparable results to the fuel cell system with high humidity air flow. With the water injection system, it will be possible to examine the influence of water/humidification in relation to the turbine maps. The formation of water droplets—a condensation phenomena—may damage the system. In conclusion it must be said, that the HGTB gives important information about the technical design of a turbine and the system.
The FTB can measure the friction power of a turbomachinery and the rotor shaft dynamics in motion, under nearly real boundary conditions. With a contactless coupling solution and the application of axial force, the accuracy of predictions can be increased and is therefore suitable for air bearings with very low radial displacements. With these two test beds, Ostfalia University can make essential statements about the overall behaviors of turbomachinery.

Author Contributions

Conceptualization, R.V.; methodology, D.B. and T.K.L.; validation, R.V.; formal analysis, D.B., K.B.T. and T.K.L.; investigation, D.B., K.B.T. and T.K.L.; writing—original draft preparation, D.B., K.B.T. and T.K.L.; writing—review and editing, R.V.; visualization, D.B. and T.K.L.; supervision, R.V.; project administration, R.V. and D.B.; funding acquisition, R.V. All authors have read and agreed to the published version of the manuscript.

Funding

This research was funded by Federal Ministry of Transport and Digital Infrastructure (BMVI), coordinated by National Organisation Hydrogen and Fuel Cell Technology (NOW), grant number 03B10105B(2).

Data Availability Statement

Not applicable.

Acknowledgments

As student assistant at the Ostfalia University, Timo Lehnert helped significantly to achieve the results for this project.

Conflicts of Interest

The authors declare no conflict of interest. The funders had no role in the design of the study; in the collection, analyses, or interpretation of data; in the writing of the manuscript, or in the decision to publish the results.

Abbreviations

The following abbreviations are used in this manuscript:
BEVBattery electric vehicle
BMVIFederal Ministry of Transport and Digital Infrastructure
BWBorgWarner
CADComputer aided design
CAEComputer aided engineering
CDMCompressor dummy mass
FCASFuel cell air supply
FCSFuel cell system
FEAFinite element analysis
FTBFriction test bed
HGTBHot gas test bed
MDCMagnetic disc coupling [clutches]
NdFeBNeodymium iron boron
NOWNational Organisation Hydrogen and Fuel Cell Technology
NVHNoise, vibration and harshness
TDMTurbine dummy mass
TSRTip speed ratio

References

  1. European Commission. The Commission Calls for a Climate Neutral Europe by 2050*; European Commission: Brussels, Belgium, 2018. [Google Scholar]
  2. Burkert, A. Die Brennstoffzelle kommt kräftig in Fahrt. MTZ-Mot. Z. 2015, 76, 8–13. [Google Scholar] [CrossRef]
  3. Al-Hasan, N.; Winkler, G.; Kleinschmidt, R.; Stetter, F. Reibleistungsreduzierte Gleitlager für moderne Abgasturbolader. MTZ-Mot. Z. 2019, 80, 24–31. [Google Scholar] [CrossRef]
  4. Mai, H.; Bolz, H. Validierung von Turboladerkennfeldern auf Heißgasprüfständen. ATZextra 2015, 20, 54–59. [Google Scholar] [CrossRef]
  5. Engine Power Test Code Committee. Turbocharger Gas Stand Test Code J1826; Engine Power Test Code Committee: Warrendale, PA, USA, 1995. [Google Scholar]
  6. Nickel, J.; Grigoriadis, P. Verfahren und Messmethoden zur Erfassung von Turboladerkennfeldern an Turboladerprüfständen. In Simulation und Aufladung von Verbrennungsmotoren; Lechmann, A., Ed.; Springer: Berlin/Heidelberg, Germany, 2008; pp. 195–210. [Google Scholar]
  7. Vanhaelst, R.; Bannack, C.; Klose, M. Comparison of two measurement methods for the determination of extended turbine maps at the eATL test bench of the Ostfalia UAS. Combust. Engine 2017, 169, 43–48. [Google Scholar] [CrossRef]
  8. Schlums, H.; Sadri, H.; Sinapius, M.; Schmied, J.; Teetz, C. Folienlager: Folienlager als Lösung für eine ölfreie Rotorlagerung; Frankfurt, M., Ed.; Project No. 1157; Technical Report; Technische Universität Braunschweig, Institut für Adaptronik und Funktionsintegration, Forschungsvereinigung Verbrennungskraftmaschinen: Brunswick, Germany, 2015. [Google Scholar]
  9. Hirs, G.G. The Load Capacity and Stability Characteristics of Hydrodynamic Grooved Journal Bearings. ASLE Trans. 1965, 8, 296–305. [Google Scholar] [CrossRef]
  10. Cunningham, R.E.; Fleming, D.P.; Anderson, W.J. Experimental Load Capacity and Power Loss of Herringbone Grooved Gas Lubricated Journal Bearings. J. Lubr. Technol. 1971, 93, 415–422. [Google Scholar] [CrossRef] [Green Version]
  11. Faria, M. Some Performance Characteristics of High Speed Gas Lubricated Herringbone Groove Journal Bearings. JSME Int. J. Ser. C-Mech. Syst. Mach. Elem. Manuf. 2001, 44, 775–781. [Google Scholar] [CrossRef] [Green Version]
  12. Bonneau, D.; Absi, J. Analysis of Aerodynamic Journal Bearings With Small Number of Herringbone Grooves by Finite Element Method. J. Tribol. 1994, 116, 698–704. [Google Scholar] [CrossRef]
  13. Janschek, K. Systementwurf Mechatronischer Systeme; Springer: Berlin/Heidelberg, Germany, 2010. [Google Scholar] [CrossRef]
  14. ISO 21940-11:2016; Mechanische Schwingungen-Auswuchten von Rotoren-Teil 11: Verfahren und Toleranzen für Rotoren mit Starrem Verhalten. DIN Deutsches Institut für Normung e. V.: Berlin, Germany, 2017.
  15. SAE IC Powertrain Steering Committee. Turbocharger Nomenclature and Terminology-SAE J922; SAE IC Powertrain Steering Committee: Warrendale, PA, USA, 1995. [Google Scholar]
  16. Basshuysen, R.; Schäfer, F. Handbuch Verbrennungsmotor: Grundlagen, Komponenten, Systeme, Perspektiven; 7., Vollst. überarb. u. erw. aufl. 2014 ed.; ATZ/MTZ-Fachbuch; Springer Vieweg: Berlin/Heidelberg, Germany, 2015. [Google Scholar] [CrossRef]
  17. Verein Deutscher Ingenieure VDI. VDI-Wärmeatlas; 11., Bearbeitete und Erweiterte Auflage ed.; Springer: Berlin/Heidelberg, Germany, 2013. [Google Scholar] [CrossRef]
  18. Sigloch, H. Technische Fluidmechanik; 10. aufl. 2017 ed.; Springer Vieweg: Berlin/Heidelberg, Germany, 2017. [Google Scholar]
Figure 1. Illustrative floating bearing of the BW BV35 layout, modified by the Ostfalia.
Machines 10 00177 g001
Figure 2. Comparison between different bearing systems of start up simulations in turbomachinery, based on [3].
Machines 10 00177 g002
Figure 3. Analysis of the rotor dynamics for the BW BV35 turbocharger (a) first critical frequency at 623 Hz (b) second resonance frequency at 1413 Hz.
Machines 10 00177 g003
Figure 4. Dummy masses for BorgWarner BV35 turbocharger wheels, with integrated holes for balancing masses and front faced torx coupling: (a) TDM; (b) CDM.
Machines 10 00177 g004
Figure 5. FTB–schematic test bed setup.
Machines 10 00177 g005
Figure 6. Factors of influence of a turbocharger on a hot gas test bench by generating characterizing maps, based on [7].
Machines 10 00177 g006
Figure 7. HGTB–schematics of test bed setup with water injection system.
Machines 10 00177 g007
Figure 8. FTB–Comparison of torx and magnetic coupling solutions: amplitudes over rotor speed.
Machines 10 00177 g008
Figure 9. FTB–Comparison of torx and magnetic coupling solutions: friction power over rotational speed.
Machines 10 00177 g009
Figure 10. FTB–comparison orbital diagram coupling solutions at 40,000 min−1, driven side: turbine (a) torx coupling (b) MTD-0.2 coupling.
Machines 10 00177 g010
Figure 11. FTB–comparison magnet disc coupling torque and axial force, adapted to FTB.
Machines 10 00177 g011
Figure 12. HGTB–turbine pressure ratio over isentropic turbine efficiency with adapted turbine components of an FCAS.
Machines 10 00177 g012
Figure 13. HGTB–tip speed ratio over isentropic turbine efficiency with adapted turbine components of an FCAS.
Machines 10 00177 g013
Table 1. Mass distribution of gases in dry air [17].
ElementMass Fraction
N 2 X N 2 = 0.75570
O 2 X O 2 = 0.231601
A r , C O 2 , X C O 2 = 0.01269
Publisher’s Note: MDPI stays neutral with regard to jurisdictional claims in published maps and institutional affiliations.

