
Experimental Investigation of Two Switching States of an Active Foil Bearing during Start-Up


Abstract
:1. Introduction
2. Materials and Methods
2.1. Test Bearing
2.2. Test Rig
2.3. Test Procedure
- Measurement without the shaft inserted and with the bearing holder aligned over the cylinders to determine the zero point of the vertical and horizontal force.
- Measurement with shaft inserted and with a higher pressure in the vertical cylinder to adjust the static bearing load.
- Measurement while the shaft is rotated back and forth alternately and with pauses to determine the static friction torque of the bearing. Assuming that the direction of rotation has no influence on small movements and speeds, the zero point of the torque measurement lies exactly in the middle between the standstill torques, which are measured via the torque arm.
3. Results
3.1. Investigations with Non-Rotating Shaft (Standstill)
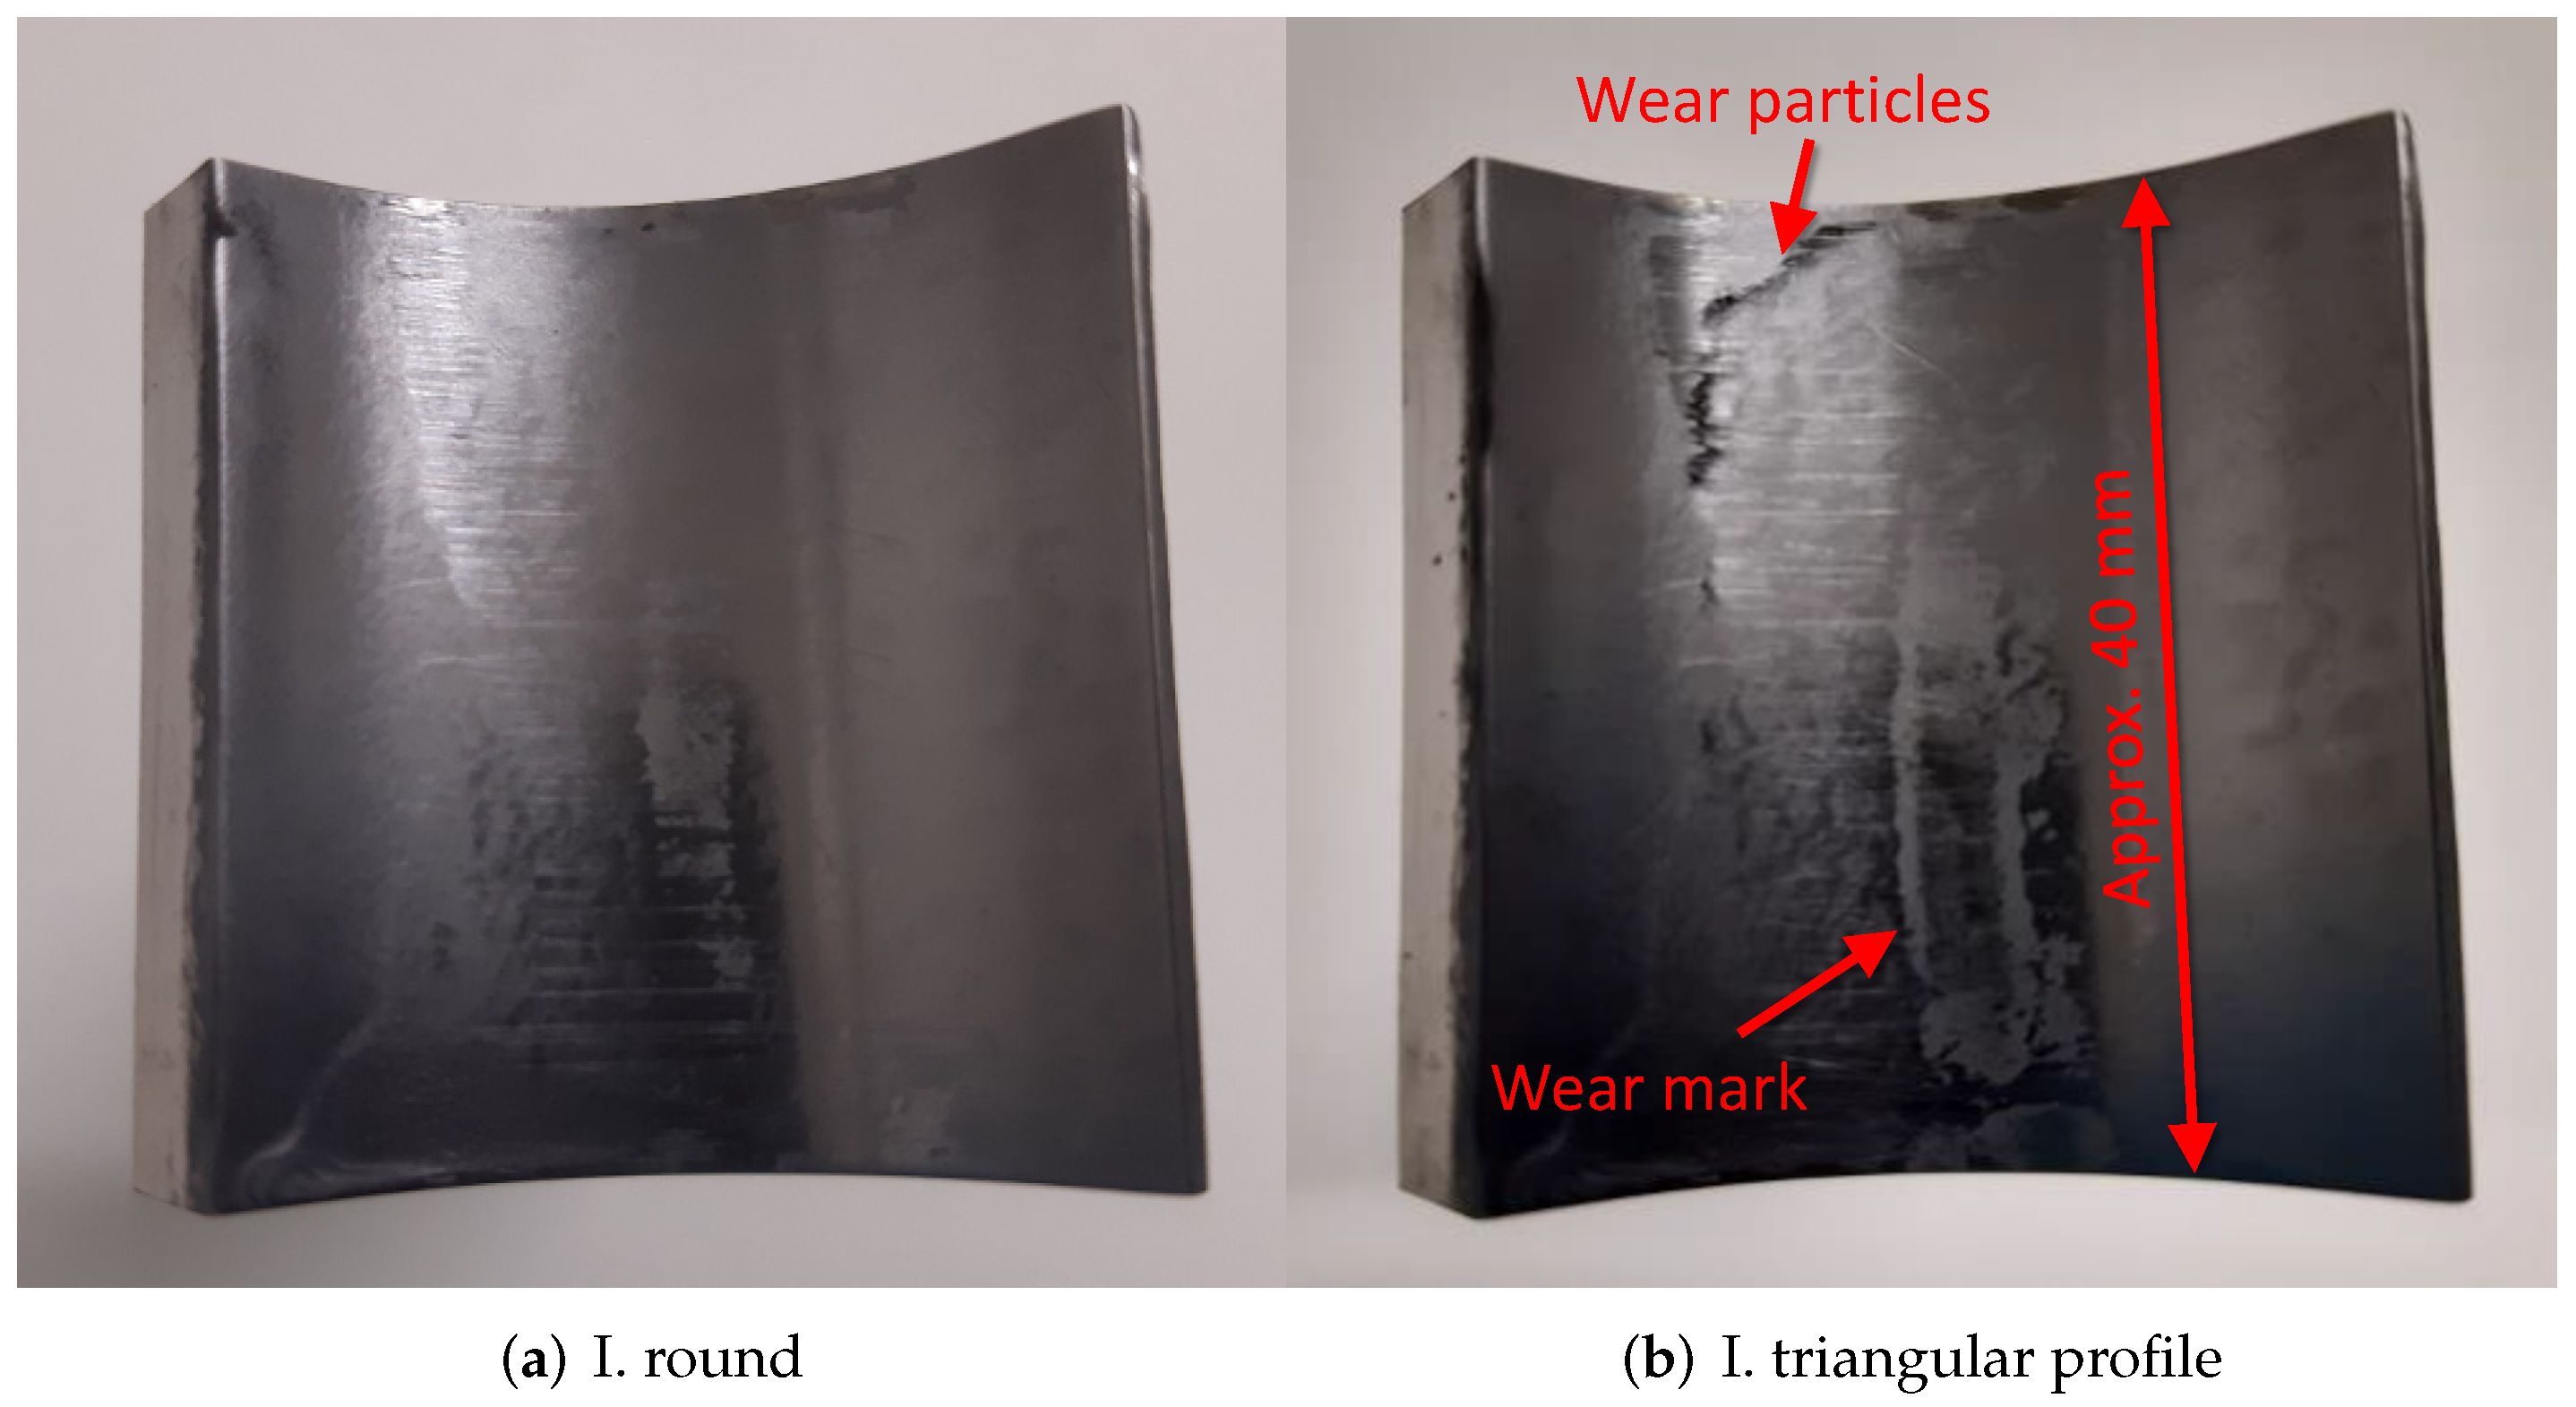
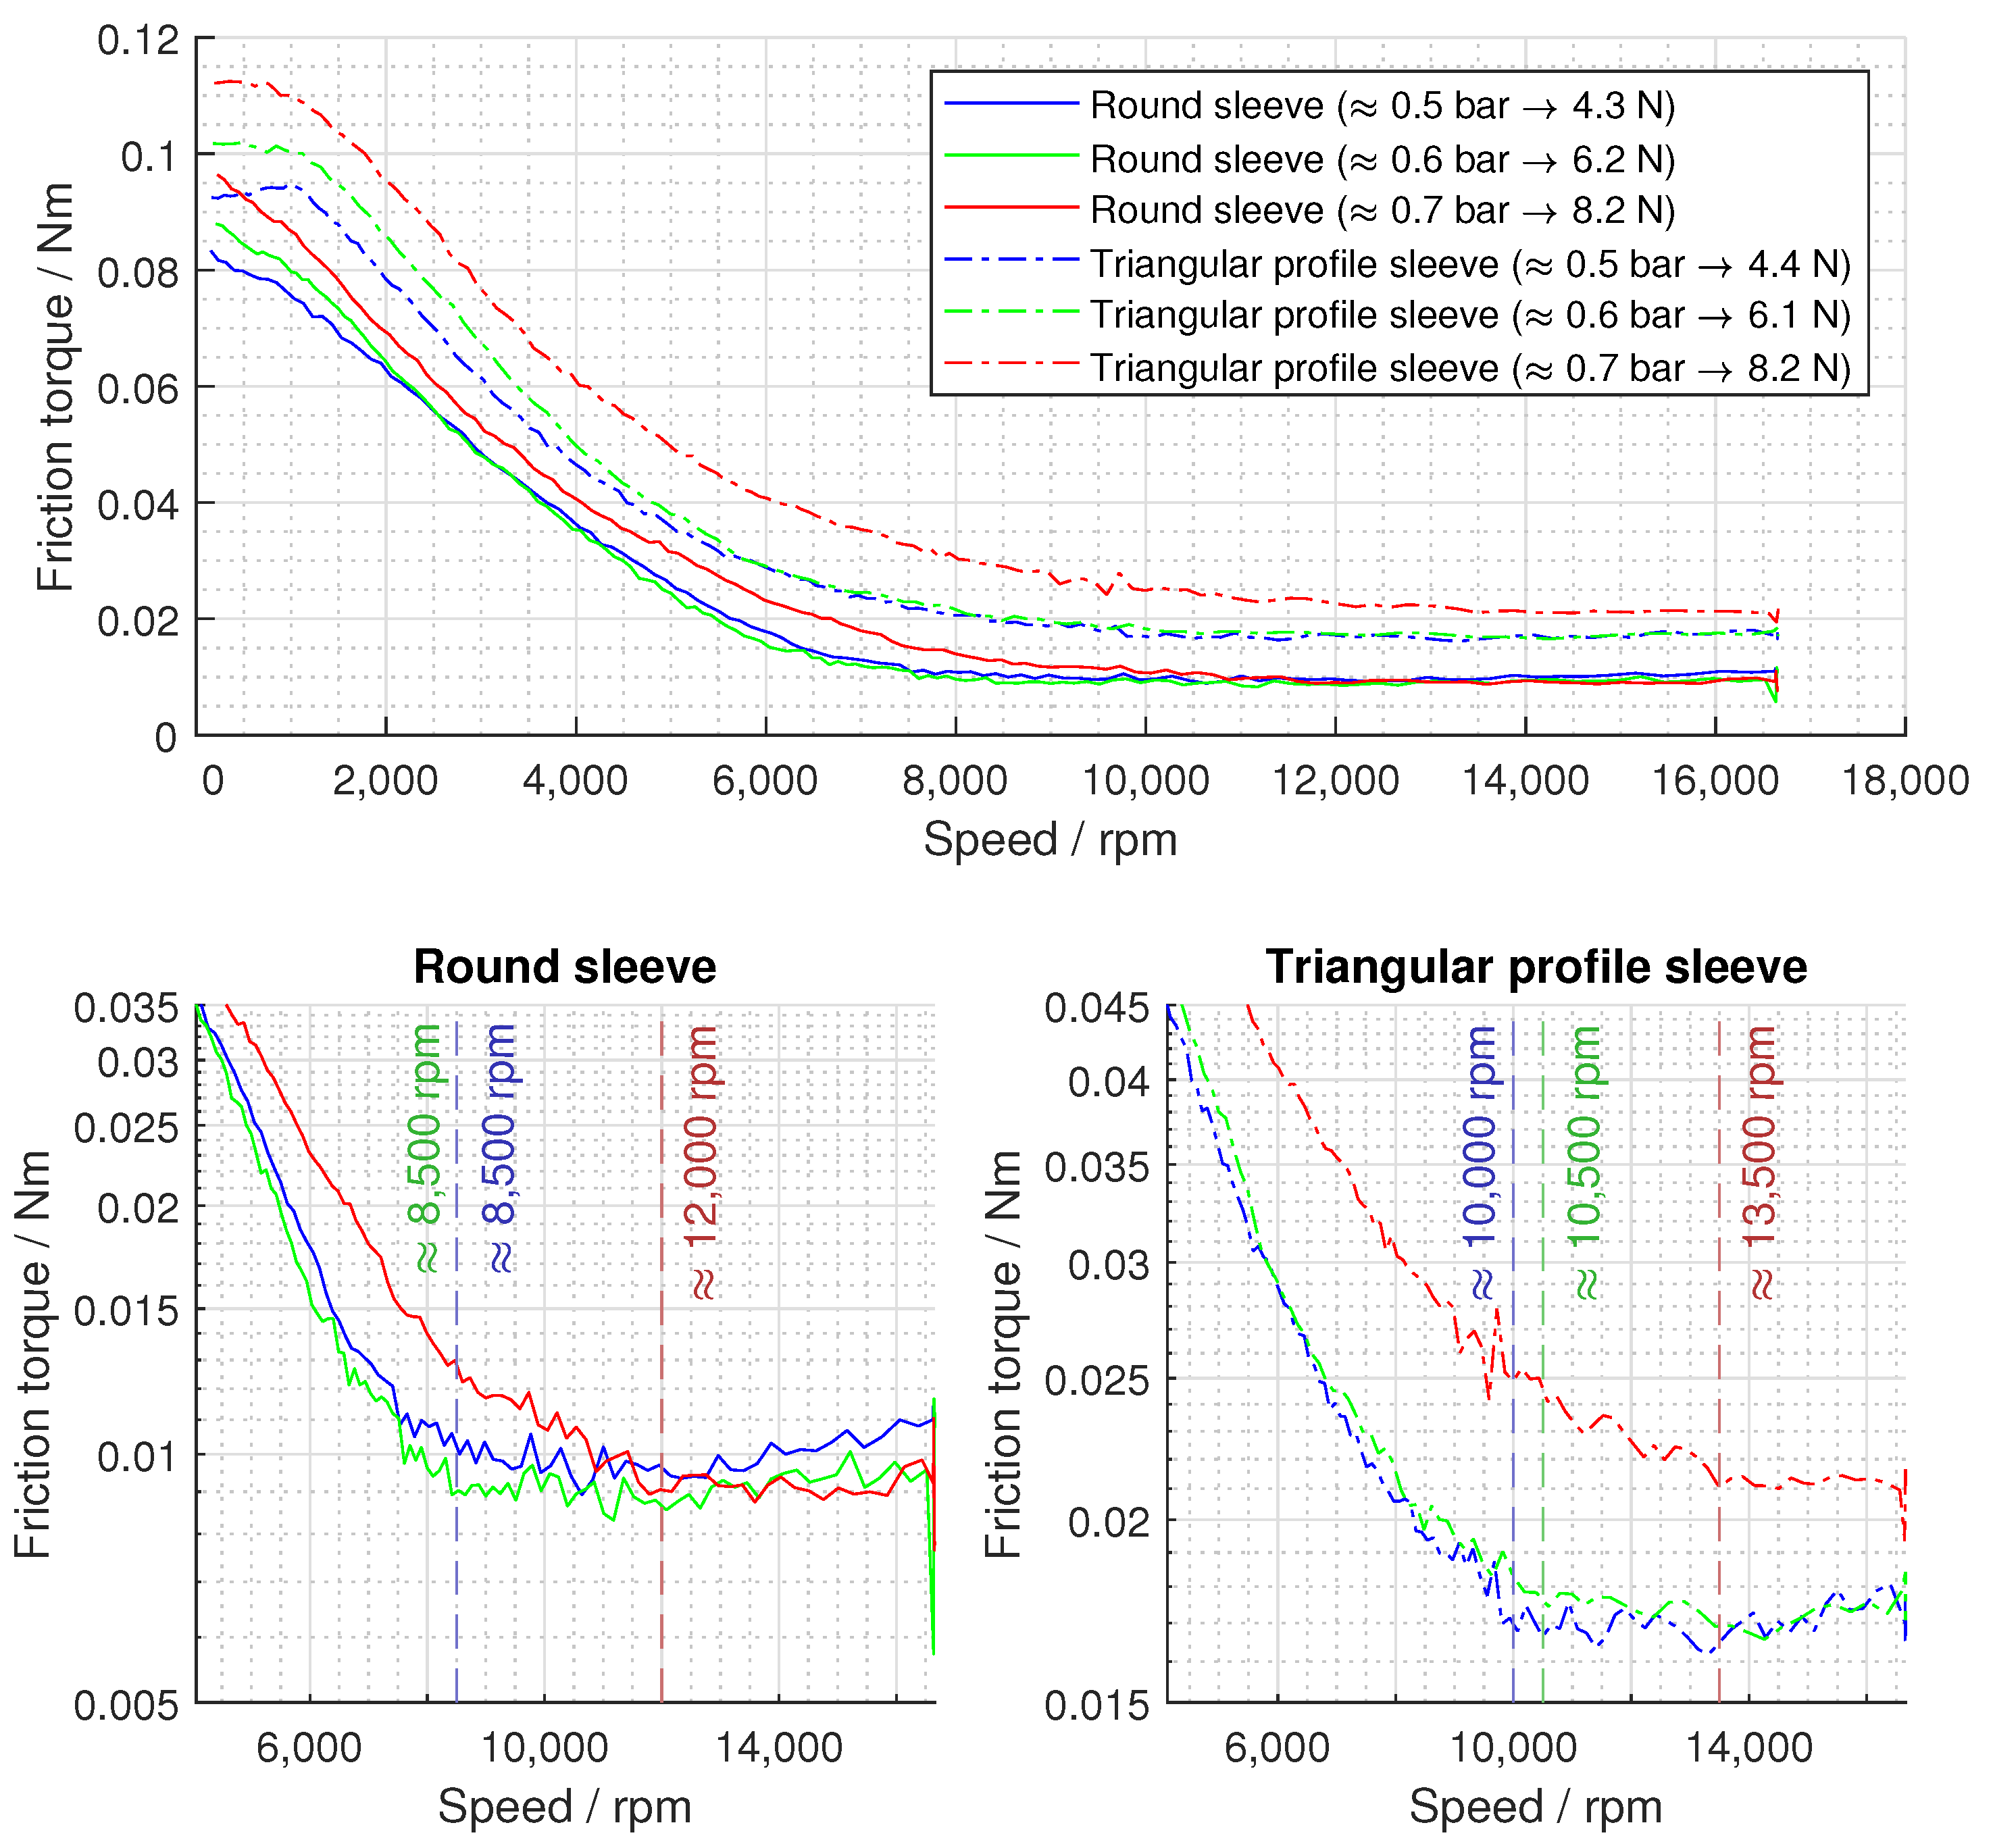
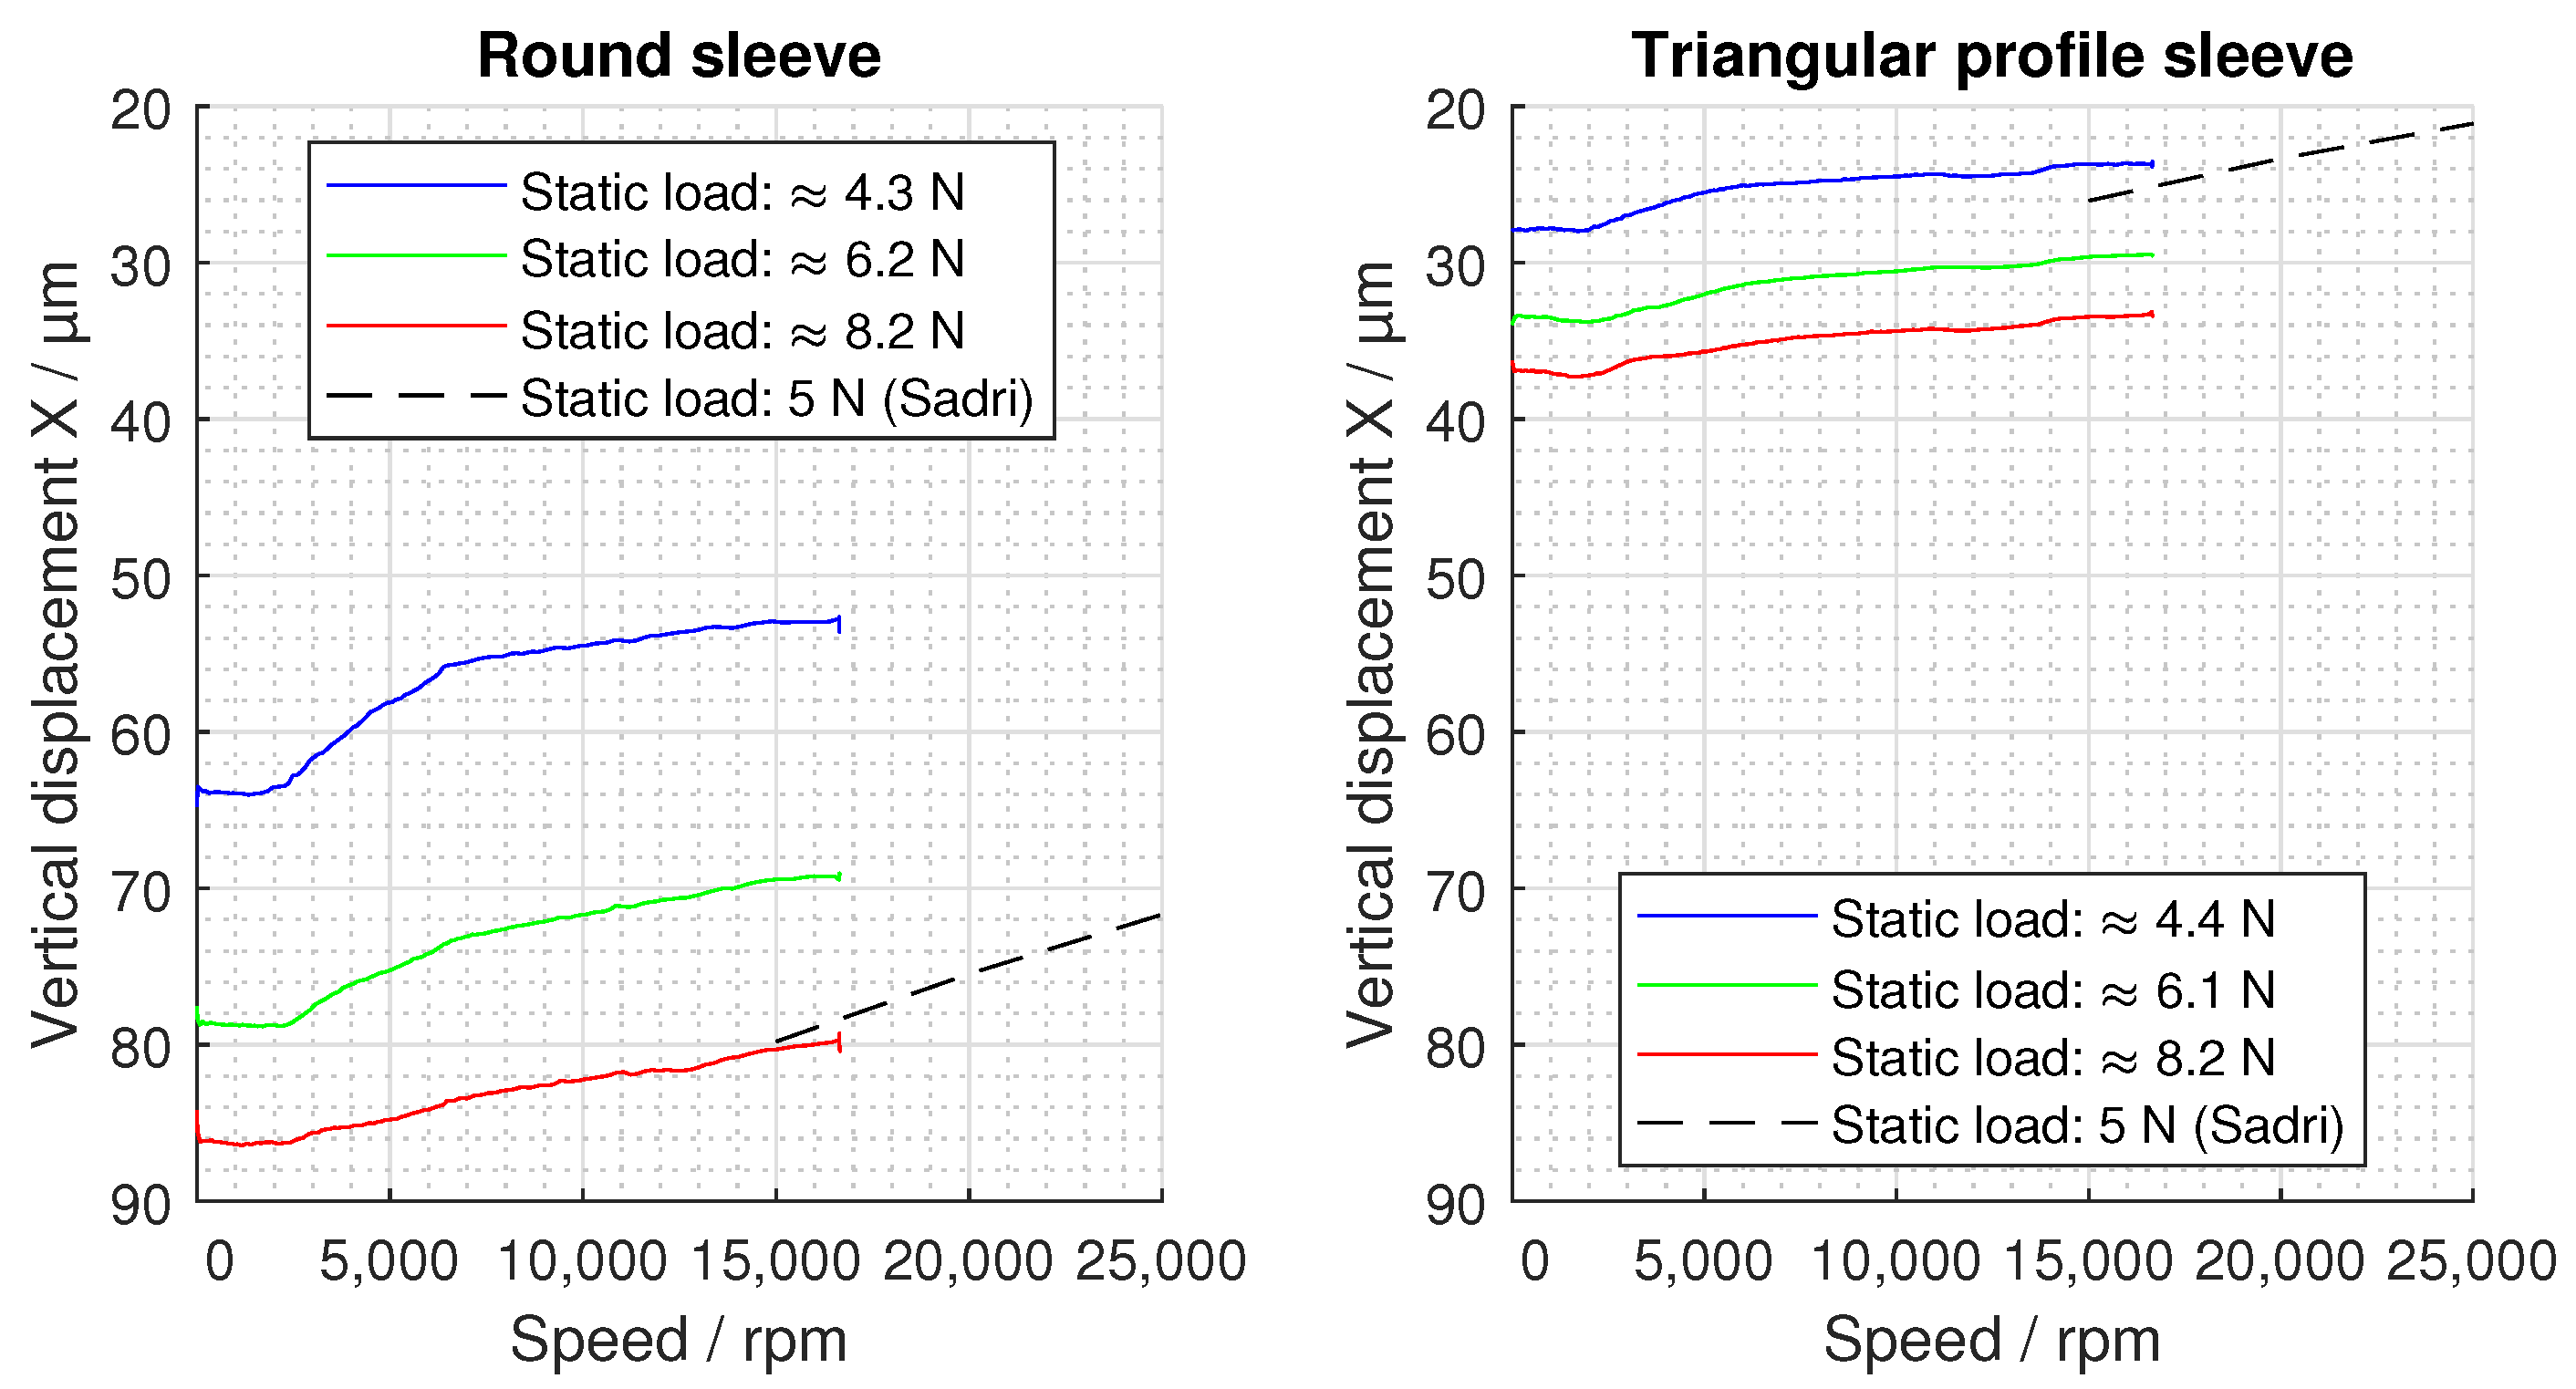
3.2. Lift-Off Tests
4. Discussion
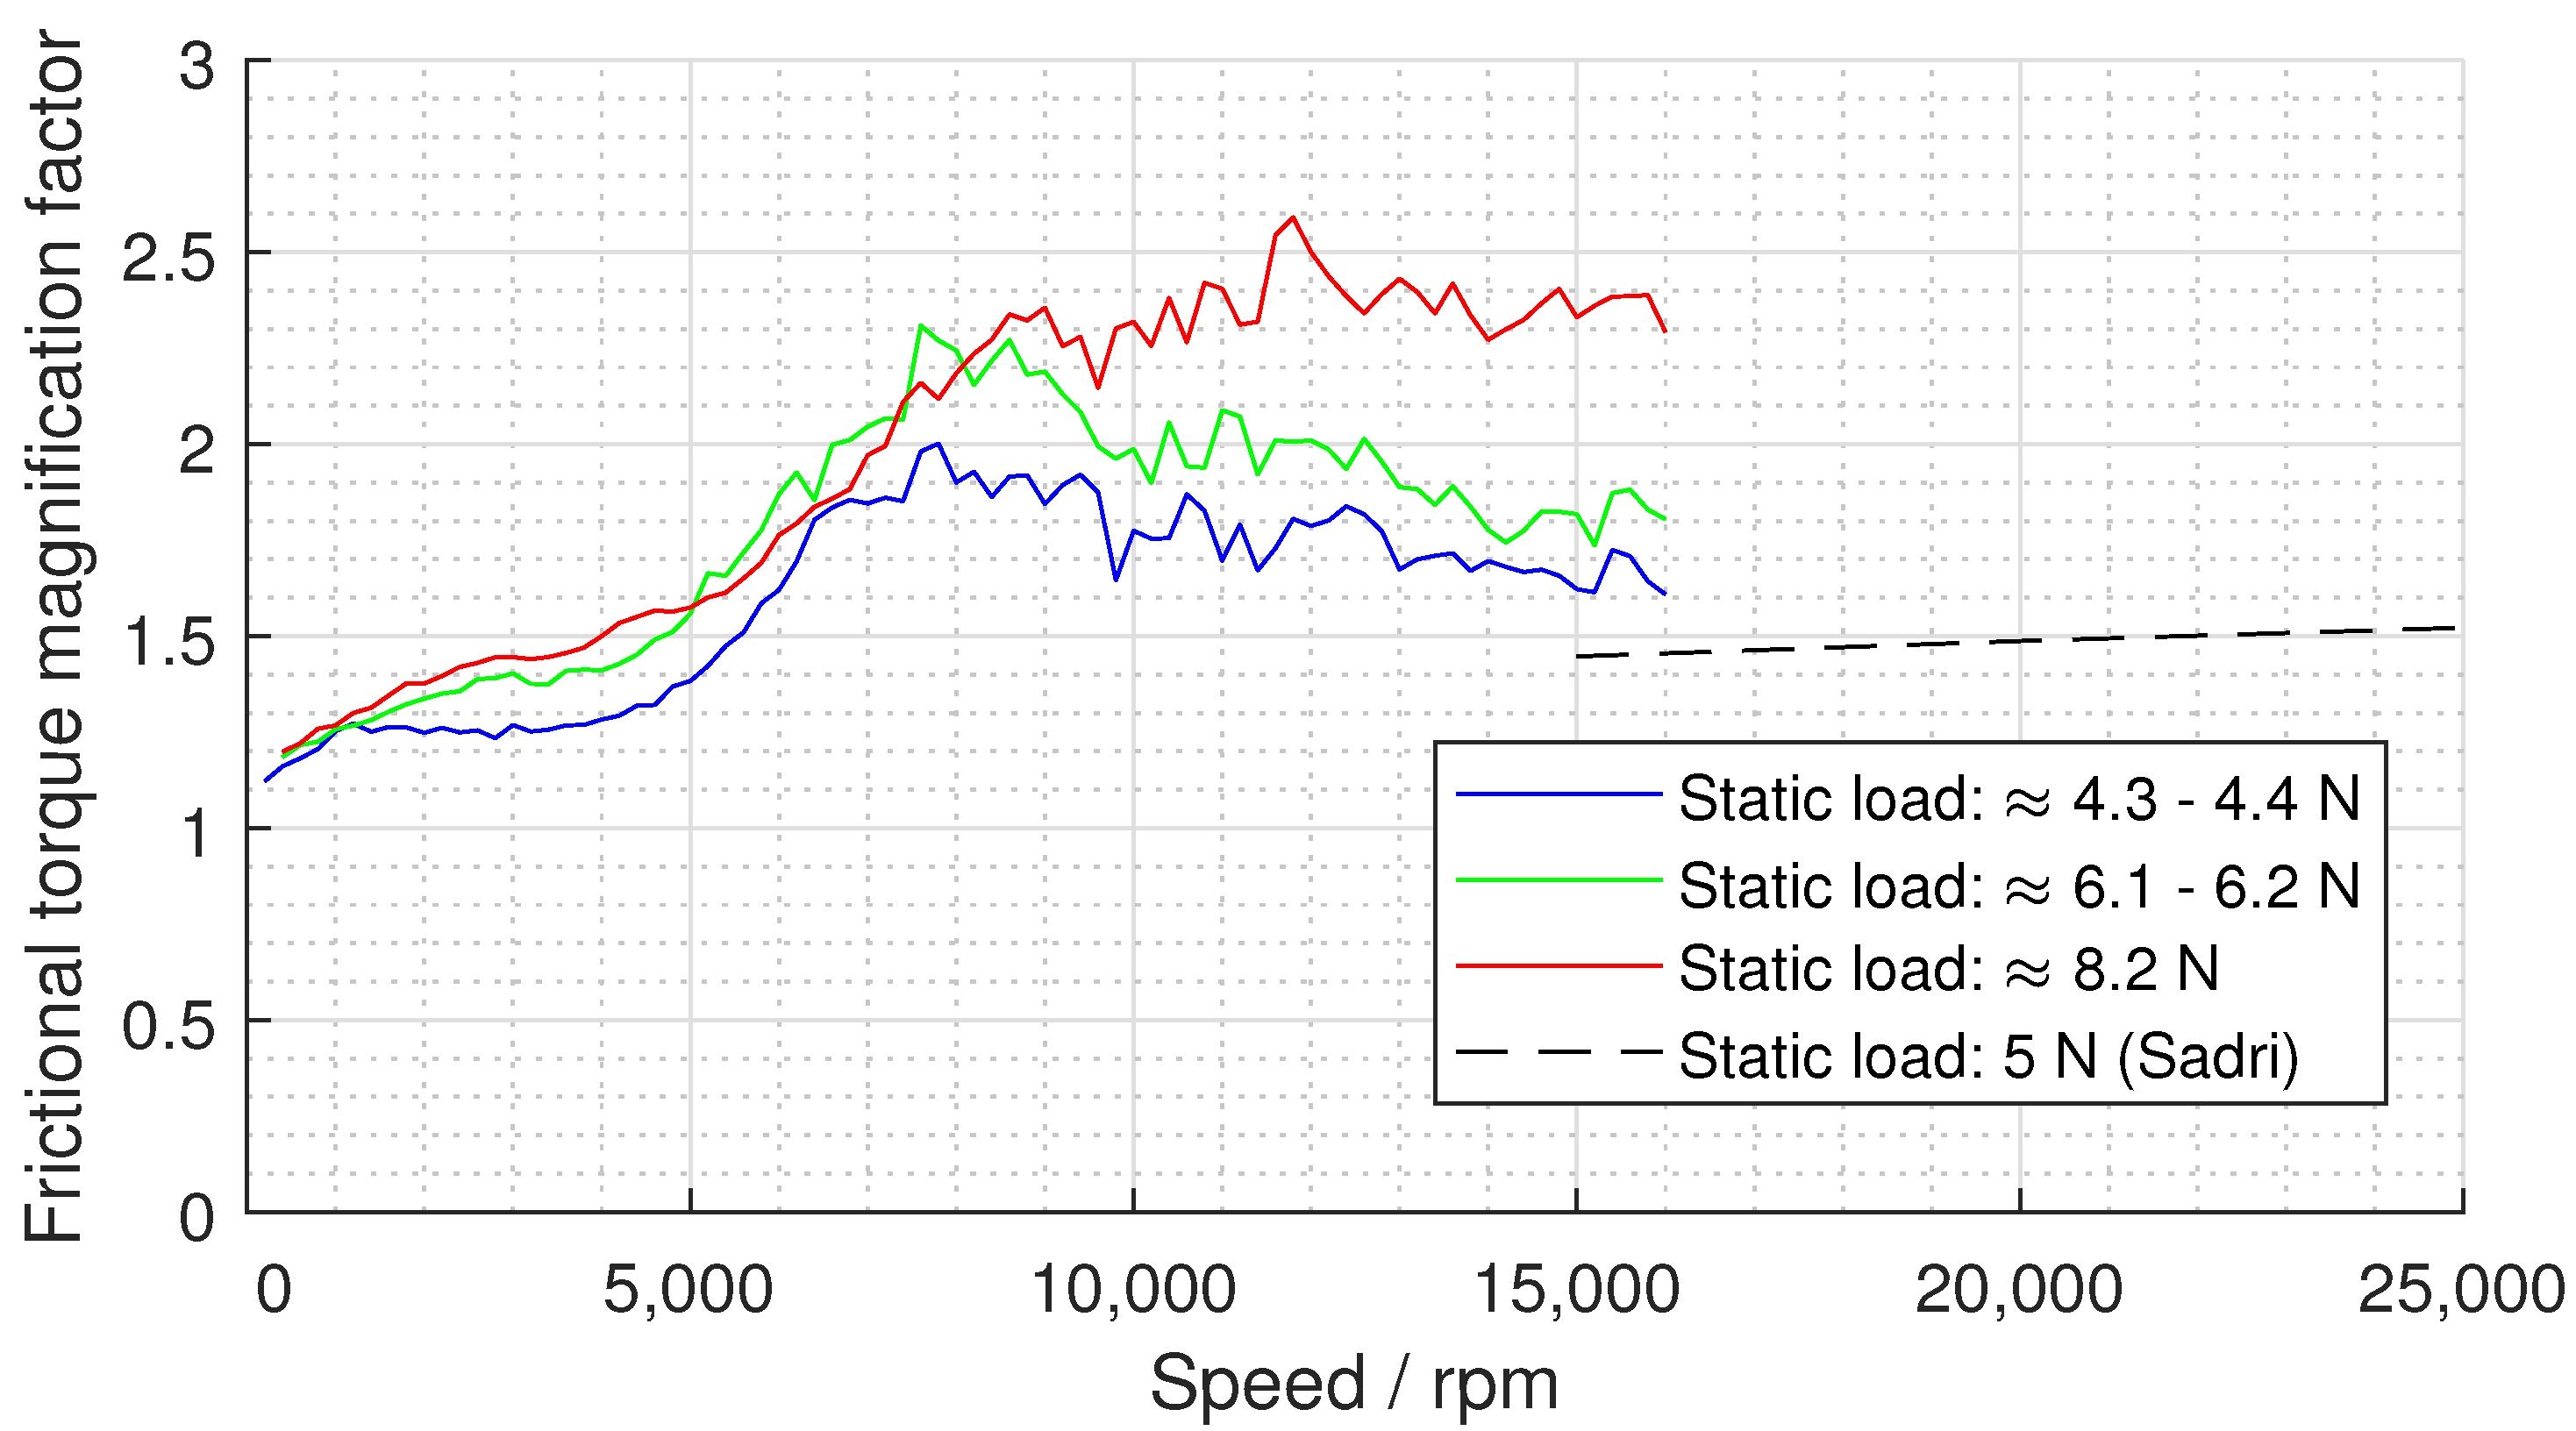
4.1. Comparison with the Literature
4.2. Comparison with the Simulation
5. Conclusions
Author Contributions
Funding
Institutional Review Board Statement
Informed Consent Statement
Data Availability Statement
Acknowledgments
Conflicts of Interest
References
- LI, W.; Feng, G. Design and Experimental Study of Centrifugal Compressor in Fuel Cell Vehicle. Mechanics 2021, 27, 52–61. [Google Scholar] [CrossRef]
- Branagan, M.; Griffin, D.; Goyne, C.; Untaroiu, A. Compliant Gas Foil Bearings and Analysis Tools. J. Eng. Gas Turbines Power 2016, 138, 054001. [Google Scholar] [CrossRef]
- Agrawal, G.L. Foil Air/Gas Bearing Technology—An Overview. In Proceedings of the ASME 1997 International Gas Turbine and Aeroengine Congress and Exhibition, Orlando, FL, USA, 2–5 June 1997; Volume 1, p. V001T04A006. [Google Scholar] [CrossRef] [Green Version]
- Heshmat, H.; Walton, J.F.; Corte, C.D.; Valco, M. Oil-free turbocharger demonstration paves way to gas turbine engine applications. In Proceedings of the Turbo Expo: Power for Land, Sea, and Air, Munich, Germany, 8–11 May 2000; Volume 78545, p. V001T04A008. [Google Scholar]
- Walton, J.F.; Tomaszewski, M.J.; Heshmat, C.A.; Heshmat, H. On the development of an oil-free electric turbocharger for fuel cells. In Proceedings of the Turbo Expo: Power for Land, Sea, and Air, Barcelona, Spain, 8–11 May 2006; Volume 42401, pp. 395–400. [Google Scholar]
- Wale, G.D.; Mba, D. A Journal Bearing Test Rig With Reduced Uncertainty: Some Design Considerations. J. Test. Eval. 2007, 35, 1–30. [Google Scholar] [CrossRef]
- DellaCorte, C. A New Foil Air Bearing Test Rig for Use to 700 °C and 70,000 rpm. Tribol. Trans. 1998, 41, 335–340. [Google Scholar] [CrossRef]
- Howard, S.A. A New High-Speed Oil-Free Turbine Engine Rotordynamic Simulator Test Rig; NASA: Washington, DC, USA, 2007; p. 214489.
- Rudloff, L.; Arghir, M.; Bonneau, O.; Matta, P. Experimental Analyses of a First Generation Foil Bearing: Startup Torque and Dynamic Coefficients. J. Eng. Gas Turbines Power 2011, 133, 092501. [Google Scholar] [CrossRef]
- Ertas, B.H. Compliant Hybrid Journal Bearings Using Integral Wire Mesh Dampers. J. Tribol. 2009, 131, 022503. [Google Scholar] [CrossRef]
- San Andrés, L.; Chirathadam, T.A. A Metal Mesh Foil Bearing and a Bump-Type Foil Bearing: Comparison of Performance for Two Similar Size Gas Bearings. J. Eng. Gas Turbines Power 2012, 134, 102501. [Google Scholar] [CrossRef]
- Andrés, L.S.; Norsworthy, J. Measurement of drag torque, lift off speed and rotordynamic force coefficients in a shimmed BFB. Kluwer Acad. Publ. 2015, 21, 909–919. [Google Scholar] [CrossRef]
- Sim, K.; Yong-Bok, L.; Ho Kim, T.; Lee, J. Rotordynamic Performance of Shimmed Gas Foil Bearings for Oil-Free Turbochargers. J. Tribol. 2012, 134, 031102. [Google Scholar] [CrossRef]
- Sim, K.; Koo, B.; Sung Lee, J.; Ho Kim, T. Effects of Mechanical Preloads on the Rotordynamic Performance of a Rotor Supported on Three-Pad Gas Foil Journal Bearings. J. Eng. Gas Turbines Power 2014, 136, 122503. [Google Scholar] [CrossRef]
- Mahner, M.; Bauer, M.; Lehn, A.; Schweizer, B. An experimental investigation on the influence of an assembly preload on the hysteresis, the drag torque, the lift-off speed and the thermal behavior of three-pad air foil journal bearings. Tribol. Int. 2019, 137, 113–126. [Google Scholar] [CrossRef]
- Kim, D.; Zimbru, G. Start-Stop Characteristics and Thermal Behavior of a Large Hybrid Airfoil Bearing For Aero-Propulsion Applications. J. Eng. Gas Turbines Power 2012, 134, 032502. [Google Scholar] [CrossRef]
- Zhang, G.; Xu, K.; Han, J.; Huang, Y.; Gong, W.; Guo, Y.; Huang, Z.; Luo, X.; Liang, B. Performance of textured foil journal bearing considering the influence of relative texture depth. Proc. Inst. Mech. Eng. Part J. Eng. Tribol. 2022, 105, 135065012110729. [Google Scholar] [CrossRef]
- Ha, D.N.; Stolarski, T.A.; YOSHIMOTO, S. An aerodynamic bearing with adjustable geometry and self-lifting capacity. Part 1: Self-lift capacity by squeeze film. Proc. Inst. Mech. Eng. Part J. Eng. Tribol. 2005, 219, 33–39. [Google Scholar] [CrossRef]
- Feng, K.; Guan, H.Q.; Zhao, Z.L.; Liu, T.Y. Active bump-type foil bearing with controllable mechanical preloads. Tribol. Int. 2018, 120, 187–202. [Google Scholar] [CrossRef]
- Guan, H.Q.; Feng, K.; Cao, Y.L.; Huang, M.; Wu, Y.H.; Guo, Z.Y. Experimental and theoretical investigation of rotordynamic characteristics of a rigid rotor supported by an active bump-type foil bearing. J. Sound Vib. 2020, 466, 115049. [Google Scholar] [CrossRef]
- Guan, H.; Feng, K.; Yu, K.; Sun, D.; Cao, Y. Real-Time Control of Rotor Vibrations With Active Bump-Type Foil Bearings. IEEE Trans. Ind. Electron. 2021, 68, 7412–7421. [Google Scholar] [CrossRef]
- Park, J.; Sim, K. A Feasibility Study of Controllable Gas Foil Bearings With Piezoelectric Materials Via Rotordynamic Model Predictions. J. Eng. Gas Turbines Power 2019, 141, 021027. [Google Scholar] [CrossRef]
- Sytin, A.V.; Shutin, D.V.; Polyakov, R.N. Applying Active Foil Bearings with Bimorph Piezoelectric Drives in Microturbines for Distributed Energy Systems. Int. Conf. Ind. Eng. 2021, 57, 446–455. [Google Scholar] [CrossRef]
- Sadri, H.; Kyriazis, A.; Schlums, H.; Sinapius, M. On modeling the static shape control of an adaptive air foil bearing. Smart Mater. Struct. 2020, 29, 085043. [Google Scholar] [CrossRef]
- Sadri, H. Active Shape Control of the Lubricant Film Geometry in Adaptive Air Foil Bearings; TU Braunschweig, Niedersächsisches Forschungszentrum für Luftfahrt: Braunschweig, Germany, 2020; pp. 49, 52–54, 56, 59, 124. [Google Scholar]
- DellaCorte, C.; Radil, K.C.; Bruckner, R.J.; Howard, S.A. Design, Fabrication, and Performance of Open Source Generation I and II Compliant Hydrodynamic Gas Foil Bearings. Tribol. Trans. 2008, 51, 254–264. [Google Scholar] [CrossRef]
- Shalash, K.; Schiffmann, J. On the manufacturing of compliant foil bearings. J. Manuf. Process. 2017, 25, 357–368. [Google Scholar] [CrossRef]
- Żywica, G.; Bagiński, P.; Andrearczyk, A. A new method of manufacturing a foil bearing using tools made by the rapid prototyping technology. CIRP J. Manuf. Sci. Technol. 2020, 31, 514–524. [Google Scholar] [CrossRef]
- Nielsen, B.B. Combining Gas Bearing and Smart Material Technologies for Improved Machine Performance Theory and Experiment; Technical University of Denmark: Lyngby, Denmark, 2017. [Google Scholar]


| Parameter | Symbol | Value | Unit |
|---|---|---|---|
| bearing width | b | 40 | mm |
| shaft diameter | 37.8 | mm | |
| segments | 3 | - | |
| sleeve radius | 19.7 | mm | |
| 20.048 | mm | ||
| 25 | mm | ||
| sleeve preload | 418 | m | |
| bumps per foil | 7 | - | |
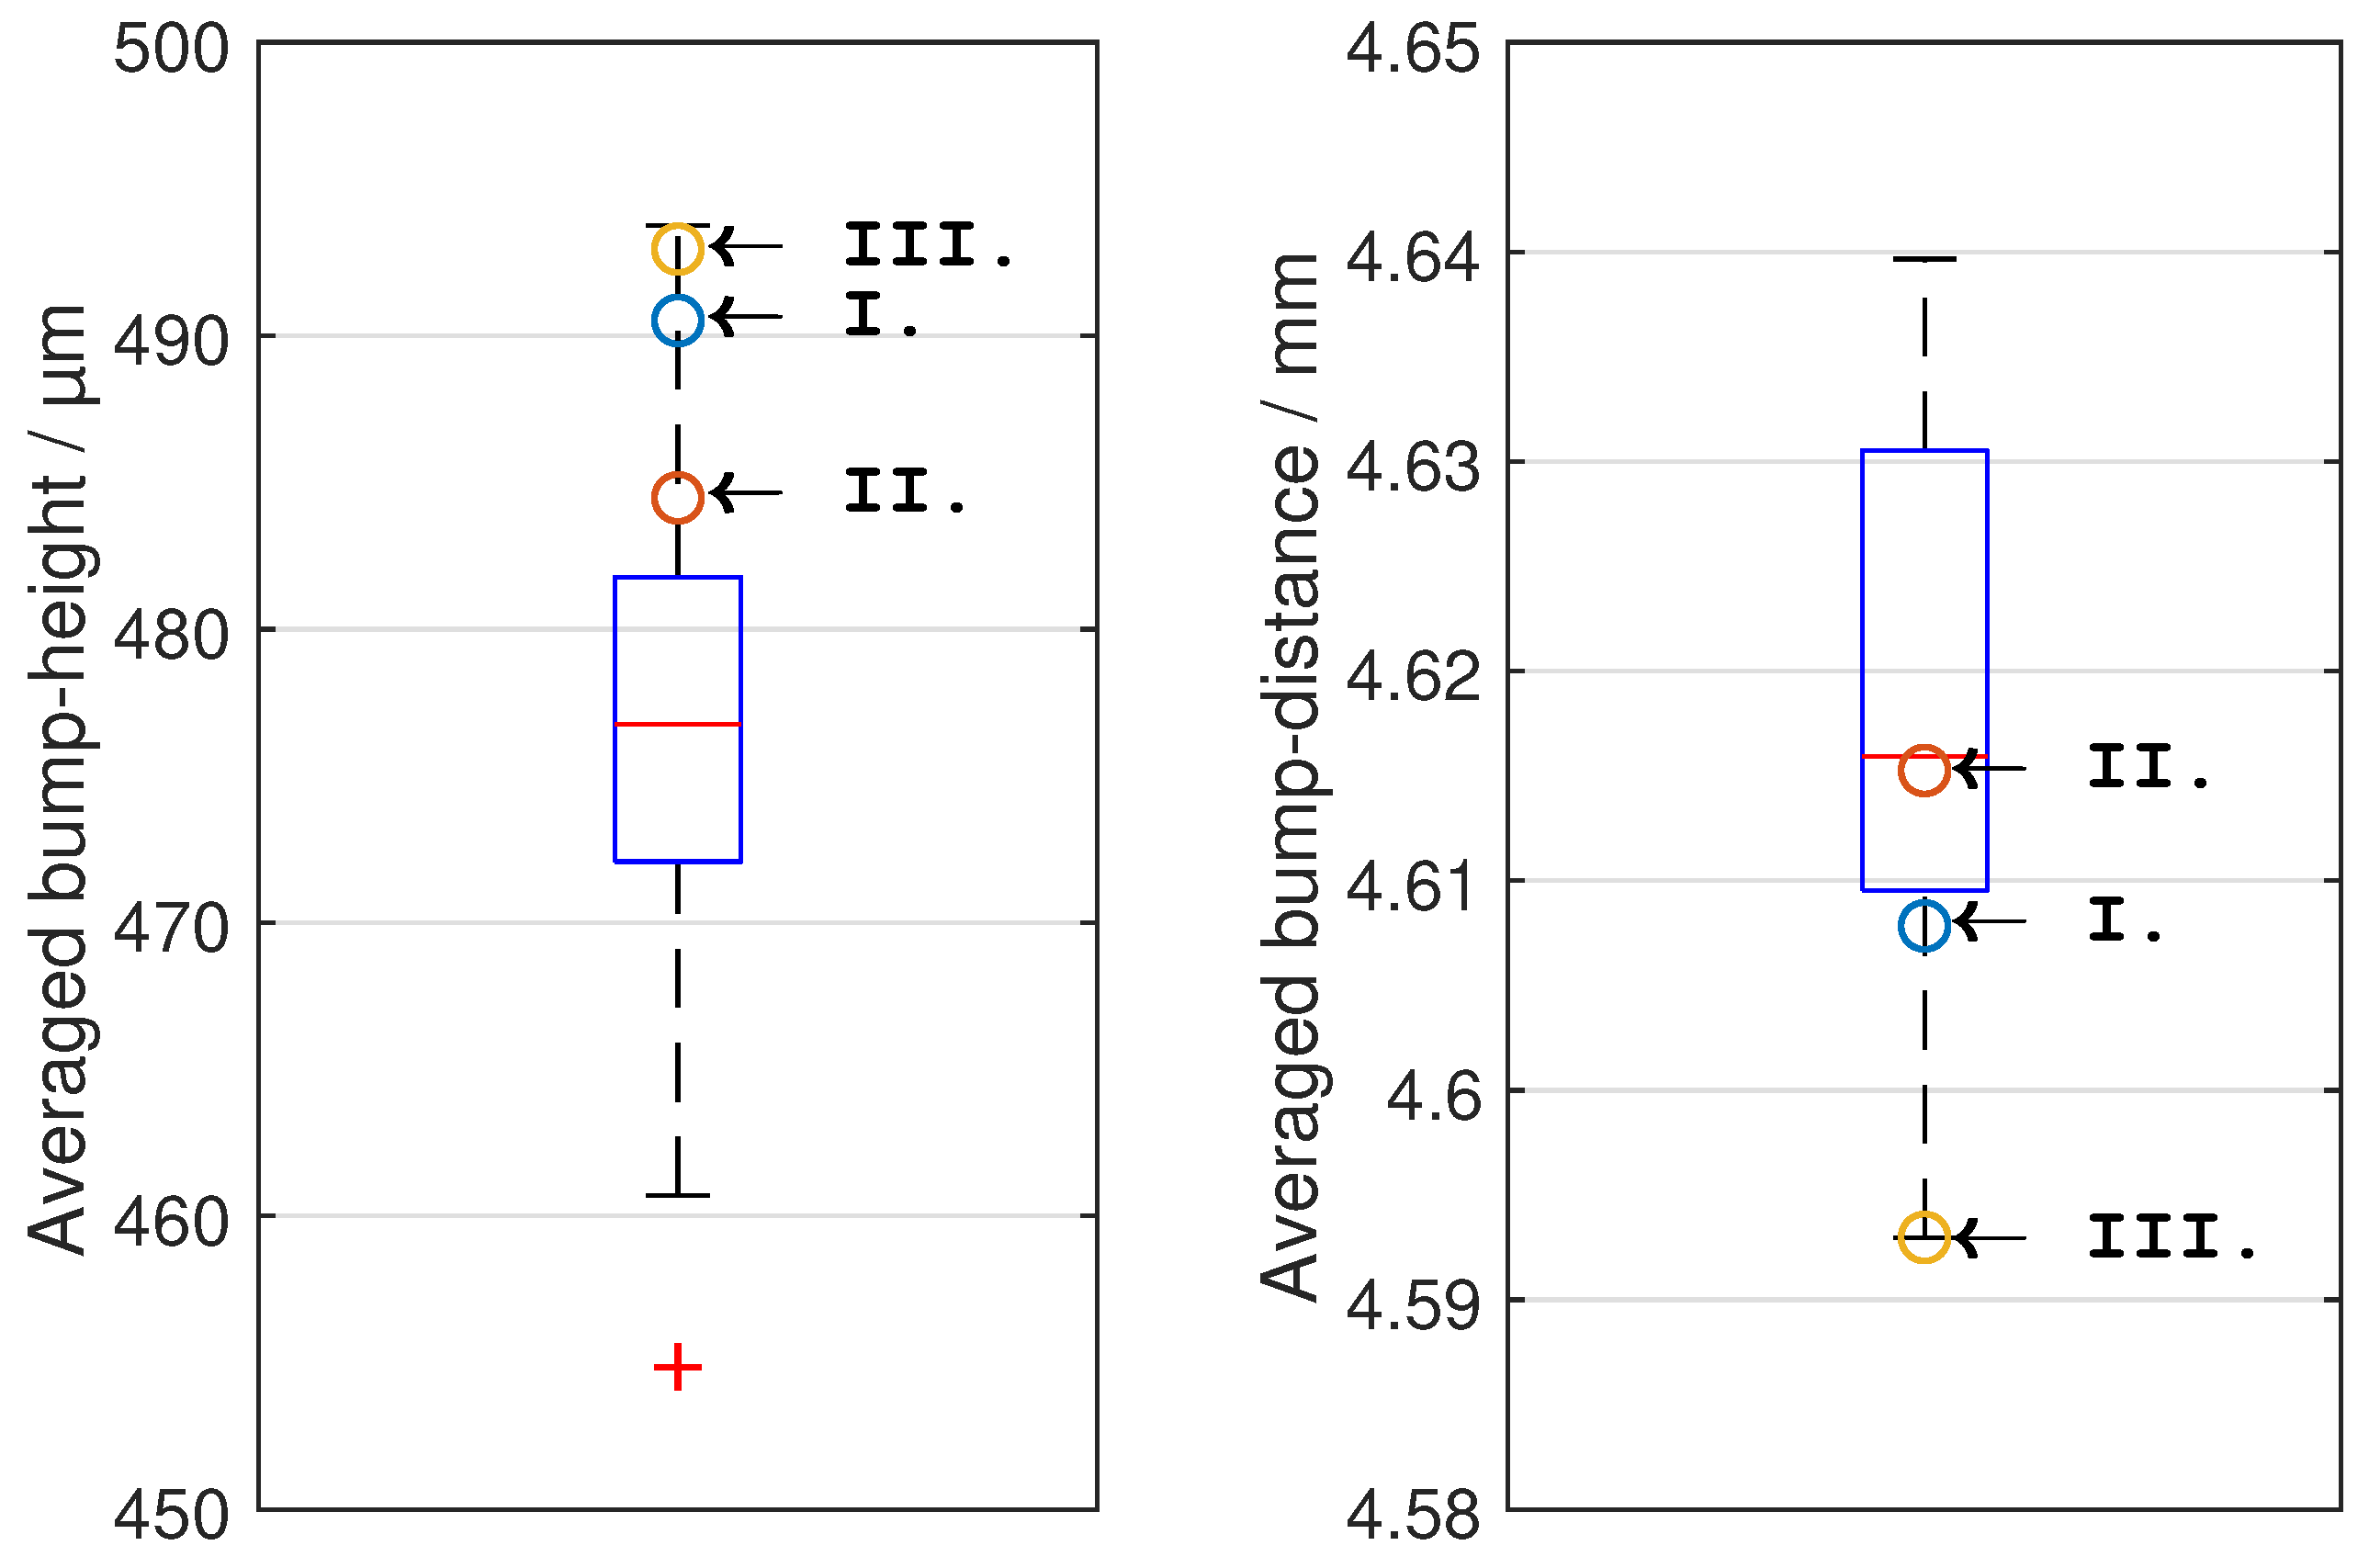
| bump height | 500 (≈489 *) | m | |
| bump half-length | 1.81 | mm | |
| bump distance | 4.59 (≈4.60 *) | mm | |
| foil thickness | t | 0.1 | mm |
| material sleeve | 1.4301 | - | |
| material shaft | 1.4057 | - | |
| material foils | 1.4310 | - | |
| material coating | MoS | - |
Publisher’s Note: MDPI stays neutral with regard to jurisdictional claims in published maps and institutional affiliations. |
© 2022 by the authors. Licensee MDPI, Basel, Switzerland. This article is an open access article distributed under the terms and conditions of the Creative Commons Attribution (CC BY) license (https://creativecommons.org/licenses/by/4.0/).
Share and Cite
Schmiedeke, H.; Sick, J.-H.; Sinapius, M. Experimental Investigation of Two Switching States of an Active Foil Bearing during Start-Up. Machines 2022, 10, 447. https://doi.org/10.3390/machines10060447
Schmiedeke H, Sick J-H, Sinapius M. Experimental Investigation of Two Switching States of an Active Foil Bearing during Start-Up. Machines. 2022; 10(6):447. https://doi.org/10.3390/machines10060447
Chicago/Turabian StyleSchmiedeke, Hannes, Jan-Hinrich Sick, and Michael Sinapius. 2022. "Experimental Investigation of Two Switching States of an Active Foil Bearing during Start-Up" Machines 10, no. 6: 447. https://doi.org/10.3390/machines10060447
APA StyleSchmiedeke, H., Sick, J.-H., & Sinapius, M. (2022). Experimental Investigation of Two Switching States of an Active Foil Bearing during Start-Up. Machines, 10(6), 447. https://doi.org/10.3390/machines10060447