Article

A Study for Improved Prediction of the Cutting Force and Chip Shrinkage Coefficient during the SKD11 Alloy Steel Milling

1
Faculty of Mechanical Engineering, Hung Yen University of Technology and Education, Hung Yen 160000, Vietnam
2
School of Mechanical Engineering, Hanoi University of Science and Technology, Hanoi 100000, Vietnam
*
Author to whom correspondence should be addressed.
Machines 2022, 10(4), 229; https://doi.org/10.3390/machines10040229
Submission received: 22 February 2022 / Revised: 22 March 2022 / Accepted: 22 March 2022 / Published: 24 March 2022

Abstract

:
This study proposed an innovative method for improving the prediction of the cutting force (F) and chip shrinkage coefficient (K) for milling of SKD11 alloy steels using simulations and experimental results. Preliminary experimental measurements of the F and K were made for variable cutting speeds and depths, and simulations were then conducted using the Johnson–Cook model. However, significant discrepancies between the experiments and simulations were observed for the F and K. Therefore, an improved method was proposed, utilizing the relationship between simulation/experimental cutting forces and the equivalent fracture strain of simulation elements in the shear zone in the space of the stress triaxiality and equivalent strain. The progression of fracture strain paths according to the stress triaxiality until the desired cutting forces were achieved was utilized for adding new data to the fracture strain locus in the space of the stress triaxiality and equivalent strain. The new fracture strain locus was adopted again, to simulate and predict the F and K at full 2 × 3 levels of cutting speeds and cutting depths, and the results were compared with those of the corresponding experiments. Based on the highest deviations between the simulation and experimental data for the cutting force (5.29%) and chip shrinkage coefficient (5.08%), this study confirmed that the proposed method for determining the new fracture strain locus can improve the prediction of the F and K for milling of SKD11 alloy steels.

1. Introduction

Nowadays, the machining of materials is one of the most popular production processes in the mechanical processing industry. Cutting techniques such as turning, milling, and drilling are widely used in the processing of products in the aerospace, automotive, and mold industries. During the machining process, the surface quality of a workpiece is affected by many factors. Therefore, the ability to predict phenomena occurring during metal machining is important for improving the cutting conditions and for increasing the product quality and quantity. The cutting force (F) and the chip shrinkage coefficient (K) are important factors that affect machining; these factors can be easily predicted by simulations, compared with other parameters such as surface roughness and tool life. The cutting force significantly affects the entire system, including machines, tools, and jigs. The chip shrinkage coefficient is an important parameter related to the variation of the chip dimensions and is often used for qualitatively evaluating the plastic deformation of the workpiece after machining [1].
Numerical simulation methods have proven effectiveness for understanding physical models as well as for minimizing machining costs, based on predicting and inspecting the effects of machining and geometrical parameters on the material machinability [2]. The finite element method (FEM) provided more detailed information about the cutting process, requiring a shorter calculation time and offering better flexibility for the cutting conditions compared with the corresponding experiments [3]. Many studies have used the three-dimensional (3D) FEM for simulating the machining process [4], because the 3D FEM enables to fully describe the complex machining process. However, owing to the computational complexity of the 3D FEM, orthogonal two-dimensional (2D) FEM has been widely used for analyzing machining-related phenomena. The orthogonal 2D FEM-based cutting model is less computationally involved, while the simulation results are not affected. Liu et al. [5] used an orthogonal 2D FEM-based cutting model of the milling process, which simplified the 3D FEM-based model of the milling process proportionately and reasonably. Converting 3D FEM-based to orthogonal 2D FEM-based simulations effectively reduced the number of elements and improved the simulation time. Although orthogonal 2D FEM-based simulations do not fully reproduce the geometric complexity and features of the full 3D milling process, they are very helpful for providing detailed information about the machining process [6].
To describe and explain the material chipping phenomenon using the FEM, a material fracture criterion model for the material removal process should be established. This fracture model is usually based on the relationship between the equivalent fracture strain and stress triaxiality [7]. Okushima et al. [8] pioneered the application of the FEM to machining processes, and several researchers have also used the FEM for describing various machining processes [9]. Today, with the development of powerful large-capacity supercomputers, commercial products in the field of the FEM-based simulations have been popularized and widely used [10]. Researchers have investigated chip-formation mechanisms and their characteristics related to the cutting conditions, using the FEM framework based on the Johnson–Cook (J-C) fracture model [11]. The J-C and Bao–Wierzbicki (B-W) fracture models are simple and useful models that use a combination of equivalent fracture plastic strain criteria and determine their dependence on the stress triaxiality, strain rate, and temperature [12].
Studies on the cutting force (F) and chip formation using FEM simulations have been performed by various researchers [13]. Korkmaz et al. [14] used a 2D FEM-based framework for studying the cutting force when turning martensitic stainless steel AISI 420. Their simulation results showed that the cutting force prediction is highly accurate without performing too many machining experiments on difficult-to-cut materials with a maximal deviation of 7% between the simulations and corresponding experiments. Leksycki et al. [15] studied the cutting force and chip formation when 17-4PH stainless steel was turned under different machining conditions. A 2D FEM-based model with the J-C material failure model was used for simulating the cutting force, and the predicted and experimental results agreed well. Hoa et al. [16] studied the cutting force when milling an aluminum alloy, using a FEM-based framework with a 2D orthogonal cutting model. The selected parameters for optimizing the cutting force for the A6061 material were obtained at the cutting speed of 1000 m/min, the cutting depth of 1 mm, the relief angle of 15°, and the rake angle of 4°. Munish et al. [17] simulated cryogenic-assisted turning of AA2024-T351 aluminum alloy to measure cutting forces and temperature. Simulation results were then verified with experimental data and showed very small deviation values of 5.7% for cutting forces and 6.16% for cutting temperature. In another study, Munish et al. [18] continued to demonstrate the accuracy and efficiency of the FEM model when researching the cutting force and temperature during dry turning and cryogenic-assisted turning of Ti6Al4V alloy. The deviations of the cutting temperature and cutting forces were (5.54%, 3.74%), (5.18%, 3.358%), and (8.42%, 3.03%) under dry condition, LN2 and CO2 cooling one. SKD11 alloy steels are difficult to machine but are widely used in the mold industry and in the automotive industry, owing to their strength, ductility, and rigidity that enable high-temperature working conditions [19]. SKD11 alloy steels are difficult to machine but are widely used in the mold industry and in the automotive industry. SKD11 alloy steels are used in high-temperature working conditions due to their strength, ductility, and rigidity. SKD11 alloy steels are often machined using advanced methods, such as grinding or electric discharge machining. However, these methods have limitations owing to their low material removal rates and expensive tools. Combining experimental and numerical methods for studying material machinability when milling SKD11 alloy steels is very meaningful for evaluating the influence of machining parameters on the output parameters such as the chip formation, the chip shrinkage coefficient (K), and the cutting force (F).
This study aimed to improve the ability to predict the cutting force (F) and chip shrinkage coefficient (K) when milling SKD11 alloy steels based on the information obtained from simulations and experiments on the cutting force. Preliminary milling experiments, performed for various cutting speeds and depths, were conducted, for comparing, evaluating, and validating the FEM-based model. The original J-C fracture model determined from a simple experiment was established as the input data to the FEM-based simulation. The FEM-based simulation results of the F and K were compared with those of the corresponding preliminary experiments, revealing large discrepancies. A novel fracture model was thus proposed to improve the predictions of the F and K. The model was based on the relationship between the evolution of the simulated cutting forces with the equivalent fracture strain and stress triaxiality at both positive/negative stress triaxiality elements of the shear zone, and limited by the corresponding preliminary experimental cutting forces. New fracture data in the space of the stress triaxiality and equivalent strain were added into the fracture strain locus based on the comparison of the FEM-based force evolutions at both positive/negative stress triaxiality elements and the corresponding preliminary experimental F values. These novel fracture model data were adopted again in orthogonal 2D FEM-based simulation, and the results were compared and validated for preliminary and more expanded experiments. The comparison revealed a significant improvement in the prediction accuracy of the F and K based on the proposed fracture model.

2. Material

2.1. Chemical Compositions and Material Properties

SKD11 alloy steel (JIS-G4404 according to the Japanese standard) is commonly used in mold processing [20]. This steel has high hardness, high compressive strength, high impact toughness, and good deformation resistance. In addition, this steel has the ability to maintain its hardness at a high temperature for a long time. Therefore, this steel is often used in the fabrication of extrusion molds, plastic injection molds, pressure casting molds, and other mechanical parts that require special properties. The chemical composition and physical properties of the SKD11 alloy steel are presented in Table 1 [20] and Table 2 [21], respectively.
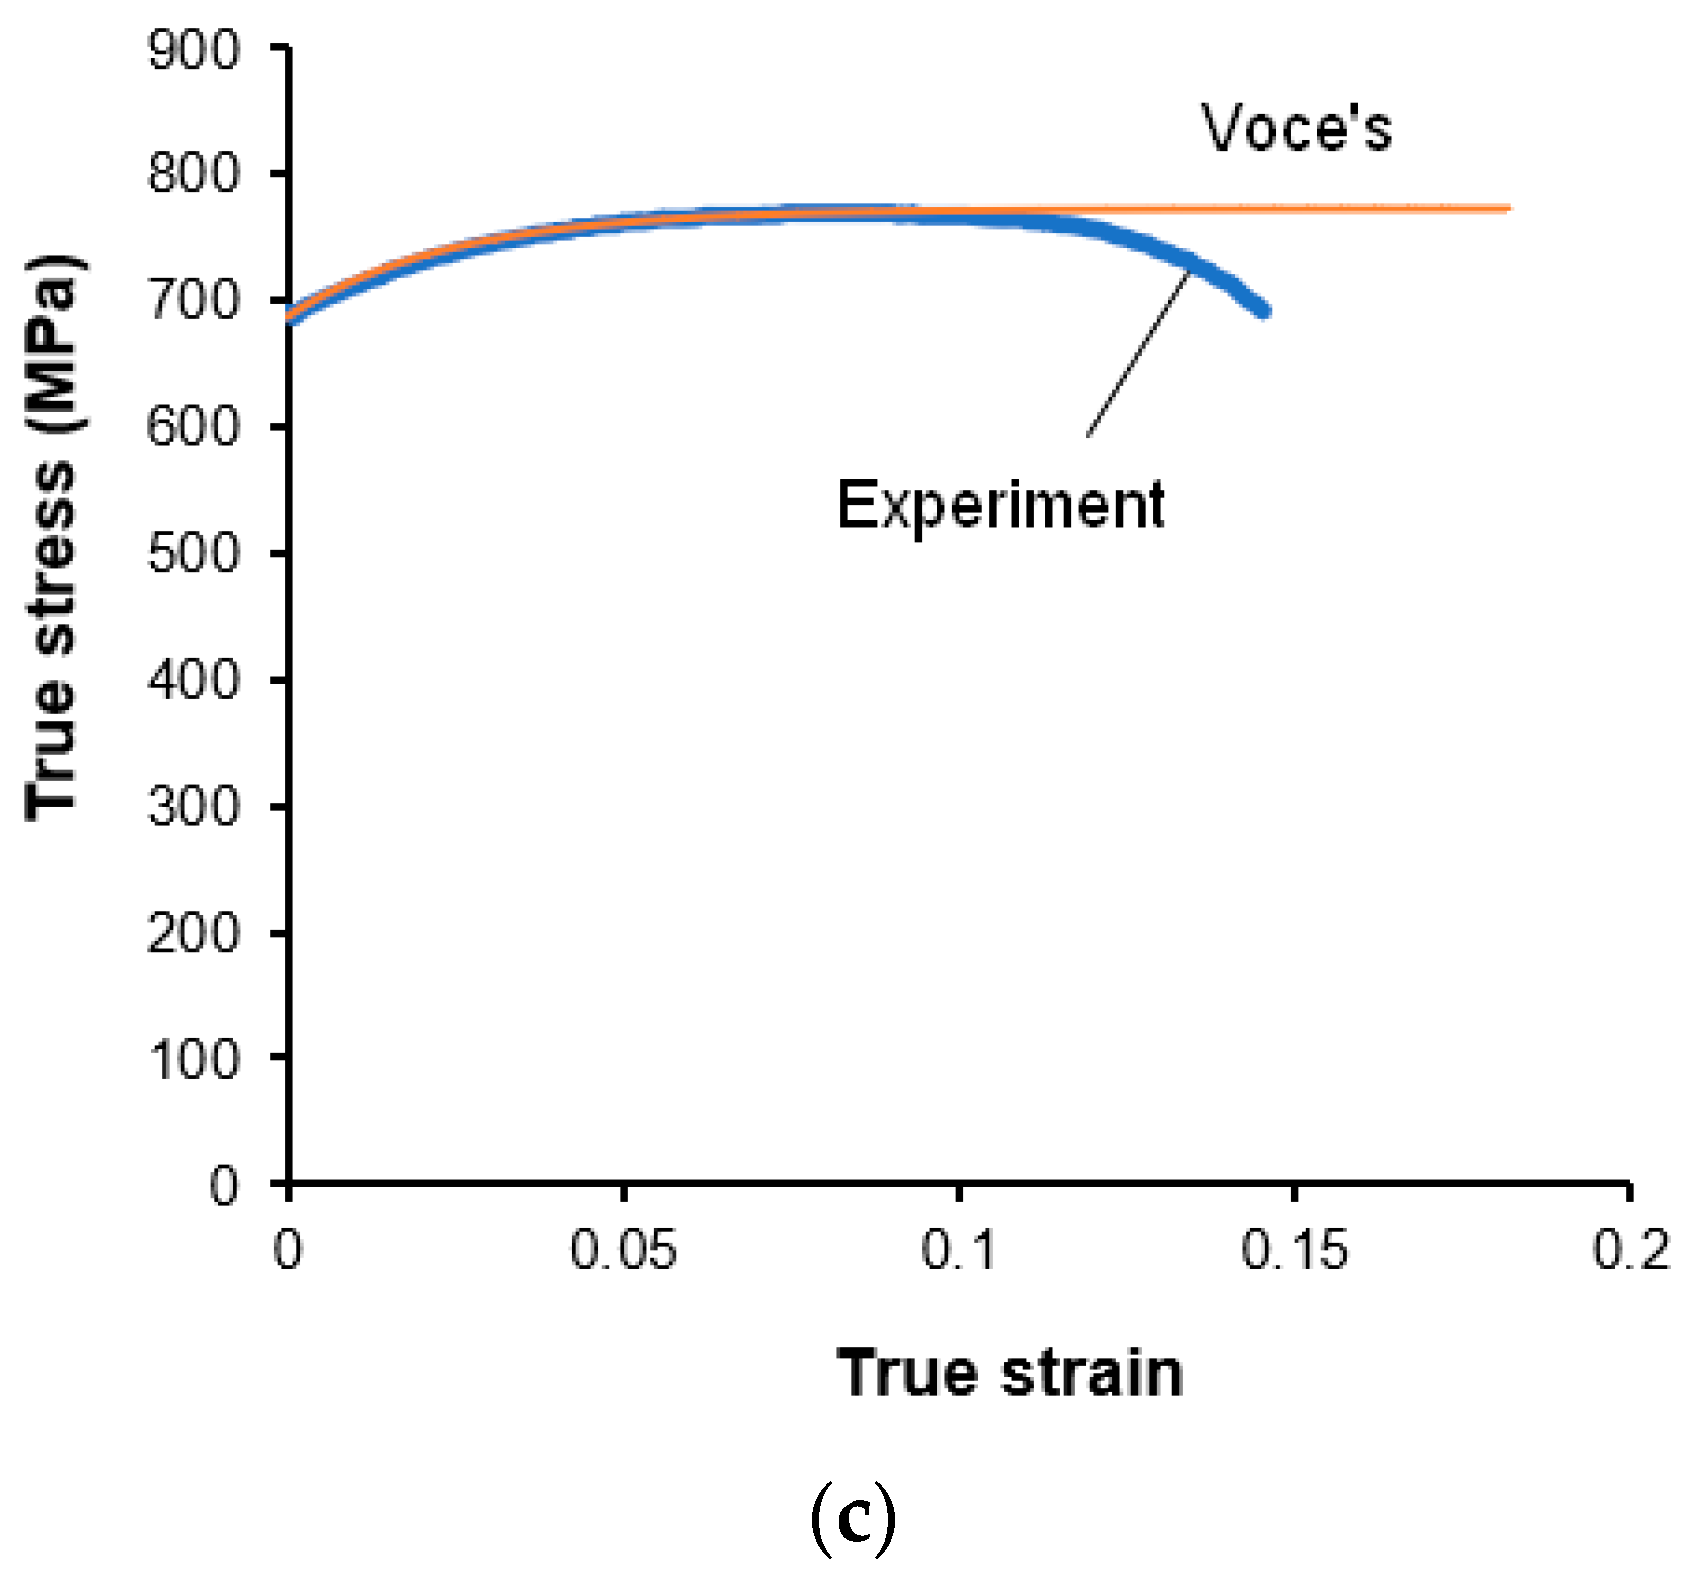
To determine the stress-strain curve of the SKD11 alloy steel, the samples of the tensile specimens (according to the ASTM-E8/E8M standard, Figure 1a) were first machined on the MORI SEIKI SL-250 SLANT BED CNC lathe. Tensile tests were then carried out on a HUNGTA H-200A machine (Figure 1b) to describe the deformation behavior of the SKD11 alloy steel. The true stress-strain curve was obtained, as shown in Figure 1c. Using the method of the least squares (lsqcurvefit) in MATLAB, based on Voce’s hardening law (Equation (1)) [22], the stress-strain equation was fitted. The hardening parameters are listed in Table 2.
σ ¯ = σ Y + A 1 exp B ε e q p l
where, A and B are the plastic coefficients, while σ ¯ , ε e q p l , and σY correspond to the equivalent stress, equivalent plastic strain without the elastic part, and tension yield stress, respectively.

2.2. J-C Fracture Model

The J-C fracture model was initially used in our FEM-based simulations to monitor the material removal progress, because it simultaneously considers the effects of strain, stress triaxiality state, strain rate, and temperature for the SKD11 alloy steel elements, as expressed by Equation (2).
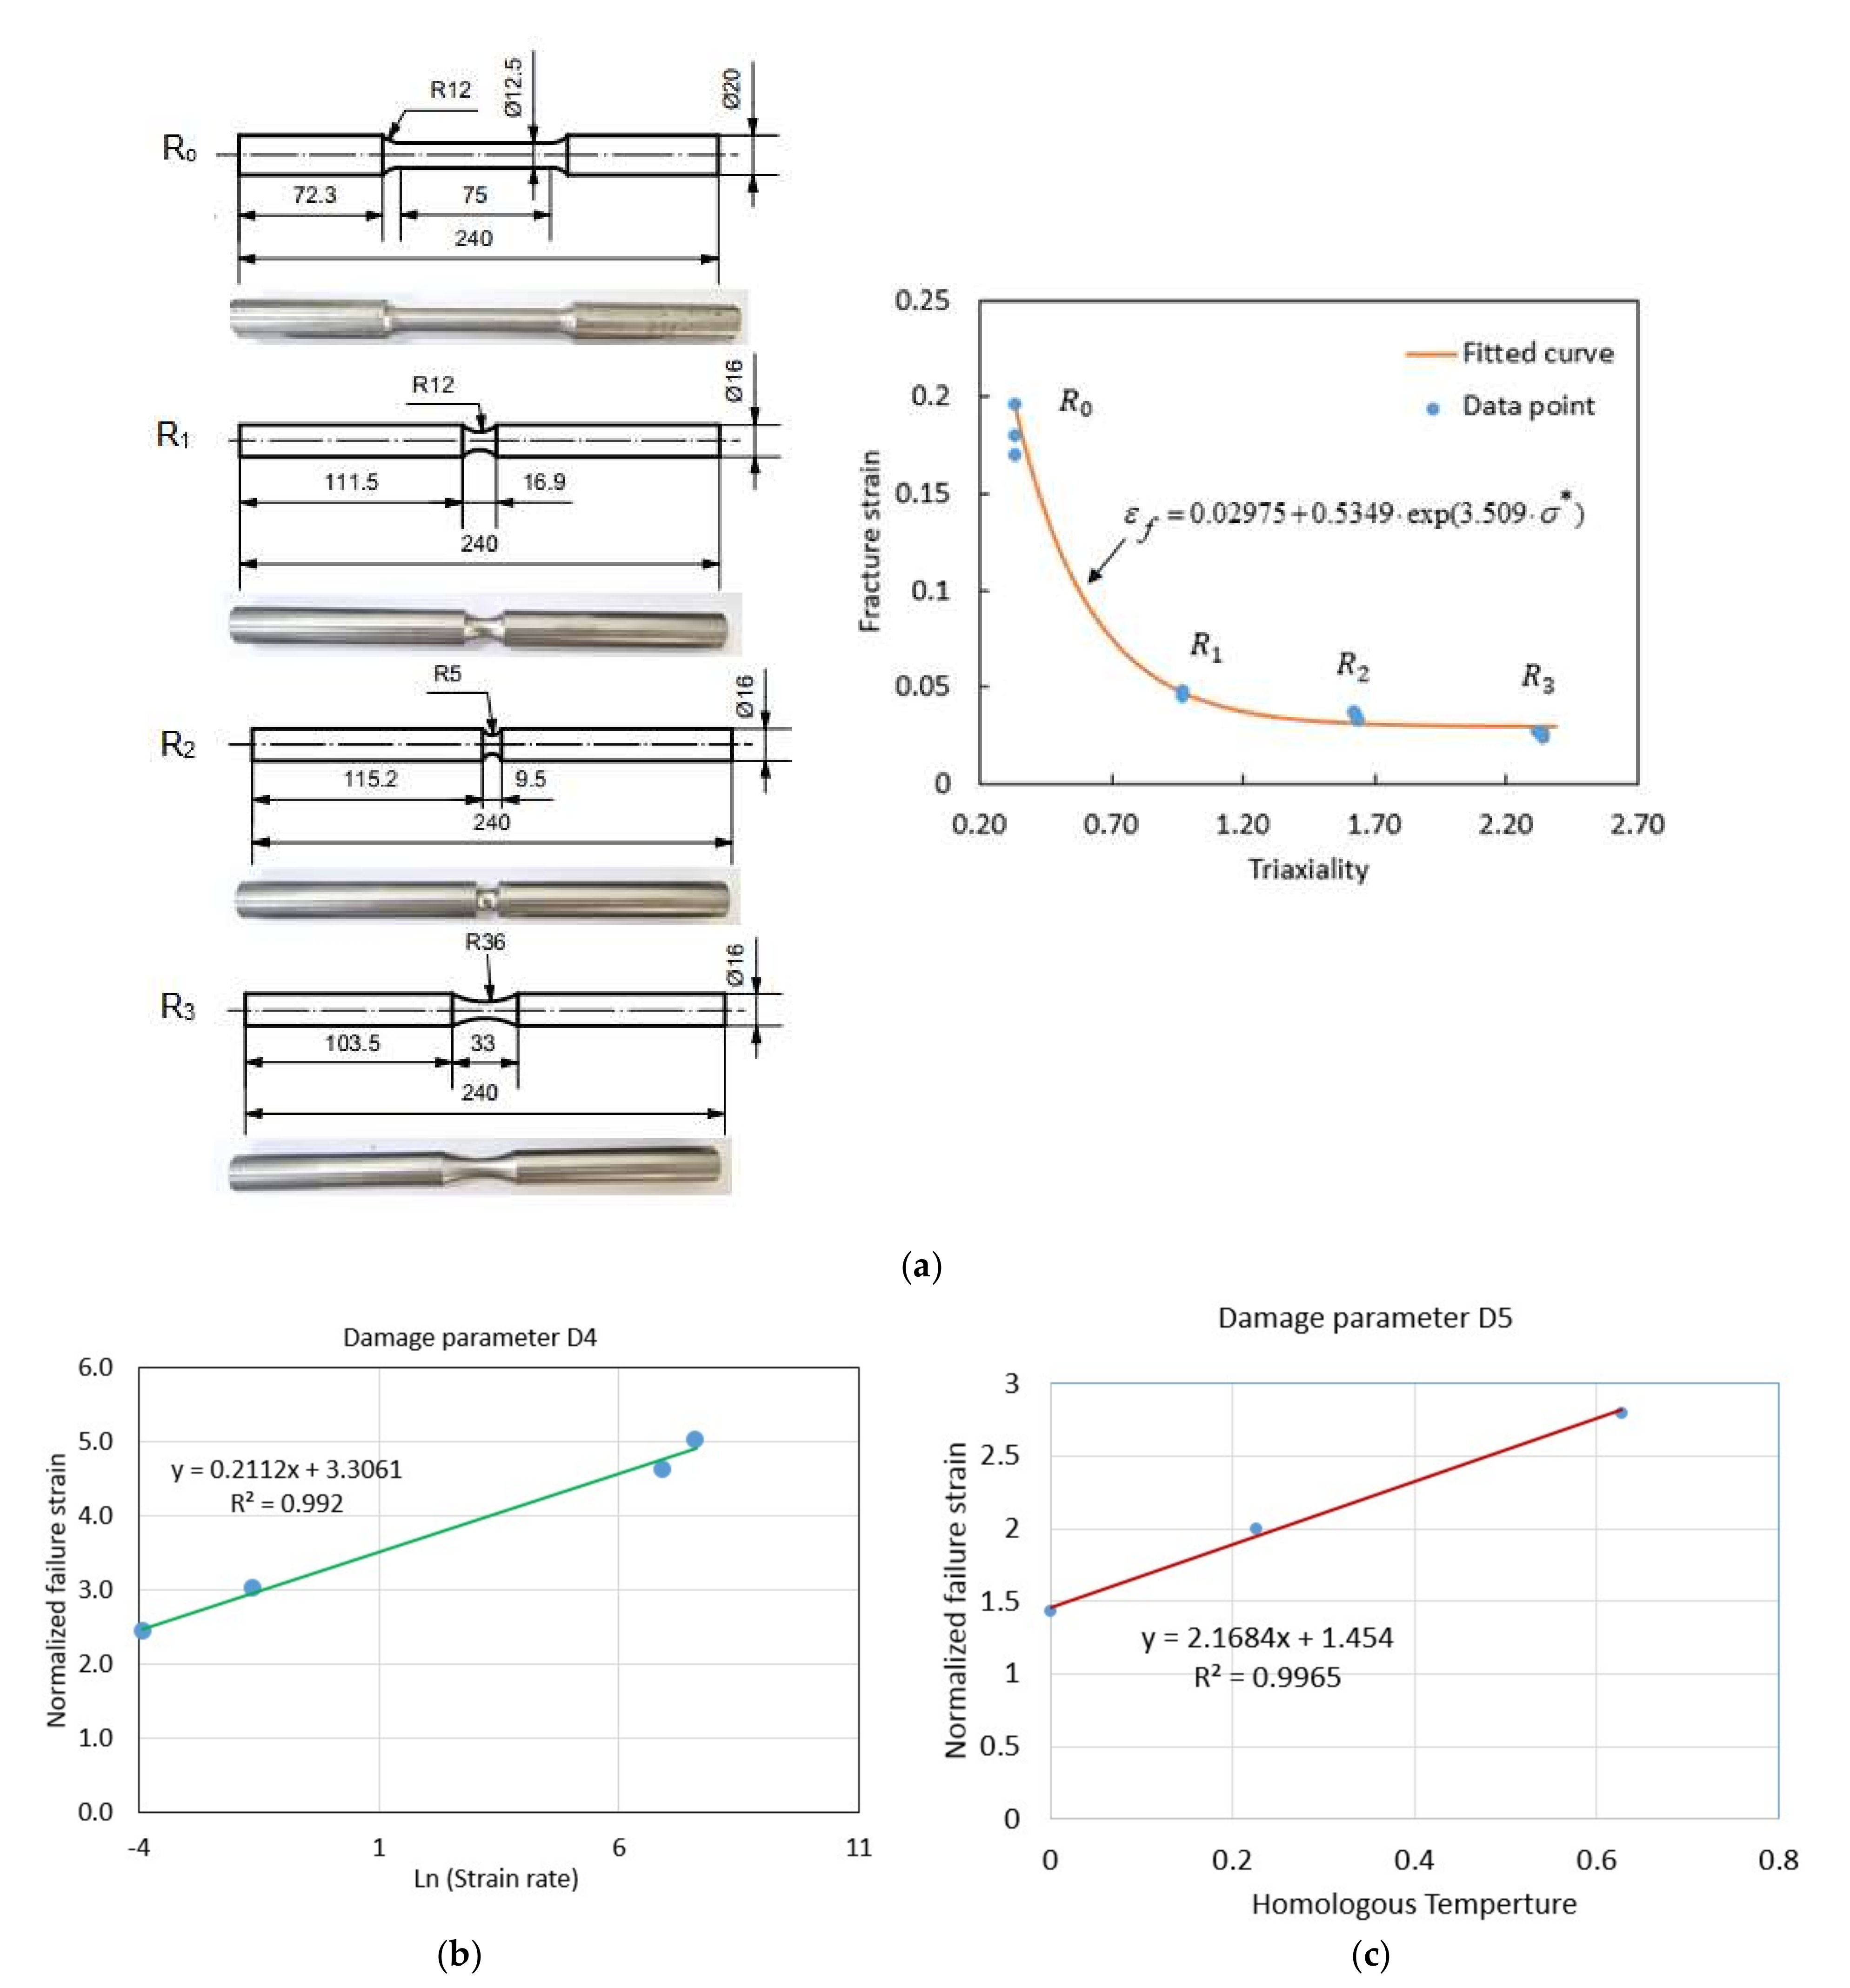
Here,   ε f   is the equivalent fracture strain, σ* is the stress triaxiality, ε ˙ ¯ p l ε ˙ 0   is the ratio of the plastic to the reference strain rate, T, Tm and Tr are the current, the melting temperature, and the reference temperature, respectively. The material constants Di (i = 1, 2, 3, 4, 5) were obtained from the relationship between the equivalent fracture strain and stress triaxiality, strain rate, and temperature, respectively (Table 3). The constants D1, D2, and D3 in Equation (2) were determined by fitting the fracture strain curves at various stress triaxiality levels, according to the tensile specimens (R0, R1, R2, R3) at the reference strain rate, as shown in Figure 2. The D4 and D5 material parameters were obtained, respectively, based on the effects of the strain rate and temperature on the equivalent fracture strain (Figure 2b).
ε f = D 1 + D 2 exp ( D 3 σ * ) 1 + D 4 ln ε ˙ ¯ p l ε ˙ 0 1 + D 5 T T r T m T r m

3. Experiments

The experimental setup for milling SKD11 alloy tool steels, for measuring the cutting force, and for determining the chip shrinkage coefficient are presented in this section.

3.1. Experiment Setup

Figure 3a shows the experimental setup for the milling process of a rectangular SKD11 alloy steel workpiece. The HS Super MC500 CNC machine without a lubricant or coolant (the “dry” condition) was set up for these experiments. The cutting tool (diameter, 40 mm) had a carbide insert of APKT 1604PDR–GM. To avoid instabilities during milling, the carbide insert was replaced with a new one after each experiment. In this study, the effect of the tool wear was negligible, based on the relatively short milling time (10–20 s). Milling was pretested several times to confirm the stability of the work-piece fixture system concerning statistical fluctuations.

3.2. Cutting-Force Measurement

This study used an orthogonal three-component cutting-force measuring device (Kisler 9257B; Kisler, Switzerland). A dynamometer was connected to a charge amplifier. The cutting-force experimental data were saved to a computer using a data-acquisition system (DASYlab 10.0). The experimental cutting-force graph with the components of the cutting forces is shown in Figure 3b. The red, blue, and pink curves are the X-, Y-, and Z-directional cutting forces, respectively. The overall cutting force (F) is the cutting-force average, determined using Equation (3).
F = F X 2 + F Y 2 + F Z 2
where FX, FY, and FZ are the X, Y, and Z directional cutting forces, respectively.

3.3. Chip Shrinkage Coefficient (K) Determination

The chip shrinkage coefficient is a valuable parameter to describe the machining parameters’ effect on the deformability of metal and chip morphology [16]. The value of the chip shrinkage coefficient depends on all the factors that affect the chip deformation, including the mechanical properties of the workpiece material, the geometry of the cutting tool, the machining parameters, and other cutting conditions. The material’s mechanical properties have a great influence on K. When other cutting conditions are constant, the more ductile the material, the weaker the bond between metal atoms, making the arrangement of the metal lattice more easily destroyed. So, the metal will be more deformed when machining. For machining parameters, including cutting speed, feed rate, and cutting depth, the cutting speed has a great effect on K. When cutting speed increases, the contact length between the chip and the rake face of the cutting tool is reduced, thereby reducing friction and reducing K. As the cutting depth increases, the chip shrinkage coefficient decreases because the chip deformation along the chip thickness is not uniform, the closer the chip layer is to the cutting tool’s rake face, the greater the deformation. Therefore, the thin chip has a larger K-value than the thick chip. K is an important parameter that determines the progress of the cutting process, because the K changes lead to a change in the cutting forces and the machined surface quality.
The plastic deformation of the material after machining was qualitatively evaluated using the K values. This coefficient could be defined as the ratio of the length of the chip cut (Lc) to the traveling distance of the tool along the work surface (L), or as the ratio of the chip thickness (to) to the uncut chip thickness (t). However, determining the traveling distance L of the tool along the work surface is very complicated; thus, the experiments for determining K often utilized the chip mass, as shown in Equation (4).
K = 1000 Q ρ l f r t
where Q, ρ, fr, l, and to are the chip mass (g), the material density (g/cm3), the feed rate (mm/rev), the chip length (mm), and the cutting depth (mm), respectively.
To determine the K with high accuracy, the chip mass was measured using a Japanese AND HR-200 microscale, and the chip length was measured using a 3D scanning method based on GOM Inspect Professional software (Figure 3c).
Primary experimental results of determining the F and K at different cutting speeds and depths are presented in Table 4.

4. Finite Element Simulations

4.1. FEM-Based Model

As mentioned above, analytical methods that use experiments for determining the F and K in machining require complex experimental equipment and are difficult to arrange during machining. Given this, FEM-based approaches have become very useful for simulating machining processes, thereby enabling the analysis of the influence of parameters such as the cutting speed and depth on the F and K.
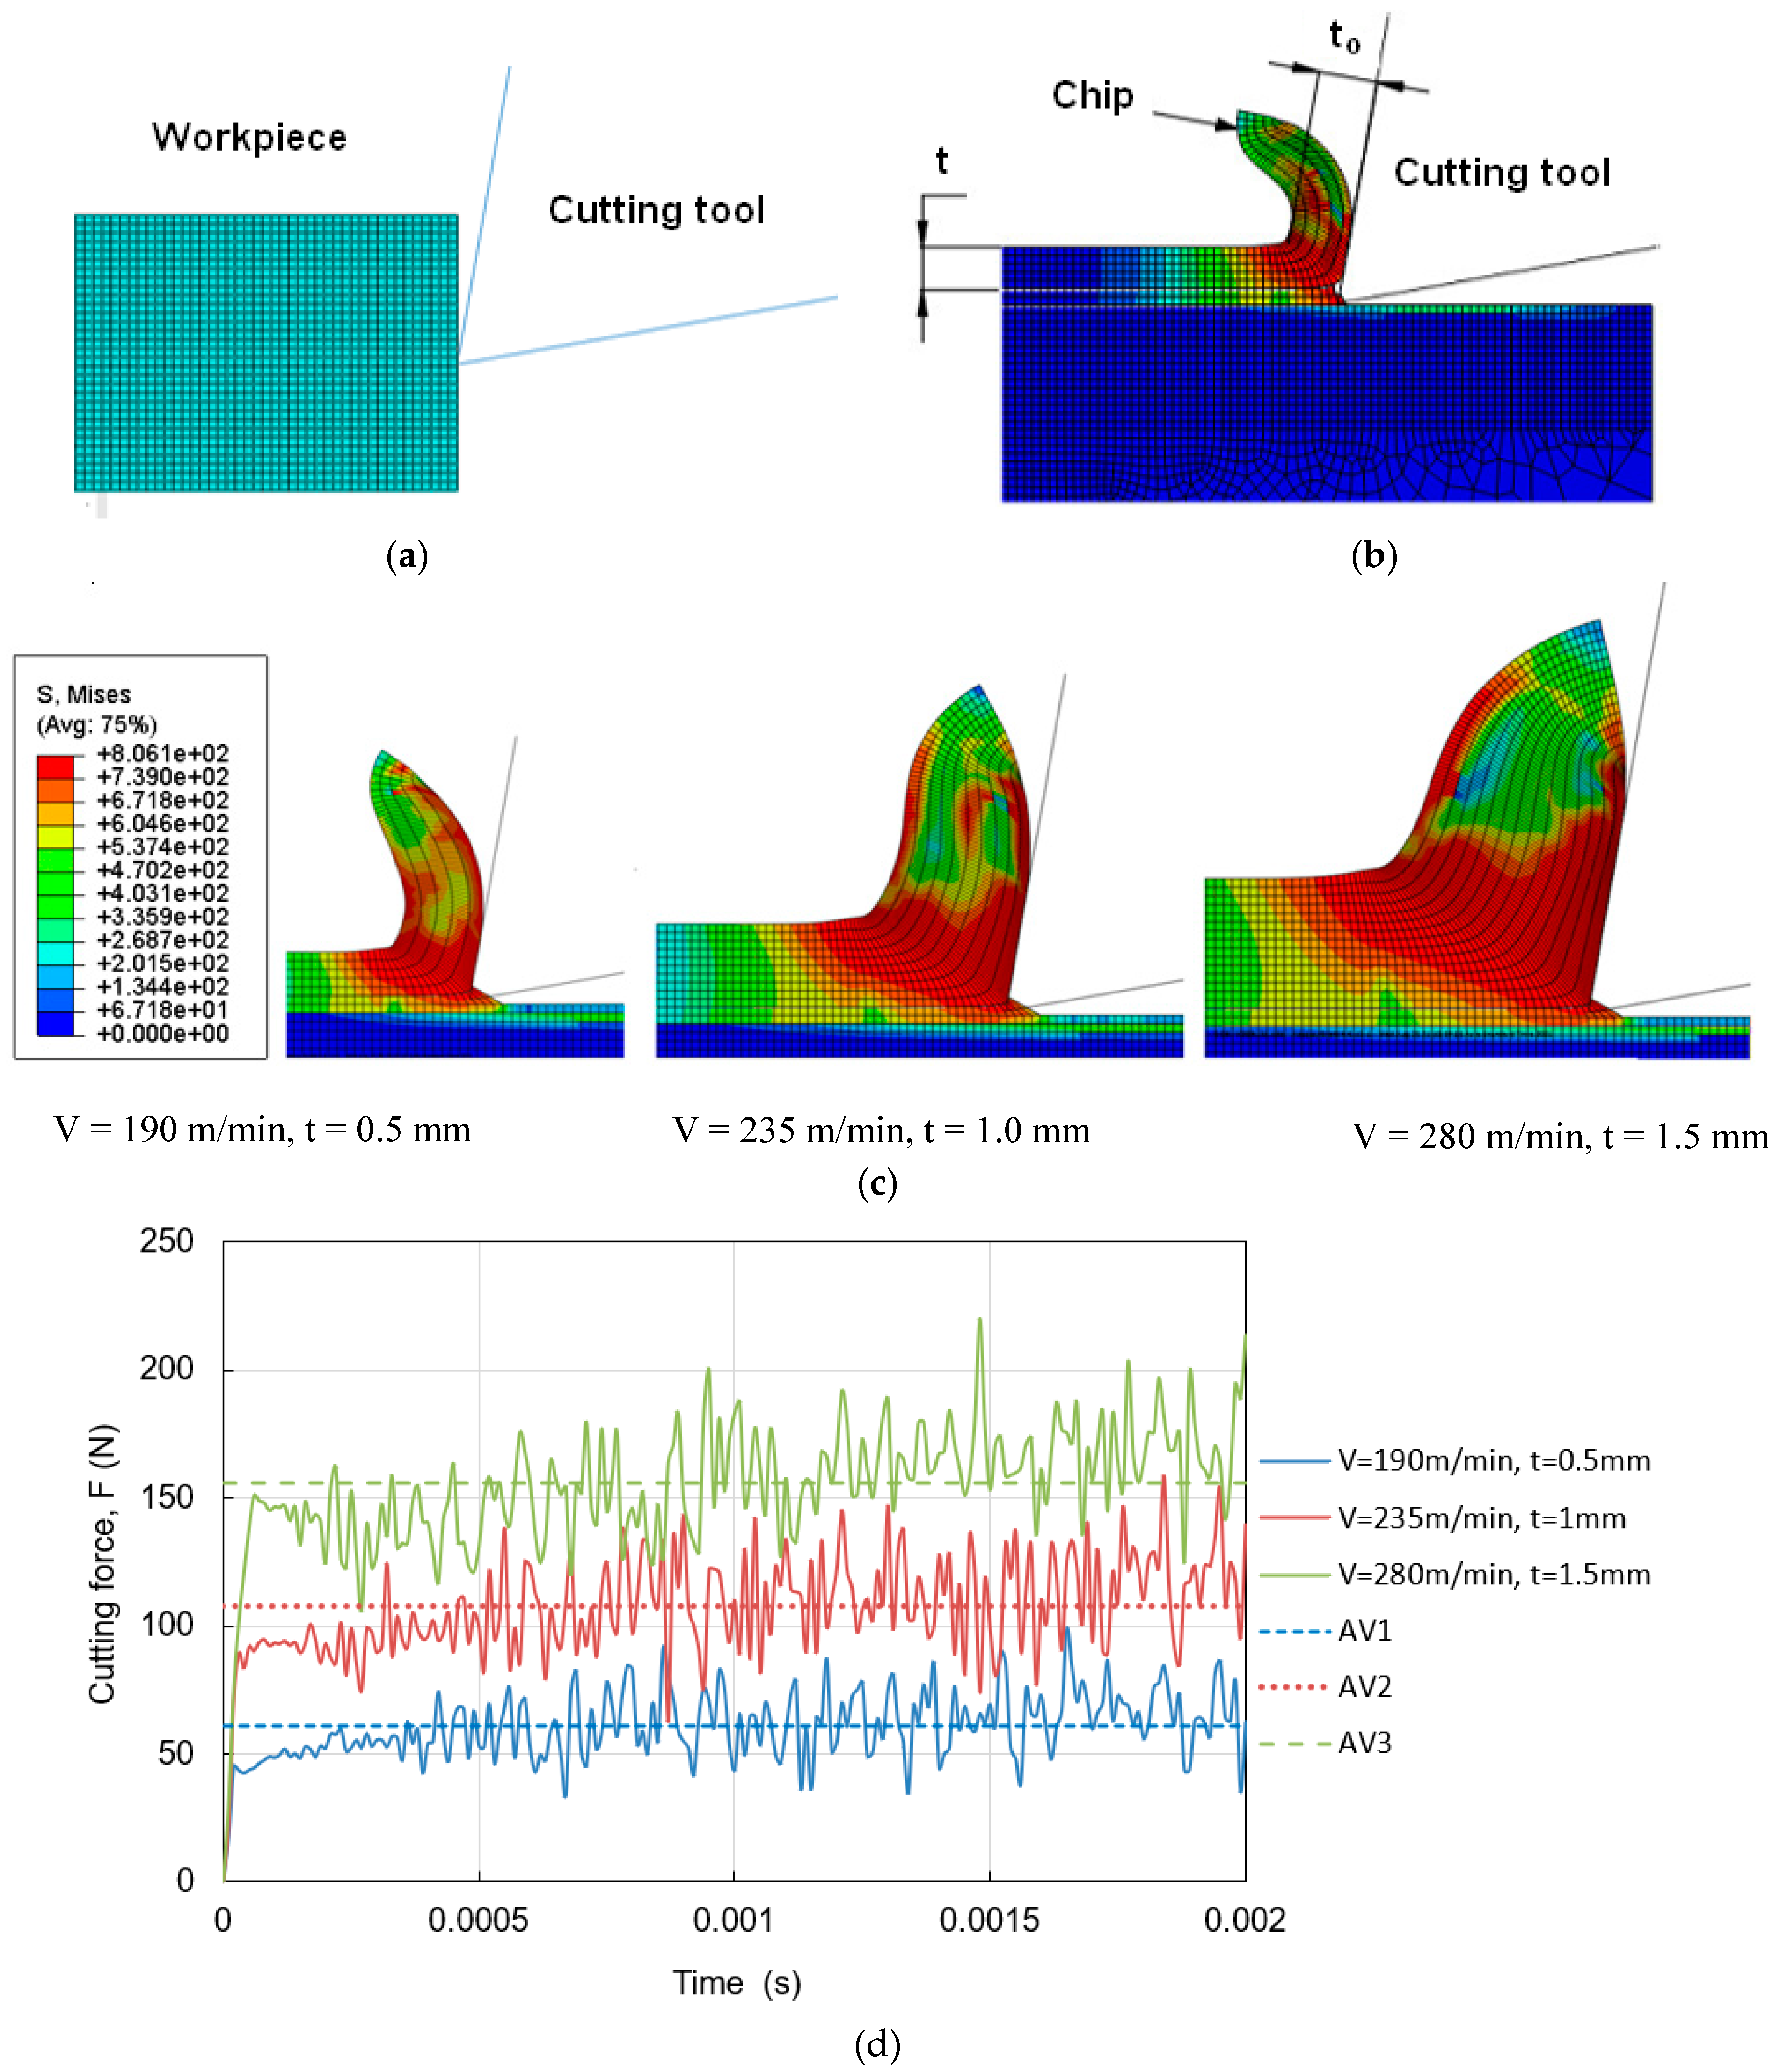
In this study, orthogonal 2D FEM-based simulations of chip formation during the milling of SKD11 alloy steels were performed using Abaqus/Explicit numerical simulation software (Figure 4a). The FEM formed (CPE4RT) elements are suitable for combined temperature-displacement calculations. To separate the chips from the workpiece, the J-C fracture model was adopted for all FEM elements to delete separated elements when their value reached 1 unit based on the fracture criterion. The uncut chip thickness varied in the 0.5–1.5 mm range. The cutting speed direction was parallel to the workpiece. The workpiece was fixed on the bottom, left, and right sides, to resist both vertical and horizontal movements. The tool-chip friction was established based on Coulomb’s law of friction.

4.2. Cutting Force (F) and Chip Shrinkage Coefficient (K) Determination

In this study, the milling process was modeled using the orthogonal 2D FEM-based framework. The J-C fracture model was used for simulating the milling process of the SKD11 alloy steel for determining the F and K. The FEM-based simulations were advantageous for determining the F and K without using complicated equipment. However, it was necessary to validate the model-based predictability of the J-C fracture criterion.
The FEM-based simulations readily yielded the F based on the reference node point of the cutting tool. The simulated K was calculated based on the ratio between the chip thickness and uncut chip thickness, using Equation (5) [23], and was easily measured using the FEM-based model, as shown in Figure 4b. Figure 4c shows the chip formations corresponding to the preliminary experiments in Table 4.
K = t o t
where t and to represent the uncut chip thickness and the chip thickness, respectively.
Preliminary experiments with various cutting conditions were simulated using the FEM-based framework, for predicting the F and K values (Figure 4). The predictive power of the J-C fracture model was first validated by comparing the F and K values obtained from the model simulations with those that were obtained from the corresponding preliminary experiments. Figure 4d shows the evolution of the F in the simulation corresponding to several preliminary experiments. The resulting cutting force (FS1) and chip shrinkage coefficient (KS1) values, obtained from the FEM-based simulations, are summarized in Table 5. The discrepancies of the F and K values across the simulations and corresponding experiments were calculated and compared for evaluating the predictive power of the J-C fracture model, as shown in Equations (6) and (7), respectively.
Δ F S = F E F S 1 F E 100 %
Δ K S = K E K S 1 K E 100 %
where ΔFS and ΔKS are the discrepancies of the simulated F and K values, relative to the values obtained in the corresponding experiments; FE, FS1, KE, and KS1 are the experimental F, the simulated F, the experimental K, and the simulated K, respectively.
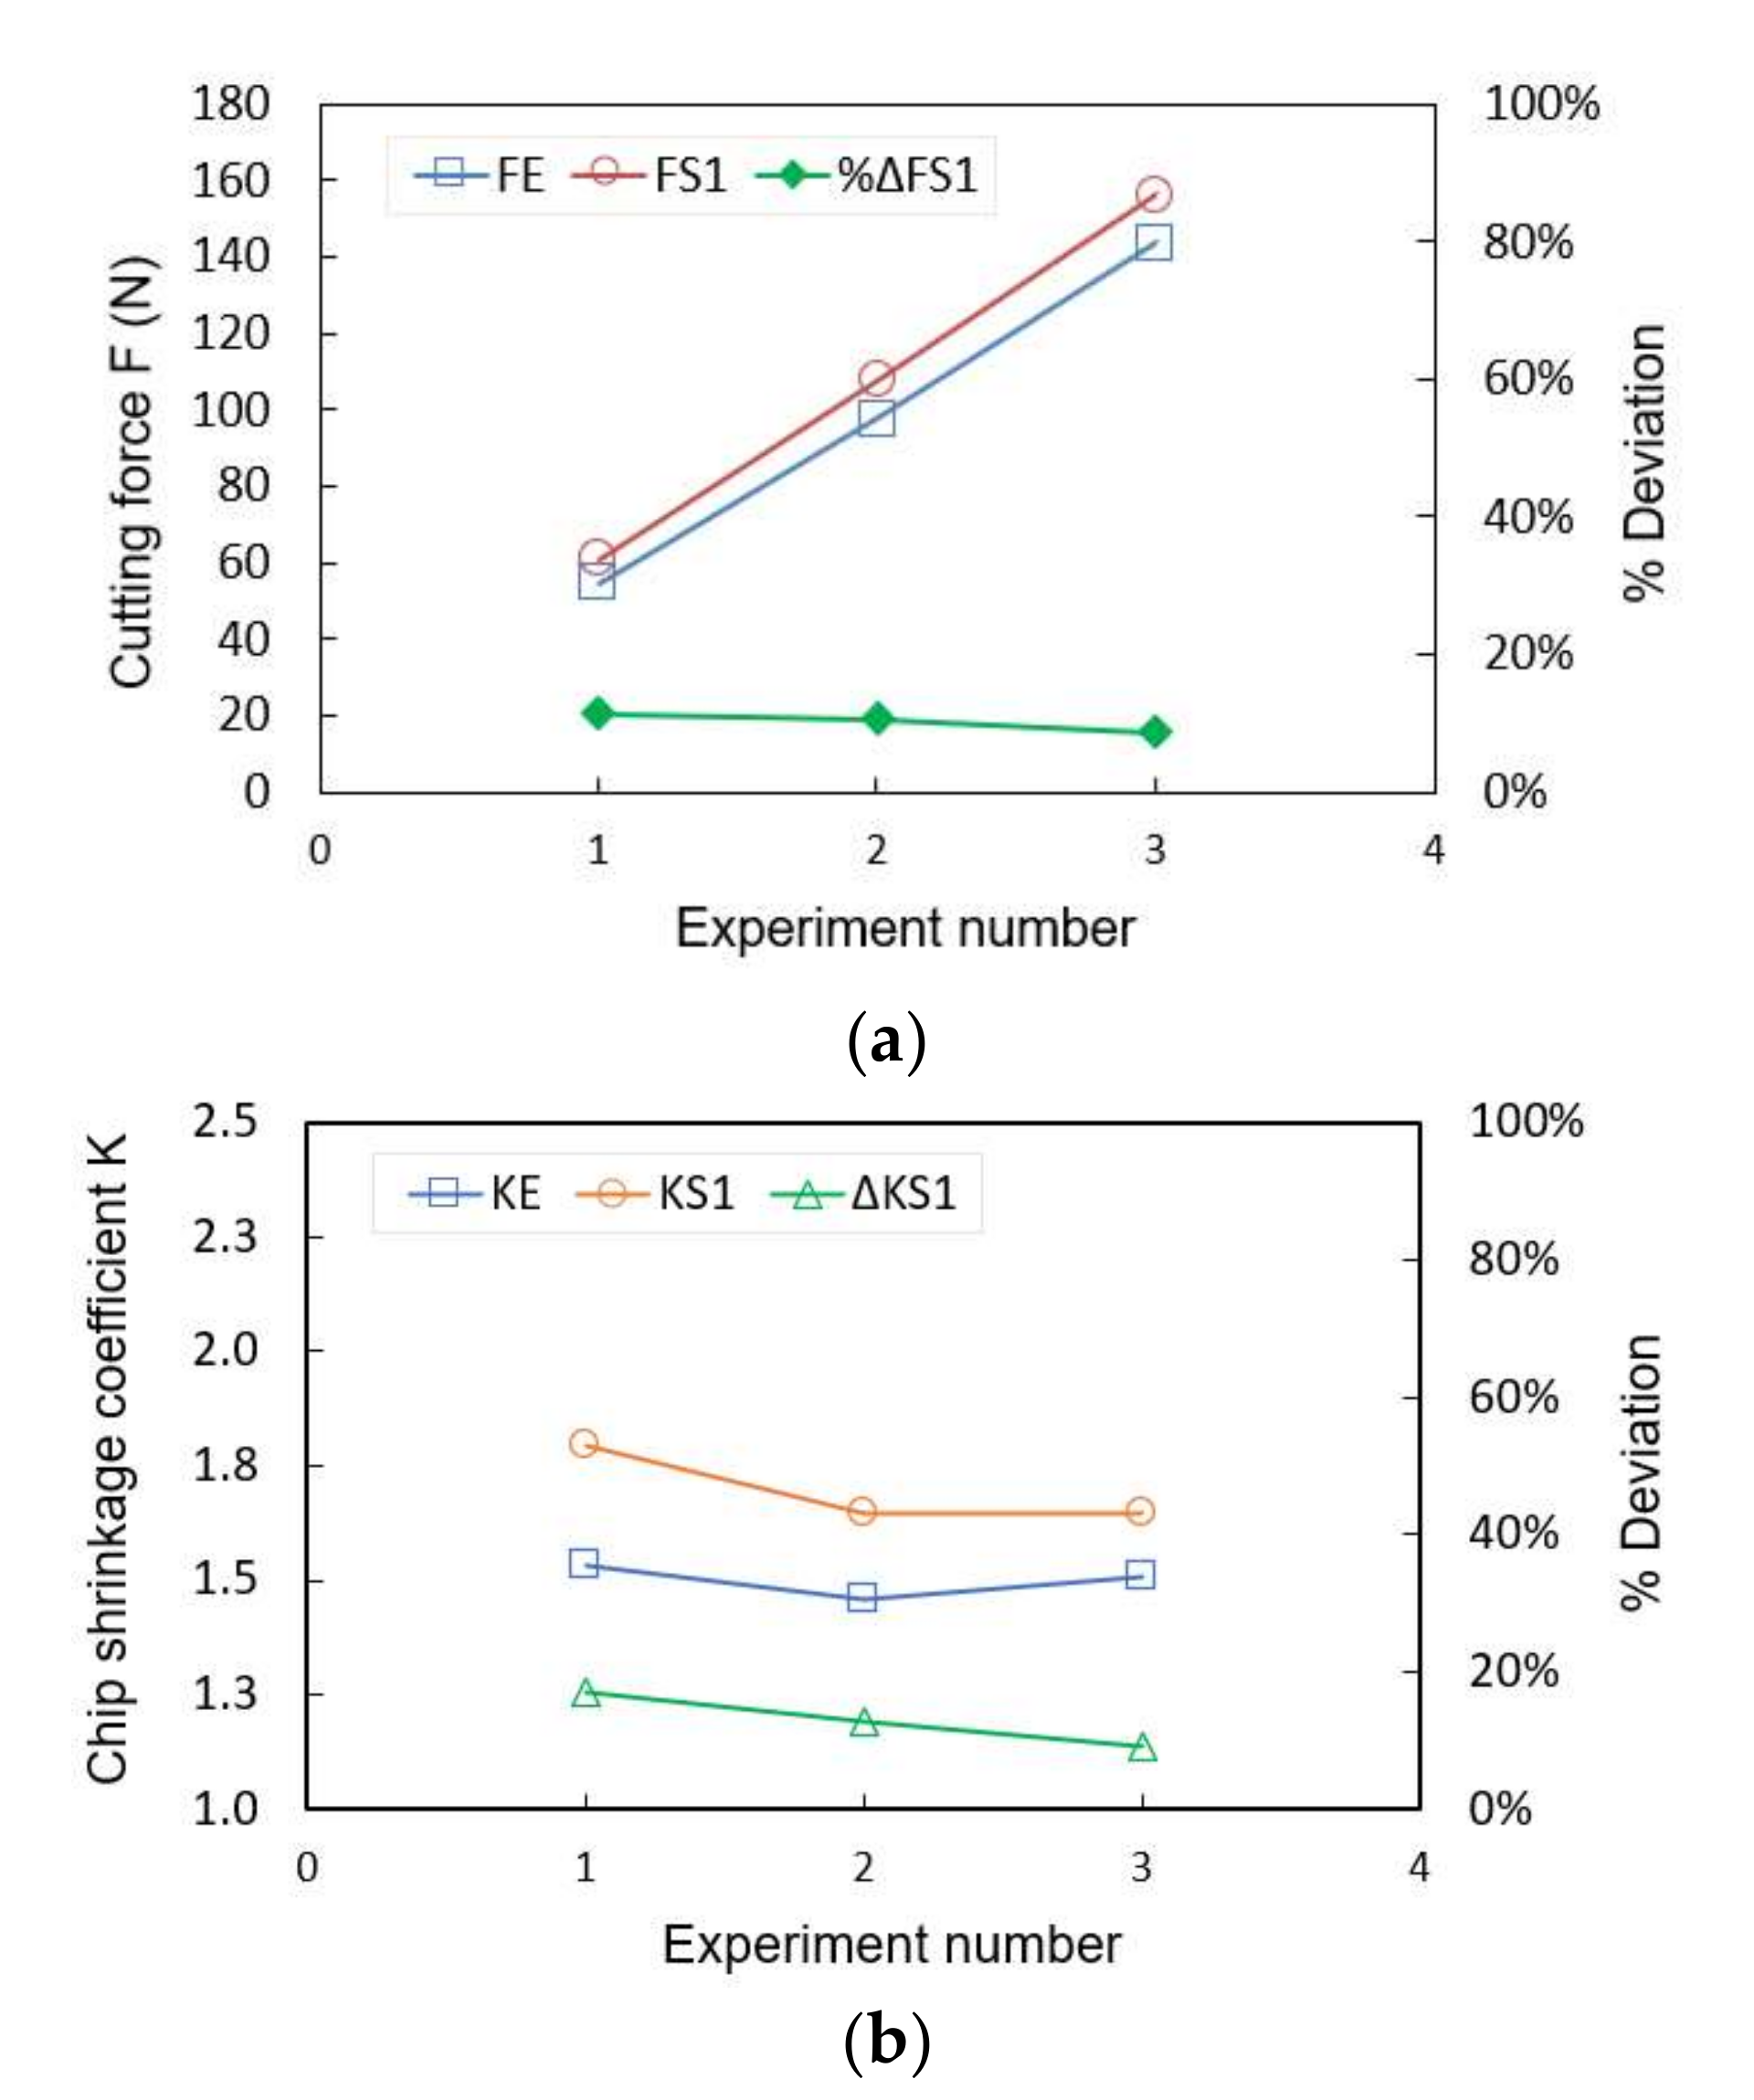
Table 5 also presents the discrepancies between the simulation and experimental results, based on the predictive power of the J-C fracture model. Preliminary observations of the effects of the cutting depth and speed on the F and K are shown in Figure 5a and Figure 5b, respectively. Figure 5 also shows that the F increased, and the K changed insignificantly when the cutting depth and speed were increased simultaneously. Comparing the results for the discrepancy between the simulations and the corresponding experiments revealed rather large differences. The largest and smallest relative differences for the cutting force and chip shrinkage coefficient were 11.44%/8.71% and 17.03%/9.17%, for the larger/smaller cutting speed and depth, respectively. The large deviation between the simulation results and the corresponding preliminary experimental results indicated that the utilized FEM-based simulation based on the J-C fracture model did not accurately predict the quantities of interest. Therefore, it is necessary to improve the predictability of the fracture model, especially the fracture strain evolution occurring in the shear zone in the space of stress triaxiality and equivalent strain.

5. Modification of the FEM-Based Model

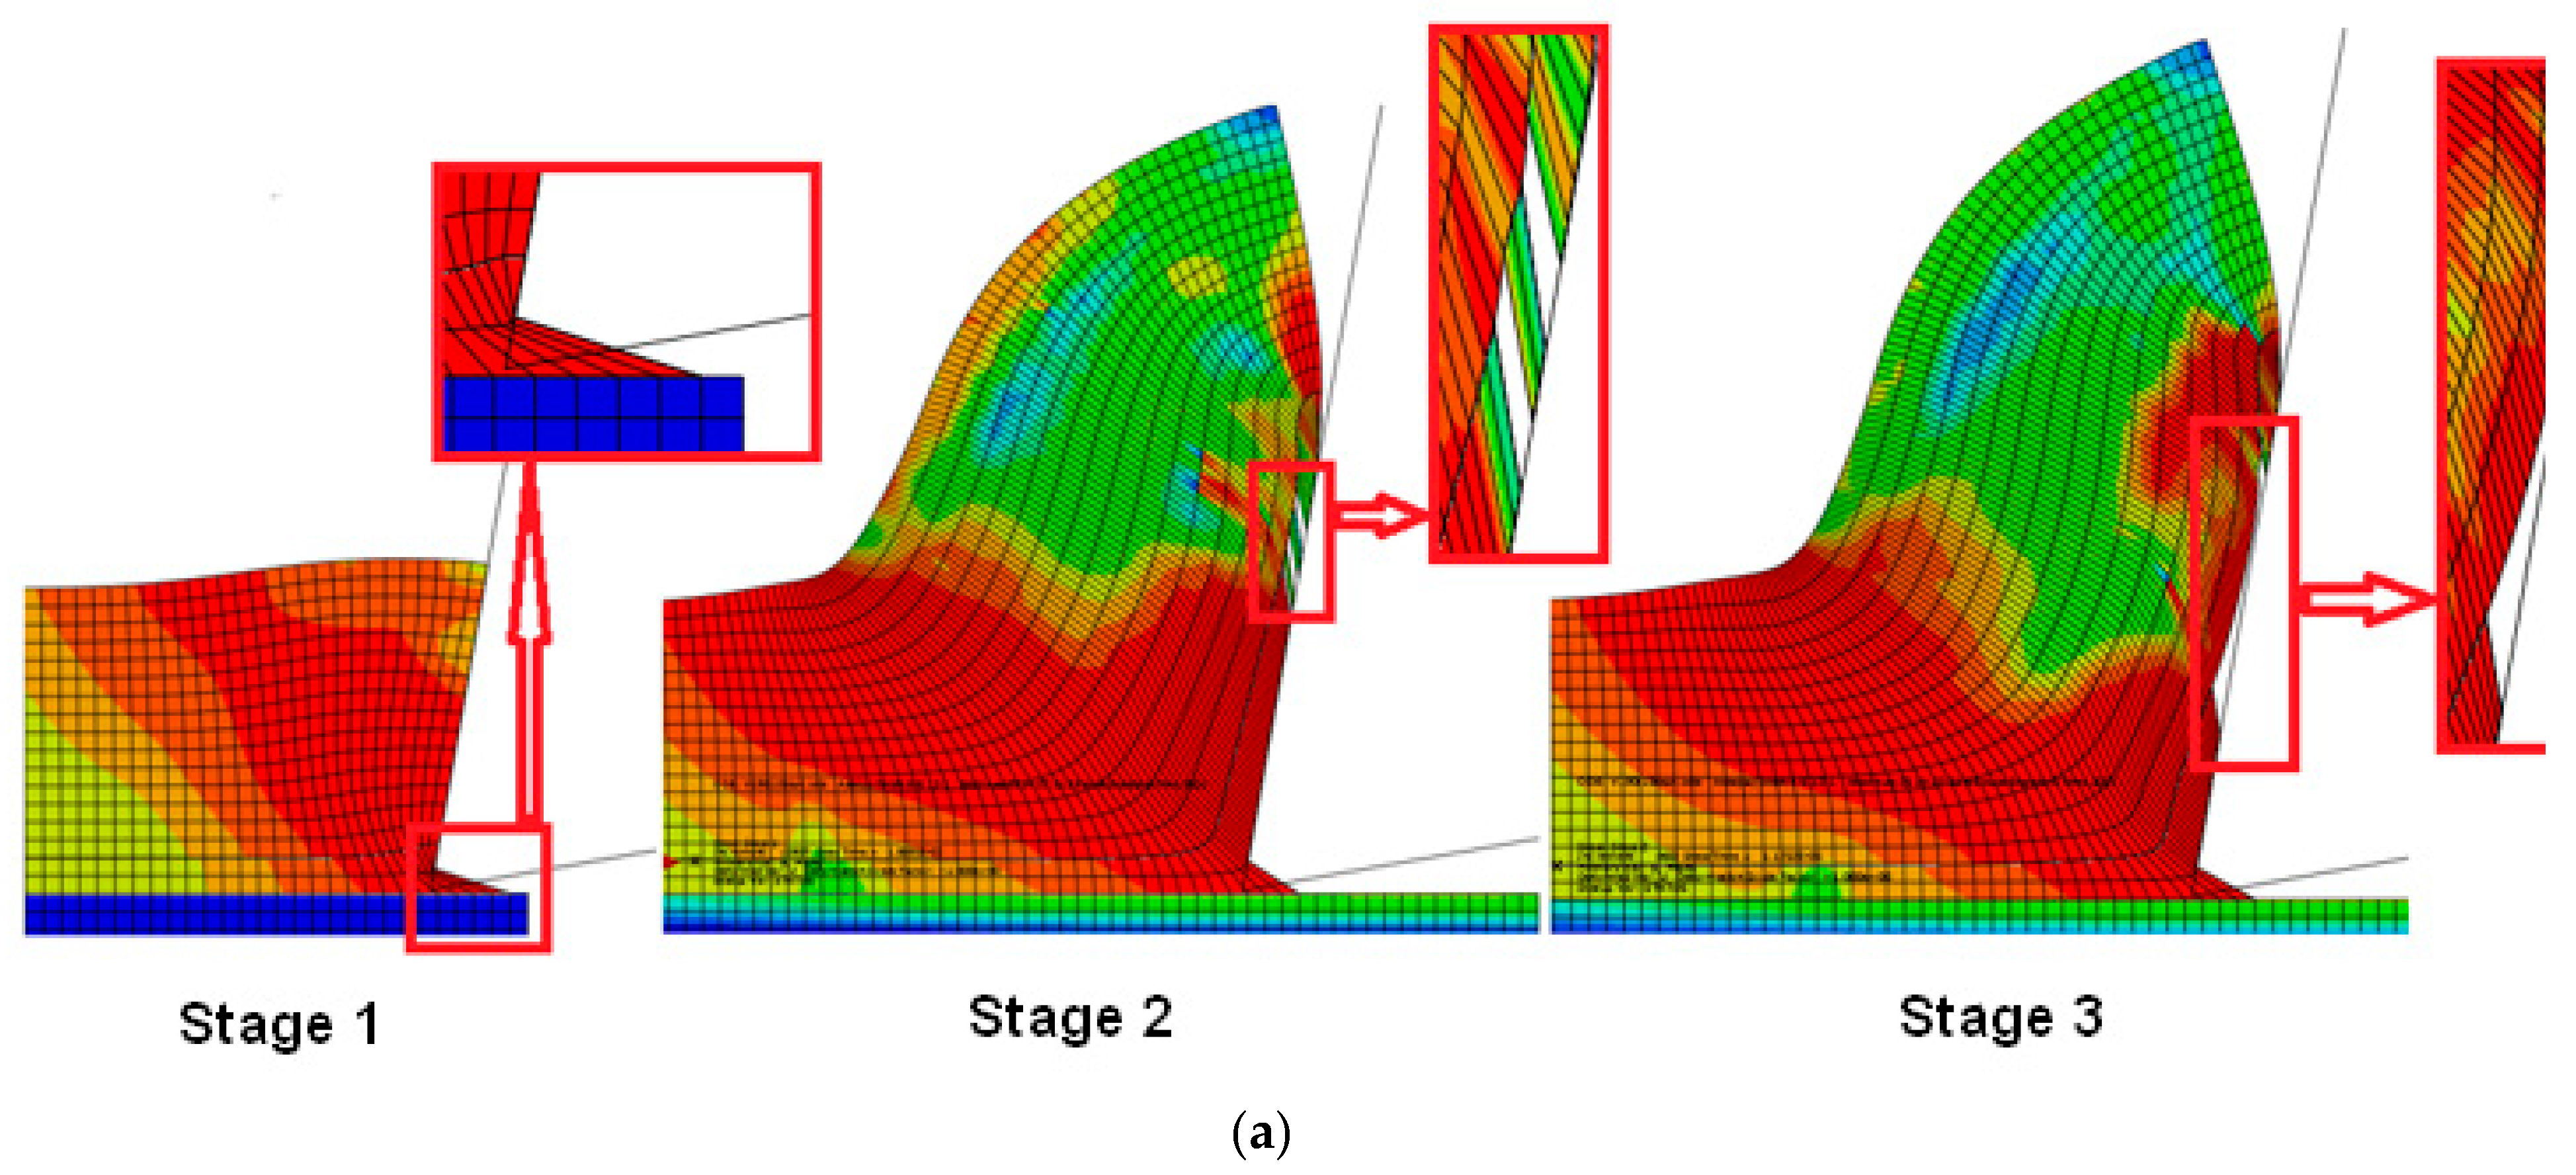
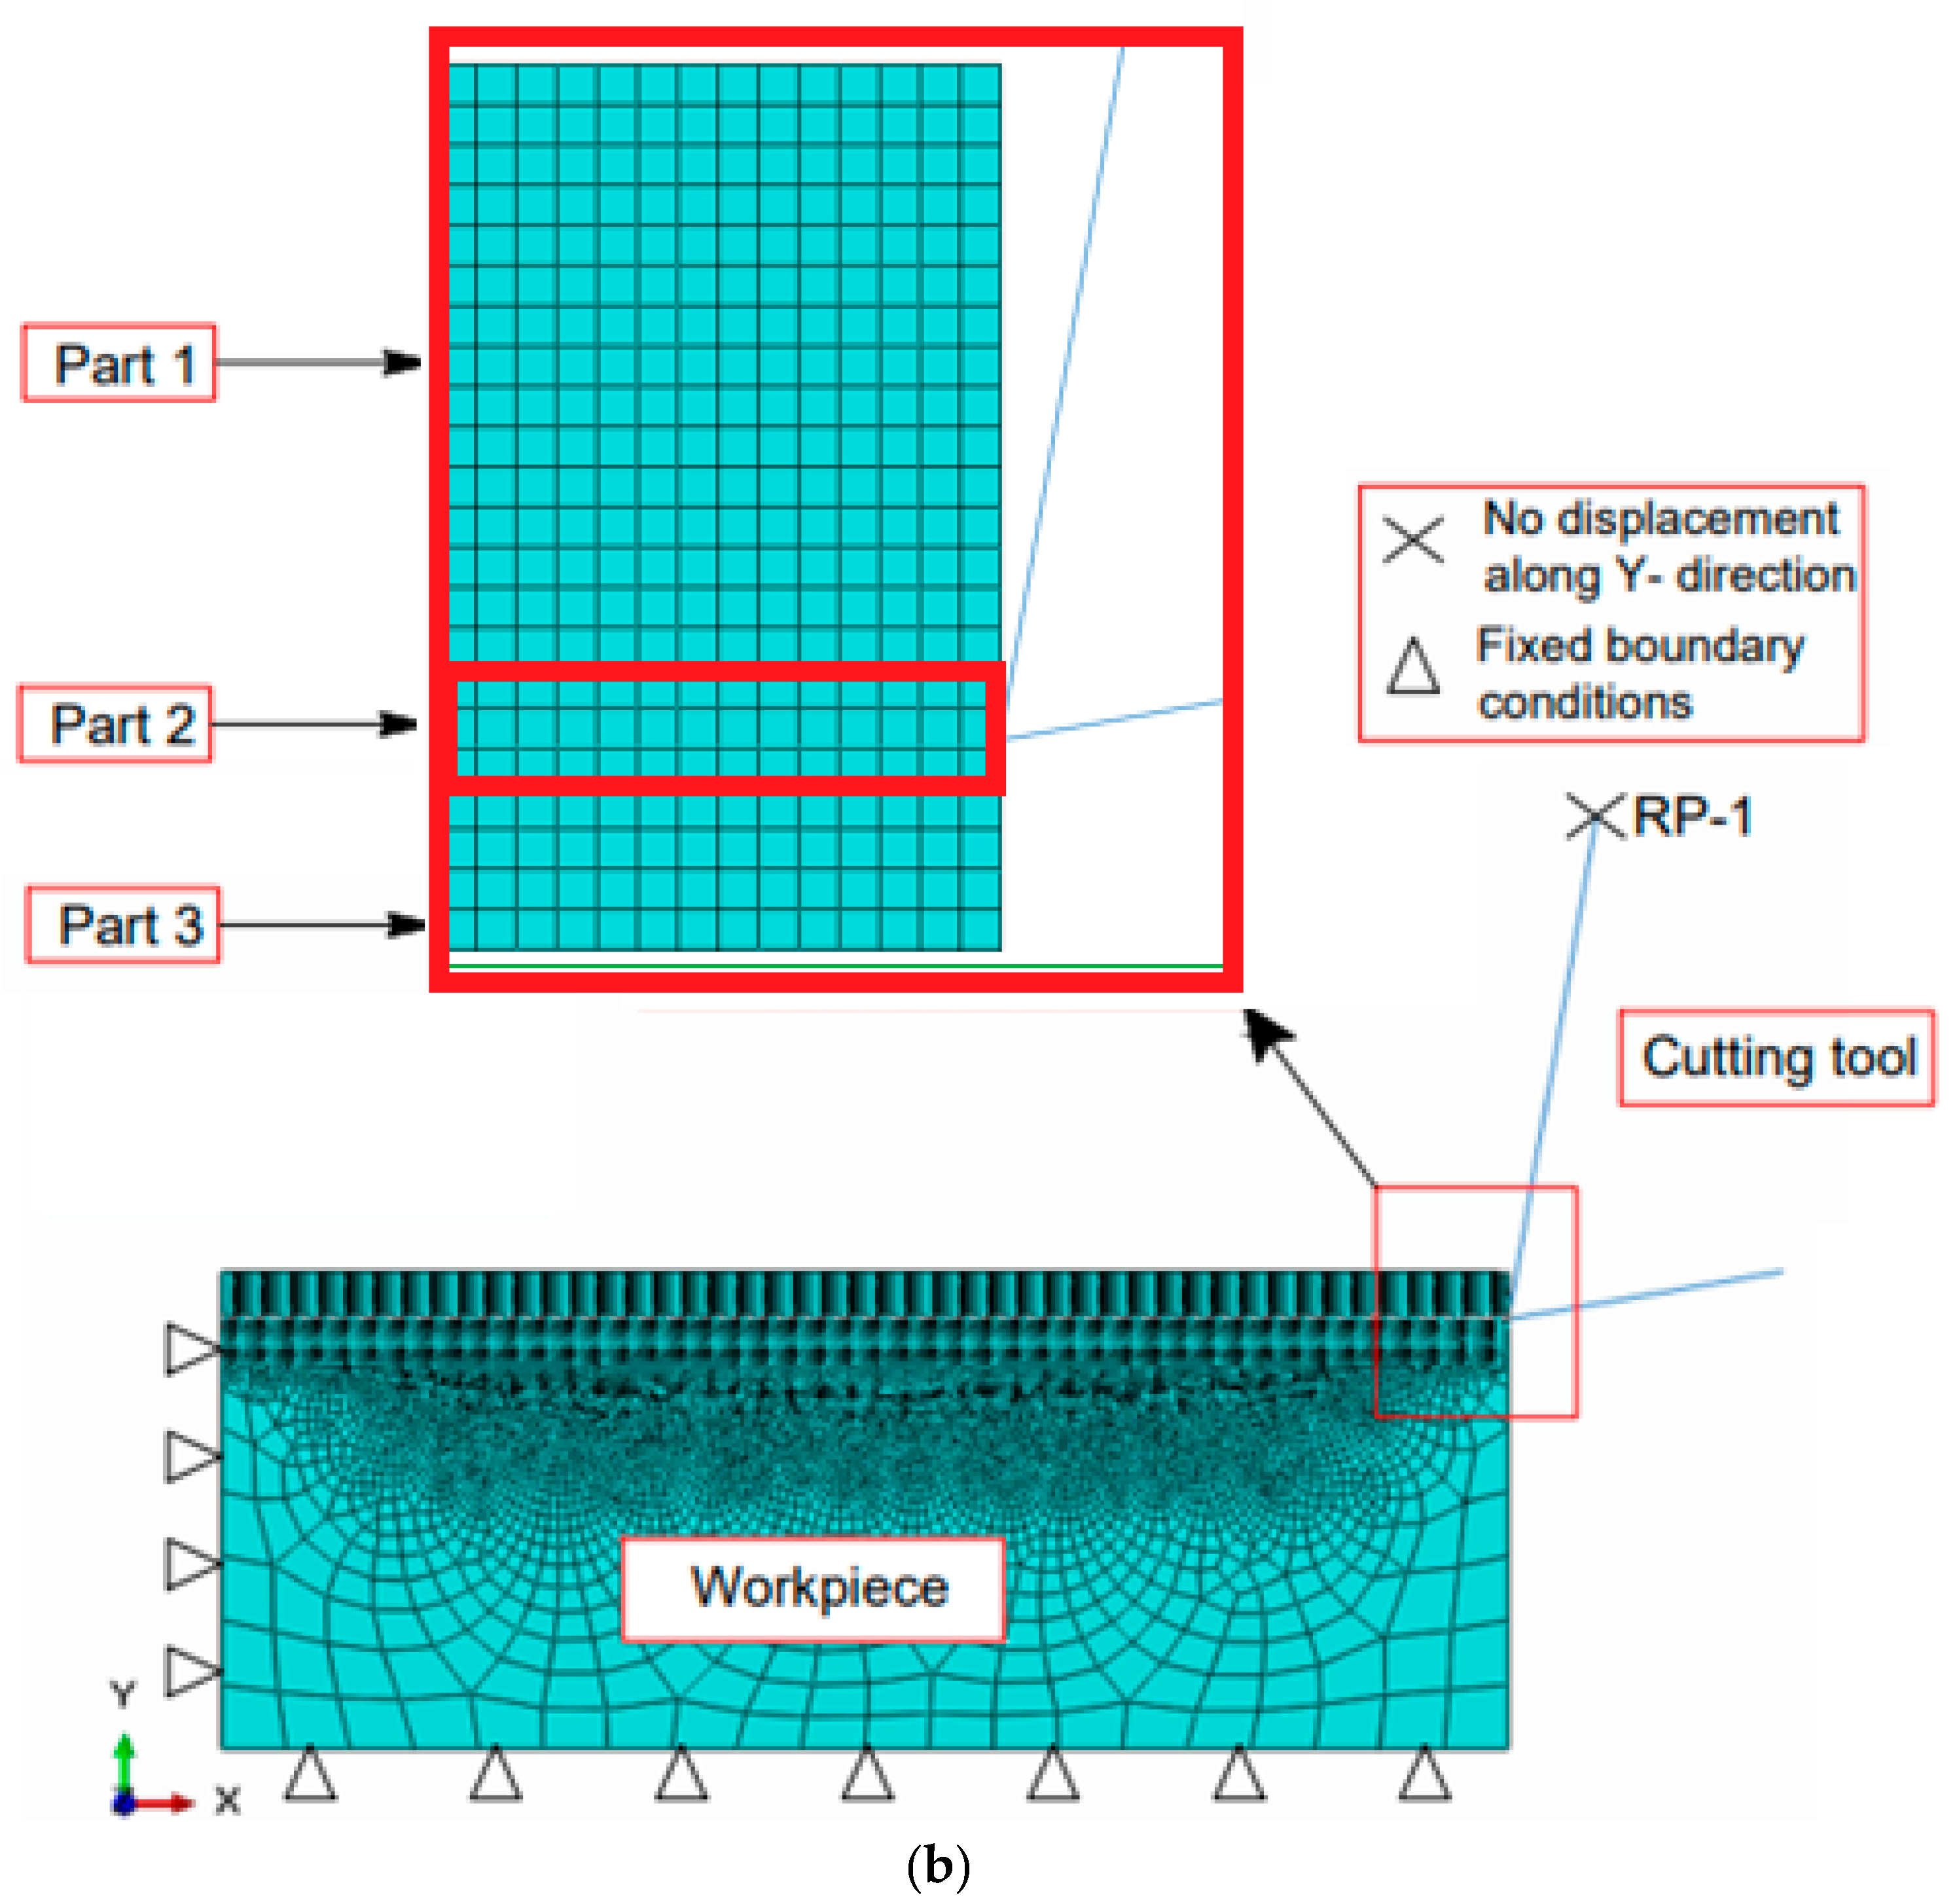
Figure 6a shows the evolution of the chip formation in original FEM-based simulations, based on the J-C fracture model. As shown in Figure 6a, when the cutting tool impacted the workpiece, the uncut chip thickness was separated along the clearance surface of the cutting tool. The mesh elements in contact with the rake surface of the cutting tool were deformed and then removed when reaching the fracture condition of the J-C model (Stage 1). Some mesh elements in contact with the clearance surface were deformed and deleted when the J-C fracture condition was satisfied (Stage 2). However, the damage at the chip thickness tangent to the clearance surface was uncontrolled, leading to an unstable predictive cutting force, and the measurement of the chip was also affected (Stage 3). Therefore, this study proposes a meshing elemental model for the chip, fracture layer, and based workpiece, as shown in Figure 6b. The boundary conditions of the developed machining model are also shown in Figure 6b, where the cutting tool is fixed in the vertical direction and can be moved horizontally by the reference point. The workpiece is only fixed at the base edges; therefore, the chip layer can freely deform at the top and first-side edges.
To improve the contact between the cutting tool and the workpiece during simulations, a workpiece model consisting of the following three geometric parts (Figure 6b) was developed: (1) the chip without fracture occurrence, (2) the separated layer (fracture layer) between the chip and workpiece, and (3) the base workpiece. Part 2 acts as a fractured layer and interacts directly with the cutting tool. This layer is modeled by three meshed elements, and its total thickness should be greater than the cutting edge radius. The cutting edge of the cutting tool is aligned to separate the fracture layer into two distinctly different mesh elements. The upper mesh element contacts the clearance surface, while the lower mesh element contacts the rake surface of the cutting tool. The chip formation consists of elements in the uncut chip thickness without any fractures.

5.1. Proposed Method for the Modified Fracture Model

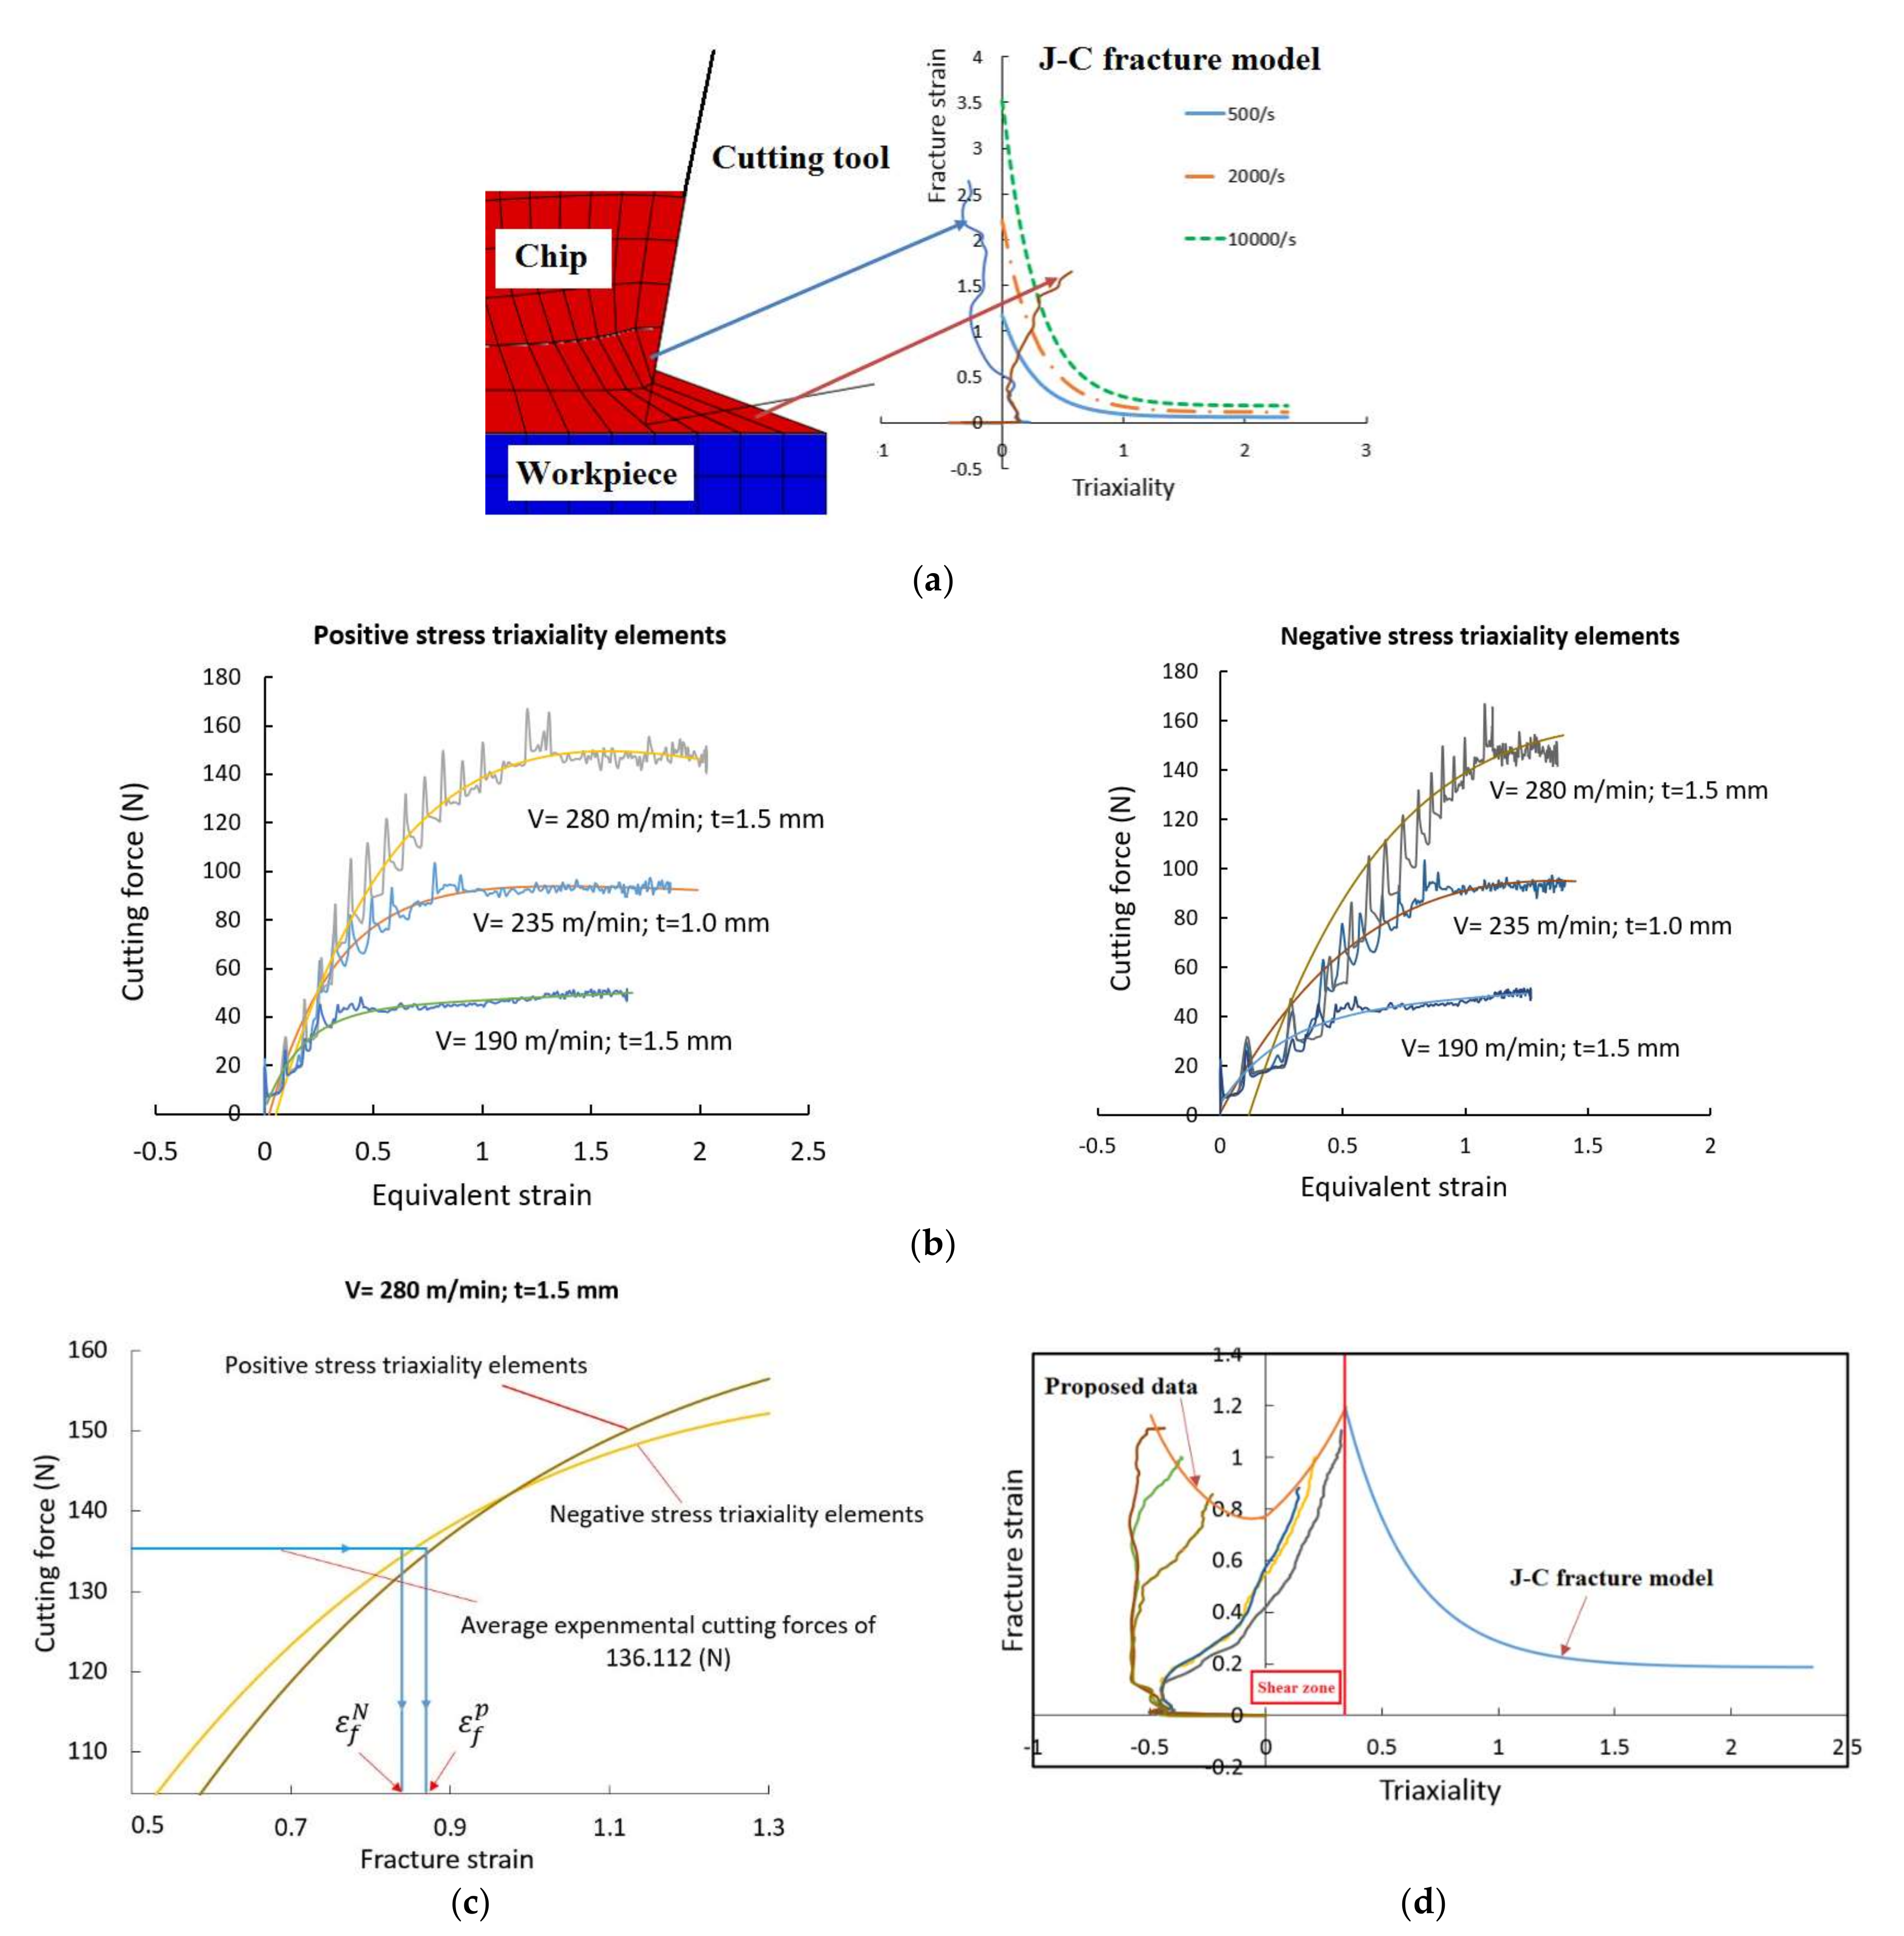
As shown in Figure 7a, during the FEM-based simulations without deleting the mesh elements at the fracture layer, the strain path of the element contacting the clearance surface was located at the negative stress triaxiality side, while the element in contact with the rake surface tended to move to the positive stress triaxiality side in the space of the stress triaxiality and equivalent strain. The positive stress triaxiality elements were deleted when their strain paths reached the fracture limit curve of the J-C model. Meanwhile, the mesh elements in contact with the clearance surface were excessively deformed. This phenomenon occurred because the J-C fracture model yielded very high values on the negative stress triaxiality side.
This study took advantage of the FEM-based simulation results at positive/negative stress triaxiality elements, and combined them with the obtained preliminary experimental forces for calibrating the fracture model. The simultaneous relationship between the FEM-simulated F and the equivalent strain at positive/negative stress triaxiality elements could be obtained and formulated using Equation (8). The force equation parameters were determined using the method of the least squares (lsqcurvefit) in MATLAB, and the results are listed in Table 6. The curves for the FEM-simulated F versus equivalent strain at positive/negative stress triaxiality elements and for various cutting conditions are shown in Figure 7b. Figure 7c shows the equivalent fracture strain determination by comparing the evolution of the FEM-simulated cutting forces with the averages of the corresponding preliminary experimental cutting forces, for example, in the case of V = 280 mm/min and t = 1.5 mm. Here, the F obtained for both mesh elements in the positive/negative stress triaxiality when reaching the fracture criterion should be the same and equal to the average value of the corresponding preliminary experimental cutting forces. Therefore, the intersection points of the experimental average F with the evolution equations of both positive/negative stress triaxiality elements could be solved or easily obtained by drawing a line perpendicular to the horizontal axis for determining the equivalent fracture strains (Figure 7c). The proposed fracture model in the shear zone was defined as the contour of the intersection points between the strain paths and the corresponding equivalent fracture strain from all the elements obtained from the preliminary FEM-based simulations, as shown in Figure 7d. This proposed fracture model was then used for demonstrating improved prediction of the F and K, as detailed in the next section.
F = G exp H ε e q p l + L exp M ε e q p l
where G, H, L, and M are the force equational parameters.

5.2. Validation of Proposed Fracture Model

The proposed fracture model was incorporated into FEM-based simulations for predicting the F and K when machining SKD11 alloy steels with the corresponding cutting parameters. The chip formation phenomena under various cutting conditions are shown in Figure 8a, and the corresponding FEM outputs are listed in Table 7. Figure 8a shows that the mesh elements in the fracture layer were uniformly deformed at both the positive/negative stress triaxiality elements under all preliminary cutting conditions. The FEM-simulated cutting force evolution results for the preliminary machining tests are shown in Figure 8b. The discrepancies between the simulated and corresponding experimental values of the F and K are also listed in Table 7 and shown in Figure 8c and Figure 8d, respectively. The comparison results show that the predictive power of the proposed fracture model for the F and K determination clearly improved after the model revision. The largest discrepancies for the F and K decreased from 11.44% to 4.60% and 17.03% to 3.87%, respectively. From the comparison results (Table 7 and Figure 8c,d), it can be concluded that the deviations of the F and K values were significantly reduced using the proposed fracture model, compared with the original J-C fracture model. The FEM-based simulation results based on the proposed fracture model are more concordant with the corresponding preliminary experimental data.

5.3. Verification of Proposed Fracture Model

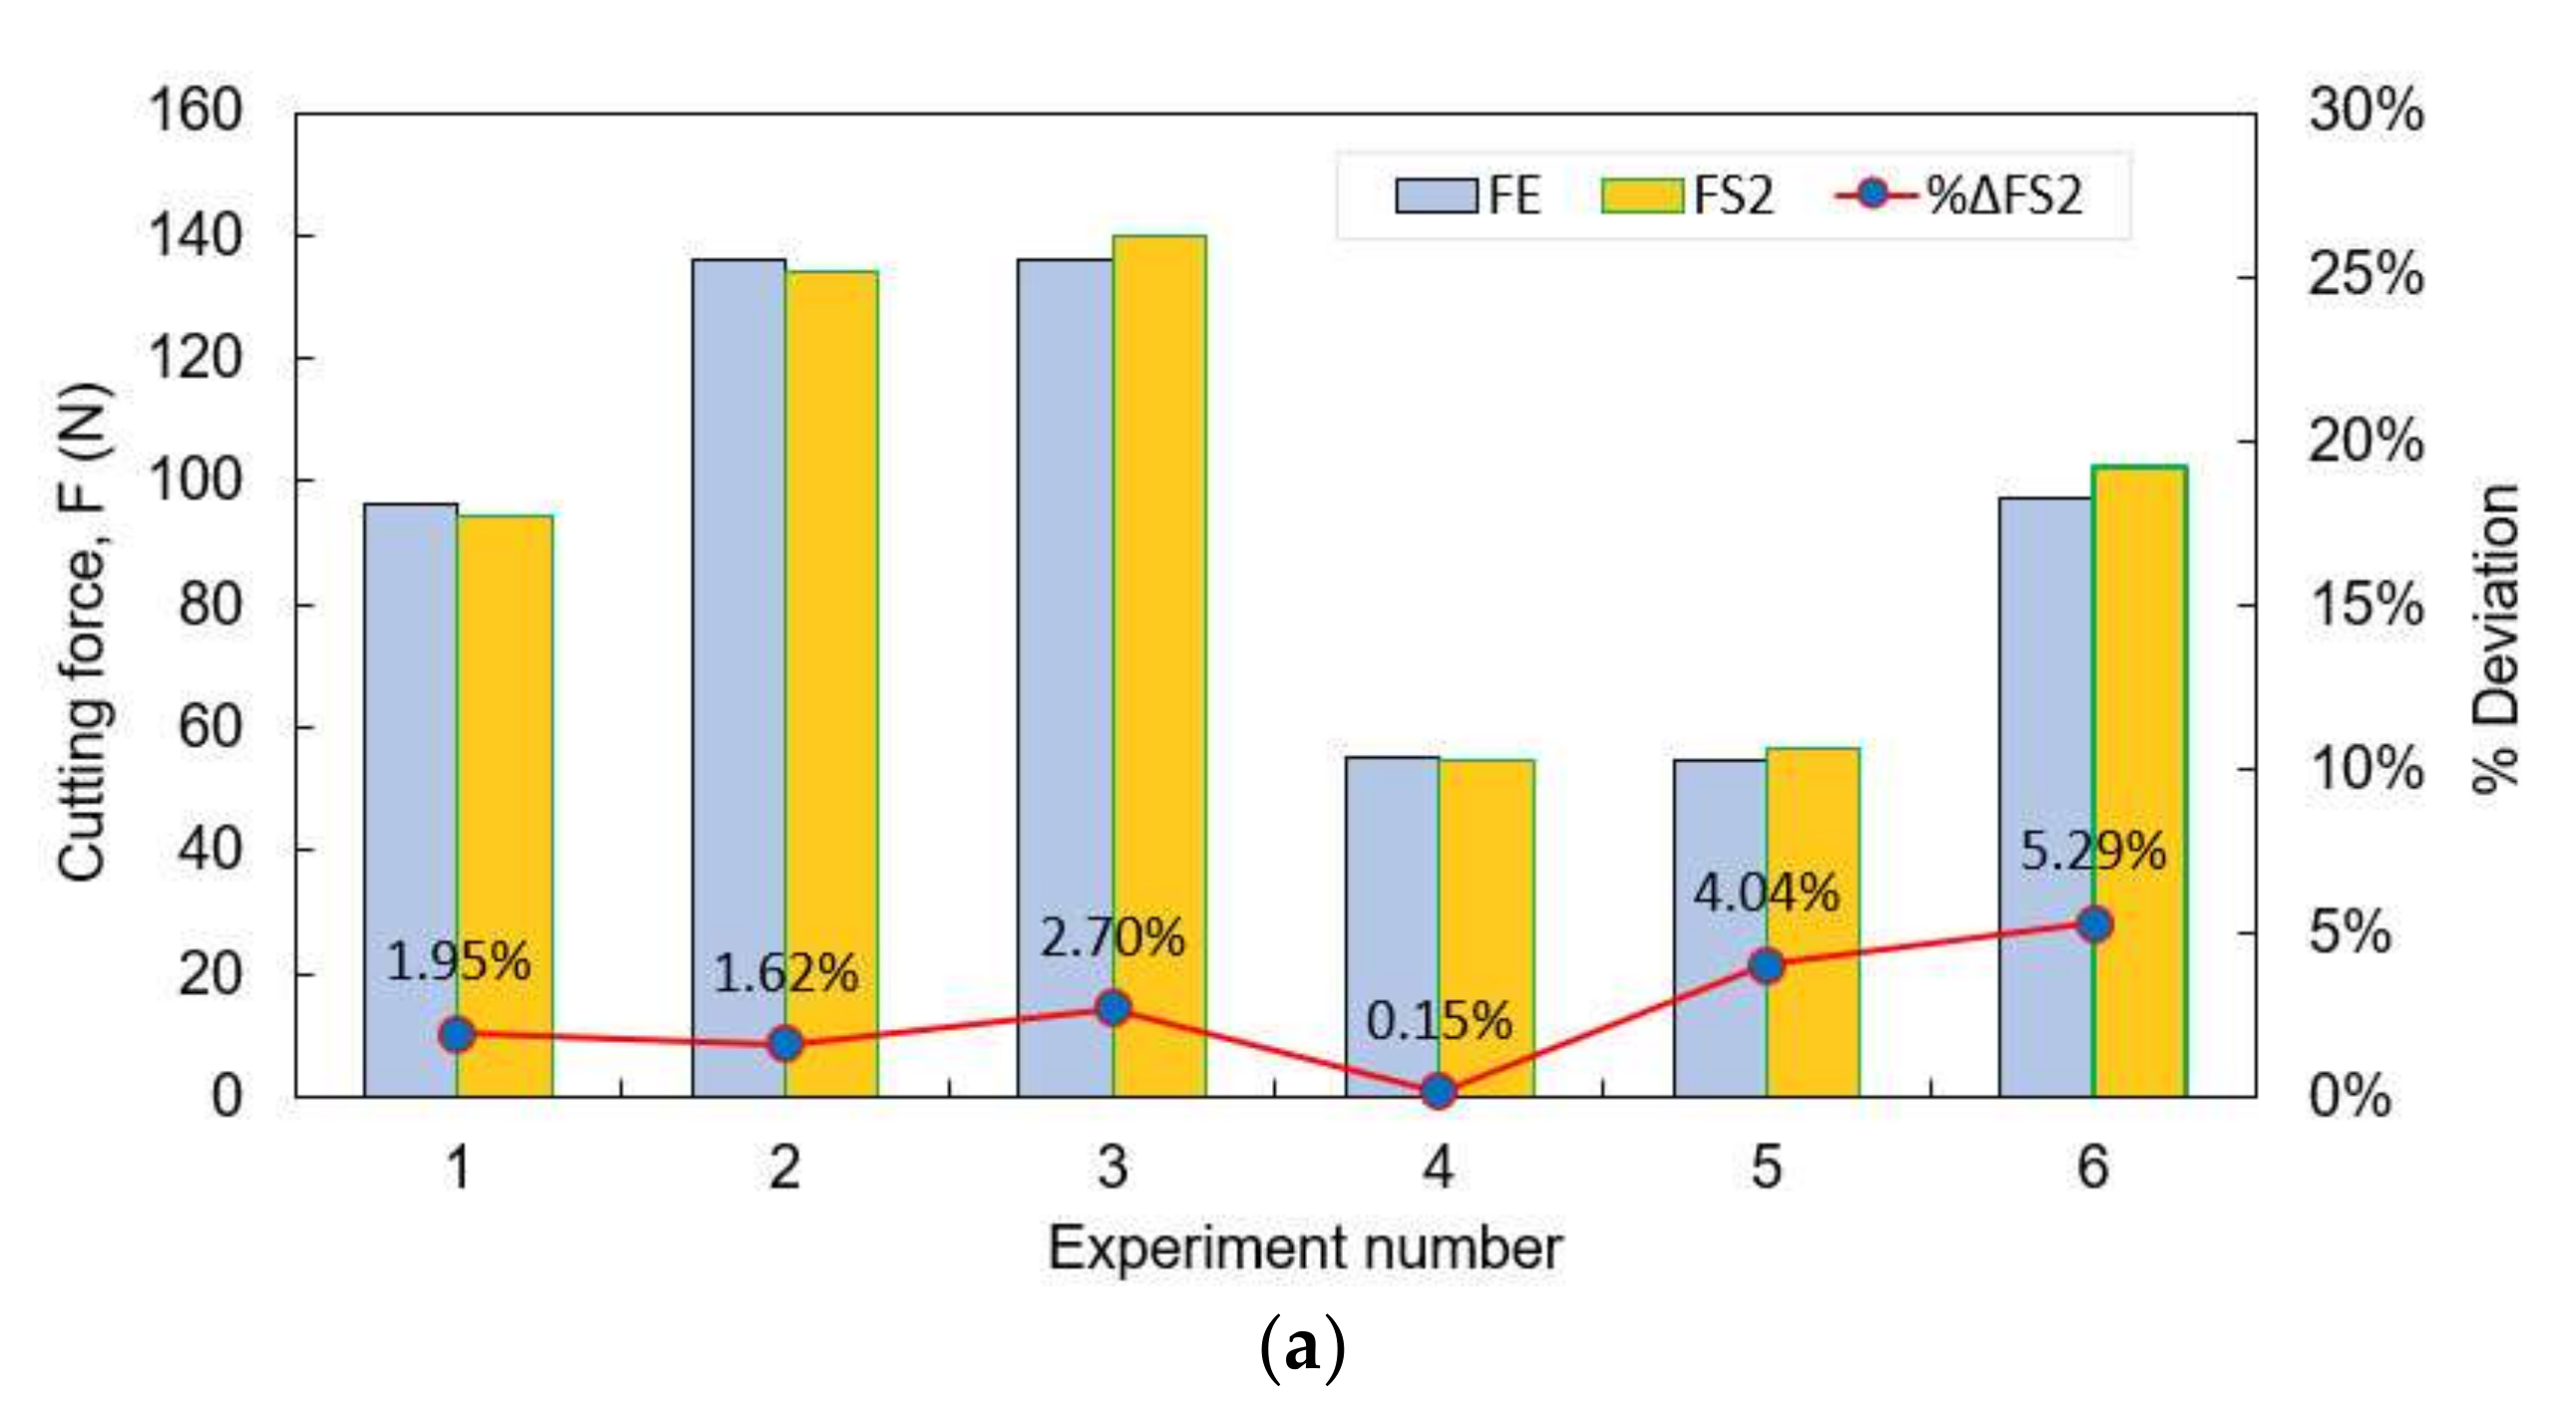
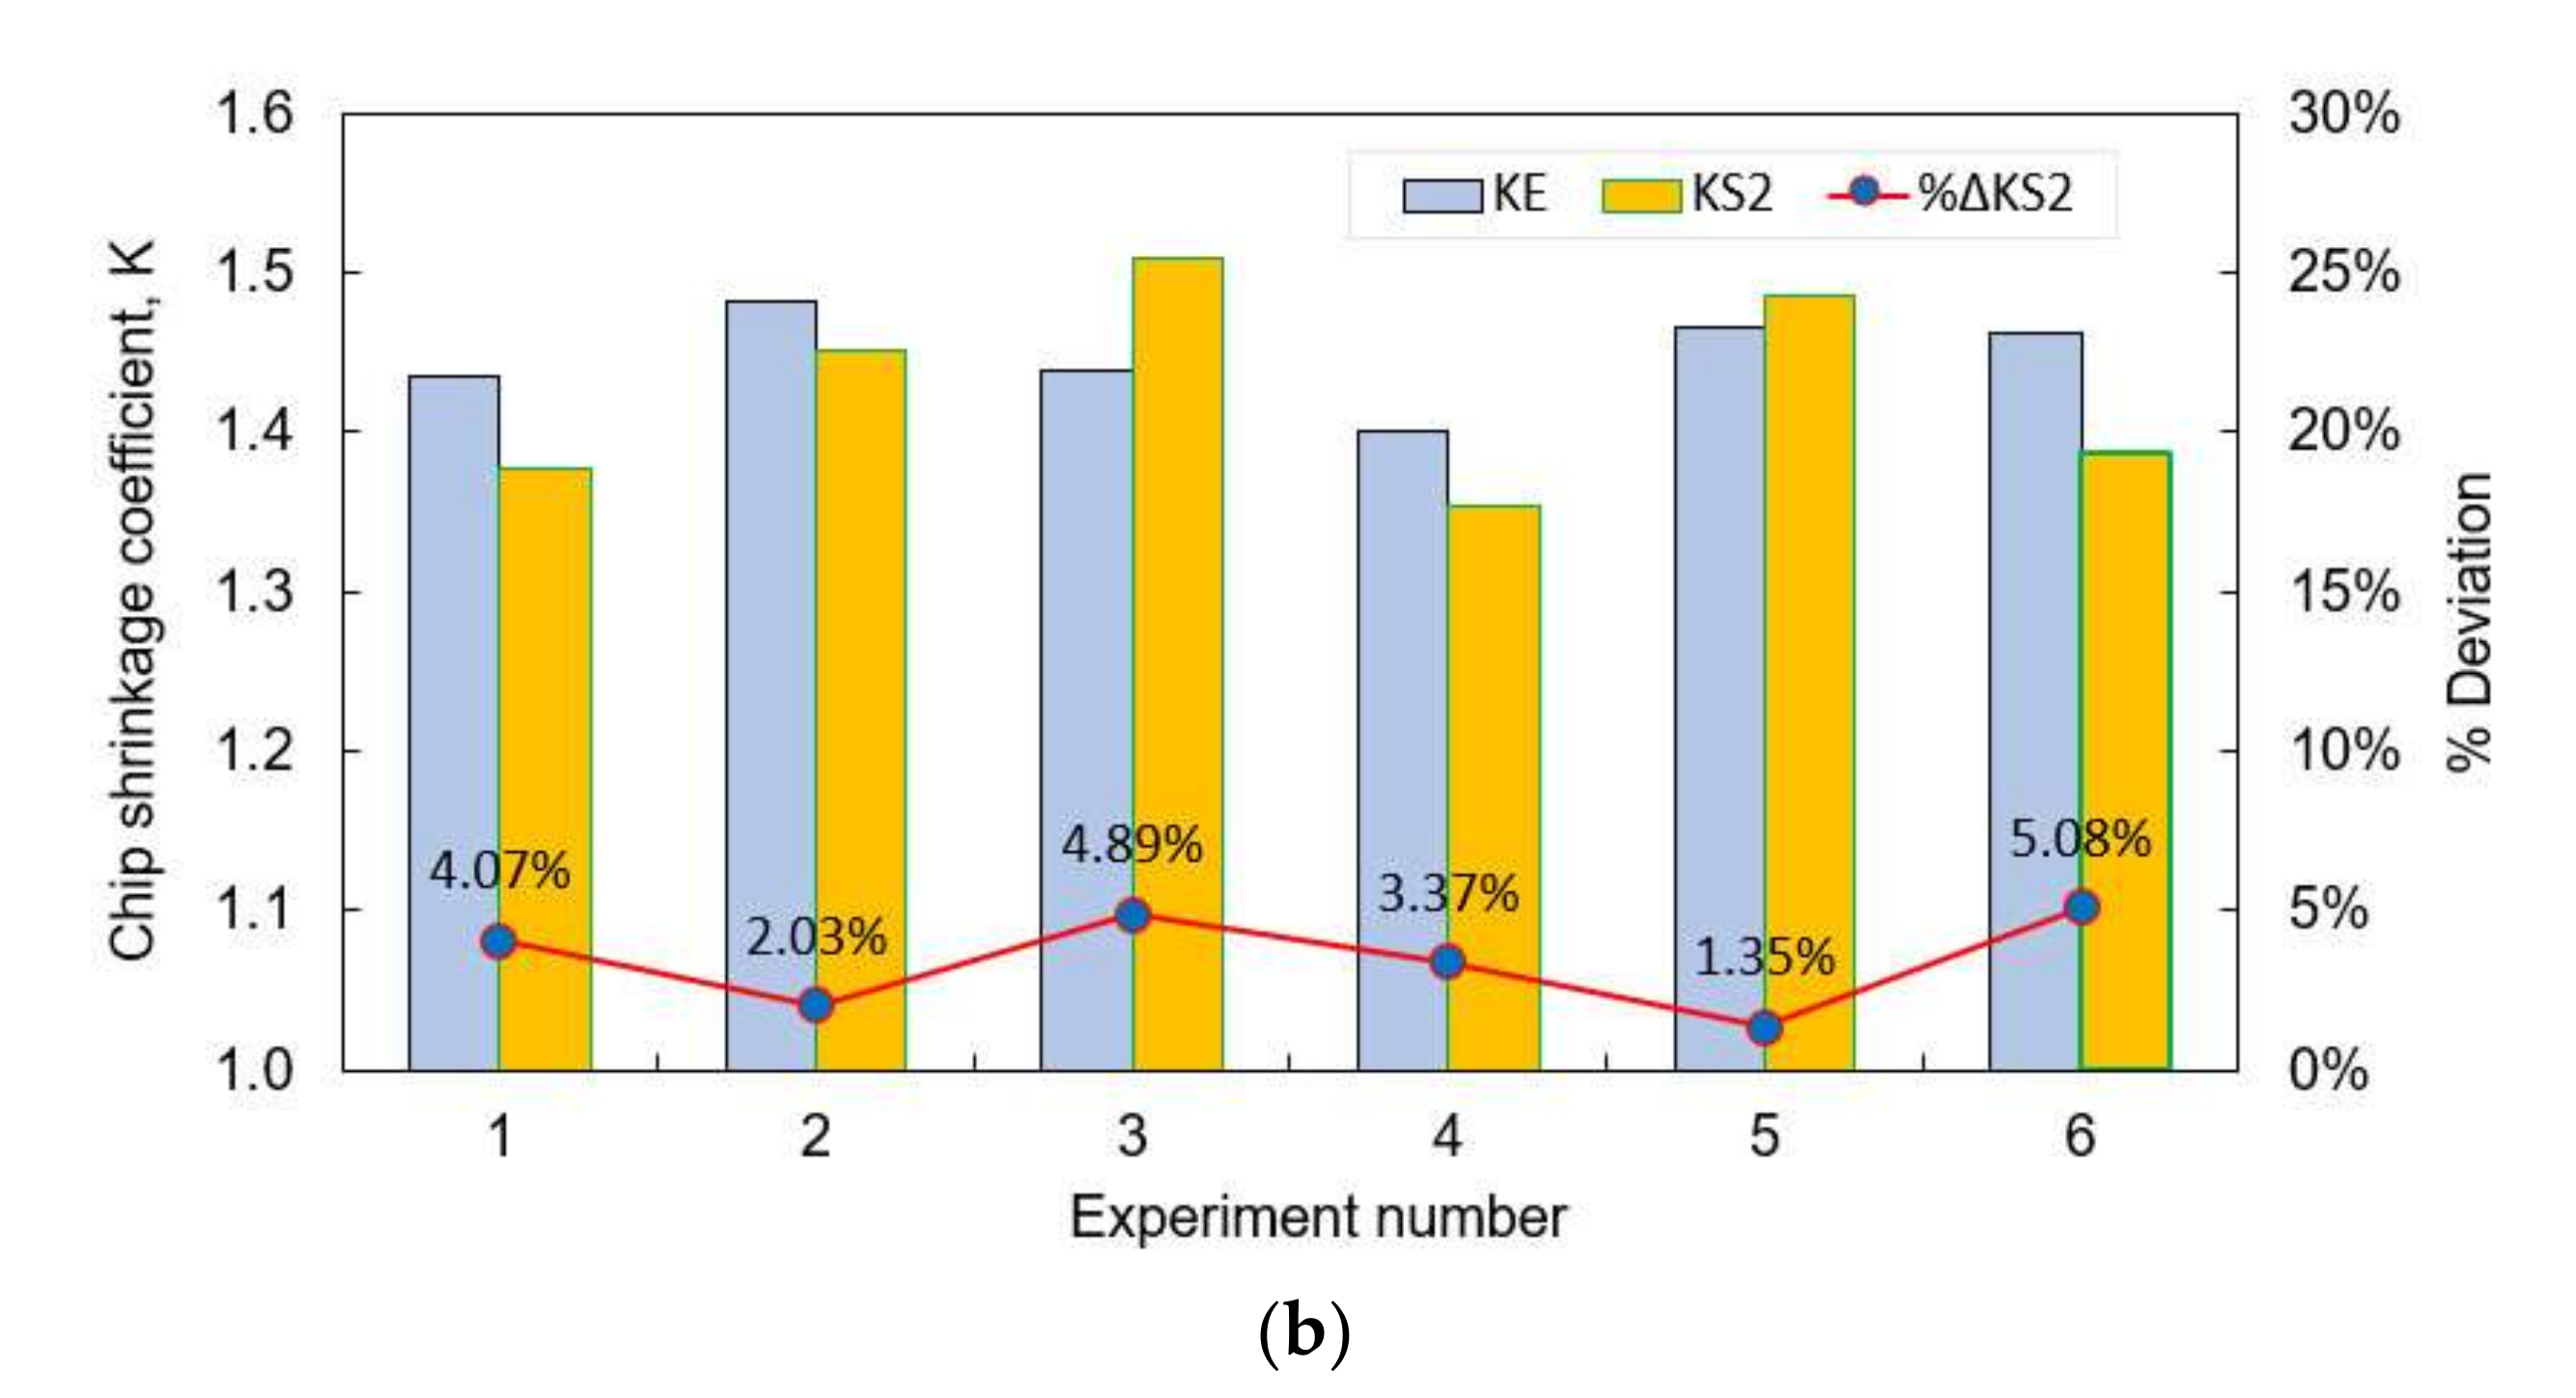
To verify the proposed fracture model, we conducted additional FEM-based simulations for predicting the F and K, using various extended cutting speeds and depths. In which, six experiments are presented as shown in Table 8, which are established to achieve generalizability at full 2 × 3 levels of cutting speeds and cutting depths. The additional predicted values were compared with the values obtained in the corresponding experiments. Table 8 and Figure 9 show the new set of cutting speed and depth parameters, along with the F (Figure 9a) and K (Figure 9b) values that were determined from these additional simulations and their corresponding experiments; the corresponding discrepancies are also shown. The comparison results showed that the additional predictive values of the F and K based on the proposed fracture model agree well with the corresponding experimental data. The maximal predicted discrepancies between the simulations’ results and their corresponding experimental results were 5.29% and 5.08%, respectively, for the F and the K at experiment number 6. These results reconfirmed that the proposed fracture model yields highly accurate predictions in simulations of SKD11 alloy steel machining.

6. Conclusions

This paper presented a combined experimental and simulation study for predicting the cutting force (F) and chip shrinkage coefficient (K) when milling SKD11 alloy steels. Pilot experiments were performed for measuring the F and K corresponding to the preliminary cutting mode parameters. The K values were accurately determined by measuring the length and weight of the chips using the 3D scanning technology and a microscale, respectively. The original J-C fracture model was adopted and using the model the discrepancy between the FEM-based simulation results and the results of their corresponding preliminary experiments was evaluated. The compared results suggested an inaccurate prediction of the F and K, with the highest relative deviations of 11.44% and 17.03%, respectively. To overcome this problem, a method was proposed for improving the fracture model and incorporating it into FEM-based simulations of the SKD11 alloy steel milling. The proposed method utilized the evolution of the cutting forces versus equivalent strain in combination with the average values of the experimental cutting forces for determining new fracture data of the fracture strain locus in the space of the stress triaxiality. The proposed fracture model was validated and verified for preliminary and extended cutting speeds and depths. Comparison of the FEM-based simulation results by modified J-C model and their corresponding experimental results indicated good agreement with the highest deviation of the cutting forces and the chip shrinkage coefficients were 5.29% and 5.08%, respectively.

Author Contributions

Conceptualization, D.-T.N.; Data curation, T.-B.M.; Formal analysis, D.-T.N.; Funding acquisition, T.-T.L.; Investigation, T.-T.L.; Methodology, D.-T.N.; Project administration, T.-B.M.; Resources, T.-B.M.; Software, T.-T.L.; Supervision, D.-T.N.; Validation, D.-T.N.; Visualization, D.-T.N.; Writing—original draft, T.-B.M.; Writing—review & editing, D.-T.N., T.-B.M. All authors have read and agreed to the published version of the manuscript.

Funding

This research was funded by Hung Yen University of Technology and Education, Vietnam under grant number UTEHY.L.2020.13.

Conflicts of Interest

The authors declare no conflict of interest.

Nomenclature

σ, ε e q p l ,   σ   = equivalent stress, equivalent strain, stress triaxiality
A, B = plastic coefficients
Di (i = 1, 2, 3, 4, 5) = The material constants
F = the synthetic cutting force
Fx, Fy, Fz = three the cutting forces components
t, to = the uncut and actual chip thickness
V, fr, t = cutting speed, feed rate, cutting depth
K= chip shrinkage coefficient
Q = mass of the chip
ρ = destiny of the workpiece material
G, H, L, M = force equational parameters

References

  1. Banh, T.L.; Tran, T.L.; Tran, S.T. Metal Cutting Principles, 2nd ed.; Science and Technics Publishing House: Hanoi, Vietnam, 2013. (In Vietnamese) [Google Scholar]
  2. Pham, T.H.; Mac, T.B.; Tong, V.C.; Banh, T.L.; Nguyen, D.T. Simulation and experimental studies to verify the effect of cutting parameters on chip shrinkage coefficient and cutting forces in machining of A6061 aluminum alloy. Adv. Mech. Eng. 2016, 8, 1687814016673297. [Google Scholar] [CrossRef] [Green Version]
  3. Umbrello, D.; M’Saoubi, R.; Outeiro, J.C. The influence of Johnson-Cook material constants on finite element simulation of machining of AISI 316L steel. Int. J. Mach. Tools Manuf. 2007, 47, 462–470. [Google Scholar] [CrossRef]
  4. Thepsonthi, T.; Özel, T. 3-D finite element process simulation of micro-end milling Ti-6Al-4V titanium alloy: Experimental validations on chip flow and tool wear. J. Mater. Process. Technol. 2015, 221, 128–145. [Google Scholar] [CrossRef]
  5. Liu, P.; Quan, Y.; Wan, J. Finite element simulations of rail milling based on the modified Johnson-Cook constitutive model. J. Phys. Conf. Ser. 2021, 1759, 012025. [Google Scholar] [CrossRef]
  6. Silva, R.G.; Teicher, U.; Brosius, A.; Ihlenfeldt, S. 2D finite element modeling of the cutting force in peripheral milling of cellular metals. Materials 2020, 13, 555. [Google Scholar] [CrossRef] [Green Version]
  7. Arisoy, Y.M.; Özel, T. Prediction of machining induced microstructure in Ti-6Al-4V alloy using 3-D FE-based simulations: Effects of tool micro-geometry, coating and cutting conditions. J. Mater. Process. Technol. 2015, 220, 1–26. [Google Scholar] [CrossRef]
  8. Yk, K.O. The residual stress produced by metal cutting. Ann. CIRP 1971, 20, 13–14. [Google Scholar]
  9. Tzotzis, A.; García-Hernández, C.; Huertas-Talón, J.L.; Kyratsis, P. Influence of the nose radius on the machining forces induced during AISI-4140 hard turning: A CAD-based and 3D FEM approach. Micromachines 2020, 11, 798. [Google Scholar] [CrossRef]
  10. Rao, S.S. The Finite Element Method in Engineering, 6th ed.; Elsevier: Amsterdam, The Netherlands, 2017. [Google Scholar]
  11. Tzotzis, A.; García-Hernández, C.; Huertas-Talón, J.L.; Kyratsis, P. FEM based mathematical modelling of thrust force during drilling of Al7075-T6. Mech. Ind. 2020, 21, 415. [Google Scholar] [CrossRef]
  12. Bai, Y.; Wierzbicki, T. Application of extended Mohr-Coulomb criterion to ductile fracture. Int. J. Fract. 2010, 161, 1. [Google Scholar] [CrossRef]
  13. Zhang, W.; Zhuang, K.; Pu, D. A novel finite element investigation of cutting force in orthogonal cutting considering plough mechanism with rounded edge tool. Int. J. Adv. Manuf. Technol. 2020, 108, 3323–3334. [Google Scholar] [CrossRef]
  14. Korkmaz, M.E.; Günay, M. Finite Element Modelling of Cutting Forces and Power Consumption in Turning of AISI 420 Martensitic Stainless Steel. Arab. J. Sci. Eng. 2018, 43, 4863–4870. [Google Scholar] [CrossRef]
  15. Leksycki, K.; Feldshtein, E.; Lisowicz, J.; Chudy, R.; Mrugalski, R. Cutting forces and chip shaping when finish turning of 17-4 ph stainless steel under dry, wet, and mql machining conditions. Metals 2020, 10, 1187. [Google Scholar] [CrossRef]
  16. Thi-Hoa, P.; Thi-Bich, M.; Van-Canh, T.; Tien-Long, B.; Duc-Toan, N. A study on the cutting force and chip shrinkage coefficient in high-speed milling of A6061 aluminum alloy. Int. J. Adv. Manuf. Technol. 2018, 98, 177–188. [Google Scholar] [CrossRef]
  17. Gupta, M.K.; Korkmaz, M.E.; Sarıkaya, M.; Krolczyk, G.M.; Günay, M.; Wojciechowski, S. Cutting forces and temperature measurements in cryogenic assisted turning of AA2024-T351 alloy: An experimentally validated simulation approach. J. Meas. 2022, 188, 110594. [Google Scholar] [CrossRef]
  18. Gupta, M.K.; Korkmaz, M.E.; Sarıkaya, M.; Krolczyk, G.M.; Günay, M. In-process detection of cutting forces and cutting temperature signals in cryogenic assisted turning of titanium alloys: An analytical approach and experimental study. J. Mech. Syst. Signal Processing 2022, 169, 108772. [Google Scholar] [CrossRef]
  19. Xavierarockiaraj, S.; Kuppan, P. Investigation of cutting forces, surface roughness and tool wear during Laser assisted machining of SKD11Tool steel. Procedia Eng. 2014, 97, 1657–1666. [Google Scholar] [CrossRef] [Green Version]
  20. Wang, C.; Xie, Y.; Zheng, L.; Qin, Z.; Tang, D.; Song, Y. Research on the Chip Formation Mechanism during the high-speed milling of hardened steel. Int. J. Mach. Tools Manuf. 2014, 79, 31–48. [Google Scholar] [CrossRef]
  21. Wang, C.; Ding, F.; Tang, D.; Zheng, L.; Li, S.; Xie, Y. Modeling and simulation of the high-speed milling of hardened steel SKD11 (62 HRC) based on SHPB technology. Int. J. Mach. Tools Manuf. 2016, 108, 13–26. [Google Scholar] [CrossRef]
  22. Voce, E. The relationship between stress and strain for homogeneous deformation. J. Inst. Met. 1948, 74, 537–562. [Google Scholar]
  23. Patwari MA, U.; Amin, A.N.; Faris, W.F. Influence of chip serration frequency on chatter formation during end milling of Ti6Al4V. J. Manuf. Sci. Eng. Trans. ASME 2011, 133, 011013. [Google Scholar] [CrossRef] [Green Version]
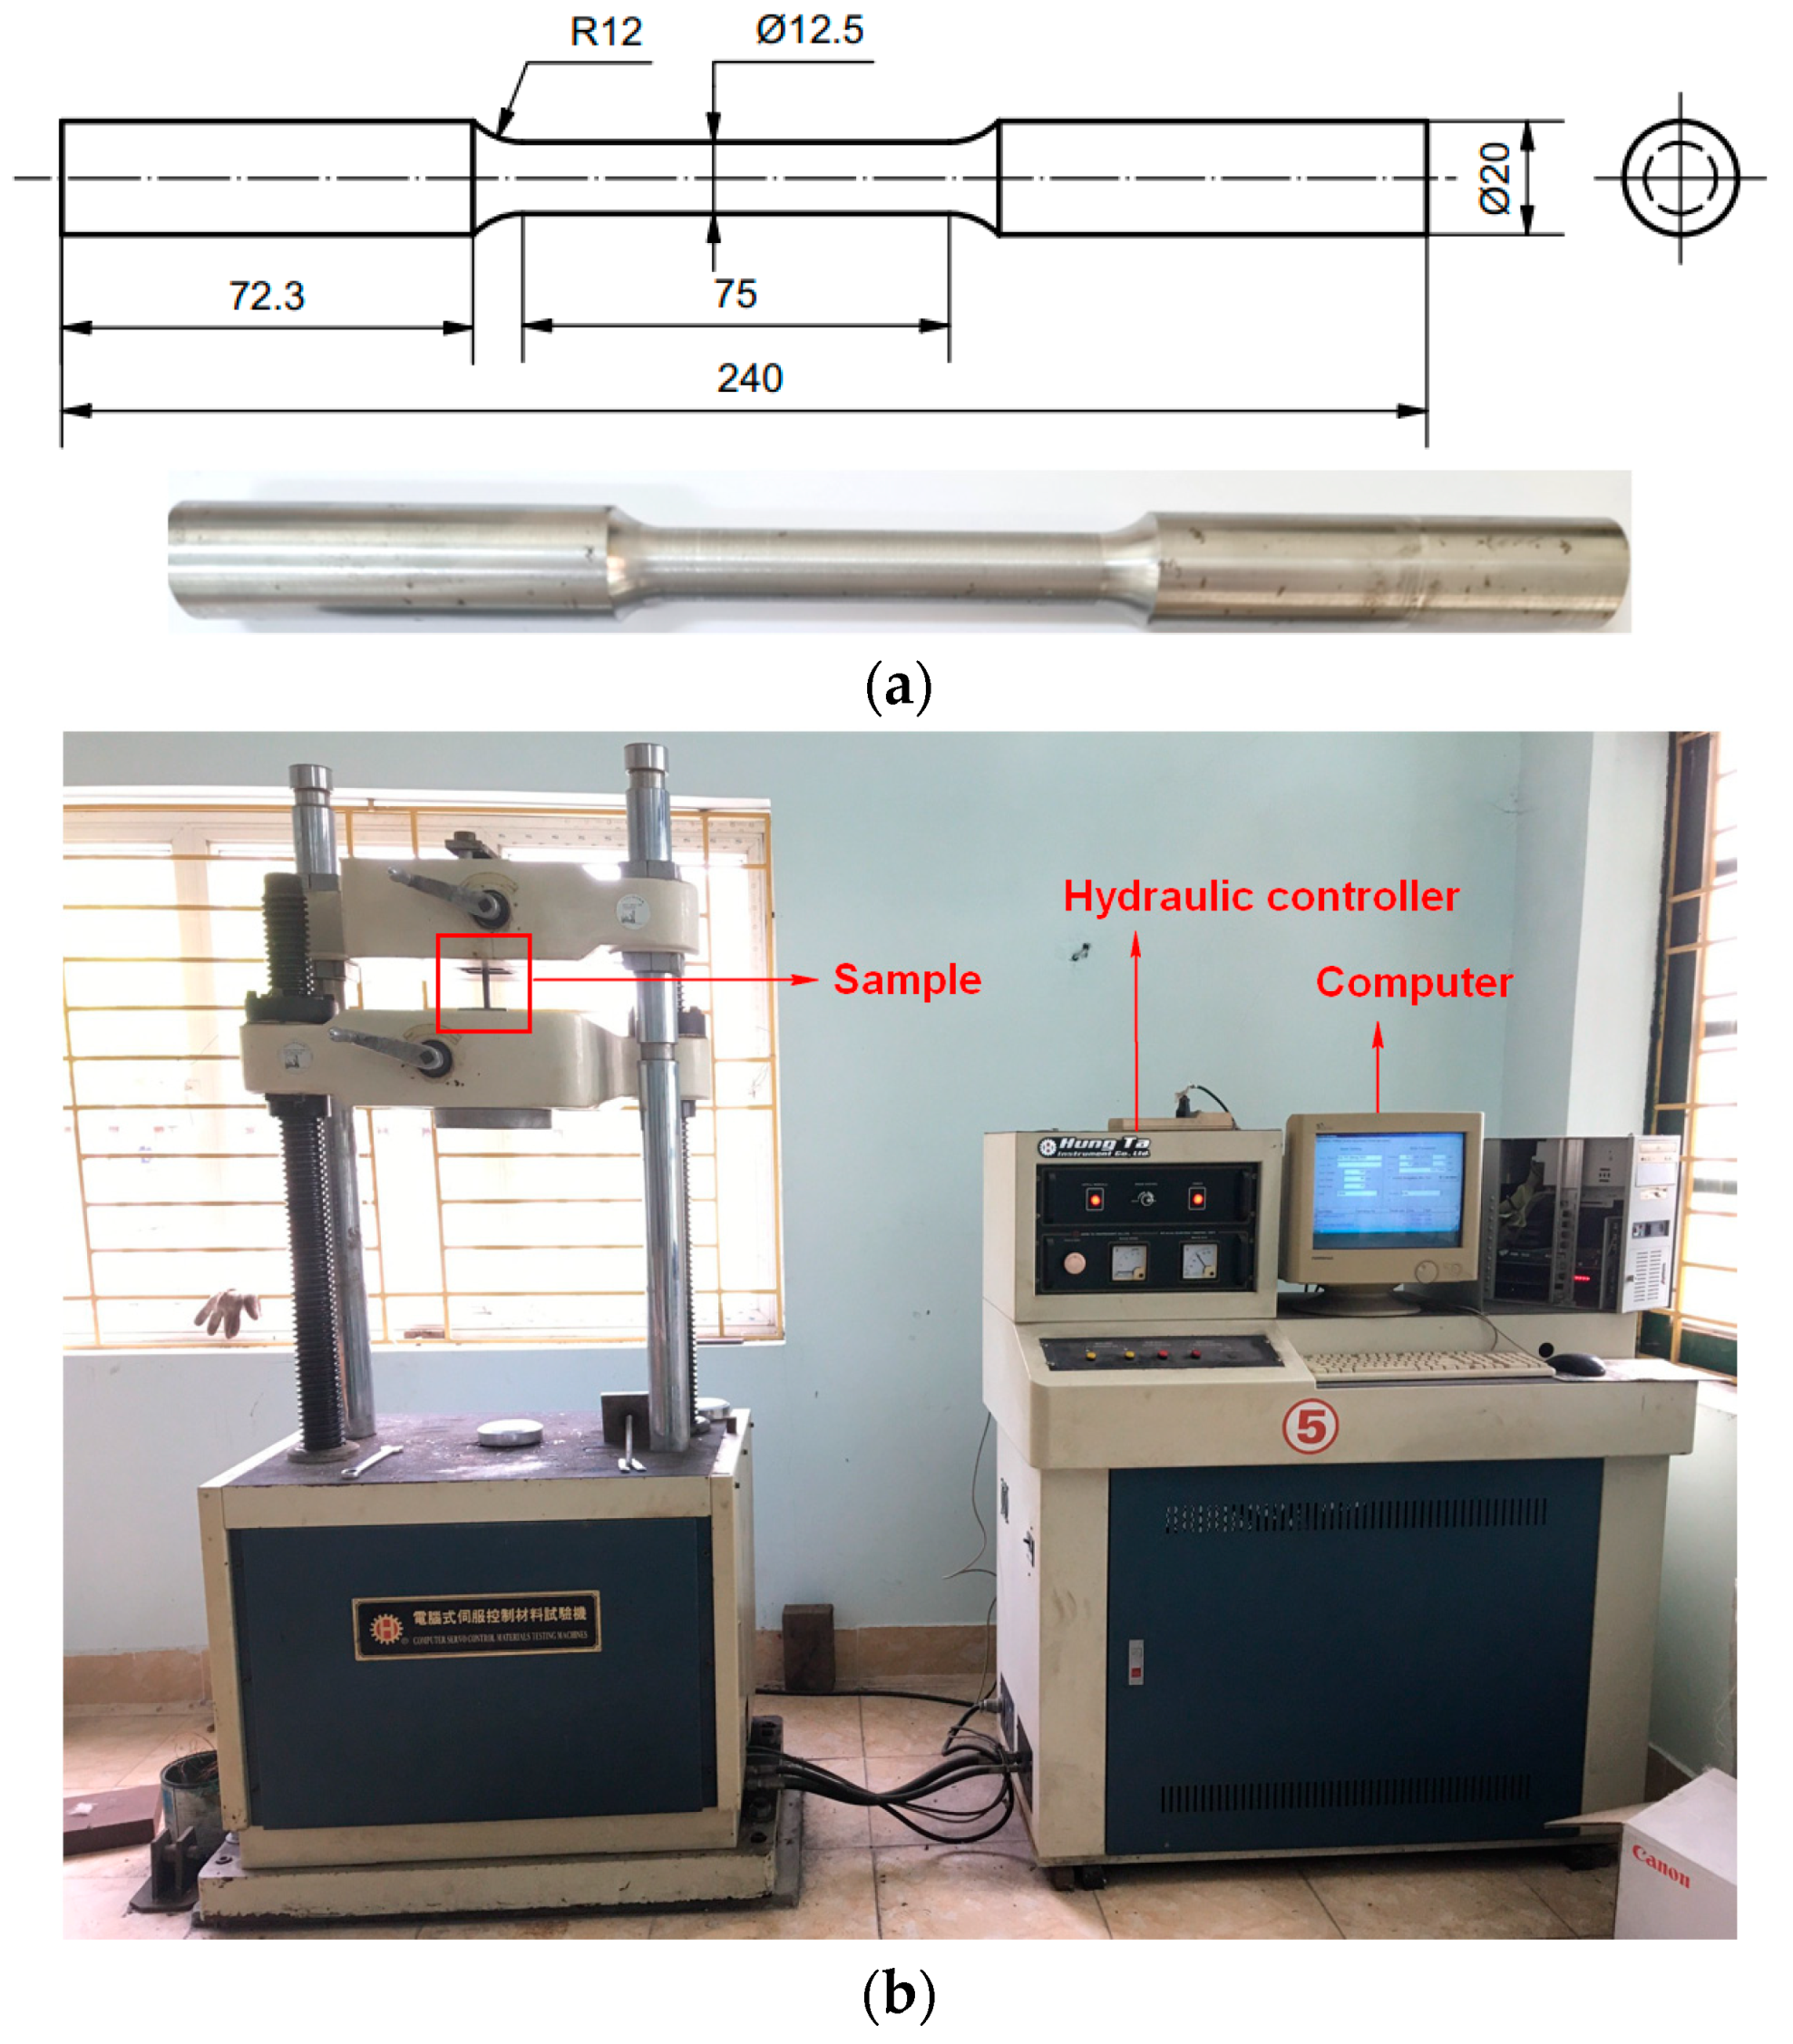
Figure 1. Tensile samples (a), Machine HUNGTA H-200A (b), and Stress-strain curve (c).
Machines 10 00229 g001aMachines 10 00229 g001b
Figure 2. The equivalent fracture strain is based on (a) stress triaxility, (b) strain rate, and (c) temperature.
Machines 10 00229 g002
Figure 3. Experimental setup (a), cutting forces displayed on DASYlab software (b), and chip length determination by 3D scanning (c).
Machines 10 00229 g003
Figure 4. 2D FEM-based framework in preliminary milling (a), FEM chip thickness measurement (b), chip formation (c), and evolution of F based on the reference points of the cutting tool in FEM corresponding to preliminary experiments (d) at various cutting conditions.
Machines 10 00229 g004
Figure 5. Comparison of the F (a) and K (b) between simulation and corresponding preliminary experiments based on the J-C fracture model.
Machines 10 00229 g005
Figure 6. The evolution of chip formation in original FEM-based framework (a) and schematic diagram of the proposed FEM-based framework in machining (b).
Machines 10 00229 g006aMachines 10 00229 g006b
Figure 7. Strain paths of mesh elements at fracture layer (a), proposed methods to determine fracture model: the F vs. equivalent strain (b), fracture strain positive/negative stress triaxiality elements (c), and fracture locus vs. various strain paths (d).
Machines 10 00229 g007
Figure 8. New FEM chip formation at various cutting conditions (a), evolution of cutting force based on modified fracture model (b), the comparison between simulation/corresponding preliminary experiments based on the proposed fracture model of the F (c) and K (d).
Machines 10 00229 g008
Figure 9. The comparison of the F (a) and K (b) between experiments and FEM simulation based on the proposed fracture model.
Machines 10 00229 g009aMachines 10 00229 g009b
Table 1. Chemical compositions of SKD11 alloy steel (% mass) [20].
CCrMoSiMnNiV
1.4–1.611–130.7–1.2≤0.6≤0.6-0.15–0.3
Table 2. Material properties of SKD11 alloy steel [21].
MaterialsSKD11
Yield stress (MPa)688
Tensile strength (MPa)786
A (MPa)84.332
B41.265
Density (ρ kg/mm3)8400
Elastic modulus (E, kN/mm2)210
Poisson ratio ( μ )0.3
Thermal expansion coefficient (10−6/K)11
Melt temperature Tm (K)1733
Specific heat (J/kg.°C)461
Thermal conductivity coefficient (w/m.K)20.5
Table 3. The coefficients of J-C fracture model for SKD11 alloy steel material.
D1D2D3D4D5
0.029750.5349−3.50900.21122.1684
Table 4. The cutting force and chip shrinkage coefficient in primary experiments.
Exp. No.V
(m/min)
t
(mm)
FE
(N)
KE
11900.554.8331.5312
22351100.4351.4594
32801.5136.1121.5089
Table 5. The experimental and corresponding simulation data.
No.V
(m/min)
t
(mm)
to
(mm)
FE
(N)
FS1
(N)
ΔF1
(%)
KEKS1ΔK1
(%)
11900.50.89654.83361.10711.441.53121.792017.03
223511.647100.435107.74610.571.45941.647012.85
32801.52.471136.112156.2148.711.50891.64739.17
Table 6. Cutting force equational parameters.
Stress Triaxiality Elements
Cutting ConditionsV = 190 m/min
t = 0.5 mm
V = 235 m/min
t = 1.0 mm
V = 280 m/min
t = 1.5 mm
ParameterPositiveNegativePositiveNegativePositiveNegative
G43.0842.55101.72196−252.22188
H0.0880.125−0.047−0.689−1.519−0.6897
L−41.21−38.03−108.6−2195239.1−2192
M−5.63−3.89−3.164−3.164−0.206−08312
Table 7. The FE simulation data-based modified fracture model compared with corresponding experiments.
No.V
(m/min)
t
(mm)
FE
(N)
FS2
(N)
ΔF2
(%)
KEKS2ΔK2
(%)
11900.554.83352.3124.601.53121.47203.87
22351100.43597.5610.121.45941.43501.67
32801.5136.112147.7892.851.50891.46932.62
Table 8. The new set of experiments and FEM simulation results based on the proposed fracture model.
Exp. No.V
(m/min)
t
(mm)
FE
(N)
KEFS2
(N)
KS2 Δ F S 2 ( % ) Δ K S 2 ( % )
1190196.2011.435494.3221.37701.95%4.07%
21901.5136.1211.4821133.9151.45201.62%2.03%
32351.5136.11221.4396139.7831.51002.70%4.89%
42350.555.034341.401254.9541.35400.15%3.37%
52800.554.6391.466256.8451.48604.04%1.35%
6280197.1231.4623102.2571.38805.29%5.08%
Publisher’s Note: MDPI stays neutral with regard to jurisdictional claims in published maps and institutional affiliations.