Article

Experimental Analysis of the Effect of Wear Factors on Guide Vane of Hydraulic Turbine

1
Sichuan Provincial Engineering Research Center of Hydroelectric Energy Power Equipment Technology, Xihua University, Chengdu 610039, China
2
Key Laboratory of Fluid and Power Machinery, Ministry of Education, Xihua University, Chengdu 610039, China
*
Author to whom correspondence should be addressed.
Machines 2022, 10(4), 264; https://doi.org/10.3390/machines10040264
Submission received: 14 March 2022 / Revised: 2 April 2022 / Accepted: 2 April 2022 / Published: 7 April 2022
(This article belongs to the Section Turbomachinery)

Abstract

:
In this paper, in order to study the wear of the guide vane of the hydraulic turbine, a test bench was built according to the actual internal flow of the hydraulic turbine of the power station. The value of the wear of the surface of the guide vane after polishing was reduced by 18.1 μm compared with that before polishing of P = 30.9 MW and by 12.5 μm at P = 42.8 MW. In order to reduce the influence of sediment wear on the guide vane, a 0.3 mm thick tungsten carbide coating was sprayed on its surface, and the wear of the guide vane after spraying tungsten carbide was obtained. The wear of the guide vane was reduced by about a factor of three to four times compared with that before spraying. In addition, according to the pH value of 6.73 of the river where the power station is located, the change of dissolved oxygen in the water body will affect the wear of the metal material on the surface of the guide vane, and the dissolved oxygen varies with the change of the water body temperature, so we simulated the temperature of the water body in the flood and the dry period of the power station, and got the wear amount of the polished guide vane in the flood period under the two working conditions of 28.1 μm and 47.3 μm, respectively. The wear amounts of the guide vane in the dry period were 25.2 μm and 43.9 μm, respectively. In addition, the service life of the guide vane before and after polishing and after tungsten carbide spraying was estimated based on the wear data obtained from the test, which provides a basis for power plant maintenance.

1. Introduction

In recent years, with the rapid development of industry, hydropower has come to occupy an increasingly important position as a clean and renewable energy source. As a core component of hydropower plants, the hydraulic turbine has received a lot of attention from researchers and has encountered many problems in the development process. Most rivers in China have a high sediment content, especially in the Yellow River basin, where sediment intake is as high as 1.6 billion tons per year, which can cause turbines to suffer more severe wear from sediment. When sediment particles flow over the overflow components, they form deep or shallow grooves on the surface, thus causing some damage to the overflow components, and in severe cases the blades can break. Meanwhile, the movement of sand particles in the turbine can bring about performance degradation, vibration, cavitation, and other problems which seriously affect the stability of the turbine [1,2,3]. Therefore, it is crucial to study the internal flow of the turbine in the sand-laden flow and the wear of its overflow components.
A lot of research has been done by domestic and foreign scholars on reducing the effect of turbine erosion by sediment wear [4,5,6,7]. Because the simulation technique combined with the experimental method can simulate the internal flow of the turbine well, it is recognized by domestic and foreign scholars. Han Y et al. [8] first decomposed and reconstructed the tip leakage vortex (TLV) of the mixed flow pump as a turbine in pump mode by dynamic mode decomposition (DMD) through numerical simulation. The results show that DMD can accurately decompose the dominant frequencies of TLV evolution and its harmonic frequencies. The coherent structures captured by DMD are mainly distributed near the trajectory of PTLV. Koirala R et al. [9] developed a simplified 3GV device to perform erosion and observe its effect for the hydraulic turbine guide vane, and verified the rationality of the device by numerical simulations. The experimental results showed that sediment wear increased with the mass of sediment particles, thus increasing the pressure at the outlet of the guide vane. Liu M et al. [10] developed a theoretical model for the prediction of the centrifugal pump as energy performance in pump and turbine mode, and an iterative method for determining BEP based on flow rate in turbine mode. Based on experimental measurements and numerical simulations, three centrifugal pumps were used to verify the proposed method’s accuracy. In addition, Rajkarnikar B [11] and R. Koirala H. P. Neopane [12] also investigated the internal flow conditions of the turbine and the erosion of overflow components by sediment wear by using a combination of numerical simulations and experiments, as well as proposed corresponding solutions.
With regard to solving the problem of turbine overflow components subjected to sediment wear and erosion, many researchers have proposed methods to improve the design of overflow components. kOIRALA R et al. [12] studied the effect of four different guide vanes subjected to sediment wear and erosion by numerical analysis through ANSYS and validation using experiments, and obtained the guide vanes design scheme subjected to the least sediment wear. kHANAL K et al. [13] used experiments and numerical simulations to design the runner blades that are subject to the least erosion while ensuring the efficiency of the turbine. In addition, Martinez J J et al. [14] have studied the optimization of turbine overflow component design. The study of overflow component materials can also reduce the influence of sediment wear and thus improve the service life of the turbine. RAI A K et al. [15,16] studied the influence of sediment wear on the water bucket of an impact turbine with three materials and two coatings, and analyzed the serious location of wear and the form of wear on the water bucket part through comparative tests, and analyzed the materials with better sediment wear resistance.
In this paper, based on the above study, the influence of reducing the guide vane by sediment wear was considered from the perspective of materials, and one material and one spraying were selected as the object of study. The maximum wear of the two materials was obtained based on the test, and the service life of the guide vane of the two materials was predicted based on the value of the maximum wear. In addition, the influence of the acidity and alkalinity of the river where the power station is located and the roughness of the surface of the guide vane test piece on the abrasion by sediment is also considered, which is one of the innovative points of this paper. The experimental study provides guidance to the power station on the problem of wear of the internal parts of the turbine by sediment, a theoretical basis for the selection of spraying materials and polishing over the parts, and the need for the power station to pay attention to the influence of river acidity on the wear of the parts. Through the above considered wear factors, the overall operating efficiency of the turbine unit of the power station can be improved, providing a guarantee for the sustainability of the power station.

2. Test Bench Design and Prototype Processing

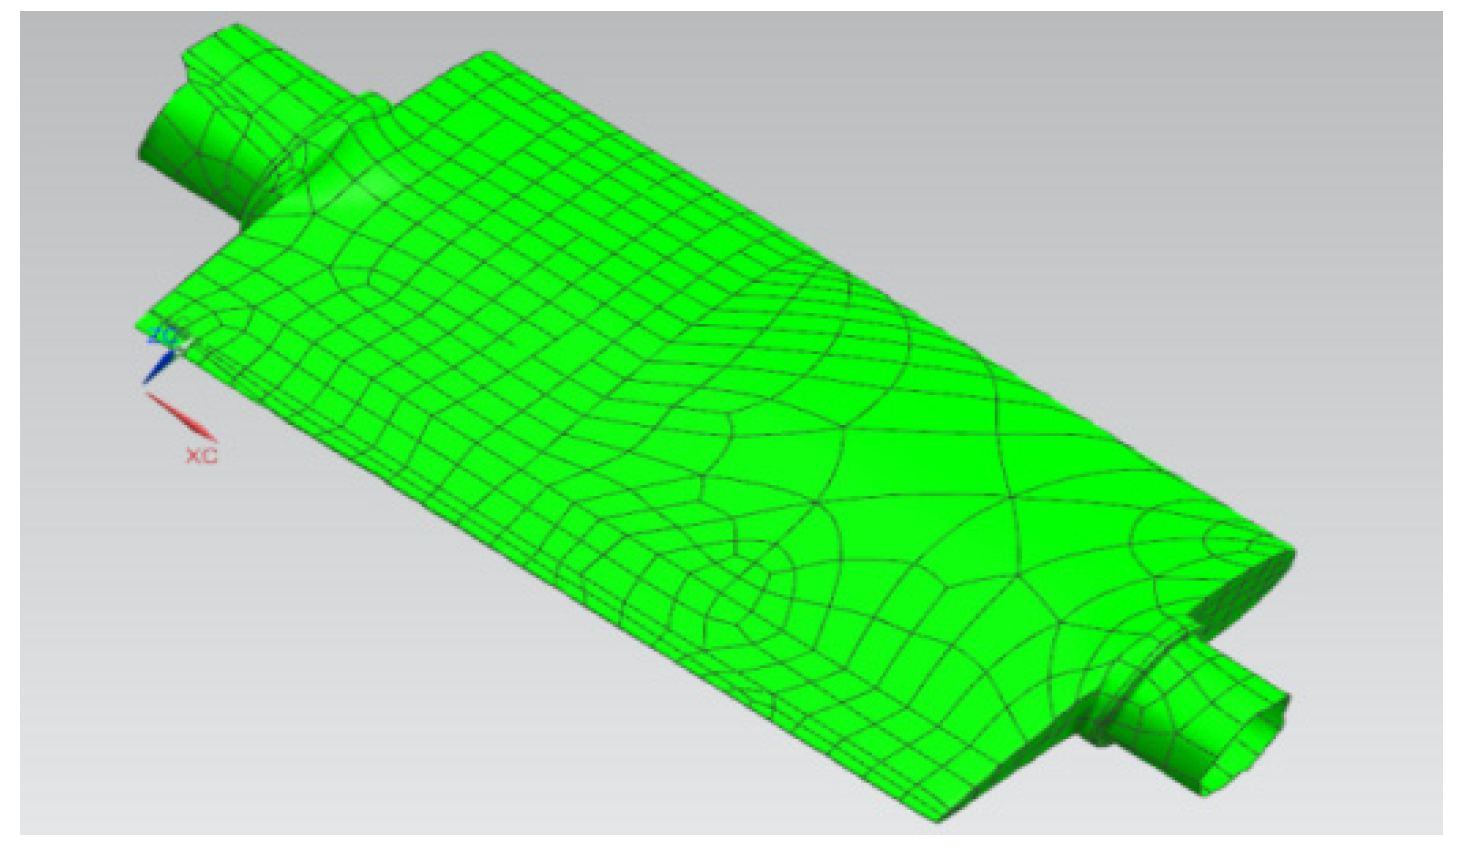
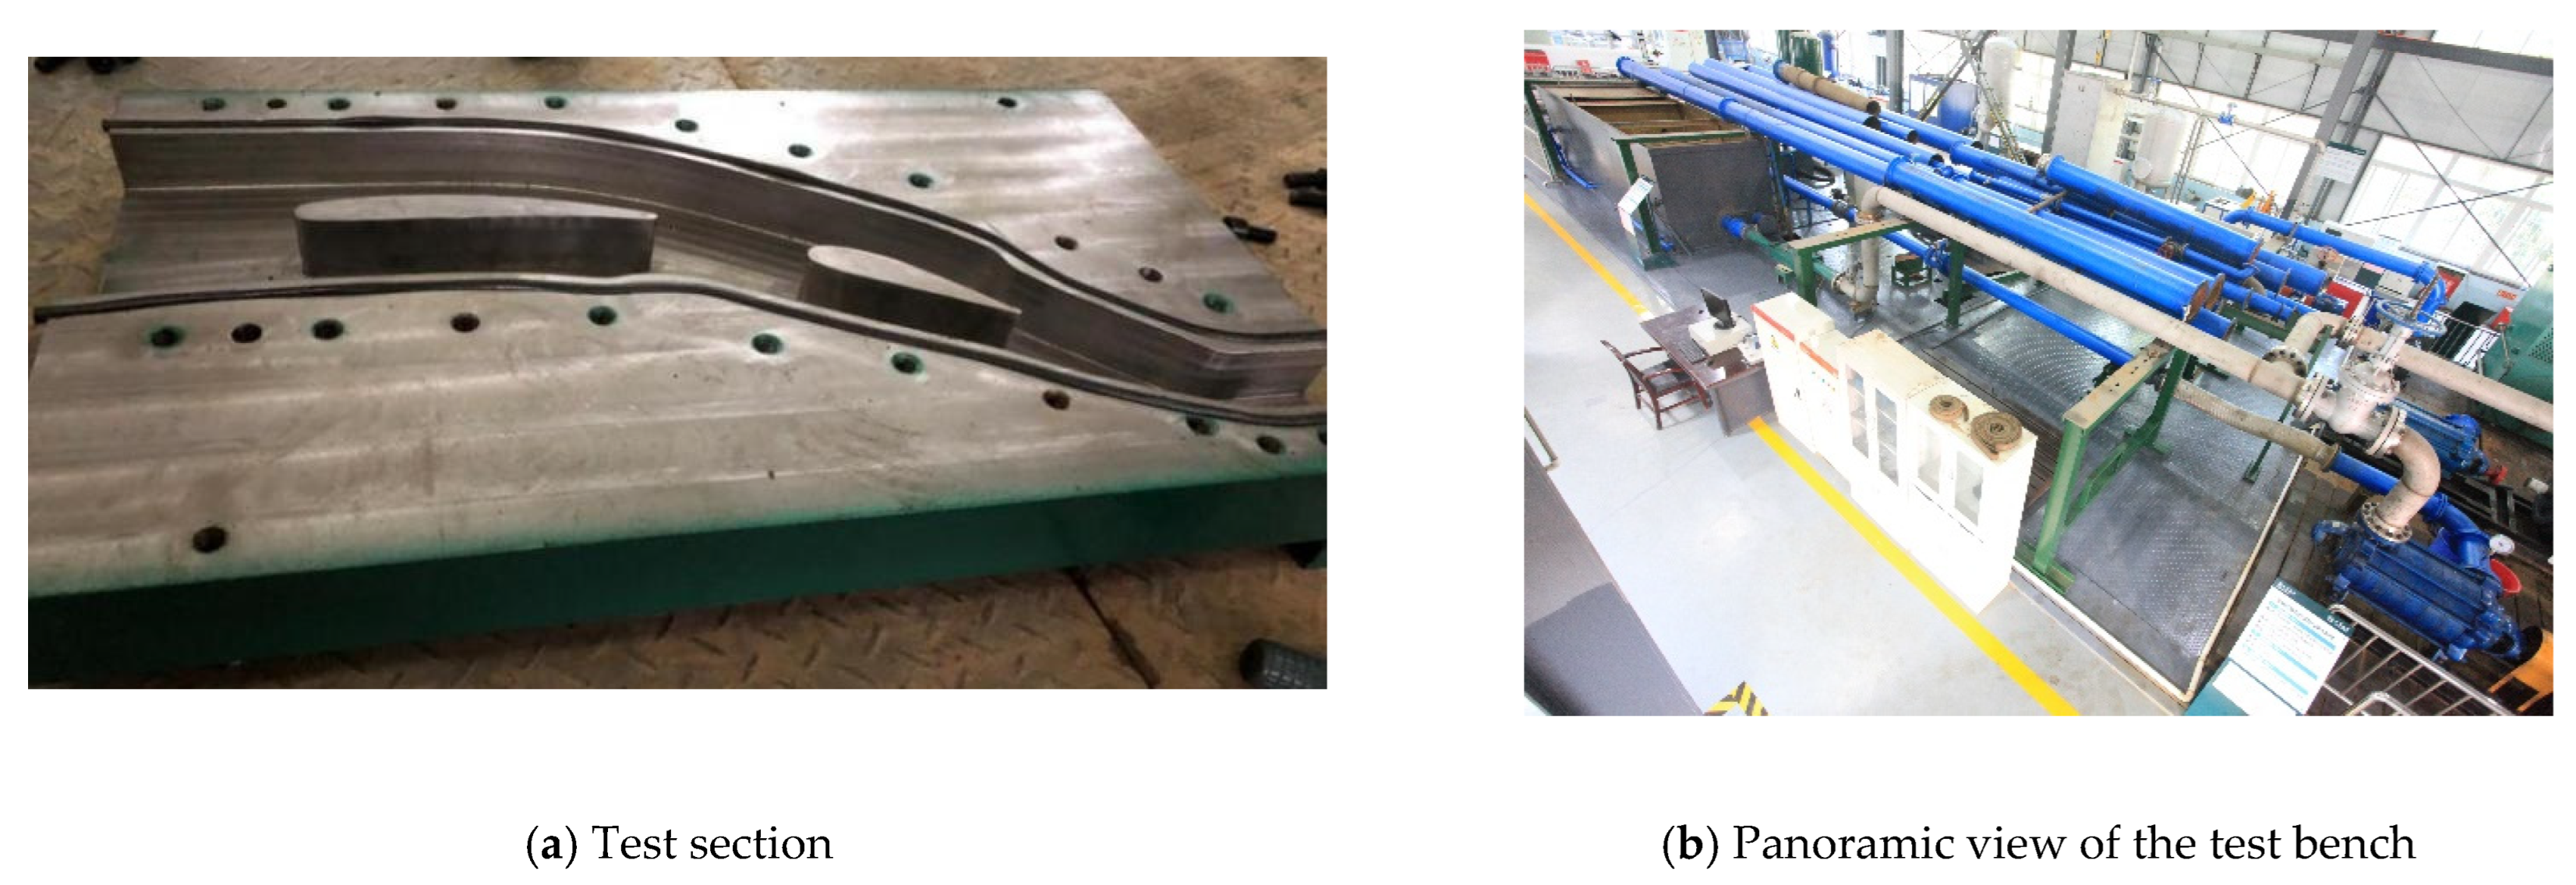
2.1. Test Bench Design

Regarding the design of a mixed-flow hydraulic turbine test stand, a one-to-one replication according to the real model of the power station would waste a lot of time and financial resources, so many scholars are proposing a simple test stand design concept when designing a test stand for over-flow components [17,18]. In this paper, based on the structure and flow of the hydraulic turbine guide mechanism of the real machine, the sediment wear test of its hydraulic turbine guide vane is carried out. Firstly, CFD full-flow channel sand and water numerical calculation of the real turbine is carried out [19,20], and then two flow channels containing complete movable and fixed guide vanes are extracted according to the full-flow channel numerical simulation results, and the sand and water flow lines of the outer side walls of the flow channels contain the adjacent movable and fixed guide vanes side walls, and a single test working section around the flow channel is designed according to the flow similarity principle in line with the actual flow to ensure the simulation of the real turbine. This is done in order to ensure the simulation of the environment of the movable guide vane and fixed guide vane working in the flow channel of the real hydraulic turbine.
Since the power station lacks the design drawings of the guide vane, this paper uses reverse engineering [21,22,23] means to scan the guide vane of the power station on site using a handheld 3D scanner, as shown in Figure 1. Solid restoration is performed according to Geomagic Studio software, which is based on the principle of using many tiny spatial triangular slices to approximate the restored solid model. In modeling, the NURBS surface model is created directly by fitting NURBS surface slices. The surface process is divided into a point phase, a polygon phase, and a surface phase, and these three phases are closely linked together. The point phase to polygon phase realizes combining point clouds and smoothing data; the polygon phase to surface phase realizes smoothing and editing polygon models; and the surface phase to analysis phase realizes regularization and shape adjustment. The cavities are filled based on curvature, tangent and plane methods. For general holes, the curvature holes are repaired directly based on the surrounding point cloud data; for undesirable holes, the point cloud data around the holes are firstly removed, then repaired, and finally the guide vane is modeled, and the solid model of the guide vane is obtained as shown in Figure 2. Finally, the movable guide leaf was modeled using the commercial software UG.
In this paper, the study is P = 42.8 MW and P = 30.9 MW, two operating conditions, so to adjust the guide vane opening, the guide vane has been modeled to re-adjust the sketch shown in Figure 3, the guide vane according to the axis of rotation adjustment to take its own array of guide vane with the maximum outer diameter circle of 200.8 mm, 252.8 mm, respectively. according to the calculation results to obtain the flow channel extraction schematic As shown in Figure 4. The CAD design of the test stand under operating conditions P = 42.8 MW and P = 30.9 MW designed according to the flow path schematic is shown in Figure 5. The physical diagram of the wear test bench obtained by machining is shown in Figure 6.
In order to make the test wear situation conform to the actual power station, the test sand samples were collected from the head of the power station gate and sent to the testing center of the Ministry of Land and Resources for testing, and the analysis report of the sediment particle testing was obtained as shown in Table 1. In addition, the average pH value of the river where the power station is located was measured to be 6.73, which is weakly acidic.

2.2. Prototype Processing

In this paper, the material of the guide vane test piece is ZG06Cr13Ni4Mo, because we want to compare the effect of roughness on the wear of the guide vane, so the surface of the guide vane is polished and ground to increase its smoothness. Many methods have been proposed by domestic and foreign scholars about the measurement of surface roughness of the specimen [24,25,26]. By measuring the roughness of the guide vane specimen at five different positions after polishing and taking the average value as the specific discrimination of roughness, the results are shown in Figure 7 and Table 2. Under the same working condition, the guide vane before and after grinding was tested for mud and sand wear respectively, and the diagram of the guide vane before and after grinding is shown in Figure 8 and Figure 9. In addition, considering the reduction of wear, a tungsten carbide coating with a thickness of 0.3 mm was sprayed on the surface of the guide vane. In order to facilitate the measurement of the test piece after the test, laser inscriptions were made along the z-direction on the slot surface of the guide vane, and each inscription was numbered as shown in Figure 10. The depth before and after the surface wear at the back and front test positions of the guide vane is read using a white light interference profiler, and the data before and after the test are calibrated by selecting the same position within the reference plane and extracting the calibrated position in the same plane, then the difference between the two contour lines is the wear depth of the corresponding position. The white light interference profiler is shown in Figure 11.
In this paper, the wear data of the 1st, 2nd, 8th and 29th indentation points on the backside of the guide vane specimen were measured by a 3D white light interferometer. These indentation points were chosen because the wear of these indentation parts was more serious under the simulation results and the actual observation of the power station, as shown in Figure 12.

3. Analysis of Test Results

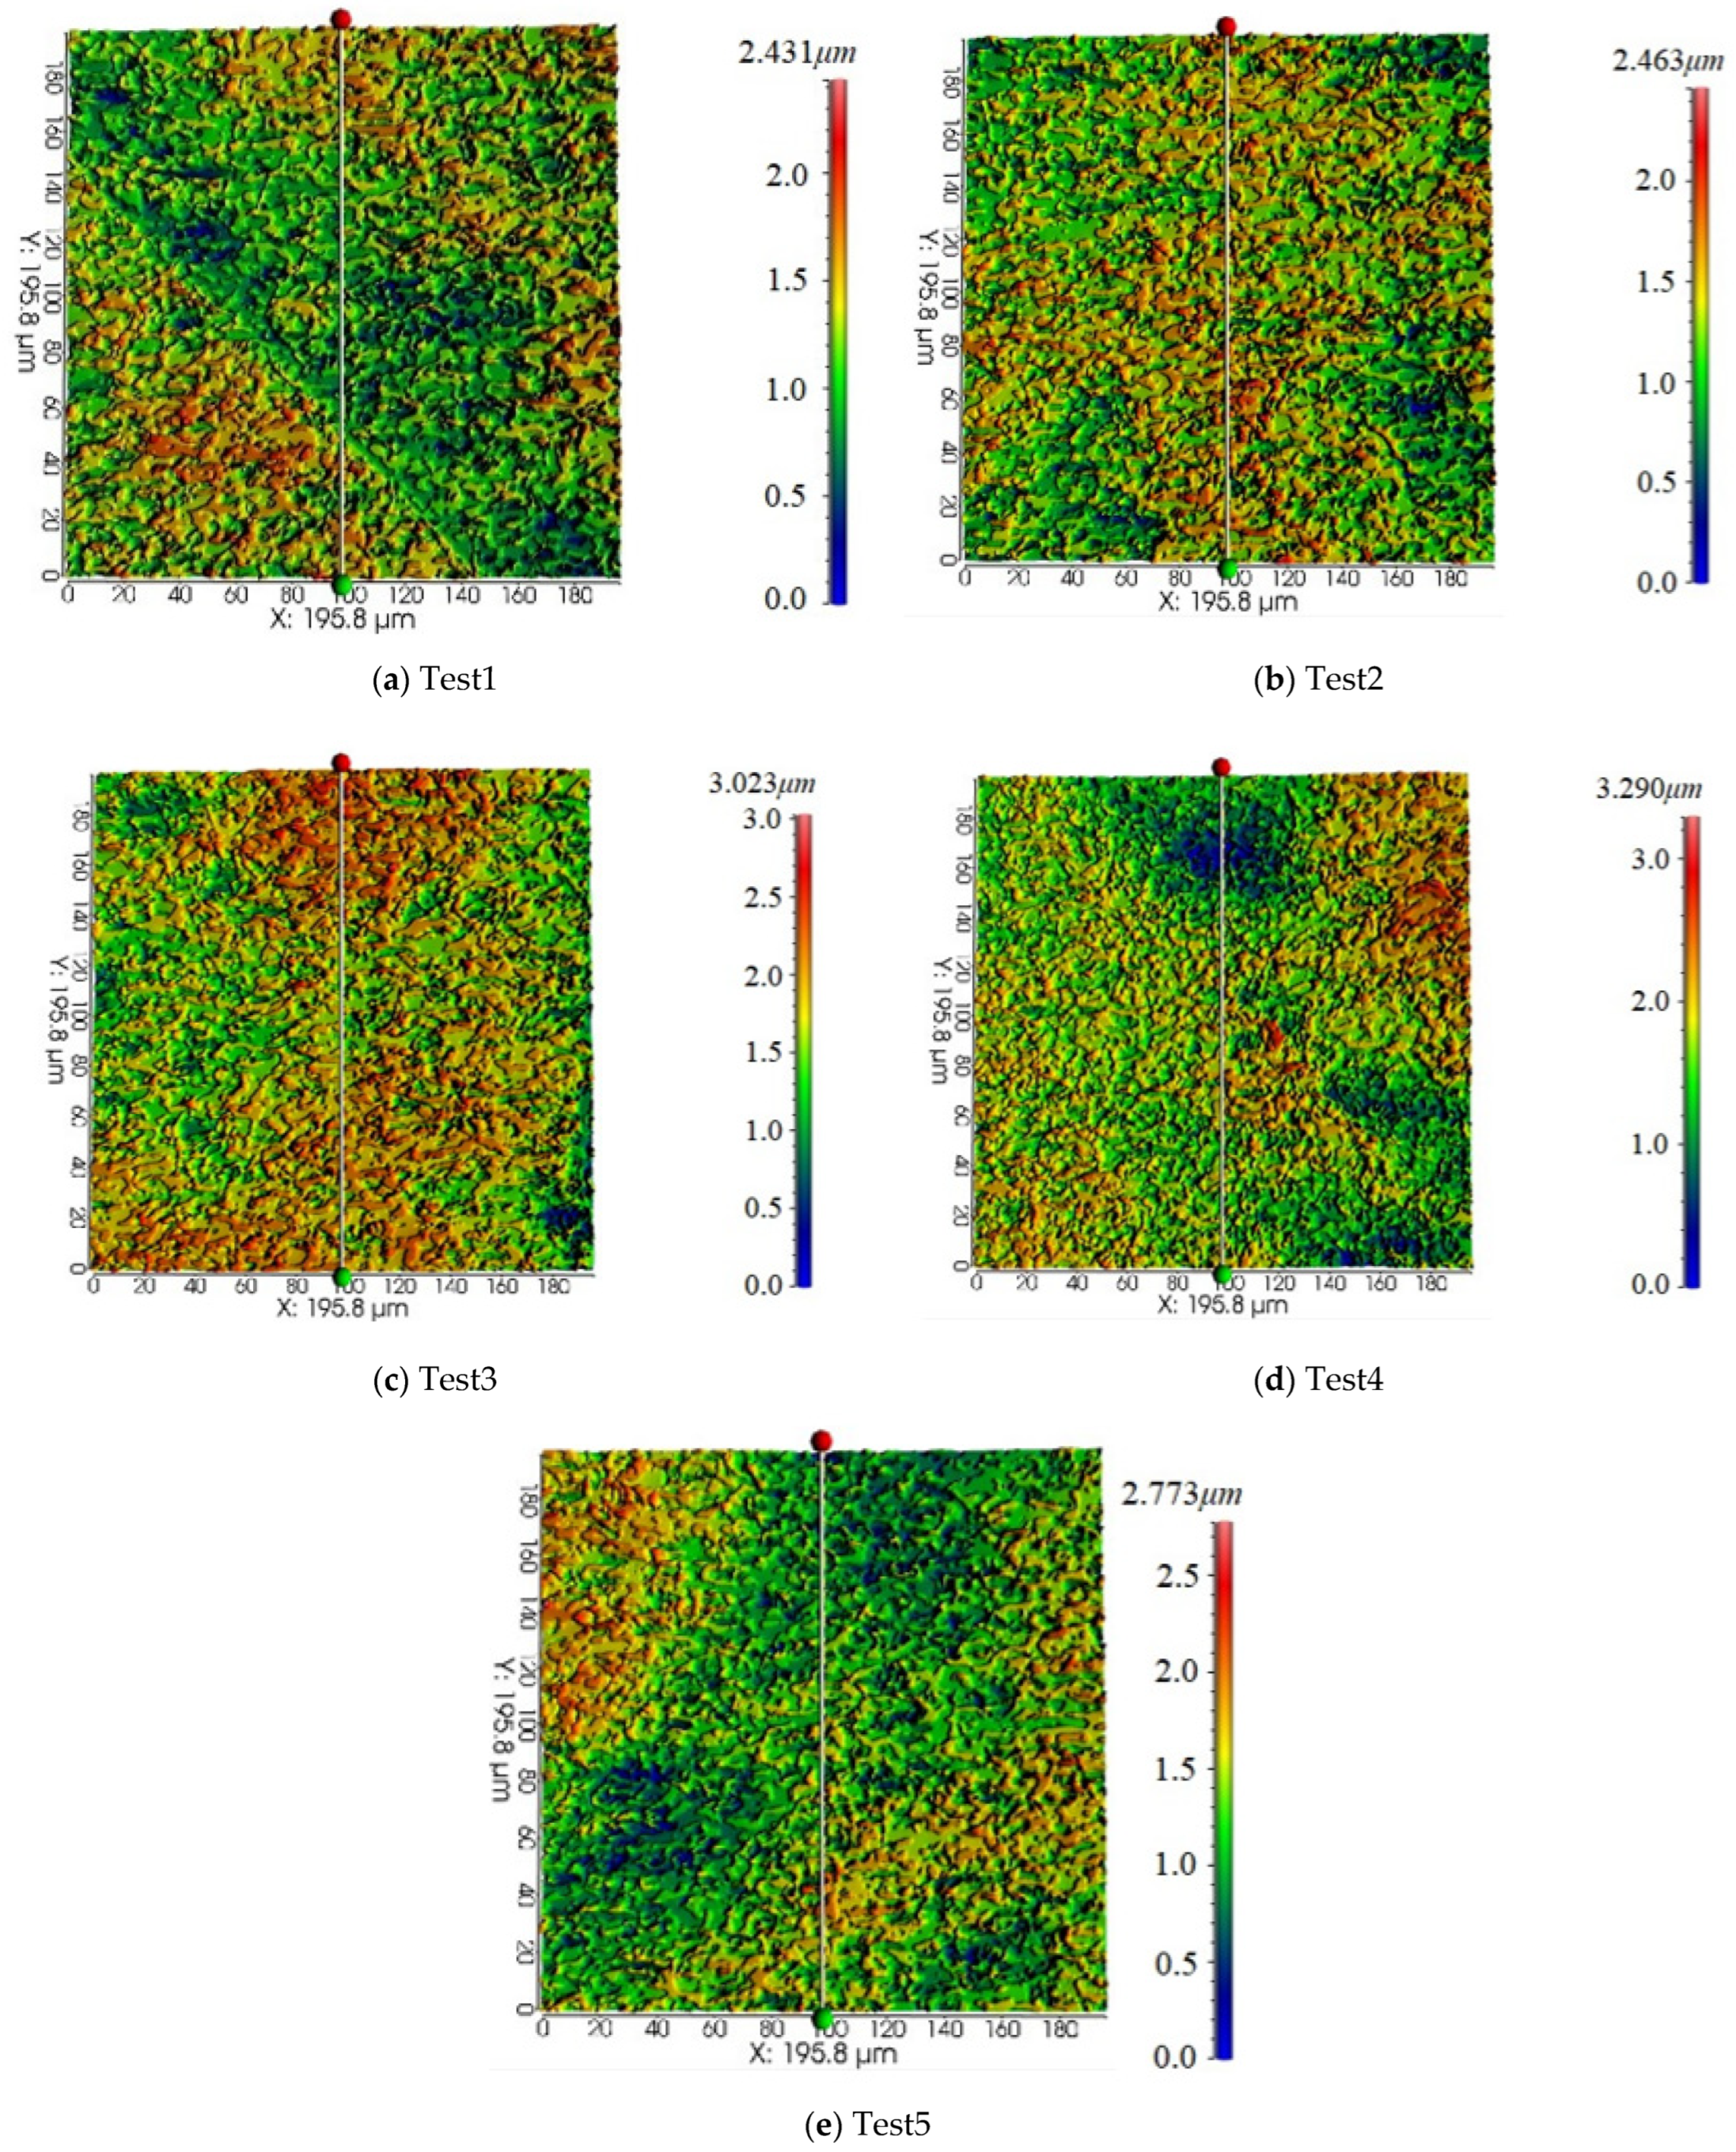
3.1. Effect of Roughness on Wear of Guide Vane

In order to verify the effect of the surface roughness of the guide vane on sediment wear, the wear amount of 1, 2, 8 and 29 engraved points on the back of the guide vane at different vane heights were obtained according to the test results. The wear amount of the guide vane with two different roughnesses under P = 30.9 MW working conditions is taken for comparative analysis. In addition, the wear amount of the guide vane with two different roughnesses under the P = 42.8 MW working condition is taken for comparative analysis of different working conditions. In order to reduce the measurement error and ensure the accuracy of the test data, five measurements were repeated for each inscribed point, and the average data of the five measurements was taken as the final result, and the confidence level of the measurement results was 97%. The wear data of the four inscribed points under two working conditions are shown in Figure 13 and Figure 14. From Figure 13 and Figure 14, it can be seen that the wear at the guide vane is more serious at the No. 1 and No. 29 points, and the wear at the low leaf height at the No. 29 point is more serious, which may be because the sediment with larger particle size has poor flowability and it is easy to form deposits at the low leaf height, and the sediment particles have a larger impact angle at the No. 29 point, resulting in more serious wear; the wear at the different leaf heights at the No. 1 point is more moderate, which may be due to the fact that when the sand and water flowed through the No. 1 point, the sediment with a large particle size was deposited at the bottom of the flow channel, while the sediment with small particles would follow the flow of water to scour the tail position of the guide vane because of the strong flowing nature, and the tail position had a small collision angle with the sediment particles, so the wear at the different leaf heights at the No. 1 point tended to be gentle and did not have much difference. The wear amount at the No. 2 engraved point and No. 8 engraved point is flatter, but the wear amount is lower, which is due to the influence of sand and water velocity, as the flow channel becomes narrower, the sand and water velocity becomes larger, the kinetic energy contained in the sediment particles increases, and the wear amount increases gradually. In addition, the surface wear forms of the inscribed points 1, 2, 8, and 29 at 50% of leaf height were photographed, as shown in Figure 15 and Figure 16, and the 50% leaf height was chosen considering the effect of the sidewall effect [27,28]. According to the results in Figure 15 and Figure 16, it can be further verified that the wear at the head position is mainly large particle sediment impact wear, and the wear at the tail position is mainly sand level shift scouring. Comparing the wear of the guide vane under the two operating conditions, it can be seen that the wear curves of the four points at different leaf heights tend to be similar, with the wear of the No. 1 and No. 2 points being higher at the middle leaf height and lower at the low and high leaf heights; the wear of the No. 8 point at different leaf heights varies smoothly without excessive or low wear; the wear of the No. 29 point gradually decreases from the low to the high leaf height. At P = 42.8 MW, the wear amount of all four points is larger than that at P = 30.9 MW, which is due to the increase of water velocity caused by the increased inlet flow, which further aggravates the sediment wear.
The surface of the guide vane before grinding and polishing will have a lot of small uneven pits, the large particle size of the sediment particles hitting these pits will make the area of the pits increase, and the small particle size of the sediment particles will form refraction inside the pits causing secondary or even multiple collision wear, although the secondary collision is smaller compared to the first collision kinetic energy, but due to the pushing effect of the water will give the sediment particles new kinetic energy, intensifying the surface wear of the guide vane, as shown in Figure 17. In addition, the larger the particle size of the potential energy contained in the larger the more likely to cause sand-water separation, while causing greater sources of interference, will produce additional turbulent eddy, while the formation of more sand particles and guide vane surface collision refraction will affect the flow of water flow patterns; it is easy to achieve the grinding and polishing shown in the carved point 8 before the amount of wear in some leaves high than before grinding and polishing, of course, this in the guide vane head position (1, 2 near the engraved point) is less affected. From Figure 15 and Figure 16, it can be seen that there are many pits of different sizes in the head position of the guide vane which are formed by the impact wear, and the different sizes of the pits may be due to the collision of large grain size sand particles to expand the pits with smaller areas, and then the sediment with small grain size continuously collides inside the pits to increase the wear depth of the pits, and the area of the pits formed at P = 42.8 MW is larger. Because the flow rate becomes larger, the kinetic energy and potential energy of sand particles increases, and the wear caused is more serious. Obvious sand and water scouring marks appear at the tail position. In order to further understand the influence of the surface roughness of the guide vane on the wear, the guide vane specimens before and after the wear were weighed to obtain their specific wear amount, as shown in Table 3. As can be seen from Table 3, the polished guide vane is less eroded by sediment abrasion.

3.2. Wear after Tungsten Carbide Spraying

Tungsten carbide is a compound composed of tungsten and carbon with the molecular formula WC. Tungsten carbide is chemically stable and tungsten carbide powder is used in cemented carbide production materials [29,30,31]. Tungsten carbide coating is highly dense, with high bonding strength, while the porosity can be less than 1% and the bonding strength can be more than 70 MPa. low oxidation of the coating material, less carbon loss, high hardness of the coating. High-speed impact and strong deformation distort the lattice of the material and increase the activity of the material, thus increasing the possibility of physical bonding with adjacent particles or substrate materials, which makes the coating highly reliable; the physical properties of the carbides used in this test are shown in Table 4.
In this paper, tungsten carbide (HV = 1264) powder with a thickness of 0.3 mm was thermally sprayed on the guide vane surface to enhance its anti-wear performance. The wear amounts of different leaf heights at inscribed points 1, 2, 8, and 29 were obtained based on the measurements after the test, as shown in Figure 18. According to Figure 18, the wear of the guide vane after spraying tungsten carbide is significantly reduced at different leaf heights, and the wear difference at different leaf heights is reduced compared with that before spraying, which shows that the fatigue resistance of tungsten carbide material is much greater than that of ZG06Cr13Ni4Mo. The guide vane time after spraying was measured by weighing, and the results are shown in Table 5. From Table 5, it can be seen that the guide vane wear is significantly reduced after tungsten carbide spraying, which is three to four times of the role before spraying.

3.3. Effect of Power Station River pH on Wear of Guide Vane

Oxygen depletion corrosion is also known as oxygen absorption corrosion or oxygen depolarization corrosion. The solution of neutral oxygen molecules (O2) in the cathode reduction reaction is caused by electrochemical corrosion. The cathodic process due to the diffusion of oxygen makes it difficult to be blocked, which might also be caused by the cathodic reaction process,.. Many metals in the corrosion of the aqueous solution, as well as in the humid atmosphere and soil corrosion, are examples of this. Oxygen depolarization corrosion in cathodic control and the corrosion rate will depend on the oxygen reduction reaction rate on the cathode surface, and the relative size of the oxygen transported to the cathode surface between the two, as a depolarizing agent of neutral oxygen molecules, relies only on diffusion and convection transport. The reaction products leave the cathode by diffusive migration, and there is no gas precipitation or stirring effect [32,33,34].
According to actual measurements, the pH of the river where the power station is located is 6.73, which is weakly acidic, because the pH of water is between 4 and 9, and the steel corrosion depends mainly on the oxygen concentration, which increases with the oxygen concentration, and the flow rate of water increases, the diffusion rate of oxygen reaching the metal surface increases, the stagnant liquid layer on the metal surface also becomes thinner, and the oxygen consumption corrosion rate accelerates. Because the power station is located in the river flood season in May to October, which includes summer and autumn, the river water temperature is higher and the water velocity is larger, so it leads to an increase in the rate of dissolution reaction and oxygen reduction on the surface of the guide vane. During the dry period from November to April, the river water temperature is lower and the water velocity is reduced, meaning that the oxygen consumption corrosion rate is smaller.
In order to make the test similar to the actual power station, the water temperature is controlled to simulate the wear of the guide vane during the dry and flood periods of the power station. The average temperature of the river where the power station is located is generally 24–27 °C in summer and 4–8 °C in winter. Because the temperature of the water body will affect the change of dissolved oxygen in the water, so it can also be used as the basis of the effect of the water body’s dissolved oxygen on the wear of guide vane. The water used for the test is tap water, and its average temperature is 25.6 °C, which can be used to simulate the wear of the guide vane in the summer. The test bench is equipped with a cooling system which can cool the winding water body to meet the winter water temperature standard, and the cooling system is shown in Figure 19. The wear data of the guide vane under two different working conditions after polishing are obtained according to the test, as shown in Figure 20 and Figure 21. It can be seen in Figure 20 and Figure 21 that there is a significant effect in the temperature on the wear amount of the guide vane. Comparing the two test water temperatures, the wear of the guide vane at different leaf heights at a water temperature of 7.8 °C is lower than that at a water temperature of 25.6 °C. However, comparing the wear trends of different leaf heights in the two groups of water temperatures, it can be seen that the change of water temperature does not affect the wear pattern of the guide vane at different leaf heights.

3.4. Estimated Life of Guide Vane

In the guarantee period, the indicator of the turbine wear amount should comply with the maximum depth of universal wear, which should not exceed 4 mm. The local wear of anti-wear plate should not exceed 10 mm or should not be worn through, and the maximum depth of local wear of other parts should not exceed 8 mm [35]. The maximum wear area and maximum wear amount of the guide vane made of ZG06Cr13Ni4Mo in the direction of the wing chord length can be obtained according to the results of the turbine after 96h of operation at P = 30.9 MW and P = 42.8 MW operating conditions; the maximum wear area and maximum wear amount of the guide vane after tungsten carbide spraying can be obtained after test operation of 142 h. The wear depth can be predicted cumulatively according to the wear amount, and the specific formula is as follows:
Δ z = E ˙ i × t i
where: E ˙ i is the wear rate in a certain time period; ti is the operating time in a certain time period, Δ z represents the depth of wear.
The wear amount of the guide vane at different blade heights in the wing chord upward was obtained through the test. Considering the influence of the side wall effect, the average of 40–60% wear amount of all the inscribed points on the front and back of the guide vane was taken as the wear amount of each inscribed point for the life estimation of the guide vane, and some inscribed points with the incorrect measurement or that were difficult to measure were deleted, and the wear amounts of different wing chords upward were obtained, as shown in Figure 22, Figure 23 and Figure 24. According to Figure 22, Figure 23 and Figure 24, the maximum wear amount of the guide vane before and after polishing and spraying tungsten carbide can be obtained. From the test of the effect of water temperature on the wear of guide vane, it can be seen that the guide vane of the power station is affected by sediment wear differently in the flood and dry water periods, so the difference of the wear of the guide vane in different wing chord upwards under two water temperatures is extracted for calculation, as shown in Table 6. The specific service life of the guide vane can be obtained by substituting the data in Table 6 into Equation (1), as shown in Table 7.
According to Table 7, without polishing the guide vane, the service life of the guide vane is 16,623.38 h (i.e., 23.09 months) at P = 30.9 MW, assuming sufficient rainfall and a constant water temperature of 25.6 °C throughout the year, and the service life of the guide vane is increased by 6837.88 h (i.e., 9.50 months) after the spraying of 0.3 mm of tungsten carbide. Under the condition of P = 42.8 MW, the service life of guide vane is 12,842.81 h (i.e., 17.84 months), and the service life of tungsten carbide after spraying is increased by 3678.76 h (i.e., 5.11 months). The actual situation of the power station is that there is a dry period and a flood period and the water temperature changes, resulting in changes in the amount of dissolved oxygen in the water body. This is also one of the reasons affecting the wear of the guide vane, so the guide vane polishing treatment and the simulation of the actual situation of the power station for life prediction, assuming that the polished guide vane is put into use at the beginning of the flood period, in P = 30.9 MW conditions, the guide vane service life is 29,090.91 h (i.e., 40.40 months), and after tungsten carbide spraying, the service life is increased by 6837.88 h (i.e., 9.50 months). At P = 42.8 MW, the service life of the guide vane is 16,842.08 h (i.e., 23.39 months), and after tungsten carbide spraying, the service life of the guide vane is increased by 3678.76 h (i.e., 5.11 months).

4. Conclusions

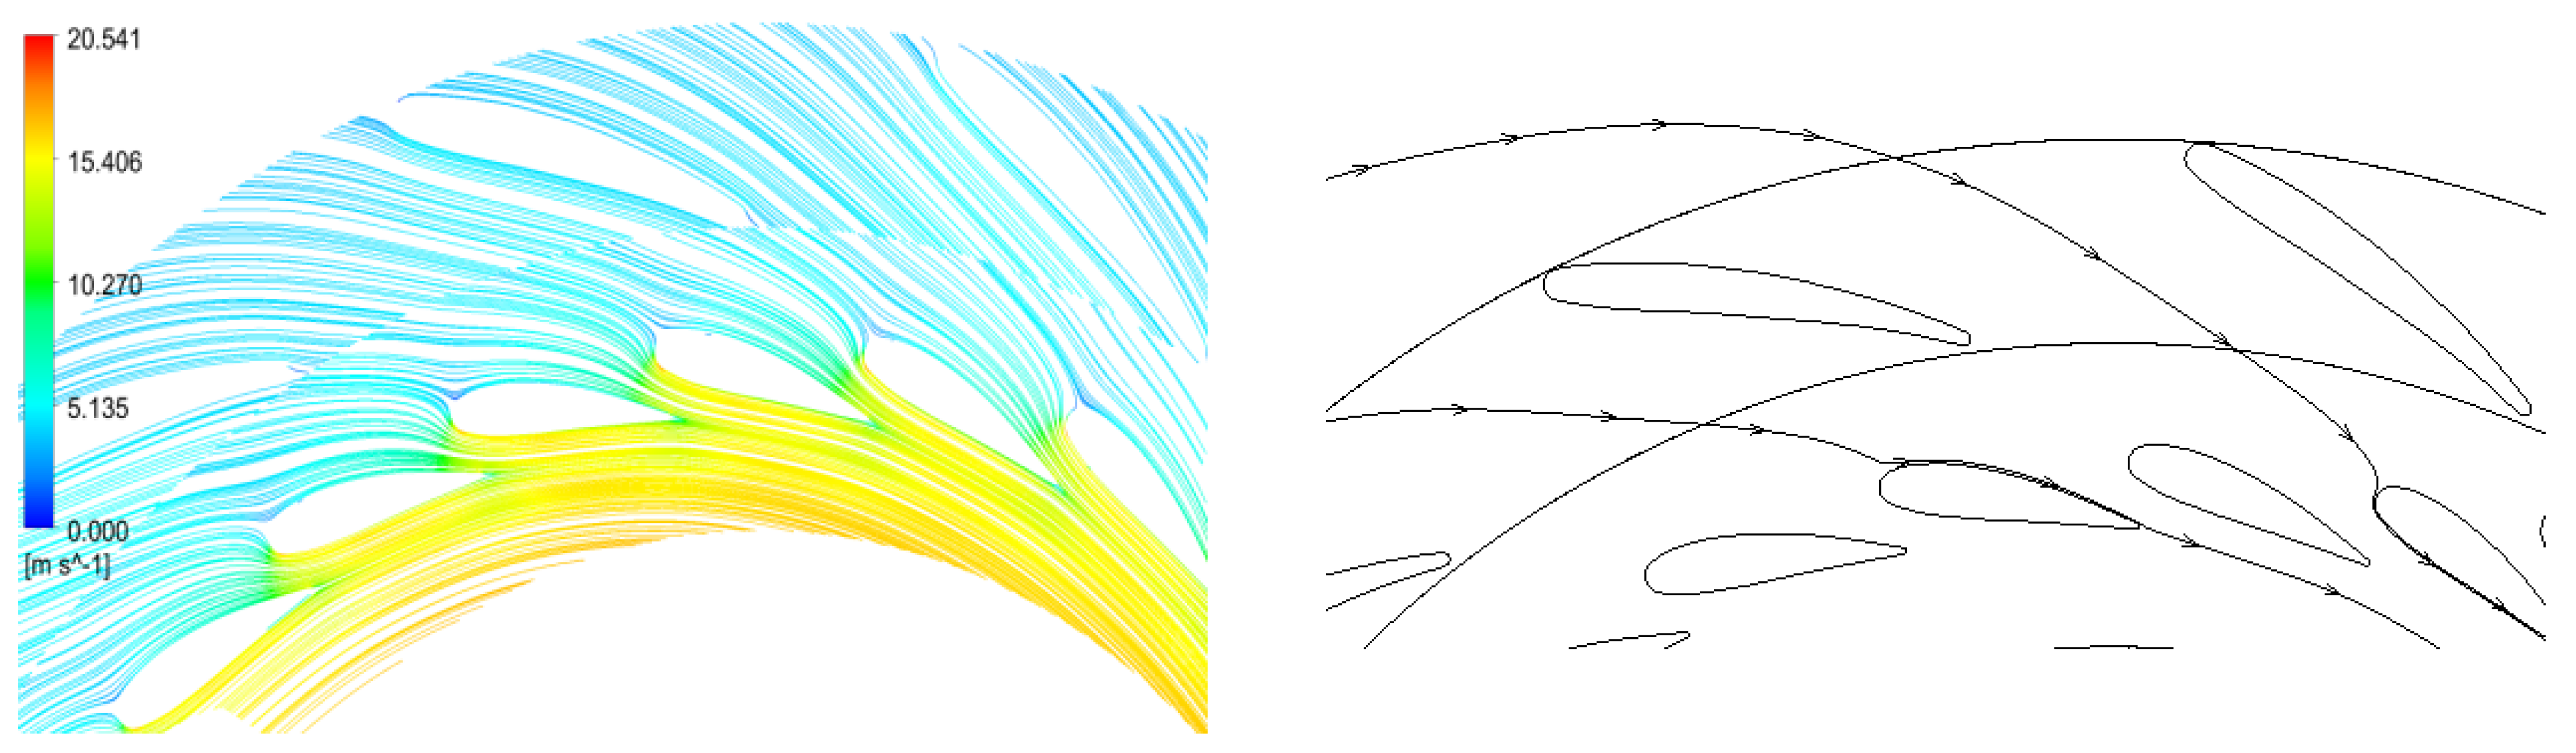
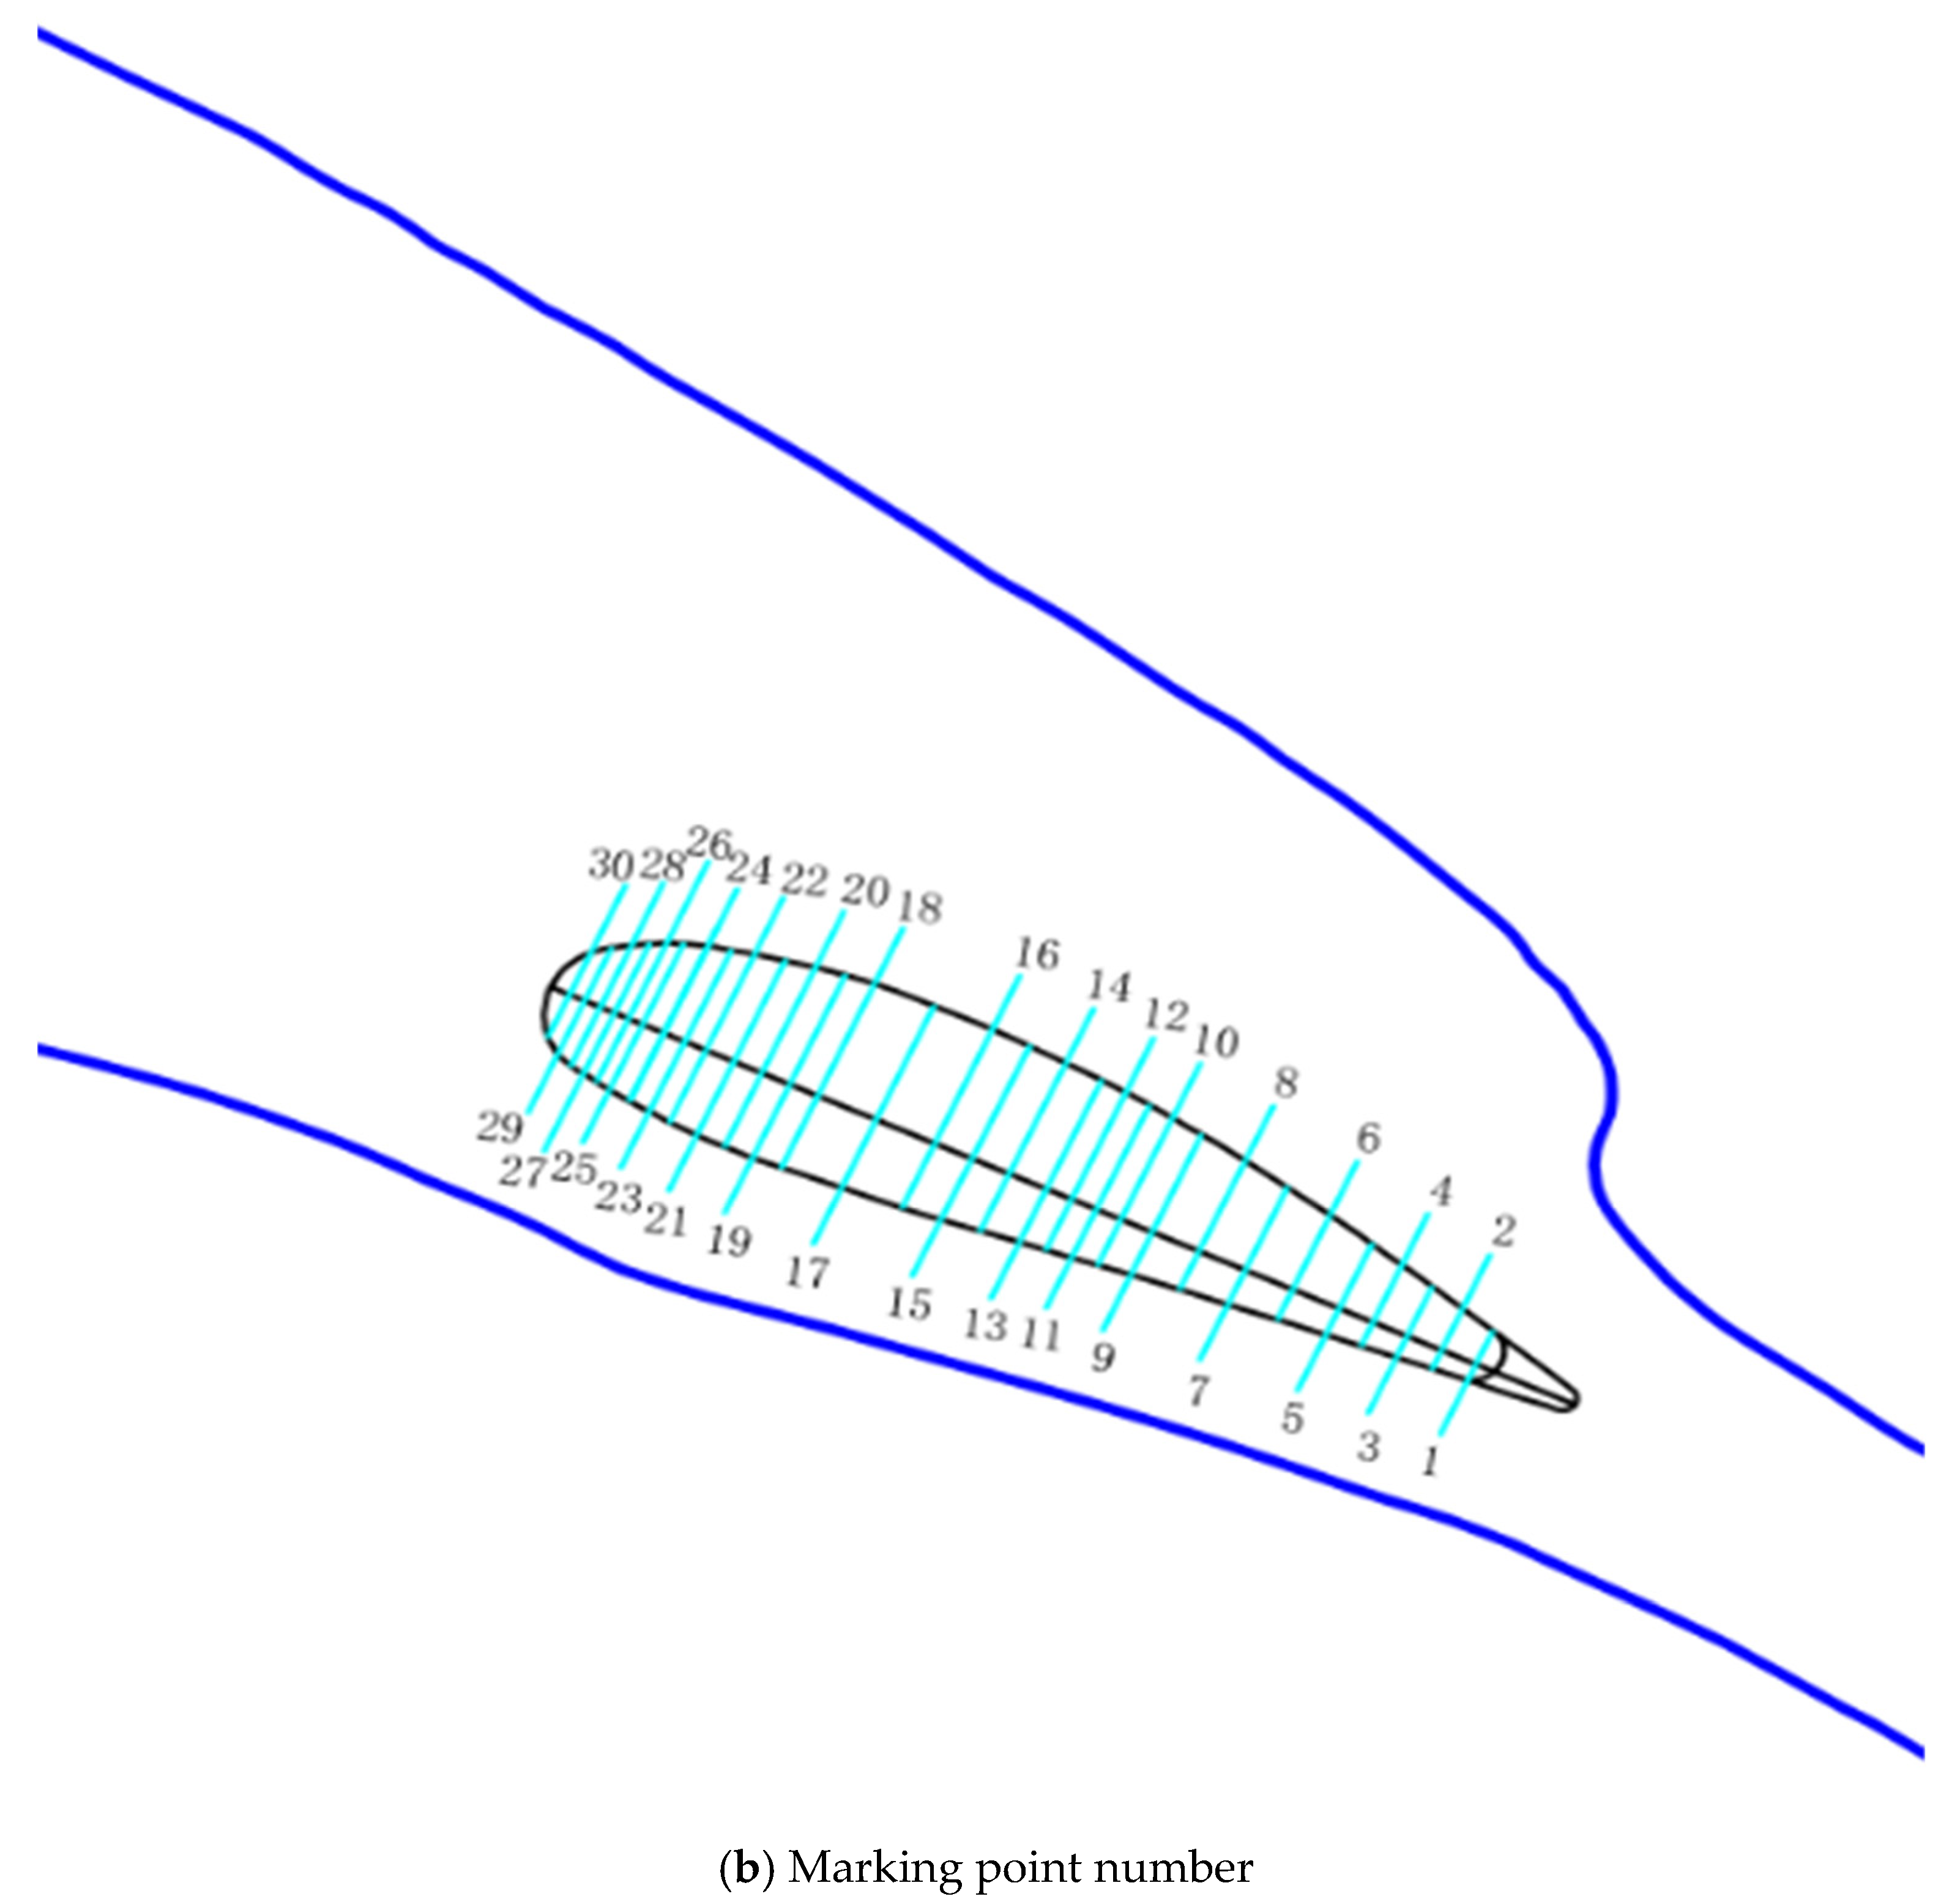
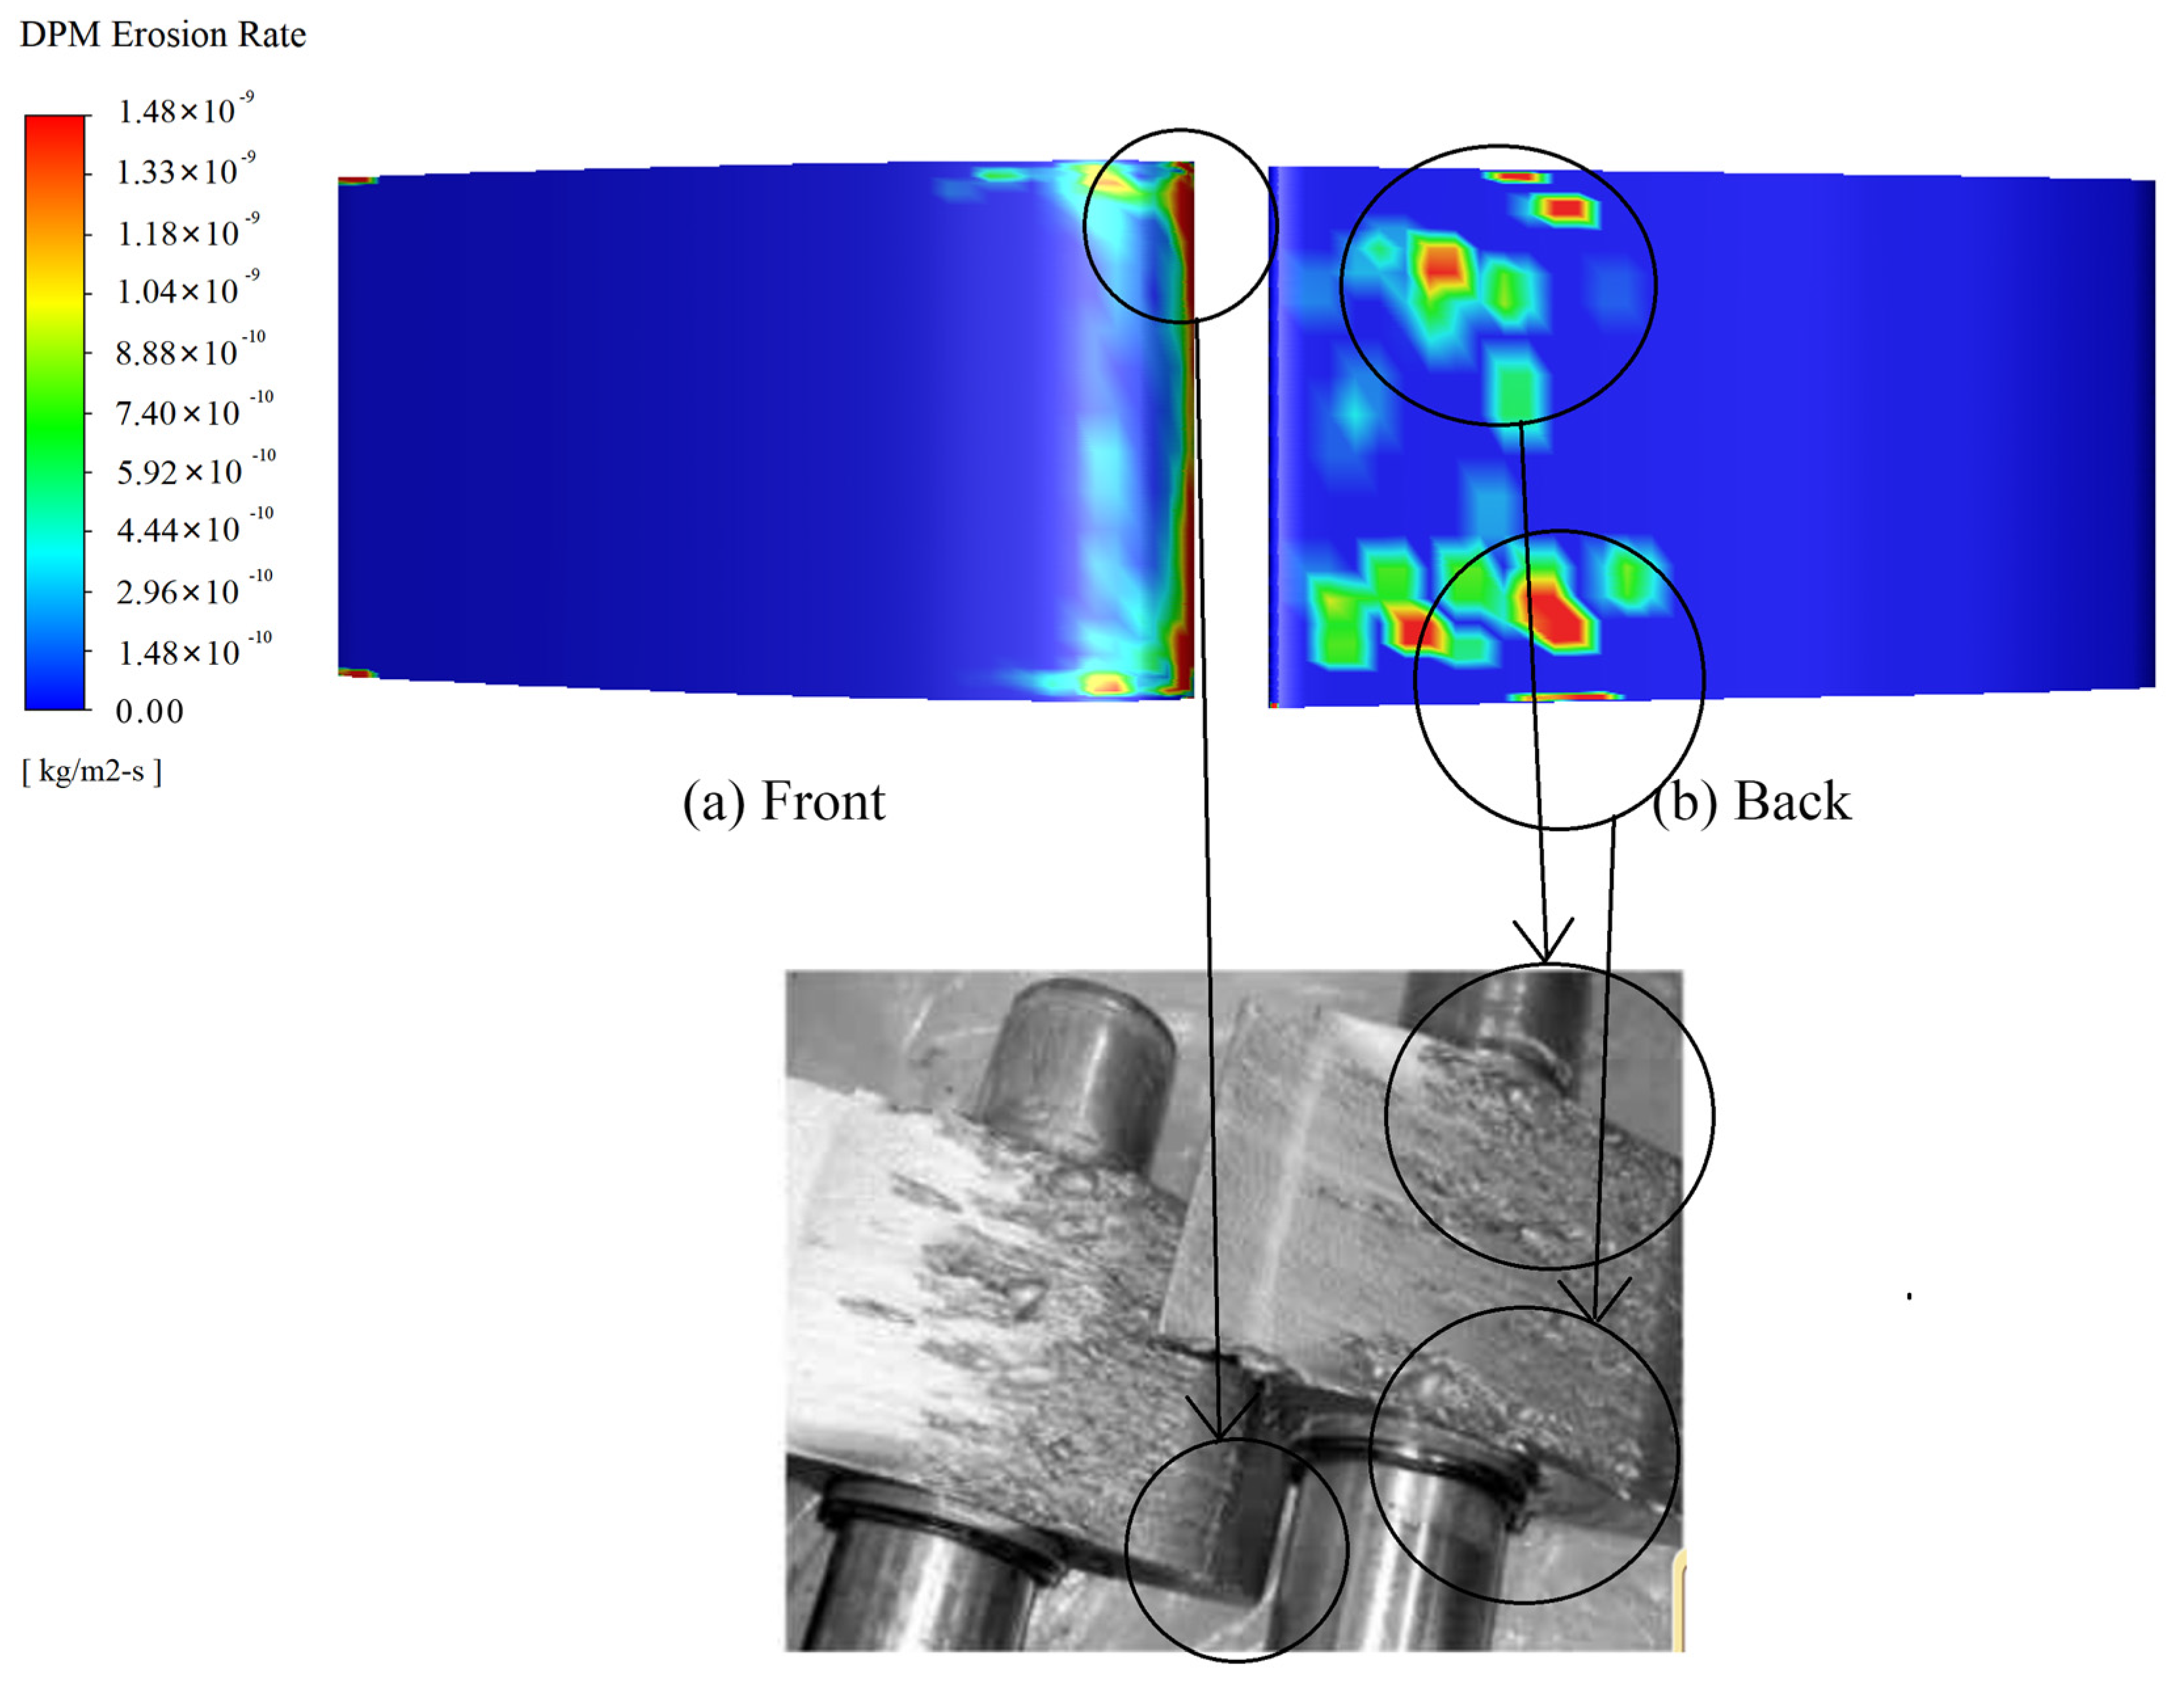
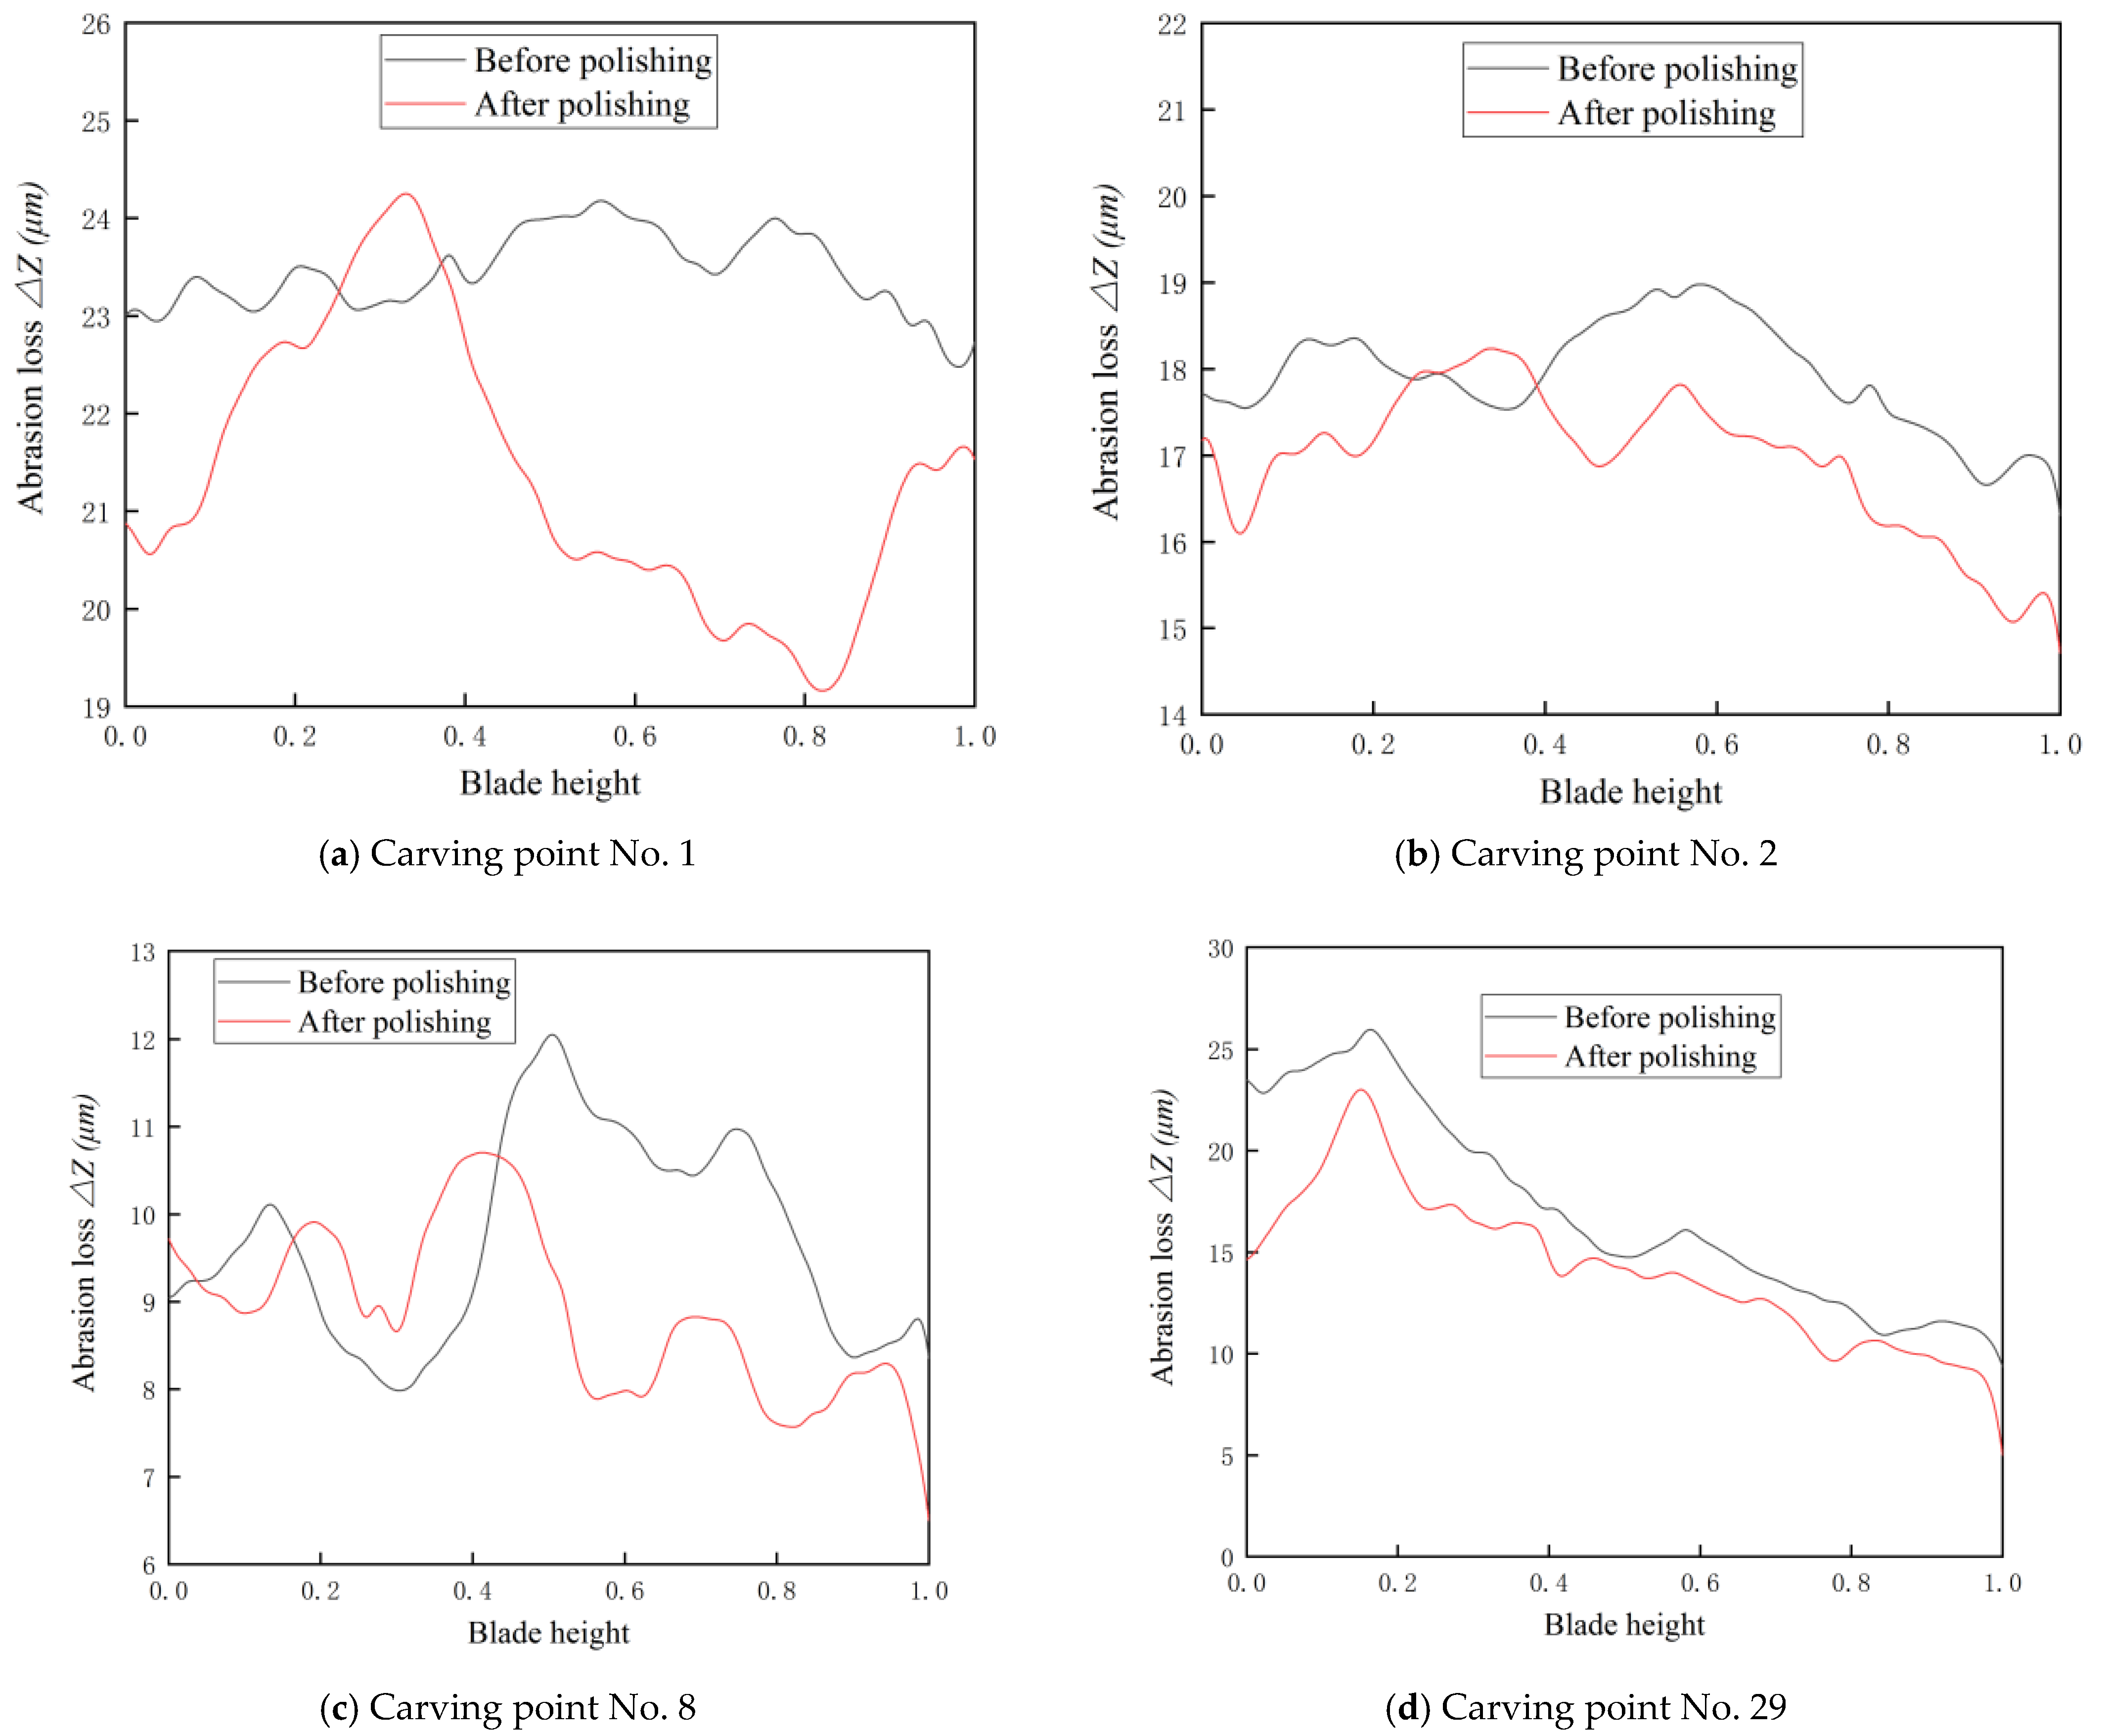
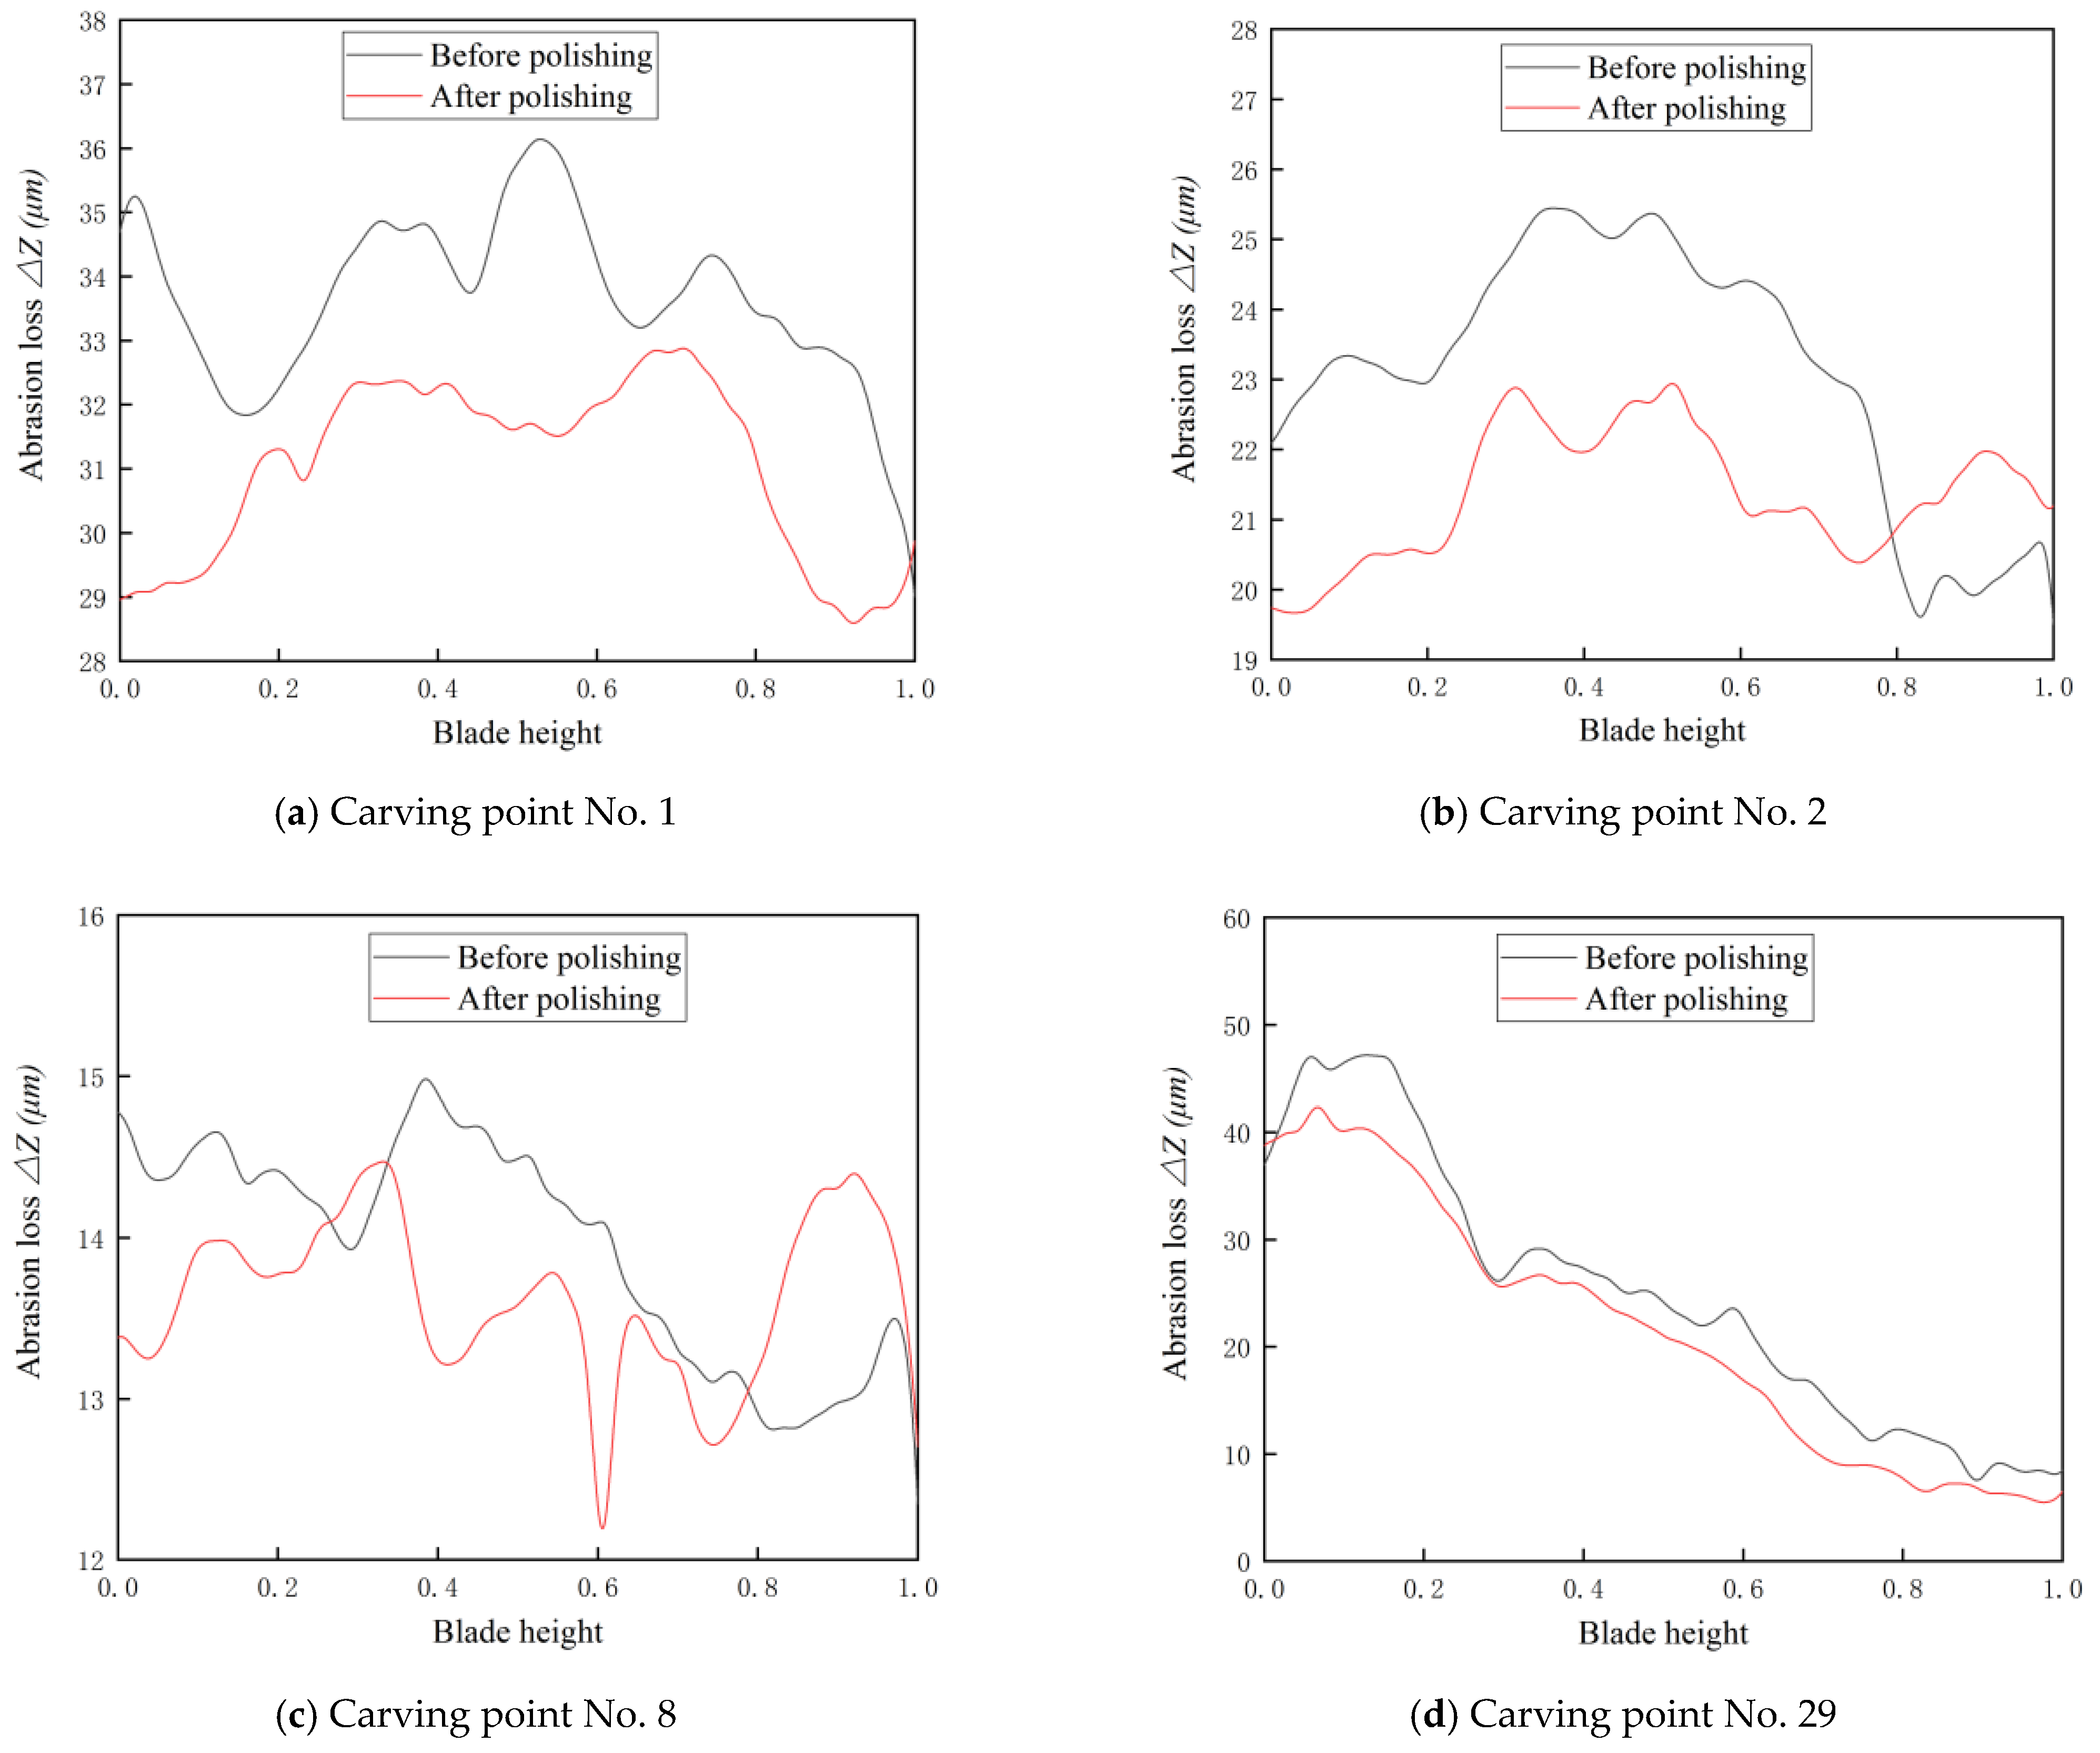
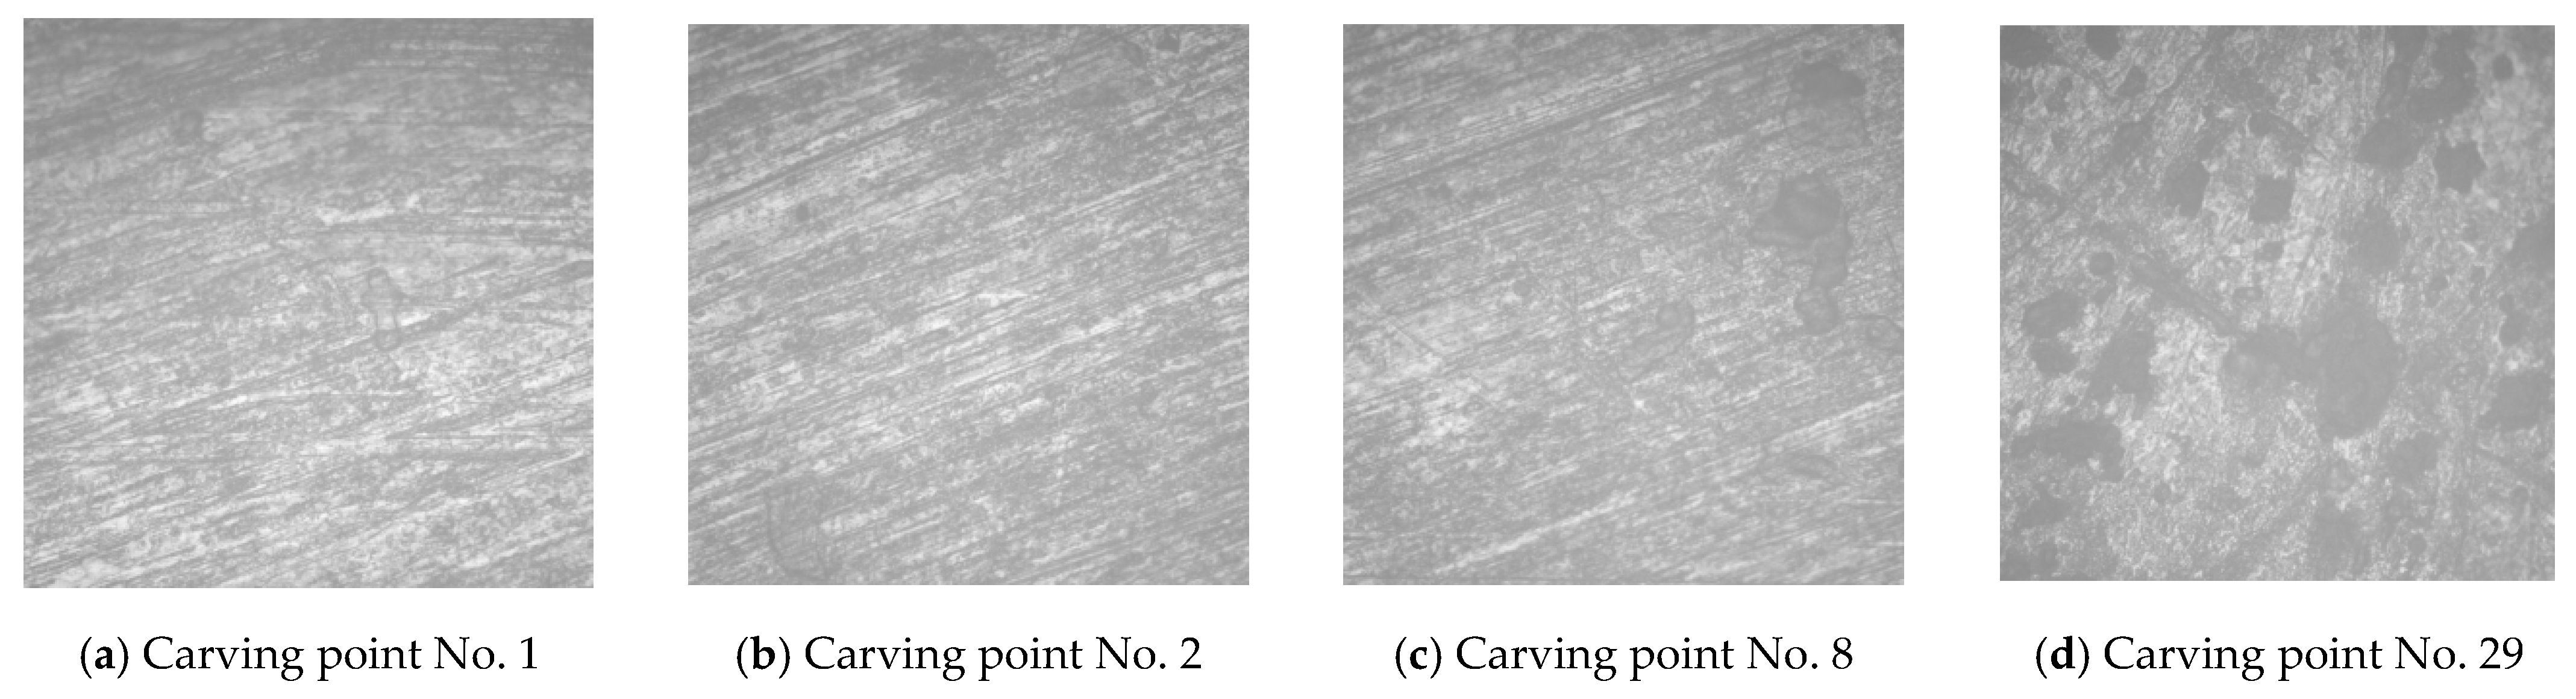
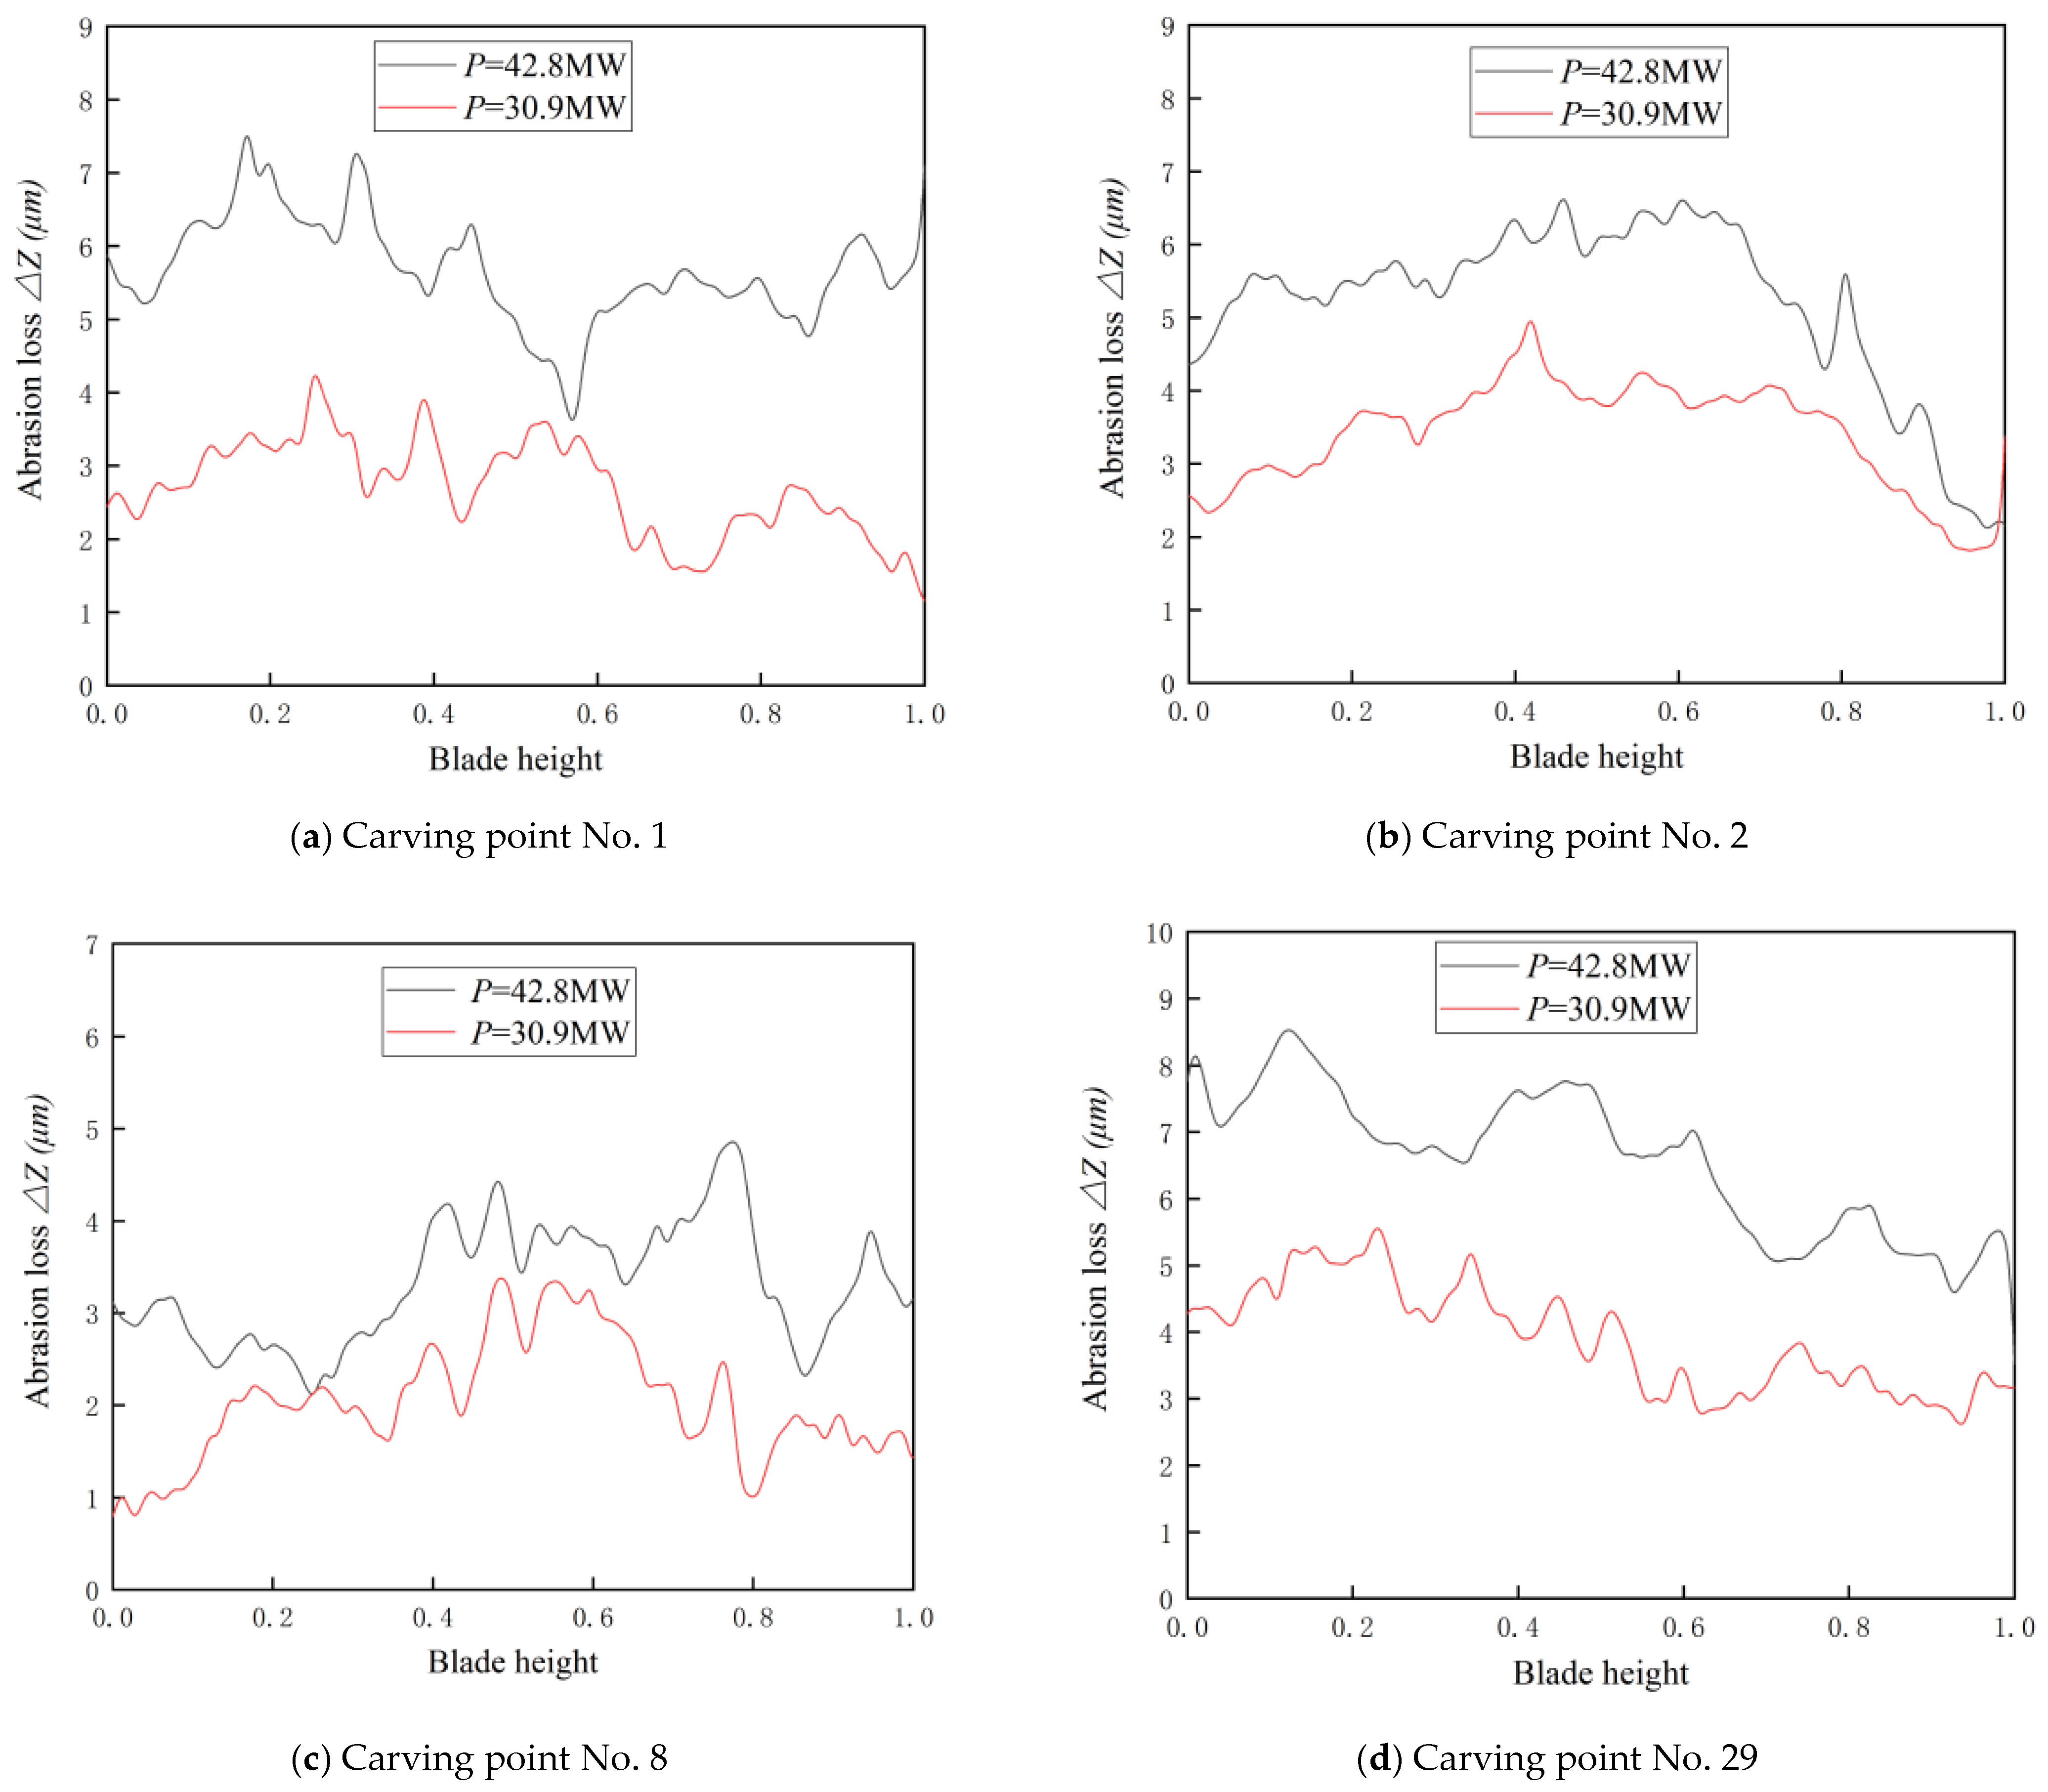
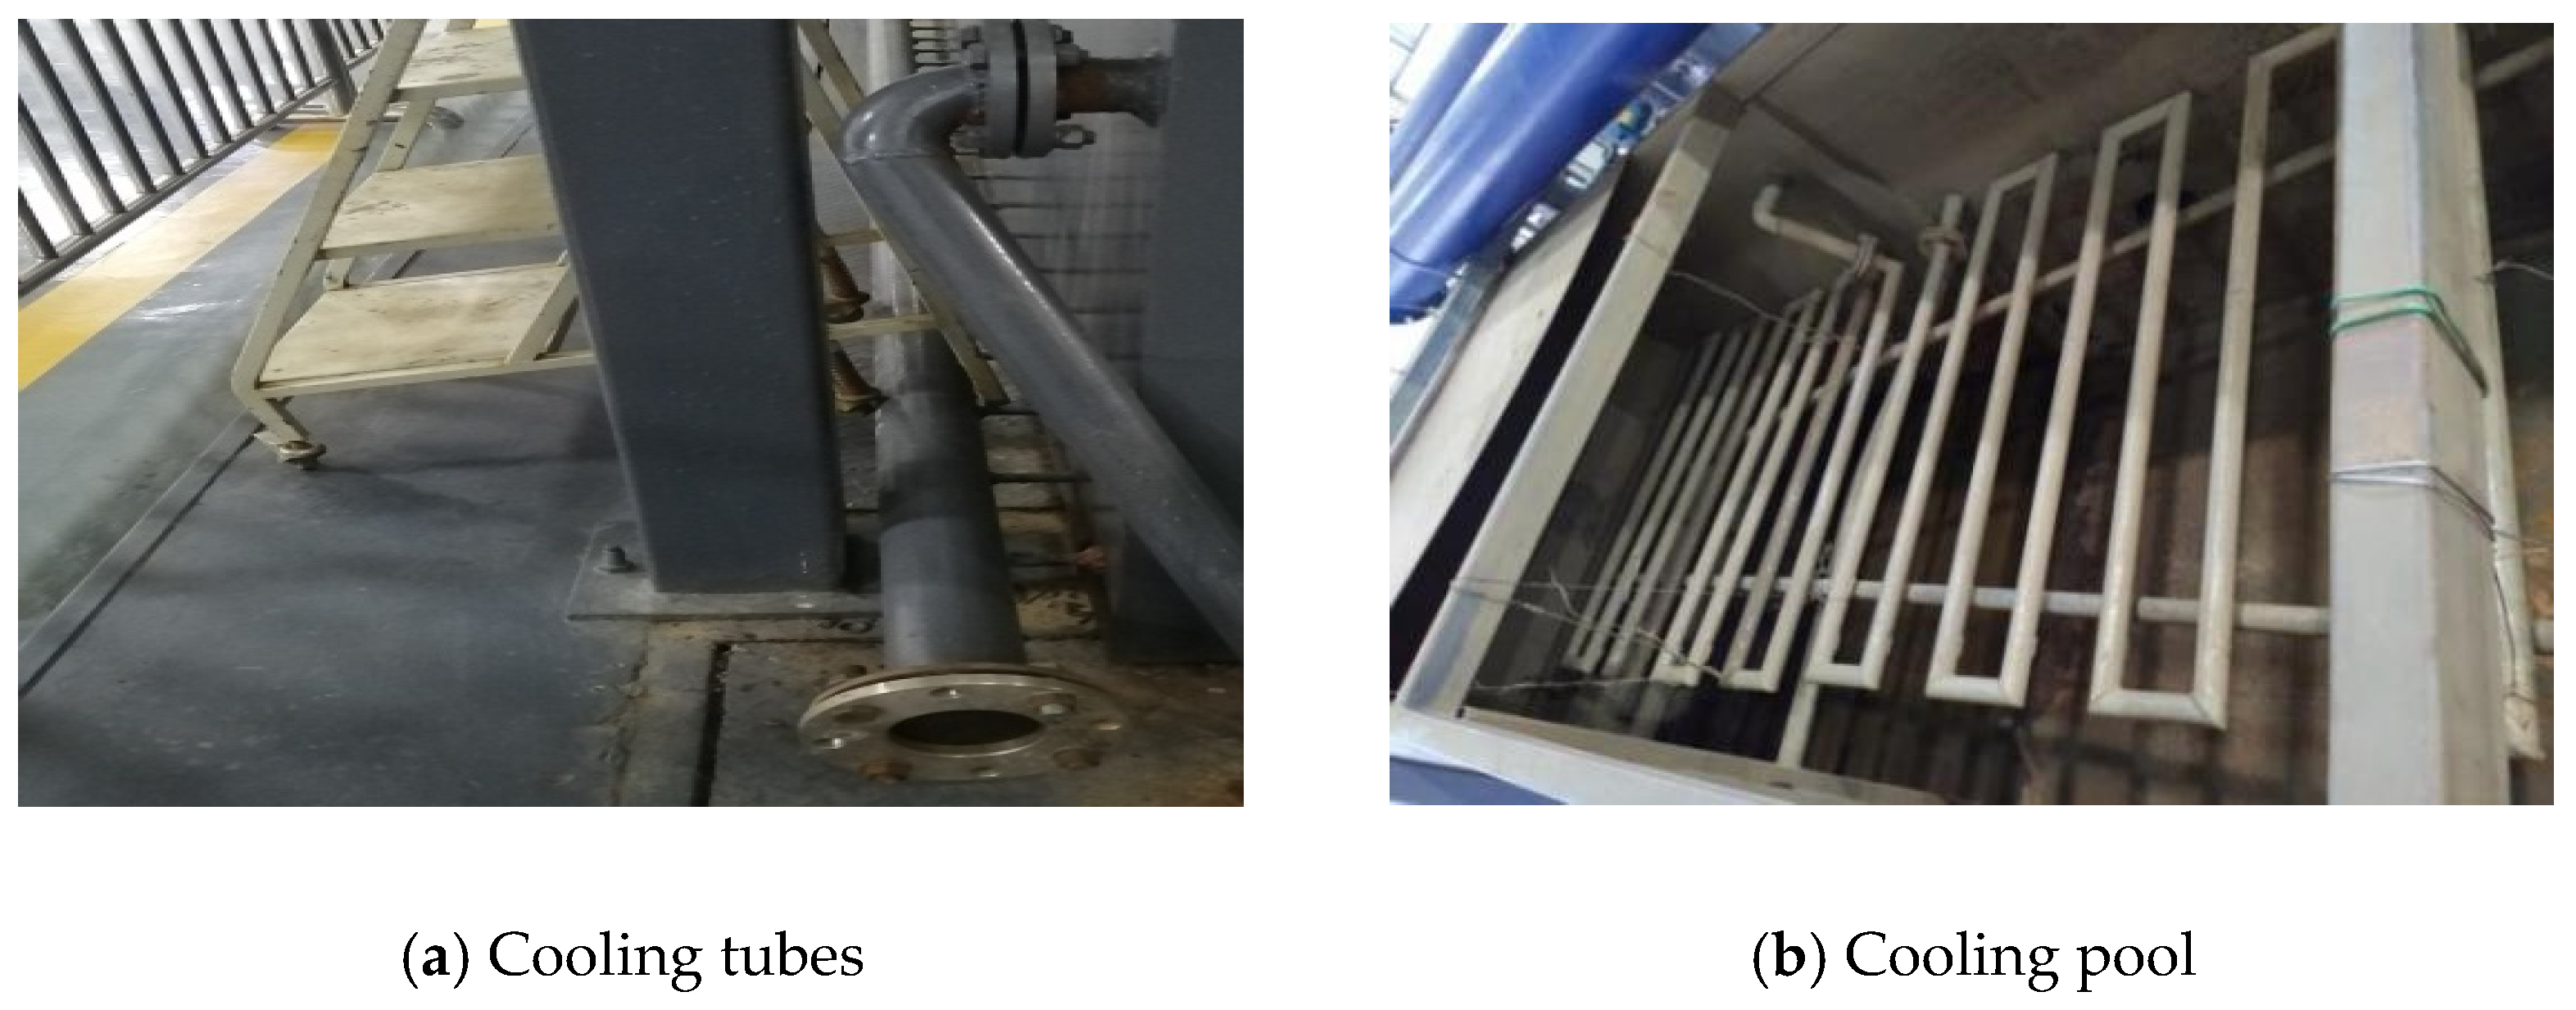
  • By setting up a bypass test bench to restore the flow situation of the over-flow components of the power station, the test bench was built by using reverse engineering, and the more serious wear was obtained at the back of the guide vane at 1, 2, 8 and 29 engraved points according to the simulation, and the specific study of these four engraved points was carried out.
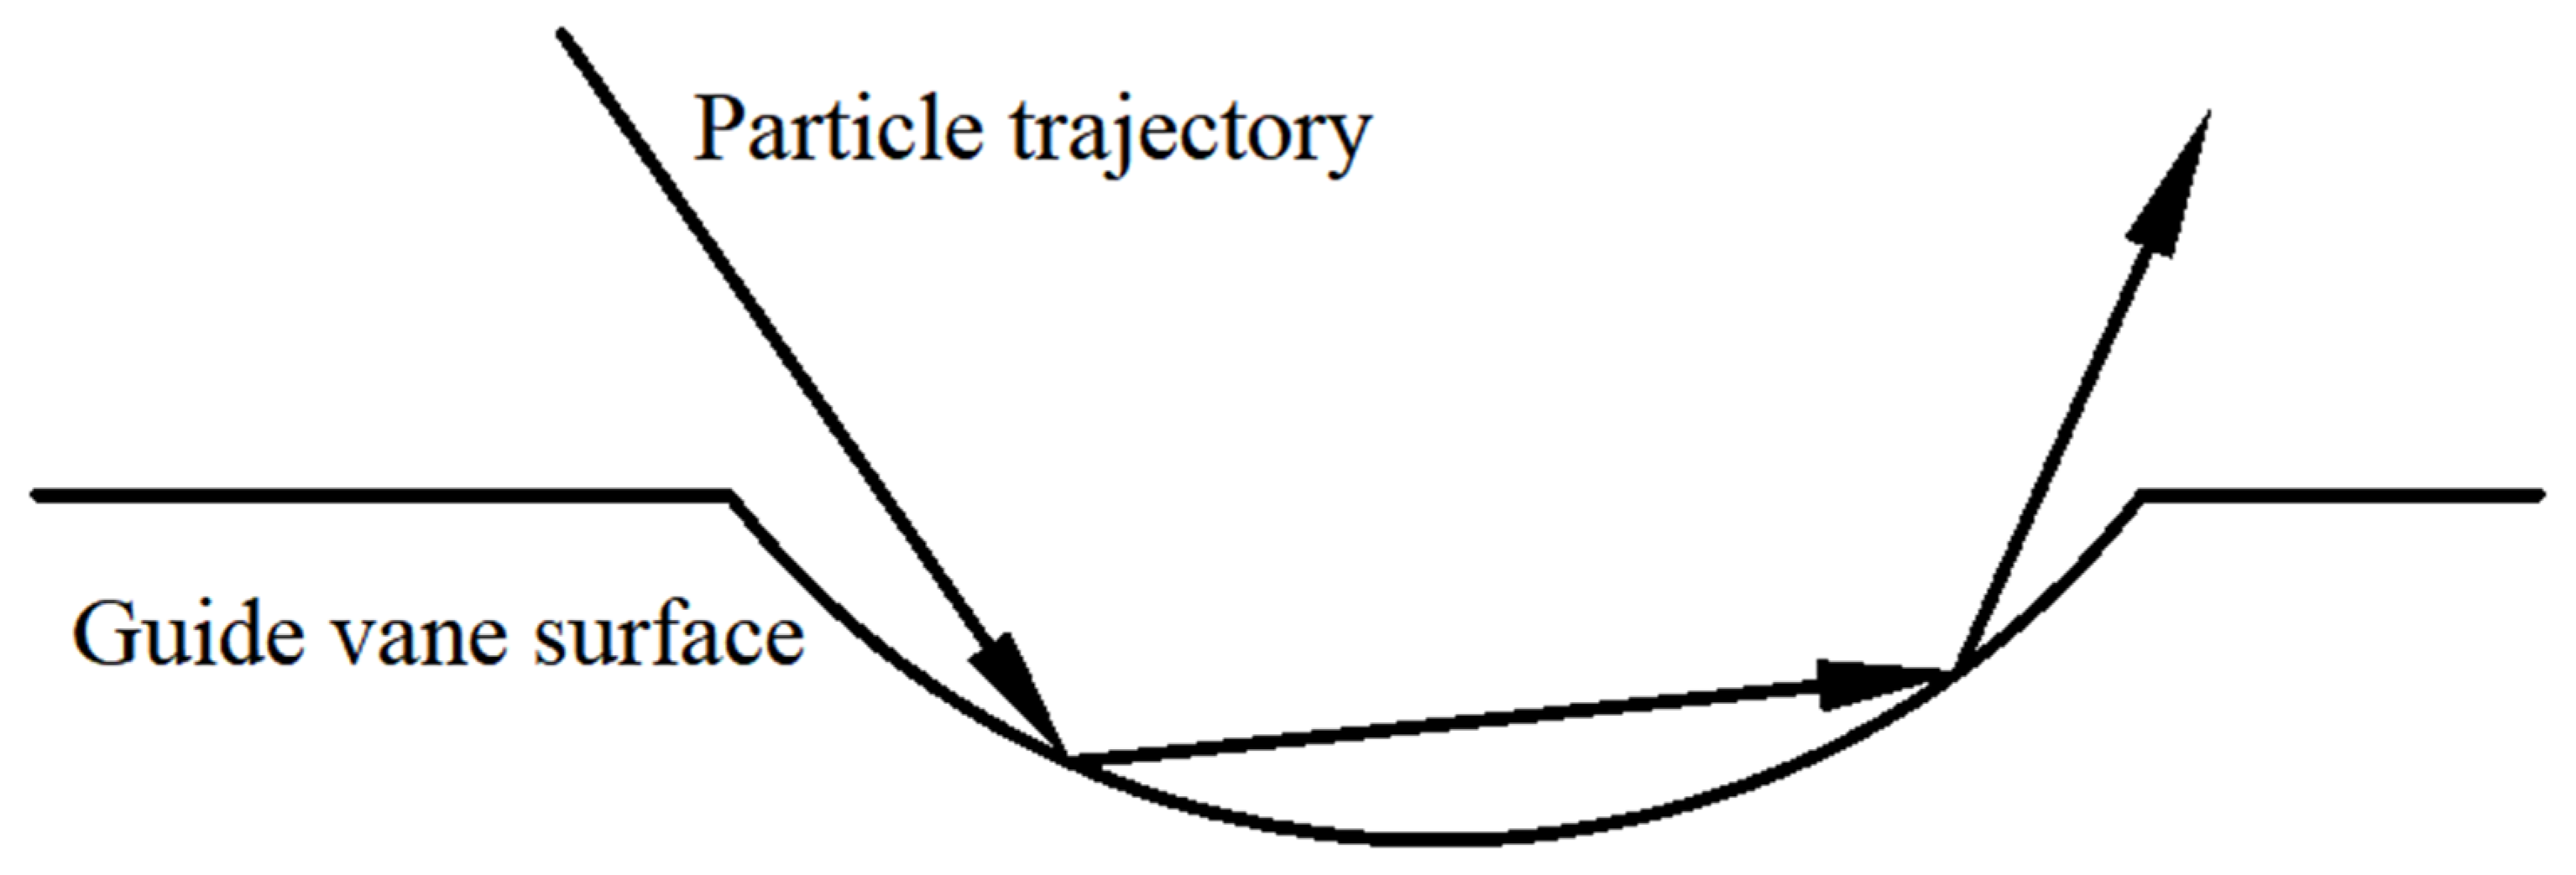
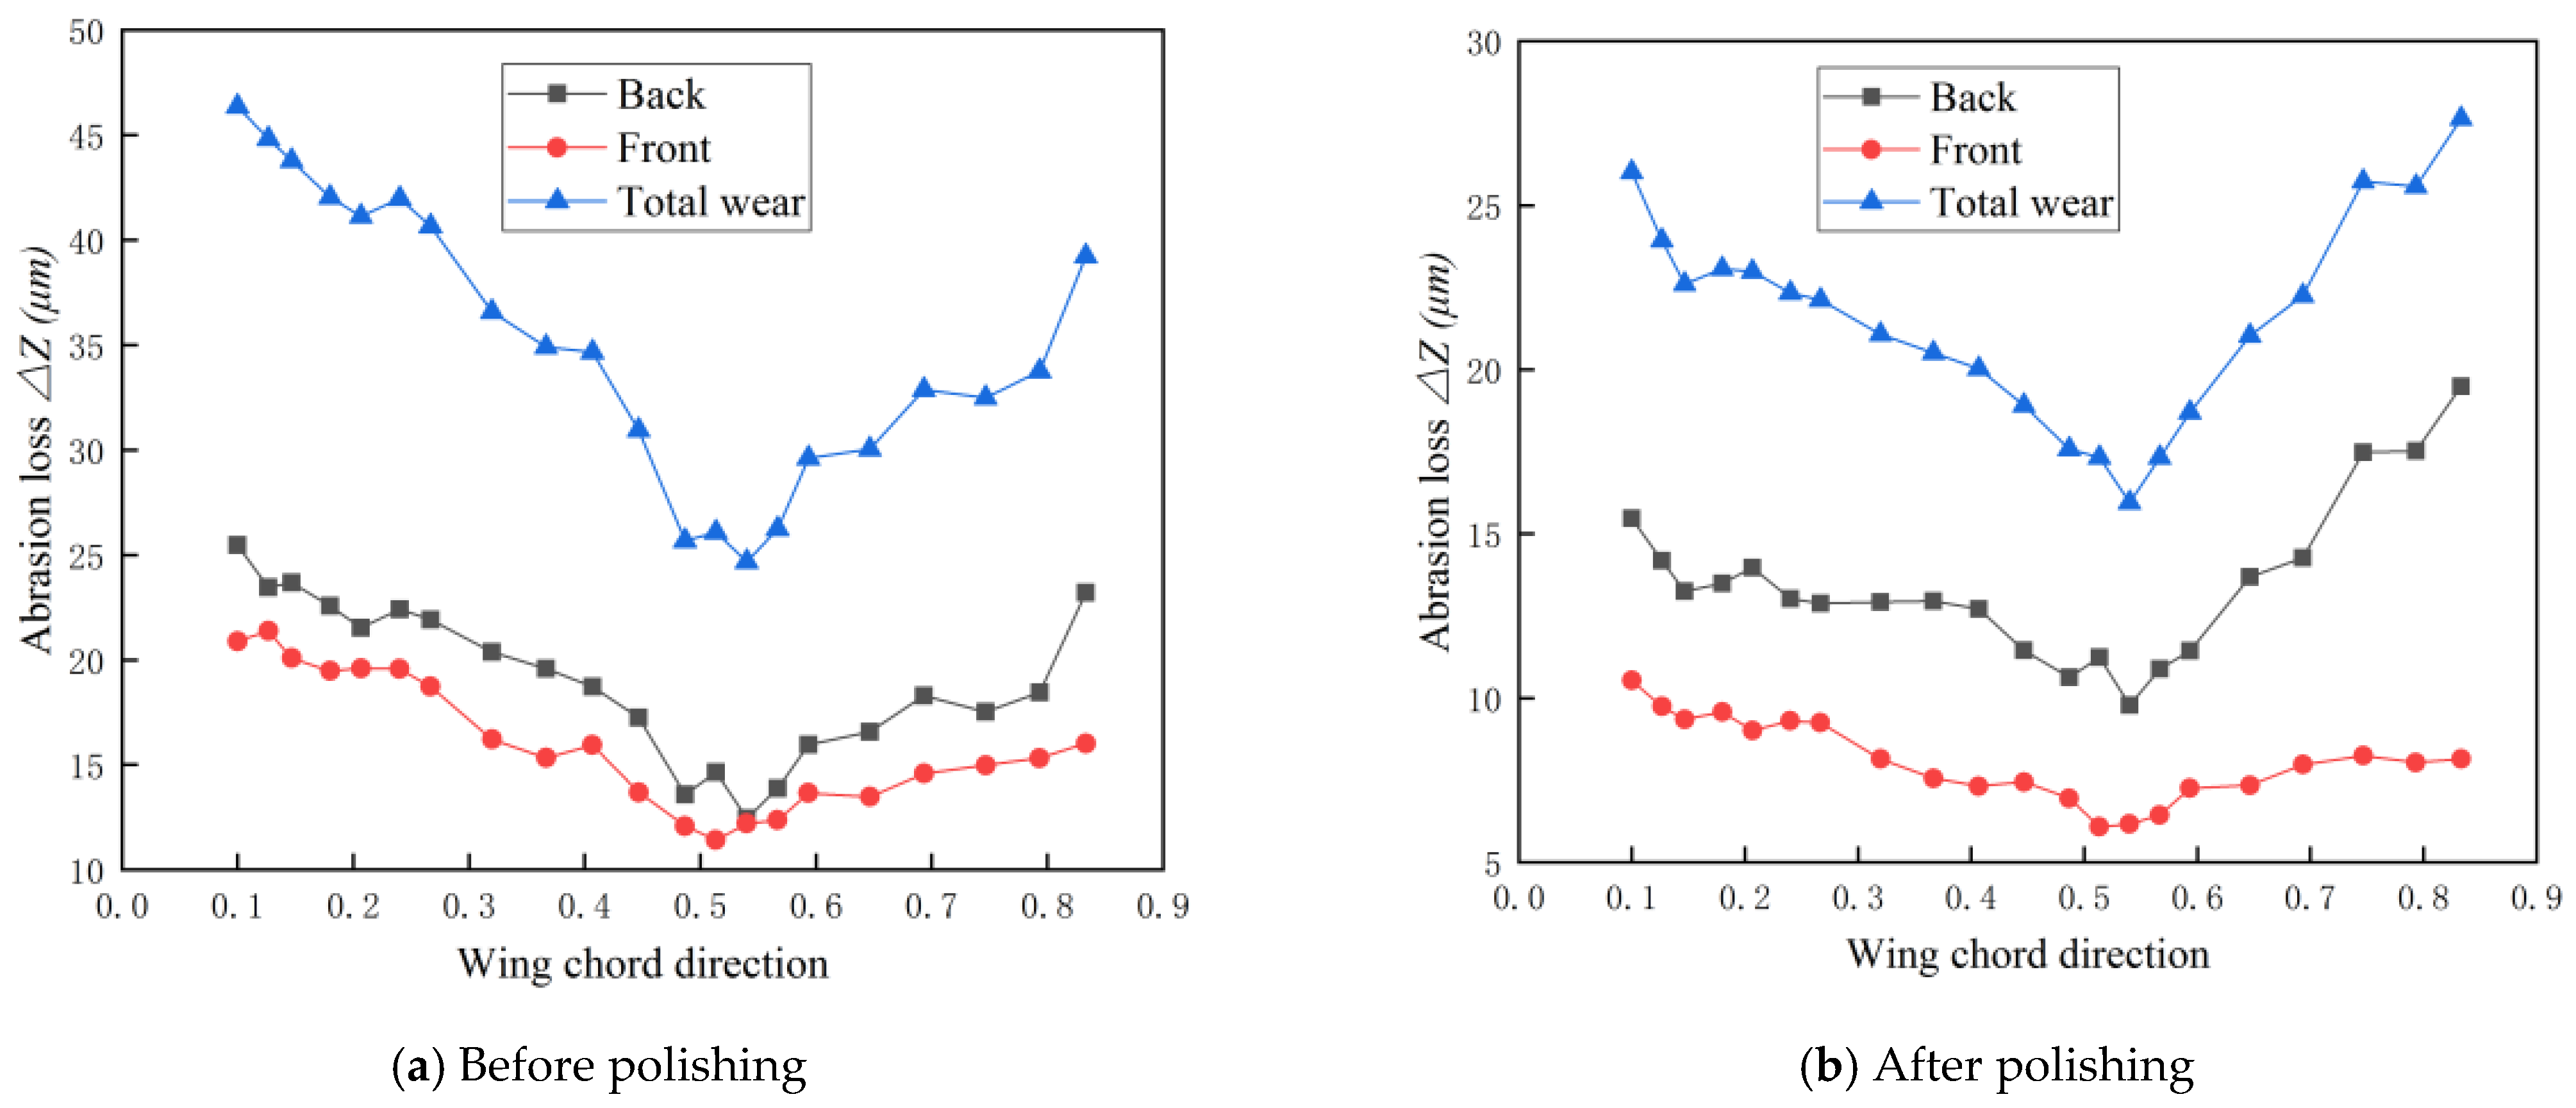
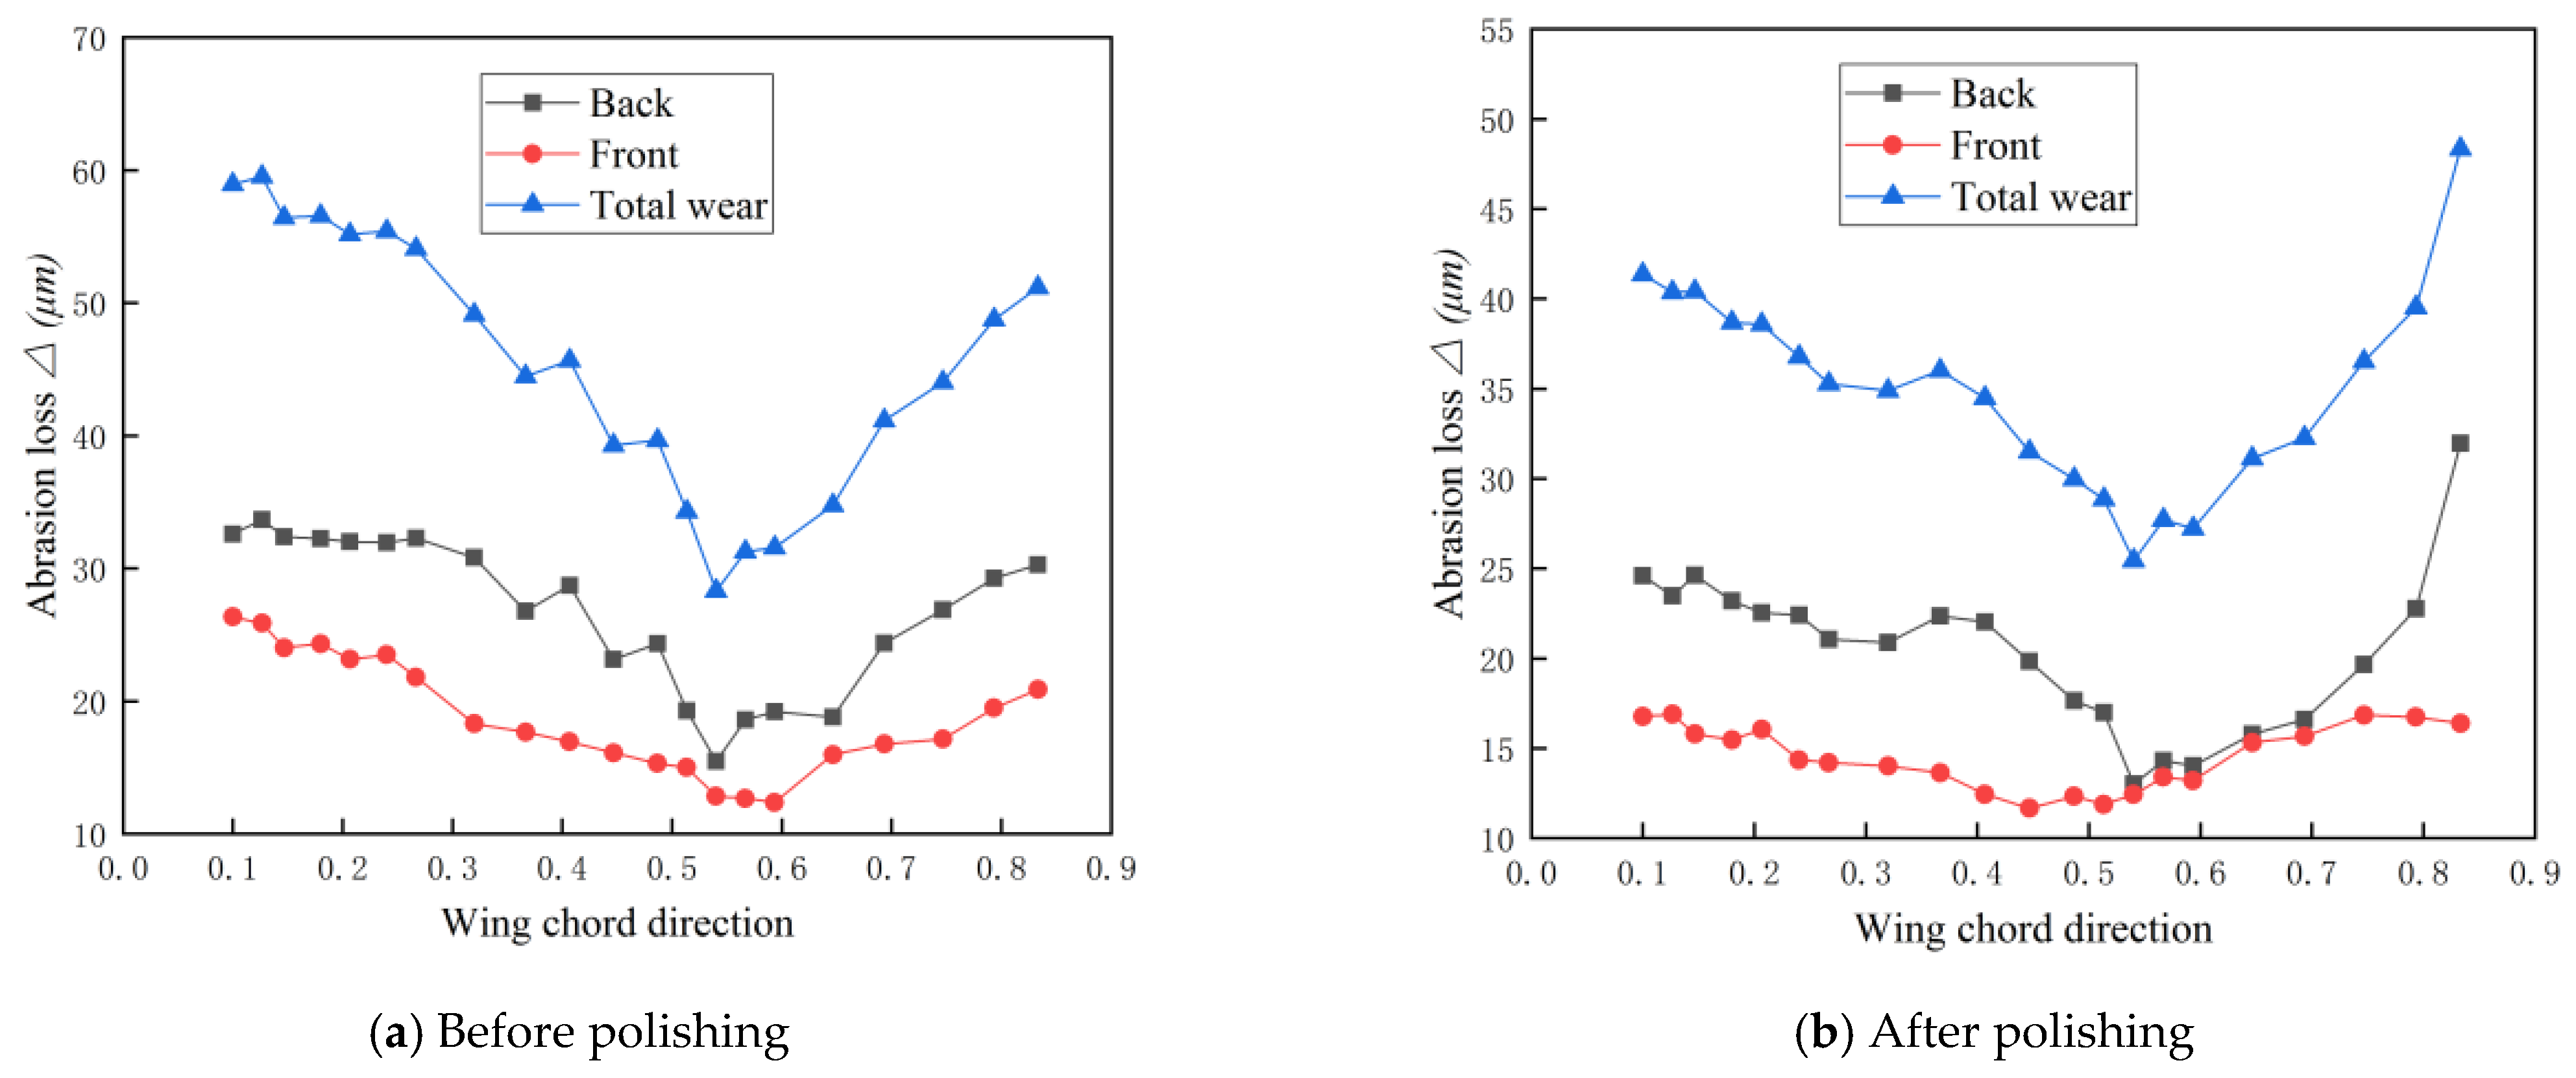
  • The roughness of the guide vane specimen was measured by 3D morphometer. Comparing the wear amount of the guide vane with two kinds of roughness under two working conditions, we found that the guide vane head position is easy to be worn by the impact and collision of sediment particles, and the tail position is easily worn by the scouring of sediment particles.
  • In spraying a 0.3 mm tungsten carbide coating on the surface of the guide vane specimen and conducting the mud and sand abrasion experiment, we found that the guide vane is subject to increased mud and sand abrasion performance which is three to four times greater than that before spraying.
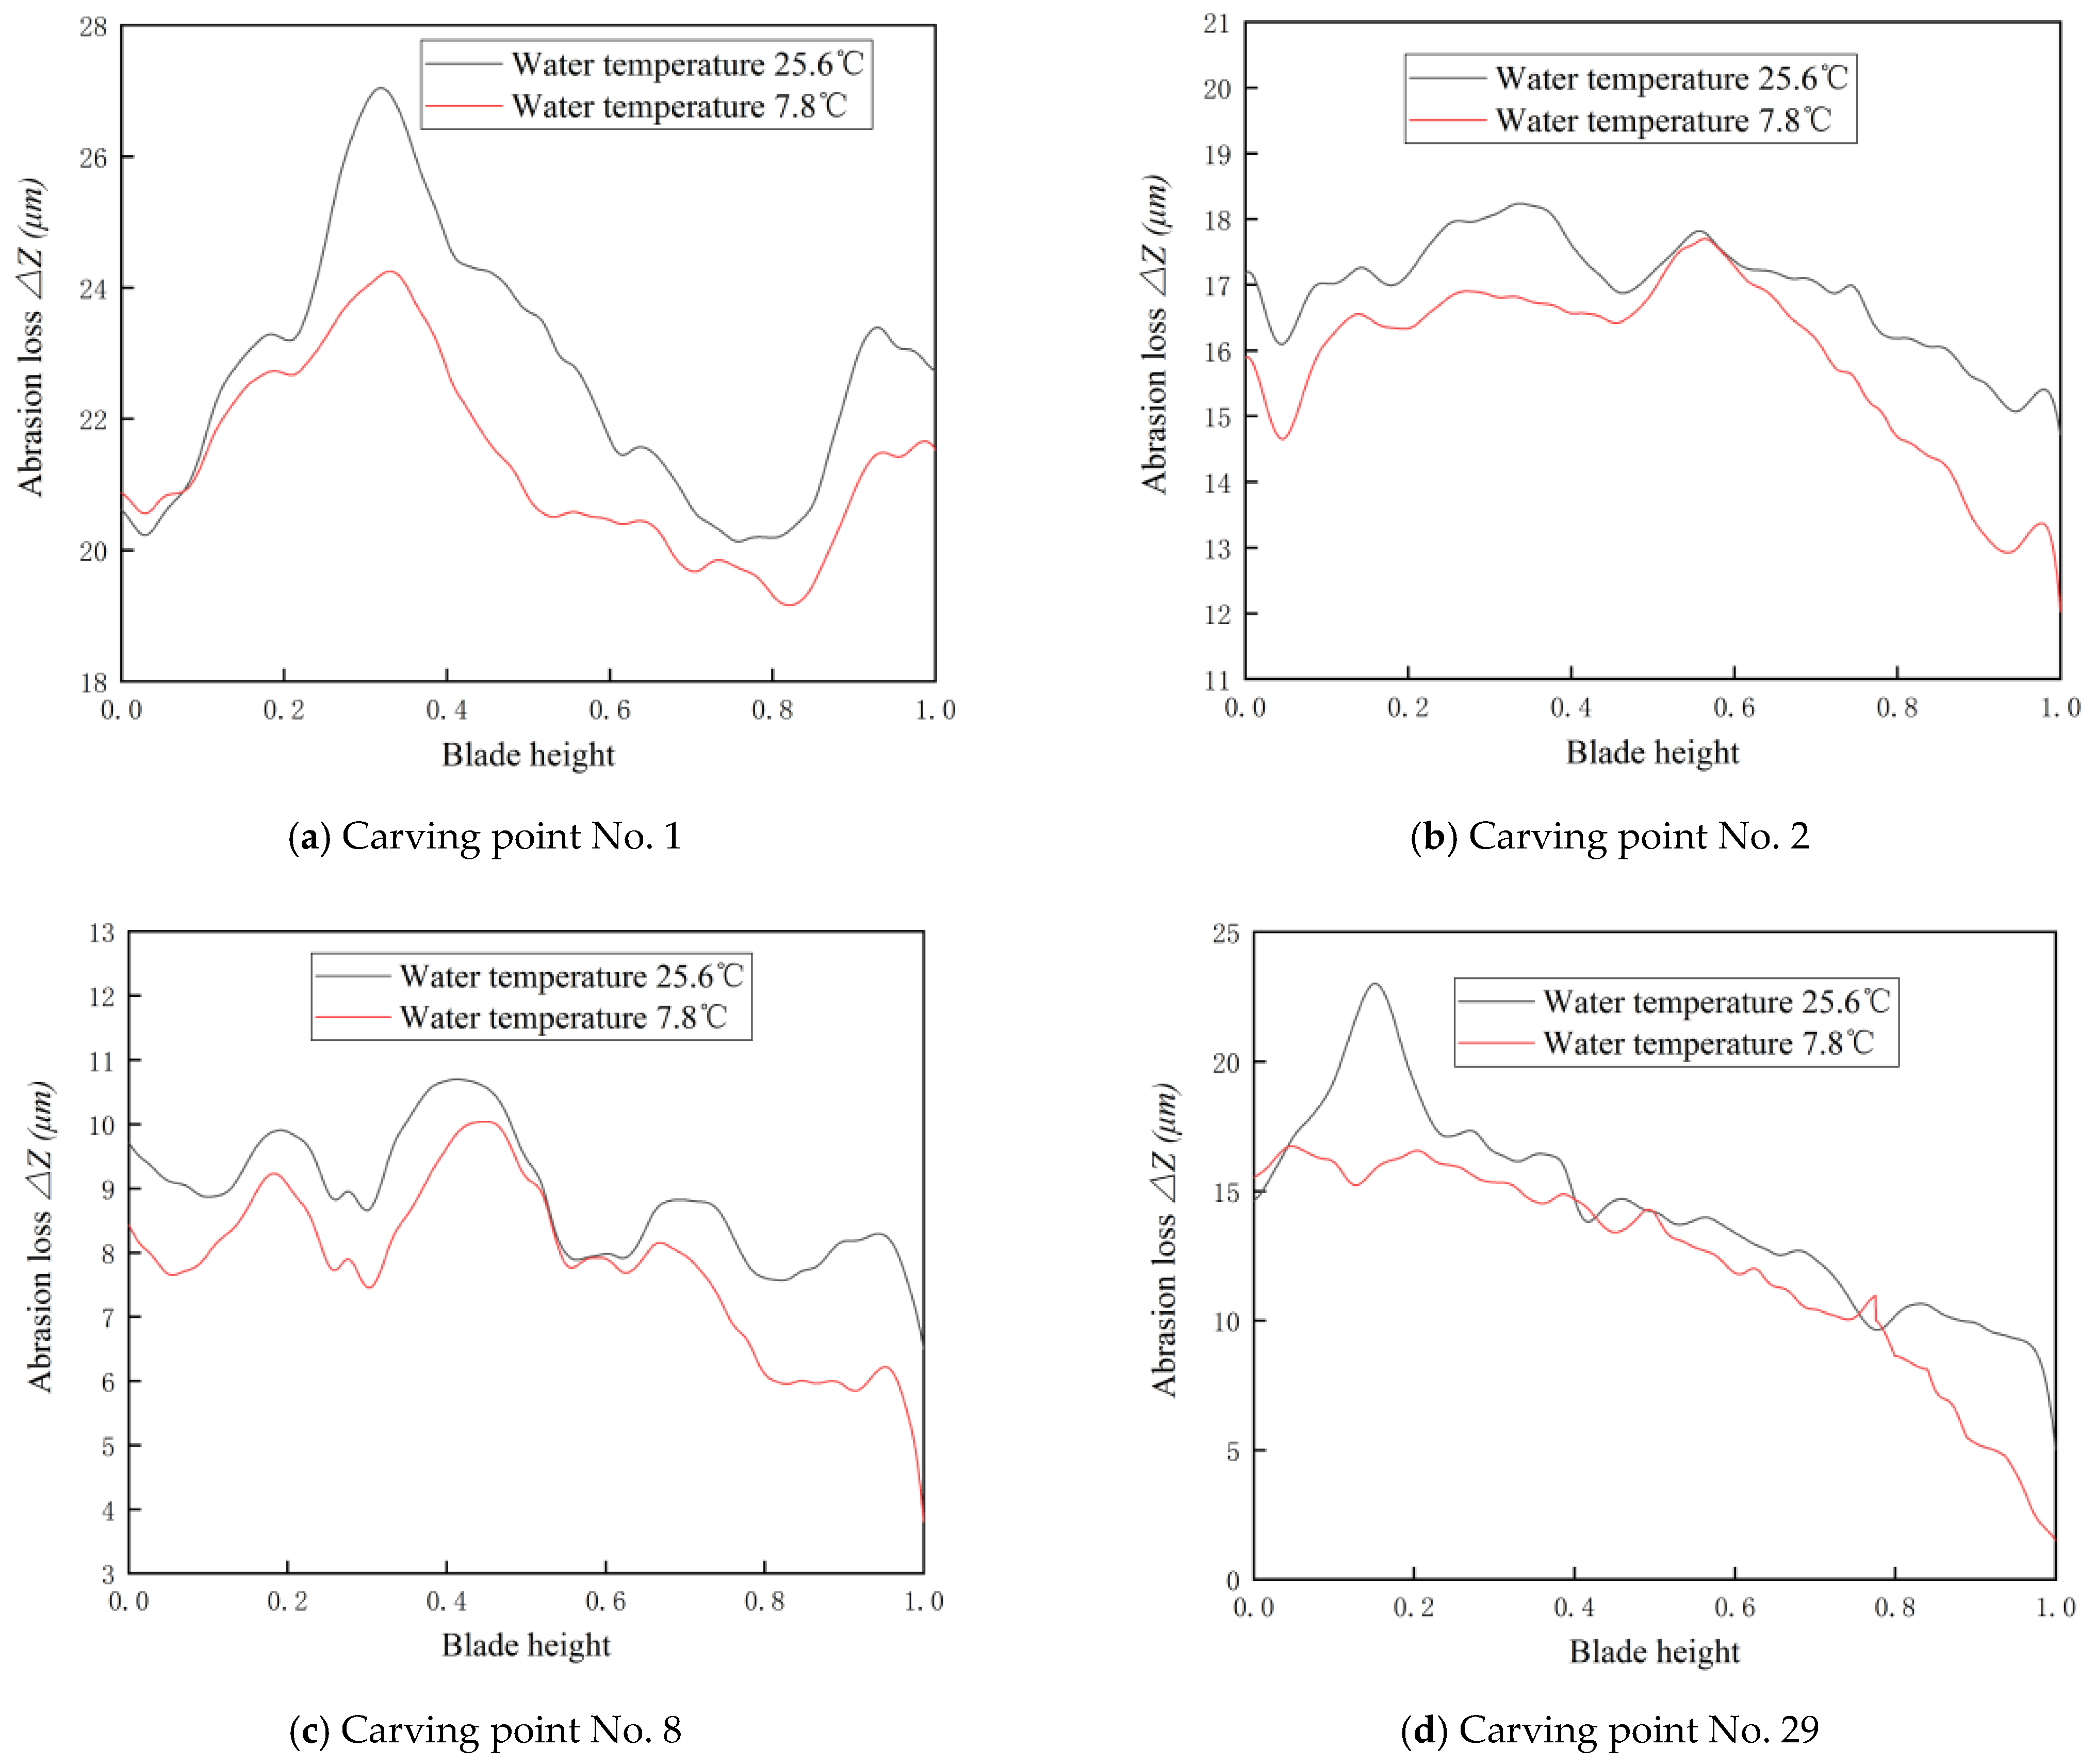
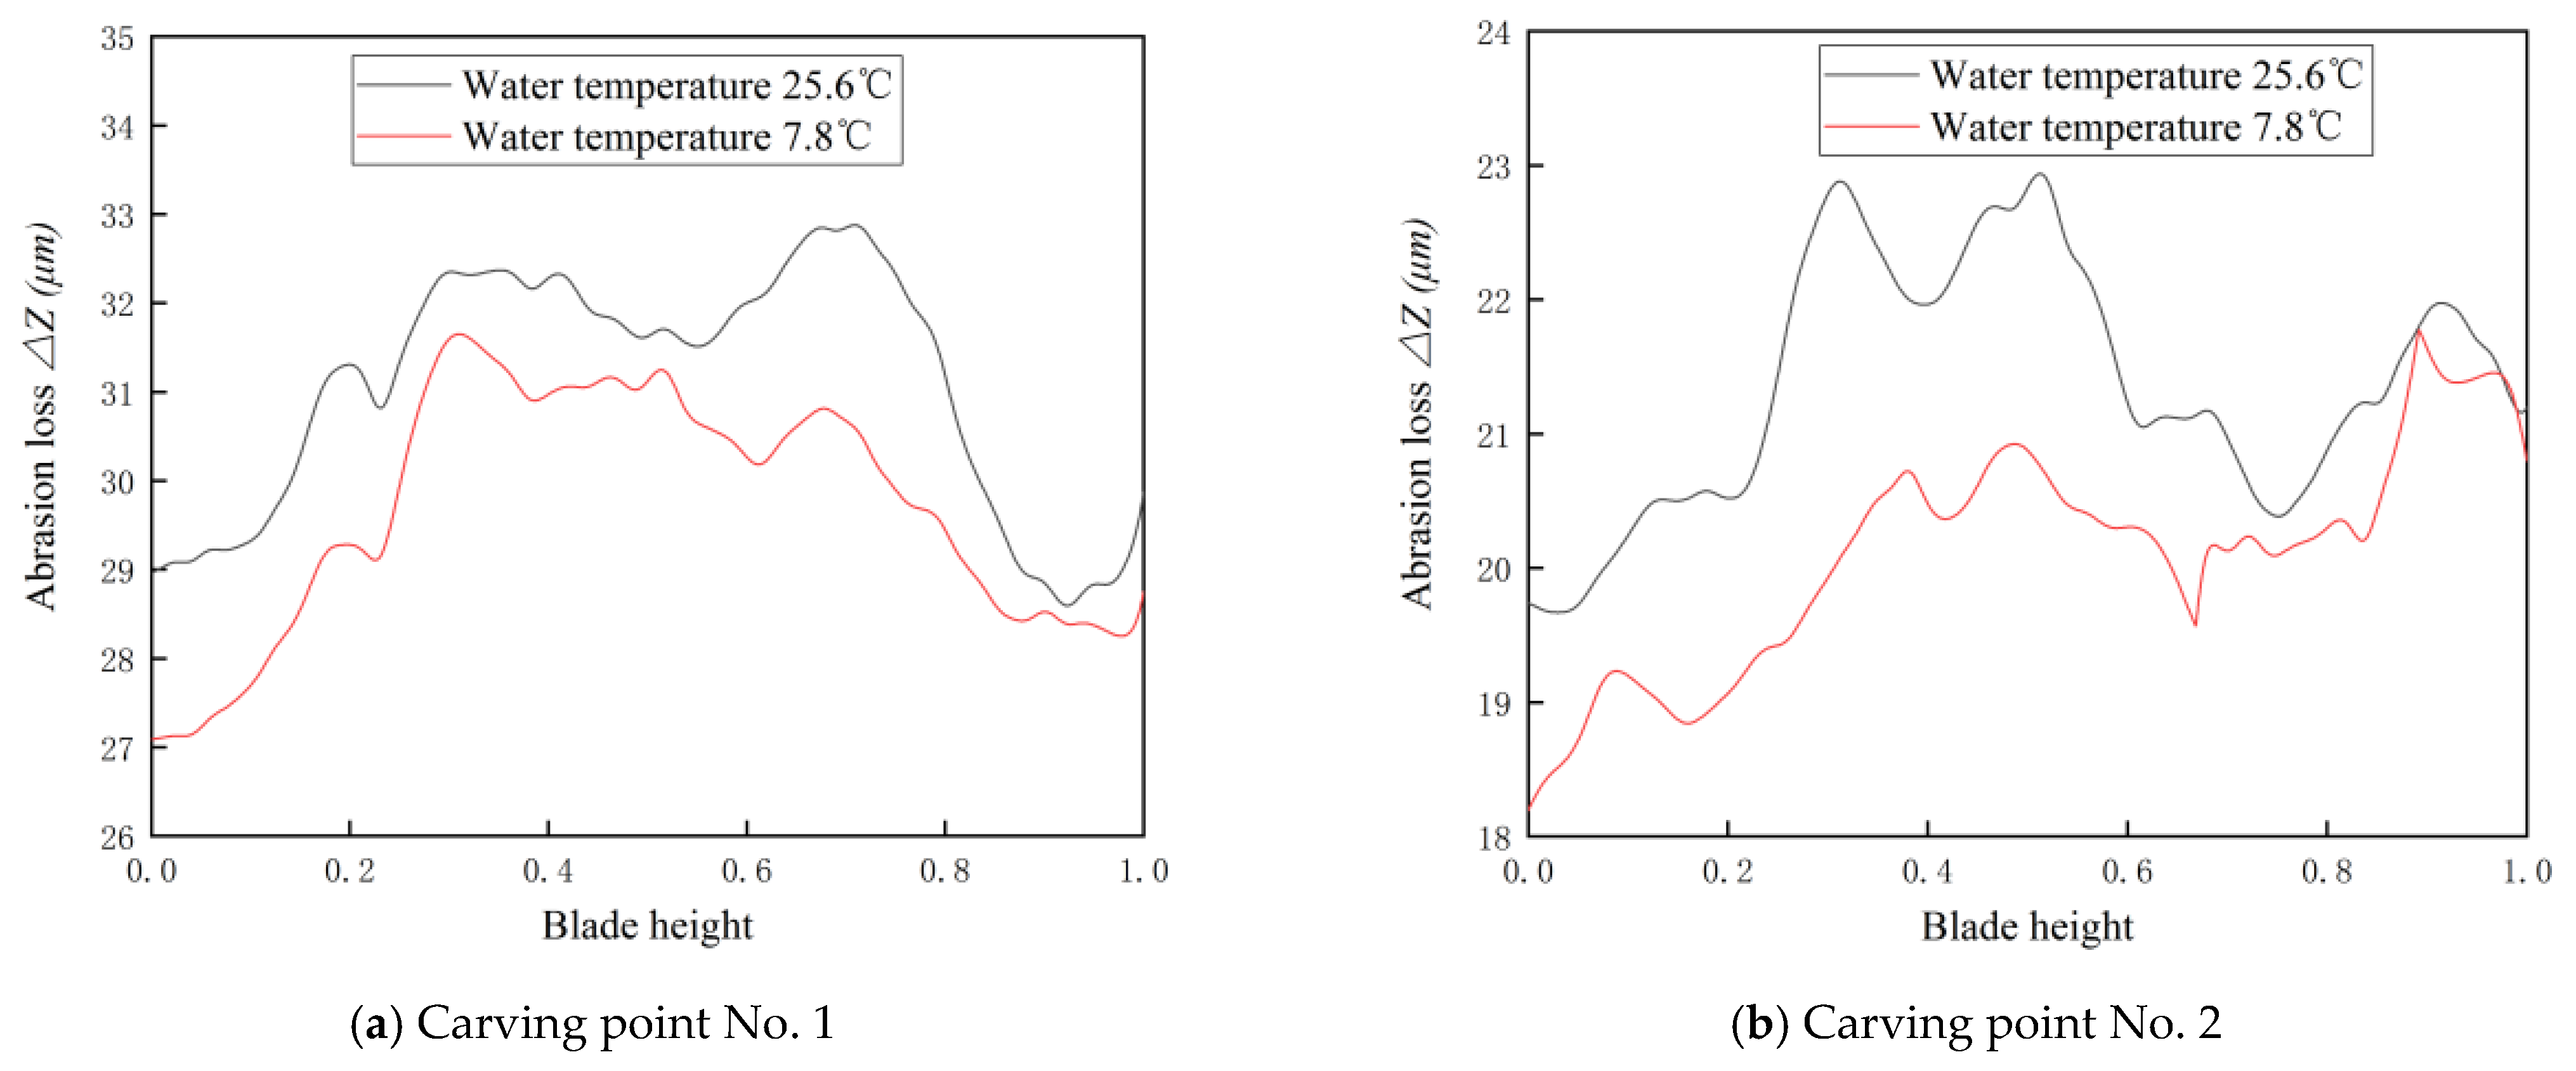
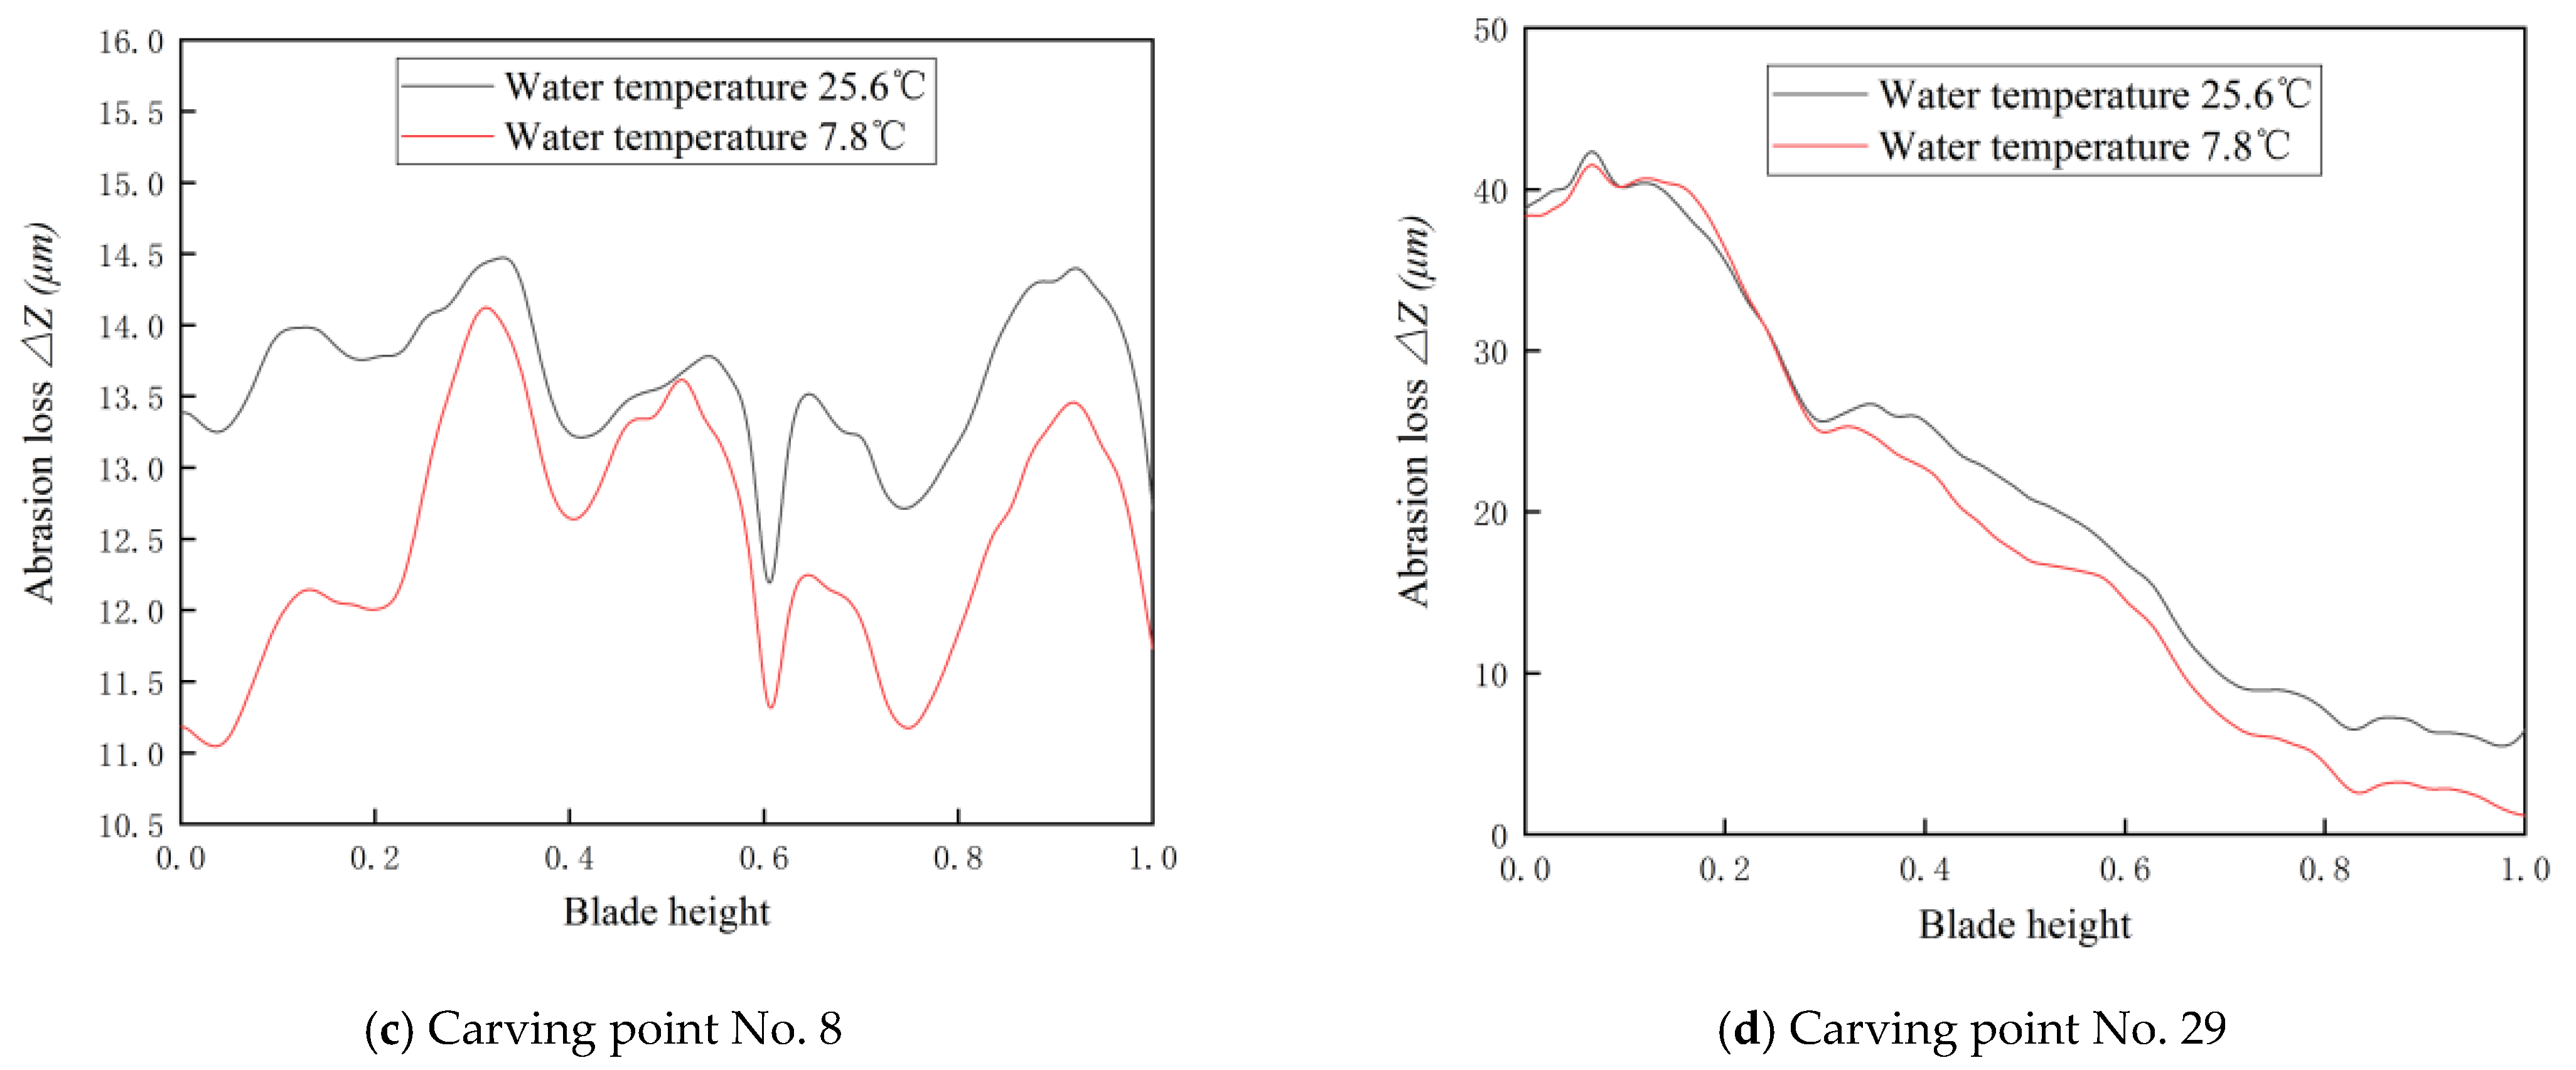
  • The average pH value of the water body measured in the power station is 6.73, and it was determined that the change of dissolved oxygen in the water body will affect the wear of the guide vane and the dissolved oxygen is susceptible to the change of the water body temperature. The test is conducted according to the simulation of the actual flood and dry water temperature in the power station, and the wear of the guide vane is more serious when the water temperature is 25.6 °C than when the water temperature is 7.8 °C.
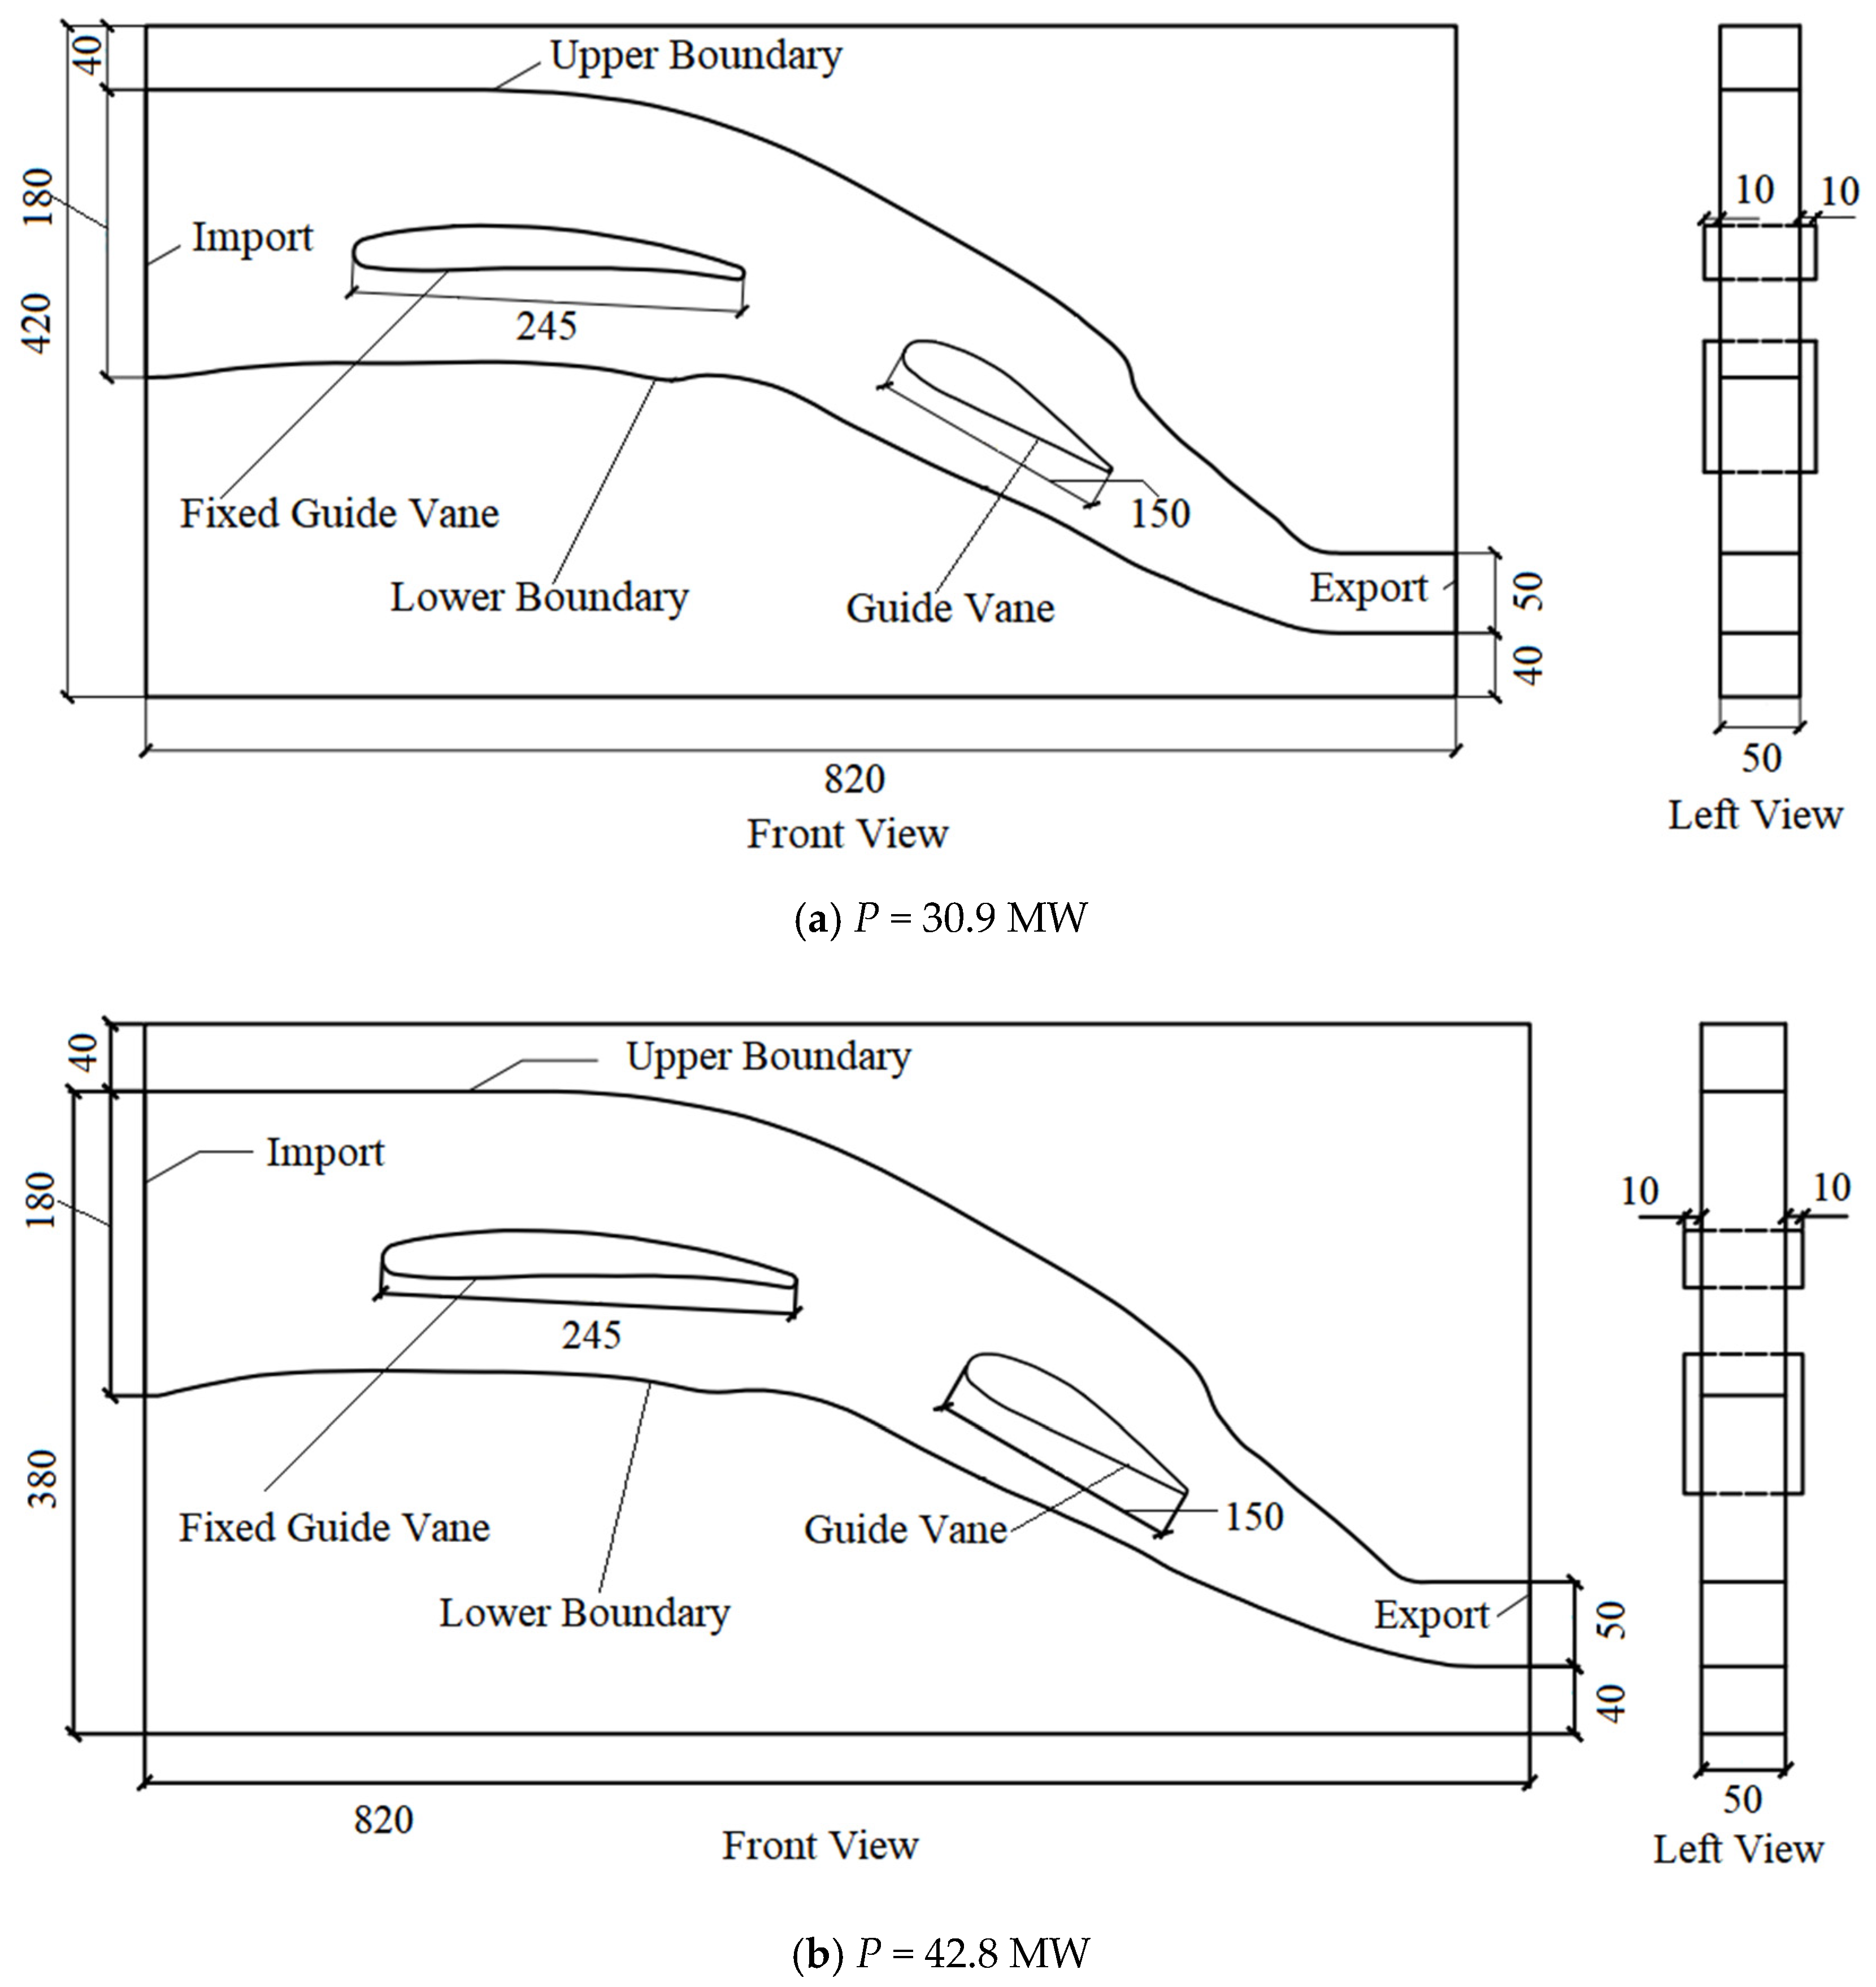
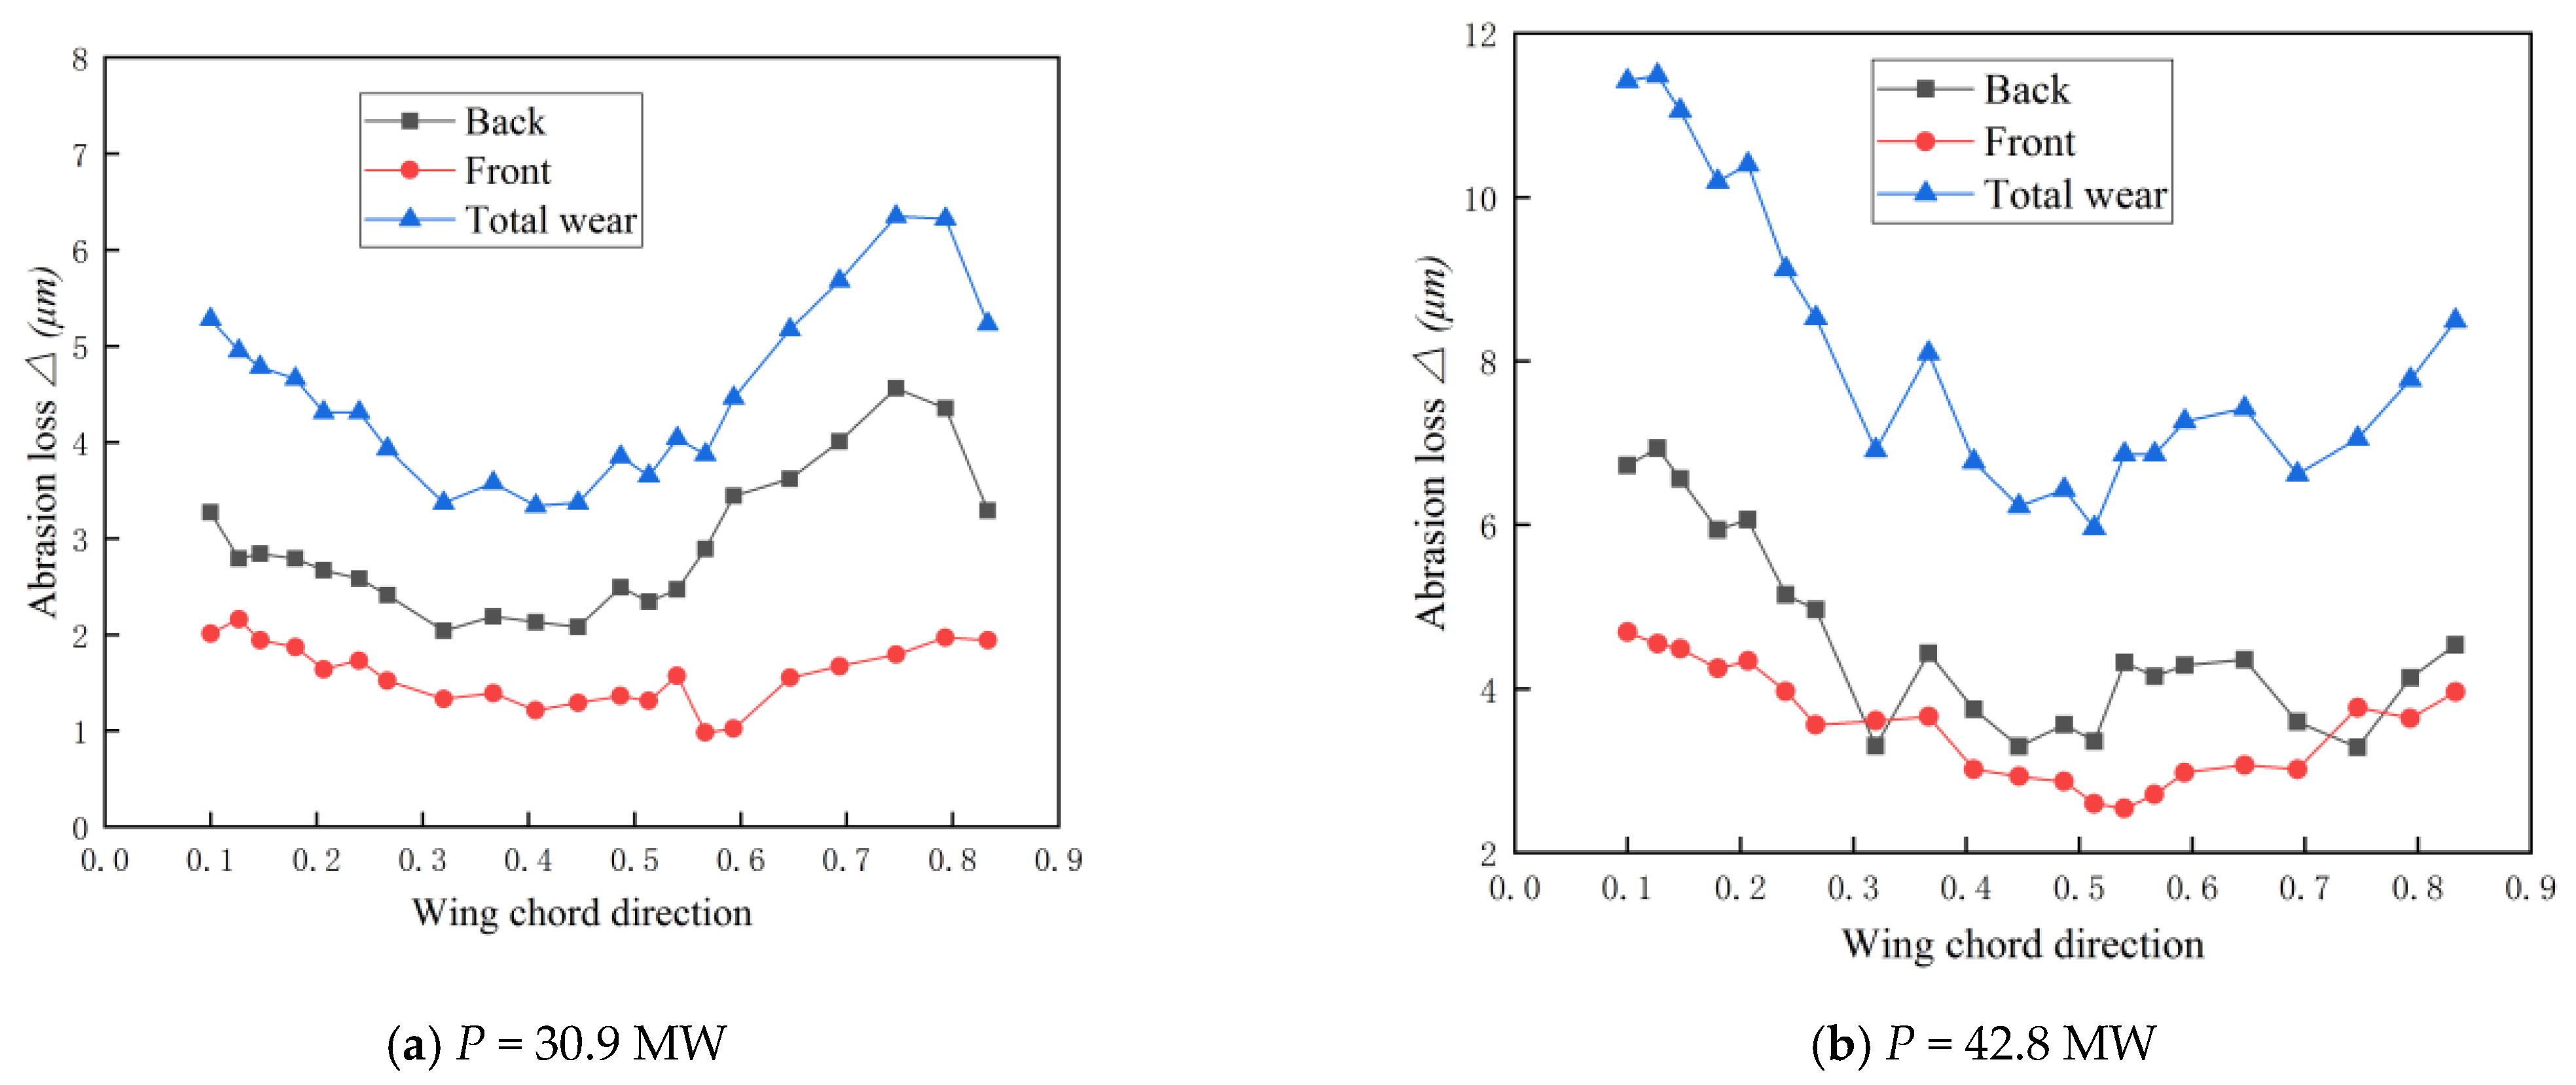
  • According to the test, we extracted the wear data of the guide vane in different airfoil chords upwards, extracted the average wear data of 40–60% as the basis for the estimation of the guide vane life, and estimated the service life of guide vane before and after polishing and after tungsten carbide spraying at P = 30.9 MW and P = 42.8 MW by the maximum wear amount in airfoil chord upwards. In order to be closer to the actual operation of the power plant, the life time of the guide vane was estimated by the wear data of the guide vane after polishing at two water temperatures, and the life time of the guide vane was 40.40 months and 23.39 months at P = 30.9 MW and P = 42.8 MW, respectively, while the lifetime increased by 9.50 months and 5.11 months after tungsten carbide coating, respectively.
  • The design of this paper helps to analyze and study the influence of the guide vane under different working conditions by the sediment wear factor, but considering that the internal flow of the turbine is more complicated, a real model can be considered for the study if the funding is sufficient. Furthermore, the experimental measurement error cannot be neglected. In future research, we are committed to testing a real model and further reducing the test error.

Author Contributions

Conceptualization, X.L. and X.Z.; methodology, X.Z.; software, J.Y.; validation, Y.P., M.R. and X.Z.; formal analysis, X.L.; investigation, J.Y.; resources, X.L.; data curation, J.Y.; writing—original draft preparation, X.Z.; writing—review and editing, X.L.; visualization, M.R.; supervision, X.Z.; project administration, X.L.; funding acquisition, X.L. All authors have read and agreed to the published version of the manuscript.

Funding

This research was funded by the National Key R&D Program of China (Grant No.:2018YFB0905200) and the National Natural Science Foundation of China (Grant No.: 51279172).

Institutional Review Board Statement

Not applicable.

Informed Consent Statement

Not applicable.

Data Availability Statement

Not applicable.

Acknowledgments

We would like to thank Jiarui Chen for her support in this article.

Conflicts of Interest

The authors declare no conflict of interest.

References

  1. Payambarpour, S.A.; Najafi, A.F.; Magagnato, F. Investigation of deflector geometry and turbine aspect ratio effect on 3D modified in-pipe hydro Savonius turbine: Parametric study. Renew. Energy 2020, 148, 44–59. [Google Scholar] [CrossRef]
  2. Messa, G.V.; Mandelli, S.; Malavasi, S. Hydroabrasive erosion in Pelton turbine injectors: A numerical study. Renew. Energy 2019, 130, 474–488. [Google Scholar] [CrossRef]
  3. Jung, I.H.; Kim, Y.S.; Shin, D.H.; Chung, J.T.; Shin, Y. Influence of spear needle eccentricity on jet quality in micro Pelton turbine for power generation. Energy 2019, 175, 58–65. [Google Scholar] [CrossRef]
  4. Chitrakar, S.; Neopane, H.P.; Dahihaug, O.G. Study of the simultaneous effects of secondary flow and sediment erosion in Francis turbines. Renew. Energy 2016, 97, 881–891. [Google Scholar] [CrossRef]
  5. Masoodi, J.H.; Harmain, G.A. A methodology for assessment of erosive wear on a Francis turbine runner. Energy 2017, 118, 644–657. [Google Scholar] [CrossRef]
  6. Gautam, S.; Neopane, H.P.; Acharya, N.; Chitrakar, S.; Thapa, B.S.; Zhu, B. Sediment erosion in low specific speed Francis turbines: A case study on effects and causes. Wear 2020, 442, 2020. [Google Scholar] [CrossRef]
  7. Thapa, B.S.; Dahlhaug, O.G.; Thapa, B. Sediment erosion in hydro turbines and its effect on the flow around guide vanes of Francis turbine. Renew. Sustain. Energy Rev. 2015, 49, 1100–1113. [Google Scholar] [CrossRef]
  8. Han, Y.; Tan, L. Dynamic mode decomposition and reconstruction of tip leakage vortex in a mixed flow pump as turbine at pump mode. Renew. Energy 2020, 155, 725–734. [Google Scholar] [CrossRef]
  9. Koirala, R.; Neopane, H.P.; Zhu, B.; Thapa, B. Effect of Sediment Erosion on Flow around Guide Vanes of Francis turbine. Renew. Energy 2019, 136, 1022–1027. [Google Scholar] [CrossRef]
  10. Liu, M.; Tan, L.; Cao, S. Theoretical model of energy performance prediction and BEP determination for centrifugal pump as turbine. Energy 2019, 172, 712–732. [Google Scholar] [CrossRef]
  11. Rajkarnikar, B.; Neopane, H.P.; Thapa, B.S. Development of rotating disc apparatus for test of sediment-induced erosion in Francis runner blades. Wear 2013, 306, 119–125. [Google Scholar] [CrossRef]
  12. Koirala, R.; Neopane, H.P.; Shrestha, O.; Zhu, B.S.; Thapa, B. Selection of guide vane profile for erosion handling in Francis turbines. Renew. Energy 2017, 112, 328–336. [Google Scholar] [CrossRef]
  13. Khanal, K.; Neopane, H.P.; Rai, S.; Thapa, M.; Bhatt, S.; Shrestha, R. A methodology for designing Francis runner blade to find minimum sediment erosion using CFD. Renew. Energy 2015, 87, 307–316. [Google Scholar] [CrossRef]
  14. Martinez, J.J.; Deng, Z.D.; Mueller, R.; Titzler, S. In situ characterization of the biological performance of a Francis turbine retrofitted with a modular guide vane. Appl. Energy 2020, 276, 1165492. [Google Scholar] [CrossRef]
  15. Rai, A.K.; Kumar, A.; Staubli, T. Analytical modeling and mechanism of hydroabrasive erosion in pelton buckets. Wear 2019, 436–437, 203003. [Google Scholar] [CrossRef]
  16. Rai, A.K.; Kumar, A.; Staubli, T.; Xiao, Y. Interpretation and application of the hydro-abrasive erosion model from IEC 62364 (2013) for Pelton turbines. Renew. Energy 2020, 160, 396–408. [Google Scholar] [CrossRef]
  17. Koirala, R.; Chitrakar, S.; Panthee, A.; Neopane, H.P.; Thapa, B. Implementation of Computer Aided Engineering for Francis Turbine Development in Nepal. Int. J. Manuf. Eng. 2015, 2015, 509808. [Google Scholar] [CrossRef] [Green Version]
  18. Butchers, J.; Cox, J.; Williamson, S.; Booker, J.D. Design for Localisation: A case study in the development and implementation of a low head propeller turbine in Nepal. Dev. Eng. 2020, 5, 100051. [Google Scholar] [CrossRef]
  19. Li, D.; Wang, H.; Li, Z.; Nielsen, T.K.; Goyal, R.; Wei, X.; Qin, D. Transient characteristics during the closure of guide vanes in a pump-turbine in pump mode. Renew. Energy 2018, 118, 973–983. [Google Scholar] [CrossRef]
  20. Mao, X.L.; Zheng, Y.; Pavesi, G.; Xie, Z. A new method of dynamic mesh used in continuous guide vane closure of a reversible pump-turbine in generating mode. J. Hydrodyn. 2019, 31, 976–986. [Google Scholar] [CrossRef]
  21. Varady, T.; Martin, R.R.; Cox, J. Reverse engineering of geometric models—An introduction. Comput.-Aided Des. 1997, 29, 255–268. [Google Scholar] [CrossRef]
  22. Udupa, S.K.; Debray, S.K.; Madou, M. Deobfuscation: Reverse engineering obfuscated code. In Proceedings of the Working Conference on Reverse Engineering, Pittsburgh, PA, USA, 7–11 November 2005. [Google Scholar]
  23. Canforaharman, G.; Di Penta, M. New Frontiers of Reverse Engineering. In Proceedings of the Future of Software Engineering, Minneapolis, MN, USA, 23–25 May 2007. [Google Scholar]
  24. Liu, J.; Lu, E.; Yi, H.; Wang, M. A new surface roughness measurement method based on a color distribution statistical matrix. Measurement 2017, 103, 165–178. [Google Scholar] [CrossRef]
  25. Chen, S.; Rui, F.; Zhang, C. Surface roughness measurement method based on multi-parameter modeling learning. Measurement 2018, 129, 664–676. [Google Scholar] [CrossRef]
  26. Bidgoli, M.A.; Golroo, A.; Nadjar, H.S.; Rashidabad, A.G.; Ganji, M.R. Road roughness measurement using a cost-effective sensor-based monitoring system. Autom. Constr. 2019, 104, 140–152. [Google Scholar] [CrossRef]
  27. Kim, S.Y.; Seo, J.H.; Yoon, Y.J.; Kim, J.S.; Cho, S.; Lee, J.-H.; Kang, I.M. Electrical Characteristics of Enhancement-Mode n-Channel Vertical GaN MOSFETs and the Effects of Sidewall Slope. J. Electr. Eng. Technol. 2015, 10, 1131–1137. [Google Scholar] [CrossRef] [Green Version]
  28. Clemens, N.T.; Mungal, M.G. Effects of sidewall disturbances on the supersonic mixing layer. J. Propuls. Power 2015, 8, 249–251. [Google Scholar] [CrossRef]
  29. Wood, R.; Herd, S.; Thakare, M.R. A critical review of the tribocorrosion of cemented and thermal sprayed tungsten carbide. Tribol. Int. 2018, 119, 491–509. [Google Scholar] [CrossRef]
  30. Mahdipoor, M.S.; Taras, F.; Moreau, C.; Dolatabadi, A.; Medraj, M. HVOF sprayed coatings of nano-agglomerated tungsten-carbide/cobalt powders for water droplet erosion application. Wear 2015, 330–331, 338–347. [Google Scholar] [CrossRef]
  31. Munday, G.; Hogan, J.; Mcdonald, A. On the microstructure-dependency of mechanical properties and failure of low-pressure cold-sprayed tungsten carbide-nickel metal matrix composite coatings. Surf. Coat. Technol. 2020, 396, 125947. [Google Scholar] [CrossRef]
  32. Li, X.; Yu, P.; Feng, Y.; Yang, Q.; Li, Y.; Ye, B. Specific adsorption and highly sensitive detection of methyl red in wastewater using an iron paste electrode modified with a molecularly imprinted polymer. Electrochem. Commun. 2021, 132, 107144. [Google Scholar] [CrossRef]
  33. Manthiram, A.; Goodenough, J.B. Synthesis of the high-Tc superconductor YBa2Cu3O7–δ in small particle size. Nature 1987, 329, 701–703. [Google Scholar] [CrossRef]
  34. Ishigami, Y.; Takada, K.; Yano, H.; Inukai, J.; Uchida, M.; Nagumo, Y.; Hyakutake, T.; Nishide, H.; Watanabe, M. Corrosion of carbon supports at cathode during hydrogen/air replacement at anode studied by visualization of oxygen partial pressures in a PEFC—Start-up/shut-down simulation. J. Power Sources 2011, 196, 3003–3008. [Google Scholar] [CrossRef]
  35. China National Standardization Management Committee. GB/T 29403—2012 Technical Guidelines for Sediment Abrasion of Counterattack Turbine; China Standards Press: Beijing, China, 2013.
Figure 1. Scanned view of the site.
Machines 10 00264 g001
Figure 2. Guide vane surface model.
Machines 10 00264 g002
Figure 3. (a,b) Sketch of guide vane opening of 64.3%, 81% sketch.
Machines 10 00264 g003
Figure 4. Schematic diagram of runner extraction.
Machines 10 00264 g004
Figure 5. (a,b) CAD design drawing of test bench.
Machines 10 00264 g005
Figure 6. (a,b) Physical drawing of the test bench.
Machines 10 00264 g006
Figure 7. (ae) Surface roughness measurement of guide vane.
Machines 10 00264 g007
Figure 8. (a,b) Before grinding the guide vane.
Machines 10 00264 g008
Figure 9. (a,b) After grinding the guide vane.
Machines 10 00264 g009
Figure 10. (a,b) Laser engraved dots and numbers.
Machines 10 00264 g010aMachines 10 00264 g010b
Figure 11. White light interference profiler.
Machines 10 00264 g011
Figure 12. Simulation results compared with the actual measurement of the power station. (a) Front, (b) Back.
Machines 10 00264 g012
Figure 13. (ad) Wear amount at different scoring points (P = 30.9 MW).
Machines 10 00264 g013
Figure 14. (ad) Wear amount at different scoring points (P = 42.8 MW).
Machines 10 00264 g014
Figure 15. (ad) Wear on the surface of guide vane (P = 30.9 MW).
Machines 10 00264 g015
Figure 16. (ad) Wear on the surface of guide vane (P = 42.8 MW).
Machines 10 00264 g016
Figure 17. Trajectory diagram of sediment particles.
Machines 10 00264 g017
Figure 18. (ad) Wear amount at different scoring points.
Machines 10 00264 g018
Figure 19. (a,b) Cooling system.
Machines 10 00264 g019
Figure 20. (ad) Wear amount at different scoring points (P = 30.9 MW).
Machines 10 00264 g020
Figure 21. (ad) Wear amount at different scoring points (P = 42.8 MW).
Machines 10 00264 g021aMachines 10 00264 g021b
Figure 22. (a,b) Wear on the chord of different airfoil types (P = 30.9 MW).
Machines 10 00264 g022
Figure 23. (a,b) Wear on the chord of different airfoil types (P = 42.8 MW).
Machines 10 00264 g023
Figure 24. (a,b) Wear on the chord of different airfoil types (Tungsten Carbide).
Machines 10 00264 g024
Table 1. Sediment particle test report.
ComponentGravelSandSiltClay
20~10 mm10~5 mm5~2 mm2~1 mm1~0.5 mm0.5~0.25 mm0.25~0.075 mm0.075~0.005 mm<0.005 mm
granulometric distribution (%)0.000.008.517.6219.2910.4230.9321.192.04
Table 2. Roughness measurement (after polishing).
Work Conditions (MW)Test1Test2Test3Test4Test5Average Value (μm)
Ra (μm)Rq (μm)Ra (μm)Rq (μm)Ra (μm)Rq (μm)Ra (μm)Rq (μm)Ra (μm)Rq (μm)Ra (μm)Rq (μm)
30.90.1640.2040.2090.2560.1510.1850.1740.2260.1940.2310.1780.220
42.80.1750.2230.1980.2610.1570.1960.1730.2150.1690.2240.1740.224
Table 3. Weighing of guide vane specimens before and after wear.
Work ConditionsBefore PolishingAfter Polishing
Before Test (g)After Test (g)Wear Amount (g)Before Test (g)After Test (g)Wear Amount (g)
P = 30.9 MW4731.254711.3919.864710.844698.7312.11
P = 42.8 MW4734.974703.3431.634716.084695.6920.39
Table 4. Physical properties of tungsten carbide.
Melting Point2870 °CMicro-Penetration Hardness17,300 MPa
Boiling point6000 °CModulus of elasticity710 GPa
Density15.63Compressive strength56 MPa
Poisson ratio0.31Thermal expansion coefficient6.9 × 10−6/K
Table 5. Weighing of guide vane specimens before and after wear (Tungsten Carbide Coating).
Work Conditions (MW)Before Test (g)After Test (g)Wear Amount (g)
30.94744.284740.743.54
42.84740.014734.235.78
Table 6. Maximum wear under different working conditions.
Water Temperature (℃)Working Condition (MW)Before Polishing (μm)After Polishing (μm)Tungsten Carbide Spraying (μm)
25.630.946.228.16.23
42.859.847.311.58
7.830.9-25.2-
42.8-43.9-
Table 7. Estimated life of the guide vane.
Working Condition (MW)Wear Depth Up to 8 mm Before Polishing (h)Wear Depth Up to 8 mm After Polishing (h)Tungsten Carbide Spraying Wear Finished (h)Continued Wear of Base Material (h)
Before PolishingAfter Polishing
30.916,623.3829,090.916837.8823,461.2635,928.79
42.812,842.8116,842.083678.7616,521.5720,520.84
Publisher’s Note: MDPI stays neutral with regard to jurisdictional claims in published maps and institutional affiliations.

