Article

Investigation of Cell Concentration Change and Cell Aggregation Due to Cell Sedimentation during Inkjet-Based Bioprinting of Cell-Laden Bioink

1
Department of Industrial, Manufacturing, and Systems Engineering, Texas Tech University, Lubbock, TX 79409, USA
2
Department of Mechanical Engineering, Texas Tech University, Lubbock, TX 79409, USA
*
Author to whom correspondence should be addressed.
Machines 2022, 10(5), 315; https://doi.org/10.3390/machines10050315
Submission received: 7 April 2022 / Revised: 25 April 2022 / Accepted: 26 April 2022 / Published: 28 April 2022
(This article belongs to the Special Issue 3D/4D Bioprinting)

Abstract

:
Recently, even though 3D bioprinting has made it possible to fabricate 3D artificial tissues/organs, it still faces several significant challenges such as cell sedimentation and aggregation. As the essential element of 3D bioprinting, bioink is usually composed of biological materials and living cells. Guided by the initially dominant gravitational force, cells sediment, resulting in the non-uniformity of the bioink and the decrease in the printing reliability. This study primarily focuses on the quantification of cell sedimentation-induced cell concentration change and cell aggregation within the bioink reservoir during inkjet-based bioprinting. The major conclusions are summarized as follows: (1) with 0.5% (w/v) sodium alginate, after around 40-min printing time, almost all the cells have sedimented from the top region. The cell concentration at the bottom is measured to be more than doubled after 60-min printing time. On the contrary, due to the slow cell sedimentation velocity with 1.5% and 3% (w/v) sodium alginate, the uniformity of the bioink is still highly maintained after 60-min printing; and (2) more cell aggregates are observed at the bottom with the printing time, and severe cell aggregation phenomenon has been observed at the bottom using 0.5% (w/v) sodium alginate starting from 40-min printing time. With the highest cell concentration 2 × 10⁶ cells/mL, 60.9% of the cells have formed cell aggregates at 40-min printing time. However, cell aggregation is dramatically suppressed by increasing the polymer concentration.

1. Introduction

Additive manufacturing, also known as three-dimensional (3D) printing, has experienced significant development since 1986 [1]. Later, originating from 3D printing technologies, the concept of 3D bioprinting–the aim of which is to simultaneously deposit biological materials and living cells–was presented [2]. The appearance of 3D bioprinting has made it possible to fabricate 3D-engineered tissues/organs using a layer-by-layer deposition mechanism. Bioink, which is a mixture of biological materials and living cells, is the key element of 3D bioprinting [3]. Ideally, biological materials mimicking extracellular matrix (ECM) should hold several attributes such as suitable printability, biodegradability, biocompatibility, mechanical properties, and crosslinking mechanism, to name a few [4]. Due to the similarity to a natural tissue environment, hydrogels with the desired properties have been preferred for 3D bioprinting [5]. Currently, the existing hydrogels can be mainly divided into two categories including natural hydrogels such as fibrin [6] and collagen [7], and synthetic hydrogels such as poly (ethylene glycol) (PEG) [8] and poly (lactic acid) (PLA) [9]. As the other key component of the bioink, several cell sources, including but not limited to human pluripotent stem cells (hPSCs) [10] and human vascular endothelial cells (HUVECs) [11], have become involved in the fabrication of 3D functional tissues/organs such as skin [12] and heart valves [13].
The typical 3D bioprinting techniques for depositing the bioink into the 3D desired structures can be classified into inkjet-based bioprinting, microextrusion-based bioprinting, laser-assisted bioprinting, and stereolithography-based bioprinting [14]. Relying on thermal or piezoelectric expansion, inkjet-based bioprinting accurately delivers a small size and volume of cell-laden droplets at predefined locations onto a substrate [15]. As the other type of nozzle-based bioprinting, microextrusion-based bioprinting extrudes continuous filament out of the micro-sized nozzle, relying on pneumatic or mechanical force, which is used as the building block for the fabrication of the 3D structures [16]. During laser-assisted bioprinting, a laser beam is exposed onto the energy-absorbing layer to generate enough pressure to eject cell-laden droplets, which are later deposited onto the substrate to form the desired constructs [17]. In stereolithography-based bioprinting–a recently maturing technique–the crosslinking of photosensitive materials is controlled by digital micromirror arrays to form the targeted constructs upon ultraviolet (UV)/visible light exposure [18]. Among the four bioprinting techniques, inkjet-based bioprinting has been favored for various applications due to its high printing resolution and cell viability, precise control of the deposition of the cell-laden droplets, and unique noncontact delivery mechanism [19,20].
The uniformity of the cell distribution is of great importance to the functionality of the 3D bioprinted constructs. Cells are expected to be uniformly distributed both within the cell-laden droplets during printing and the post-printing microspheres [21]. However, due to the density difference between the living cells and the polymer solution, especially within the polymer solution with low density and viscosity, the gravitational force is not fully balanced by the buoyant force, resulting in cell sedimentation and the non-uniformity of the cell distribution within the bioink. Cell sedimentation, which breaks the uniformity of cell distribution and thus affects the printing performance, has been recognized as a significant factor affecting printing performance. Indeed, several studies have reported the negative effect of cell sedimentation on printing performance. For example, Saunders et al. have observed an unstable printing process caused by cell sedimentation [22]. Later, Saunders and Derby reported an uneven cell output and pointed out the importance of addressing the cell sedimentation problem to improve the printing performance [23]. Recently, there have been several studies focusing on the characterization of the cellular sedimentation behaviors. For instance, Xu et al. have recently presented a comprehensive study on cell sedimentation behaviors during inkjet-based bioprinting of cell-laden droplets [24]. Cell sedimentation velocity was found to be inversely correlated with polymer concentration, the local cell concentration at the bottom of the bioink reservoir was consistently increased due to the accumulation of cells, and the cell aggregation phenomenon was observed after long-time printing.
Due to cell sedimentation, the local cell concentration at the bottom of the bioink reservoir is increased, resulting in the decrease in the distance between adjacent cells and the increase in the probability of enhancing cell aggregation [25]. Similar to cell sedimentation, the cell aggregation phenomenon–which is more frequently observed within the bioink with low viscosity–has been widely documented to have a negative effect on printing performance [26]. For example, Parsa et al. observed cell aggregates with the largest size of more than 200 µm [27]. Zhang et al. reported that cell aggregation may cause an anomaly in the jetting behaviors by changing the viscosity of the bioink [28]. Similarly, cell aggregates have also been proved to result in the non-straight jetting trajectories during laser-induced forward transfer (LIFT) [29]. Peppers et al. reported an uneven cell output especially due to cell aggregation [30]. Furthermore, for nozzle-based bioprinting such as inkjet-based bioprinting, the nozzle would be clogged by a large size of cell aggregates and continuous jetting would then be prohibited [31]. Therefore, cell sedimentation and the resulting cell aggregation are two critical factors significantly affecting printing performance [32].
Although several studies have studied cell sedimentation behaviors such as cell sedimentation velocity and emphasized the adverse effects of cell sedimentation and cell aggregation on the printing performance, a detailed study primarily focusing on the characterization of cell concentration change and aggregation induced by cell sedimentation is still missing. This study is one of the first studies primarily focusing on the characterization of cell concentration change and cell aggregation that are mainly due to cell sedimentation. In this study, cell concentrations at the top, middle, and bottom regions of the bioink reservoir are measured after different printing times. In addition, the percentage of cells forming cell aggregates or remaining as individual cells at the bottom of the bioink reservoir are characterized after different printing times, respectively. Different cell concentrations at different regions of the bioink reservoir and the formation of cell aggregates with the printing time demonstrate the non-uniformity of the cells. The remaining sections of this paper are listed as follows: Section 2 clearly lists the experimental conditions and presents the approach for characterizing cell concentration and cell aggregation; Section 3 presents the major findings from this study; and Section 4 draws the major conclusions for this study and presents the future work.

2. Materials and Methods

2.1. Bioink Preparation

Bioink is usually composed of two major components including hydrogel solutions and living cells [33]. Specifically, in this study, high-water content sodium alginate was selected to imitate natural ECM–providing the suitable environment to favor cell attachment, proliferation, and differentiation [34]–and 3T3 fibroblasts were selected as the model cells. Briefly, the bioink is prepared by dispersing the living cells into the prepared hydrogel solution following the protocol: (1) prepare the sodium alginate solution by fully mixing sodium alginate powder (Sigma-Aldrich, St. Louis, MO, USA) within Dulbecco’s Modified Eagles Medium (DMEM; Sigma-Aldrich, St. Louis, MO, USA); (2) collect the cells from the culturing flask; and (3) re-suspend the collected cells within the prepared sodium alginate solution to prepare the bioink with the desired cell concentration. More detailed information can be found in our previous paper [35]. Since cell sedimentation velocity is reported to be inversely correlated with polymer concentration, 0.5%, 1.5%, and 3% (w/v) sodium alginate were specifically selected in this study to represent high, medium, and low cell sedimentation velocity, respectively [24], while 1, 1.5, and 2 × 10⁶ cells/mL cell concentration were selected to represent low, medium, and high chance of cell aggregation, respectively.

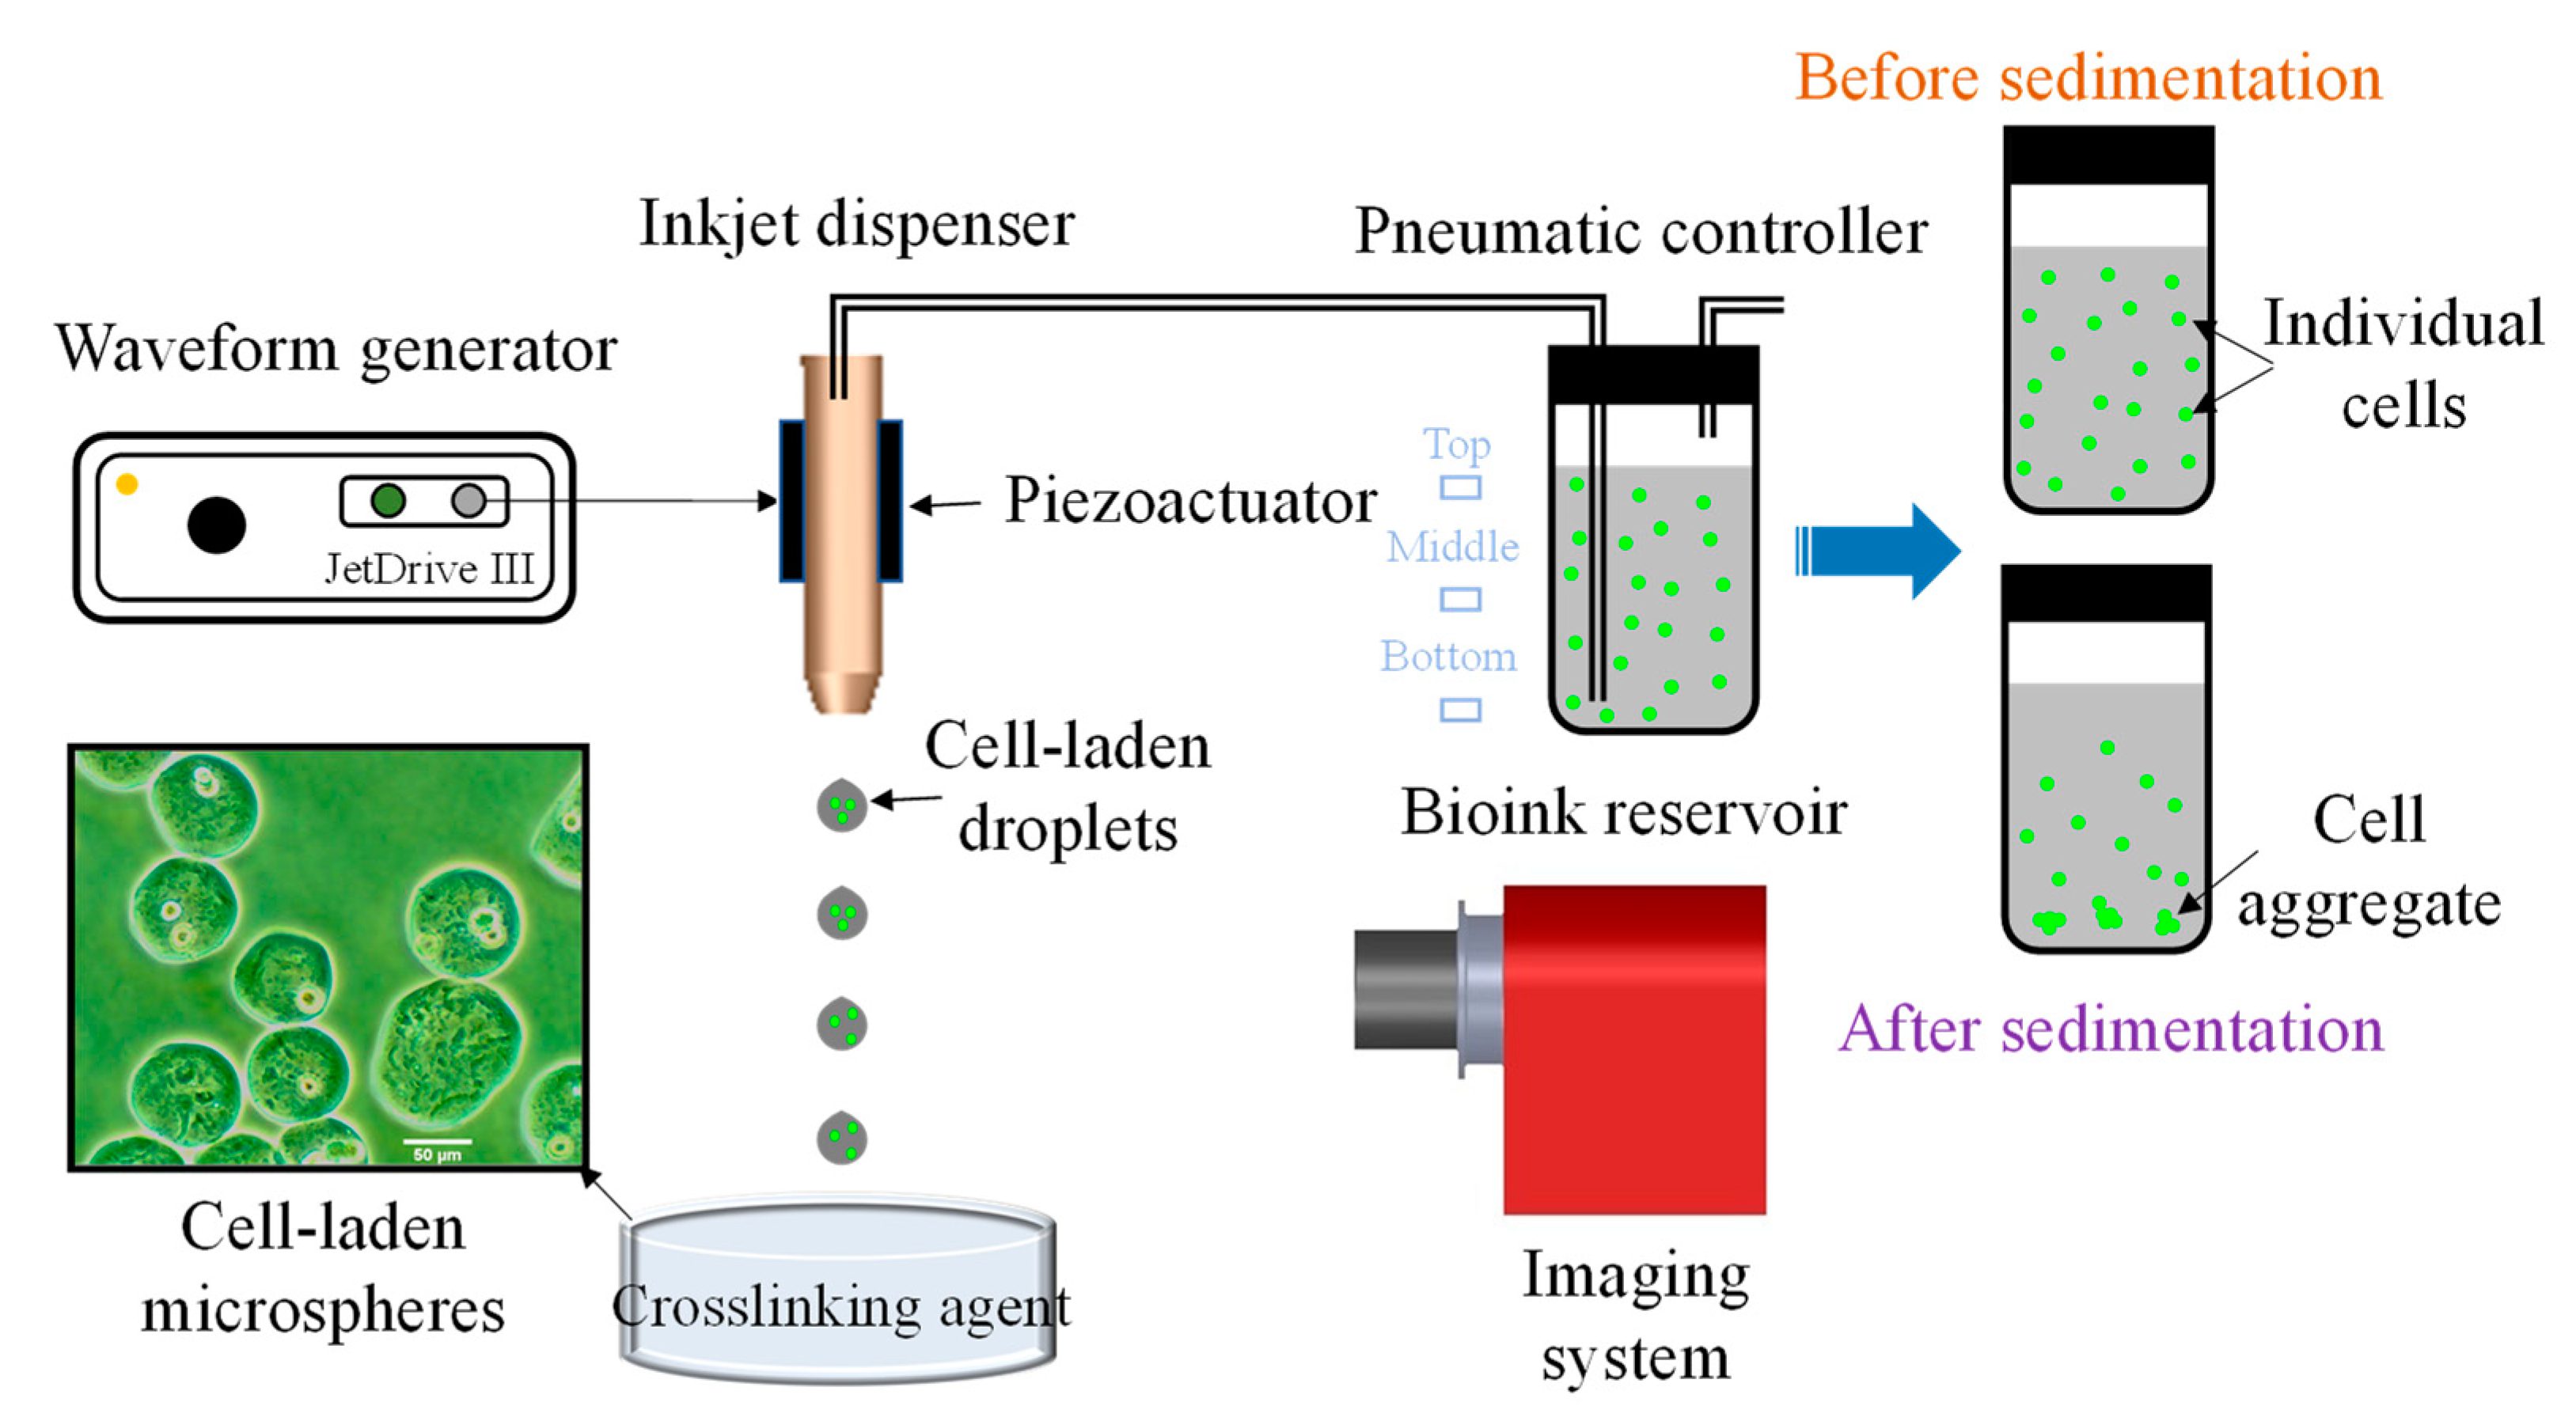
2.2. Experimental Setup

Inkjet-based bioprinting is selected for this study, and its schematic diagram is representatively shown in Figure 1. Briefly, the inkjet-based bioprinting system mainly contains several components including a piezoactuator-attached inkjet nozzle, a waveform generator, a pneumatic controller, a bioink reservoir connected to the inkjet nozzle, a high-resolution horizontal imaging system, and a substrate collecting the cell-laden droplets. The detailed function of each component has been provided in our previous studies [36,37]. During inkjet-based bioprinting, cells tend to sediment due to the insufficient buoyant force provided by the solution, and the sedimentation velocity is dependent on several factors such as the cell mass density and the polymer concentration. Due to consistent cell sedimentation, cell concentration at the bottom is supposed to consistently increase, while that at the top is supposed to consistently decrease. Regarding the middle region, it is a more complicated case since it is both receiving the cells sedimenting from the higher positions and losing cells sedimenting to the lower positions. Therefore, the cell concentration at the middle region of the bioink reservoir becomes dependent on the net gain/loss of the cells. The cell concentration at the top, middle, and bottom regions was characterized after 20-, 40-, and 60-min printing time, respectively. The cell concentration was measured by injecting small volume of bioink into a hemocytometer. For each experimental condition, the counting of cell concentration and was repeated three times to take the average and reduce random error.

2.3. Cell Aggregation Characterization

With cell sedimentation, more and more cells accumulate at the bottom of the bioink reservoir resulting in a significant increase in the cell concentration. Once the number of cells at the bottom increases significantly, the distance between adjacent cells will be shortened, increasing the probability of cell aggregation [38]. After cell aggregates are formed, cells will exist as one of the three following modes: individual cells, small cell aggregates containing 2–4 individual cells, or large cell aggregates containing at least five individual cells. The percentage of the cells still existing as individual cells (ic%), the percentage of cells forming small aggregates (sa%), and the percentage of cells forming large aggregates (la%) was characterized using the formula as follows, respectively:
i c % =   a = 1 a b a = 1 c a b   ×   100 %  
s a % = a = 2 4 a b a = 1 c a b   ×   100 %  
l a % = a = 5 c a b a = 1 c a b   ×   100 %  
where a denotes the number of the cells existing as individual cells or constituting cell aggregates, b denotes the associated counting frequency of individual cells or cell aggregates, and c denotes the number of cells constituting the largest cell aggregate. In this study, the percentages of cells remaining as individual cells and becoming partial of the cell aggregates were characterized at the bottom region of the bioink reservoir after 20-, 40-, and 60-min printing time, respectively. For each condition, the experiment was repeated three times to take the average and calculate the standard deviation, where a higher standard deviation demonstrates a wider range out of the mean value and a smaller standard deviation demonstrates the experimental values are close to the mean value.

3. Results and Discussion

During inkjet-based bioprinting, bioink with low polymer concentration and cell concentration is commonly selected to avoid nozzle clogging and ensure the printing performance. Thus, driven by the dominant gravitational force, cells firstly accelerate to obtain a cell sedimentation velocity, and then sediment with the achieved velocity after reaching a force equilibrium state. Therefore, cells consistently sediment and accumulate at the bottom of the reservoir. In addition, cells accumulating at the bottom of the bioink reservoir causes the distance between adjacent cells to reduce, resulting in the enhancement of cell–cell interaction and increasing the probability of cell aggregation. Specifically, Section 3.1 will primarily focus on cell sedimentation-induced local cell concentration change at the top, middle, and bottom region after 20-, 40-, and 60-min, using the bioink composed of different polymer and cell concentrations. Section 3.2 will present the experimental results on the characterization of the existing forms of cells (either still existing as individual cells or becoming a component of cell aggregates) at the bottom of the bioink reservoir using different combinations of the bioink after different printing times.

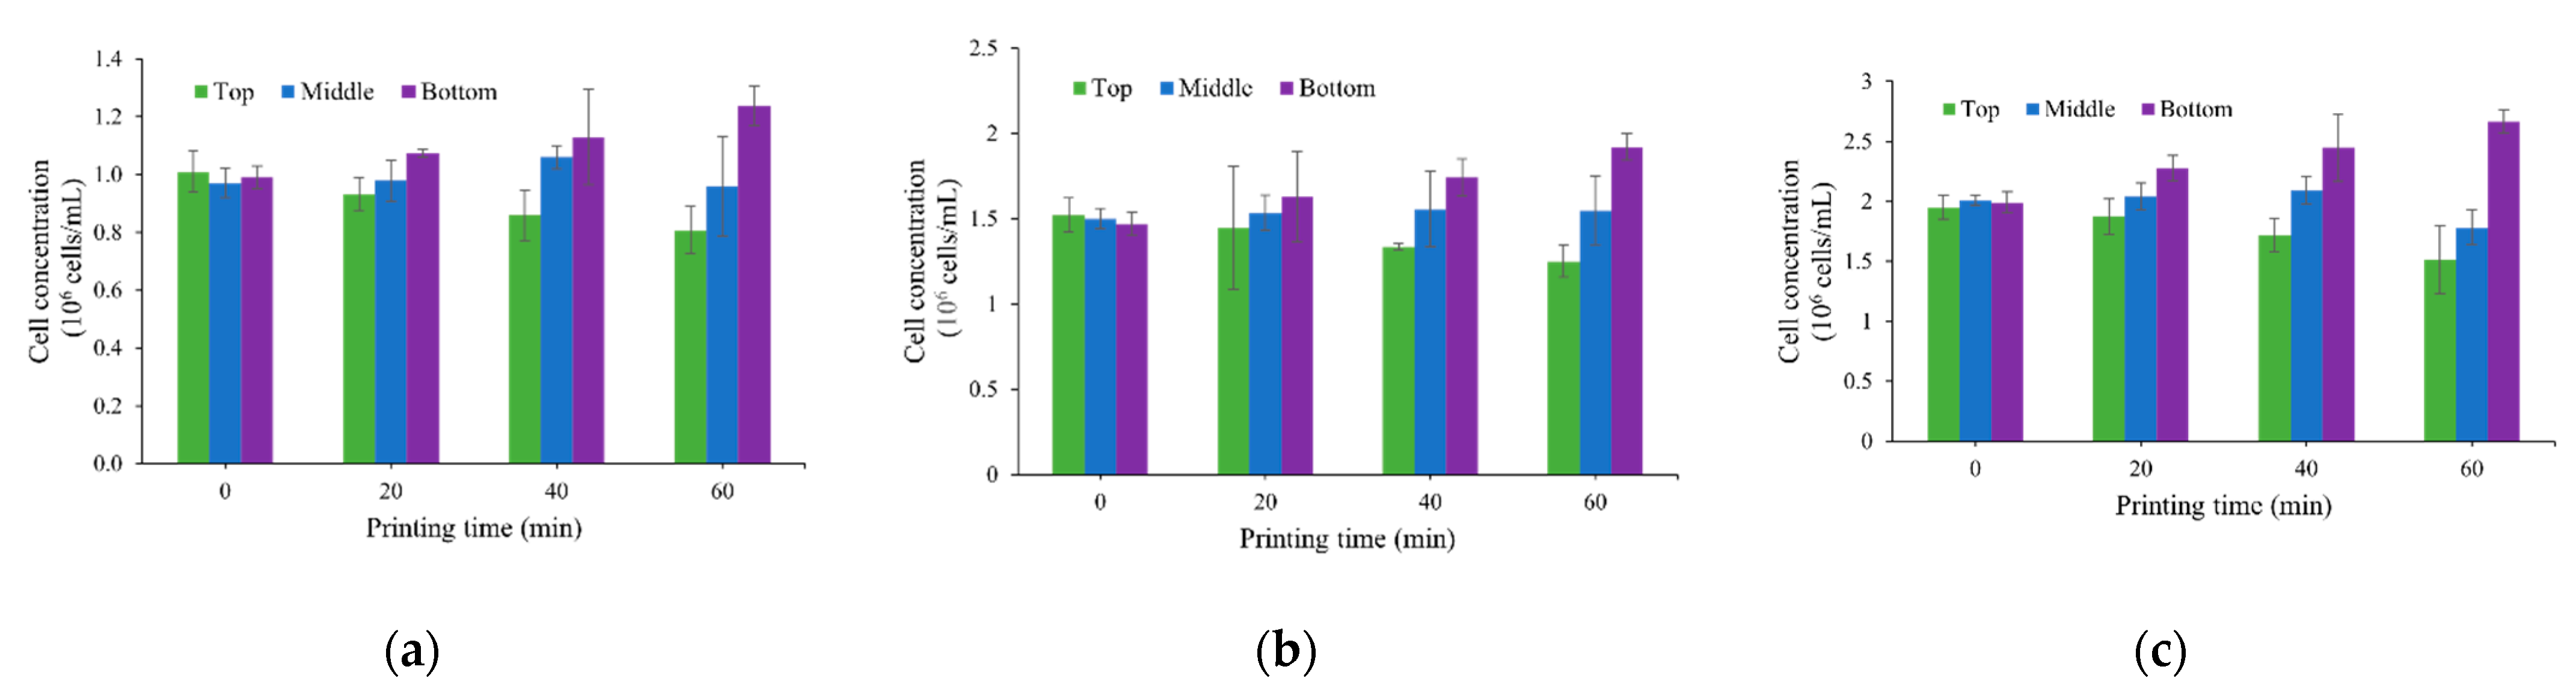
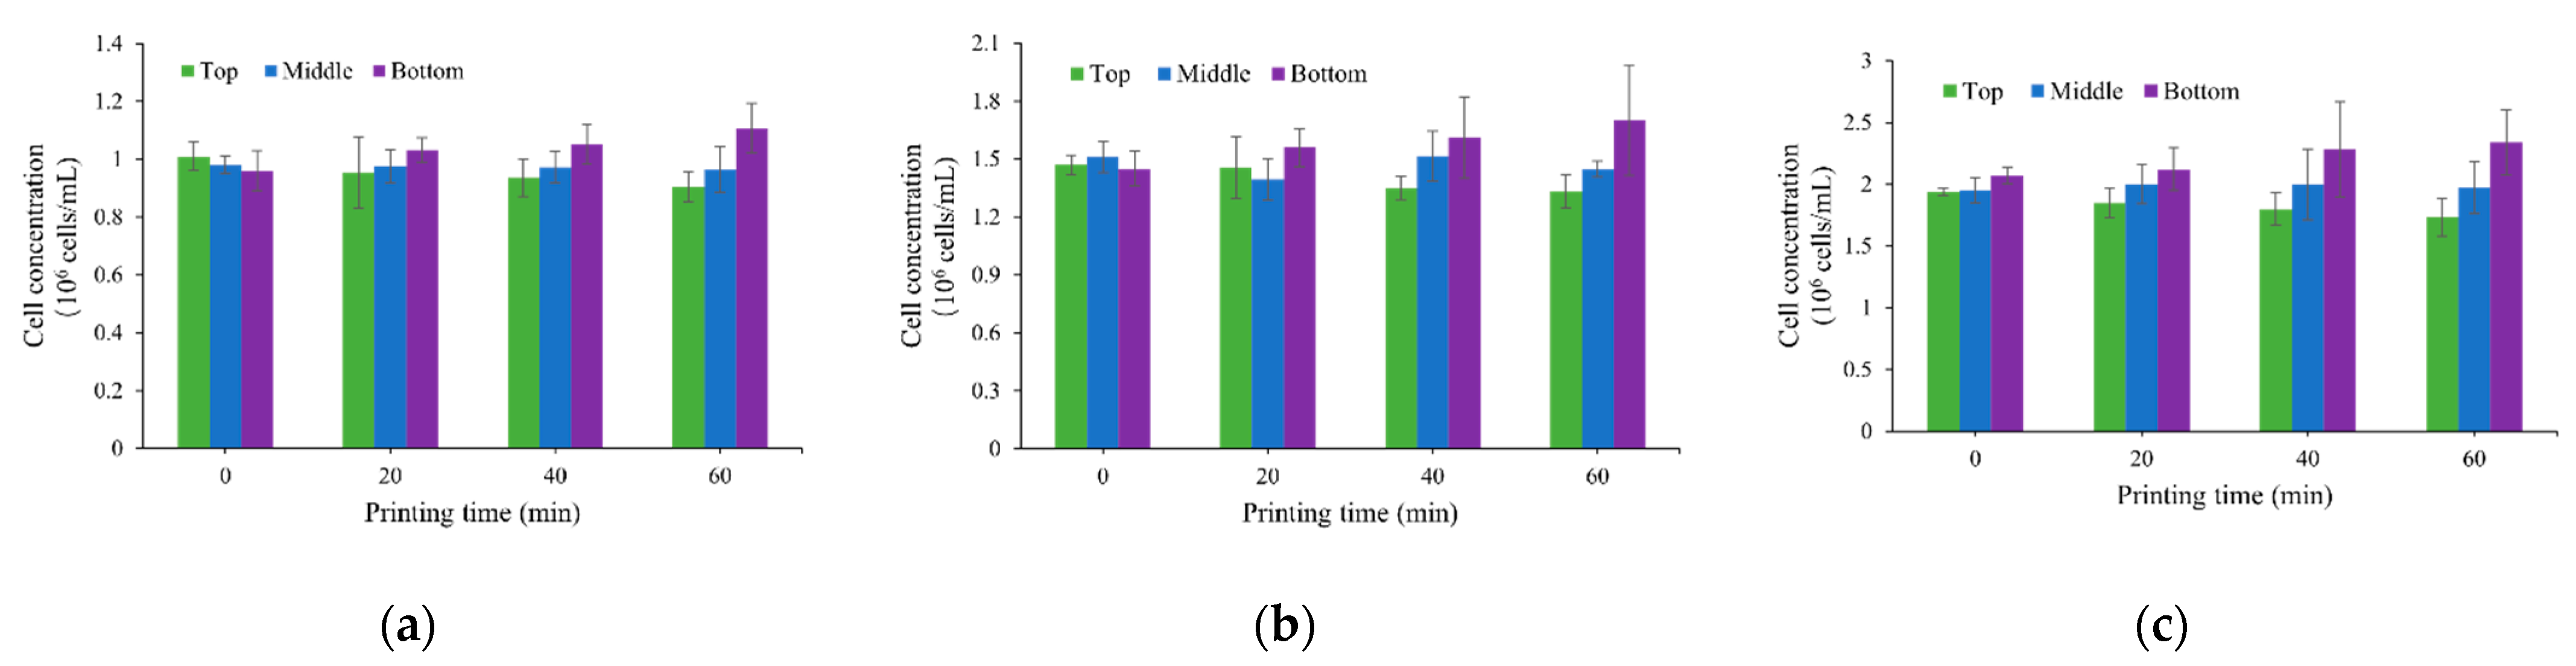
3.1. Cell Concentration Change Due to Cell Sedimentation

During inkjet-based bioprinting of the bioink with low polymer concentration, the buoyant force provided by the fluid is not sufficient to counteract the gravitational force. Hence, cells are accelerating and achieving a cell sedimentation velocity until the gravitational force is balanced. Generally, cell sedimentation causes the cells to leave the higher positions and accumulate at the lower positions, resulting in the non-uniformity of the cell distribution within the bioink reservoir. With the printing time, the top region will have a lower cell concentration due to cell loss, and the bottom region will have a higher cell concentration due to cell accumulation. The cell concentration at the middle region will be determined by the net gain/loss of cells since there will be both cells receiving from the higher regions and cells leaving to the lower regions. If there are more receiving cells, then the cell concentration at the middle region will be increased. On the contrary, if there are more leaving cells, then the cell concentration at the middle region will be decreased. In this section, cell concentrations at different regions of the bioink reservoir after different printing time are characterized using different bioinks, respectively. Specifically, three levels of polymer concentrations including 0.5%, 1.5%, and 3% (w/v) sodium alginate and three levels of cell concentration including 1, 1.5, and 2 × 10⁶ cells/mL are selected to mix the bioink.
The cell concentrations measured at different regions after different printing time using the bioink with 0.5%, 1.5%, and 3% (w/v) sodium alginate are reflected in Figure 2, Figure 3 and Figure 4, respectively. Among the three selected polymer concentrations including 0.5%, 1.5%, and 3% (w/v) sodium alginate, the lowest polymer concentration 0.5% (w/v) sodium alginate provides the highest cell sedimentation velocity regardless of the cell concentration. Therefore, within the same printing time, the difference between the number of cells at the bottom and top region using 0.5% (w/v) shown in Figure 2 is the largest, while the difference between the number of cells at the bottom and top region representing 3% (w/v) sodium alginate shown in Figure 4 is the least, and that of 1.5% (w/v) sodium alginate is at the intermediate level. For example, as shown in Figure 2a, for the bioink composed of 0.5% (w/v) sodium alginate with an initial cell concentration of 1 × 10⁶ cells/mL, the initial cell concentration at every region of the bioink reservoir is measured to be close enough to 1 × 10⁶ cells/mL due to the well stirring during the bioink preparation process. The cell concentration at the top, middle, and bottom region of the bioink reservoir after 20-min sedimentation is measured to be 0.72 × 10⁶ cells/mL, 1.07 × 10⁶ cells/mL, and 1.45 × 10⁶ cells/mL, respectively. On the contrary, as shown in Figure 3a, the cell concentration of those regions using 1.5% (w/v) is measured to be 0.81 × 10⁶ cells/mL, 0.96 × 10⁶ cells/mL, and 1.24 × 10⁶ cells/mL, respectively; and the cells are still distributed quite evenly with 3% (w/v) sodium alginate shown in Figure 4a, with a cell concentration of 0.95 × 10⁶ cells/mL, 0.98 × 10⁶ cells/mL, and 1.03 × 10⁶ cells/mL, respectively.
As printing proceeds, the majority of the cells using the bioink composed of 0.5% (w/v) sodium alginate have been observed to leave the top region, leaving few cells remaining at the top region after around 40-min printing time. For example, as shown in Figure 2a, after 40-min printing, the cell concentration measured at the top region is only 0.11 × 10⁶ cells/mL, which is only 11% of the initial cell concentration of 1 × 10⁶ cells/mL. With more cells leaving the top region and accumulating at the bottom region, the difference in the cell concentration between the top and bottom region becomes more pronounced. For the initial cell concentration of 1 × 10⁶ cells/mL, as shown in Figure 2a, the cell concentration at the top, middle, and bottom region is measured to be 0.05 × 10⁶ cells/mL, 1.03 × 10⁶ cells/mL, and 2.06 × 10⁶ cells/mL after 60-min printing, respectively, demonstrating a large difference between the cell concentration at the top and bottom region due to cell sedimentation. It is obvious that the cell concentration using 0.5% (w/v) sodium alginate at the bottom of the bioink reservoir is more than doubled after 60-min printing. Similarly, the local cell concentration at the bottom has increased significantly from 1.5 × 10⁶ cells/mL to 3.05 × 10⁶ cells/mL shown in Figure 2b, and from 2 × 10⁶ cells/mL to 4.53 × 10⁶ cells/mL shown in Figure 2c, for the initial cell concentration of 1.5 × 10⁶ cells/mL and 2 × 10⁶ cells/mL, respectively. It is obvious that the local cell concentration shown in Figure 2c has the largest increase for 2 × 10⁶ cells/mL cell concentration and 0.5% (w/v) cell concentration. One reasonable explanation is cell aggregation, since a larger cell concentration generally reduces the distance between adjacent cells, resulting in the increase in the probability of cell aggregation and cell aggregates with a larger size sediment with a higher rate, compared to individual cells resulting in more cells accumulating at the bottom within the same printing time.
For 1.5% and 3% (w/v) sodium alginate, the cell concentration decrease at the top of the bioink reservoir and the cell concentration increase at the bottom of the bioink reservoir are both far less compared to 0.5% (w/v) sodium alginate due to the smaller cell sedimentation velocity as reported in Xu’s study [24]. For example, using the bioink with 1.5% (w/v) sodium alginate and a cell concentration of 1.5 × 10⁶ cells/mL, as shown in Figure 3b, the maximum increase in the cell concentration at the bottom is only 28% with an increase from 1.5 × 10⁶ cells/mL to 1.92 × 10⁶ cells/mL, and the maximum decrease at the top is only 16.7% with a decrease from 1.5 × 10⁶ cells/mL to 1.25 × 10⁶ cells/mL within 60-min printing time. For the highest polymer concentration in this study, 3% (w/v) sodium alginate provides the largest buoyant force attempting to balance the dominant gravitational force, and thus maximally suppresses cell sedimentation. Therefore, the cell distribution remains the most uniform within the three selected polymer concentrations. For instance, using the bioink containing 3% (w/v) sodium alginate and a cell concentration of 2 × 10⁶ cells/mL, shown in Figure 4c, within 60-min printing, there is only a 13% decrease in the cell concentration at the top region, demonstrating that only 13% of the cells have left the top region and sedimented to lower positions. Meanwhile, there is only a 17% increase in the cell concentration at the bottom, resulting in the cell concentration increase from 2 × 10⁶ cells/mL to 2.34 × 10⁶ cells/mL. Therefore, despite the effect of cell sedimentation, the cell distribution within the bioink reservoir using 1.5% and 3% (w/v) sodium alginate is still maintained at a relatively high level, while the uniformity of the cell distribution within the bioink composed of 0.5% (w/v) sodium alginate is significantly reduced. In addition, from the comparison of the standard deviation shown in Figure 2, Figure 3 and Figure 4, it is obvious that the standard deviation in Figure 2 is far larger than that in Figure 3 and Figure 4, indicating a larger discrepancy using 0.5% (w/v) sodium alginate, especially after long-time printing. However, the cell concentration at the middle region remains relatively constant due to the consistent receiving cells from the upper regions despite its loss of cells. To conclude, when using the bioink composed of low polymer concentrations such as 0.5% (w/v), there is a huge non-uniformity of the cell distribution within the bioink reservoir, which is mainly due to cell sedimentation. However, for the bioink composed of higher polymer concentrations such as 3% (w/v) sodium alginate, a much more uniform cell distribution is maintained since higher polymer concentration provides stronger resistance against cell sedimentation.

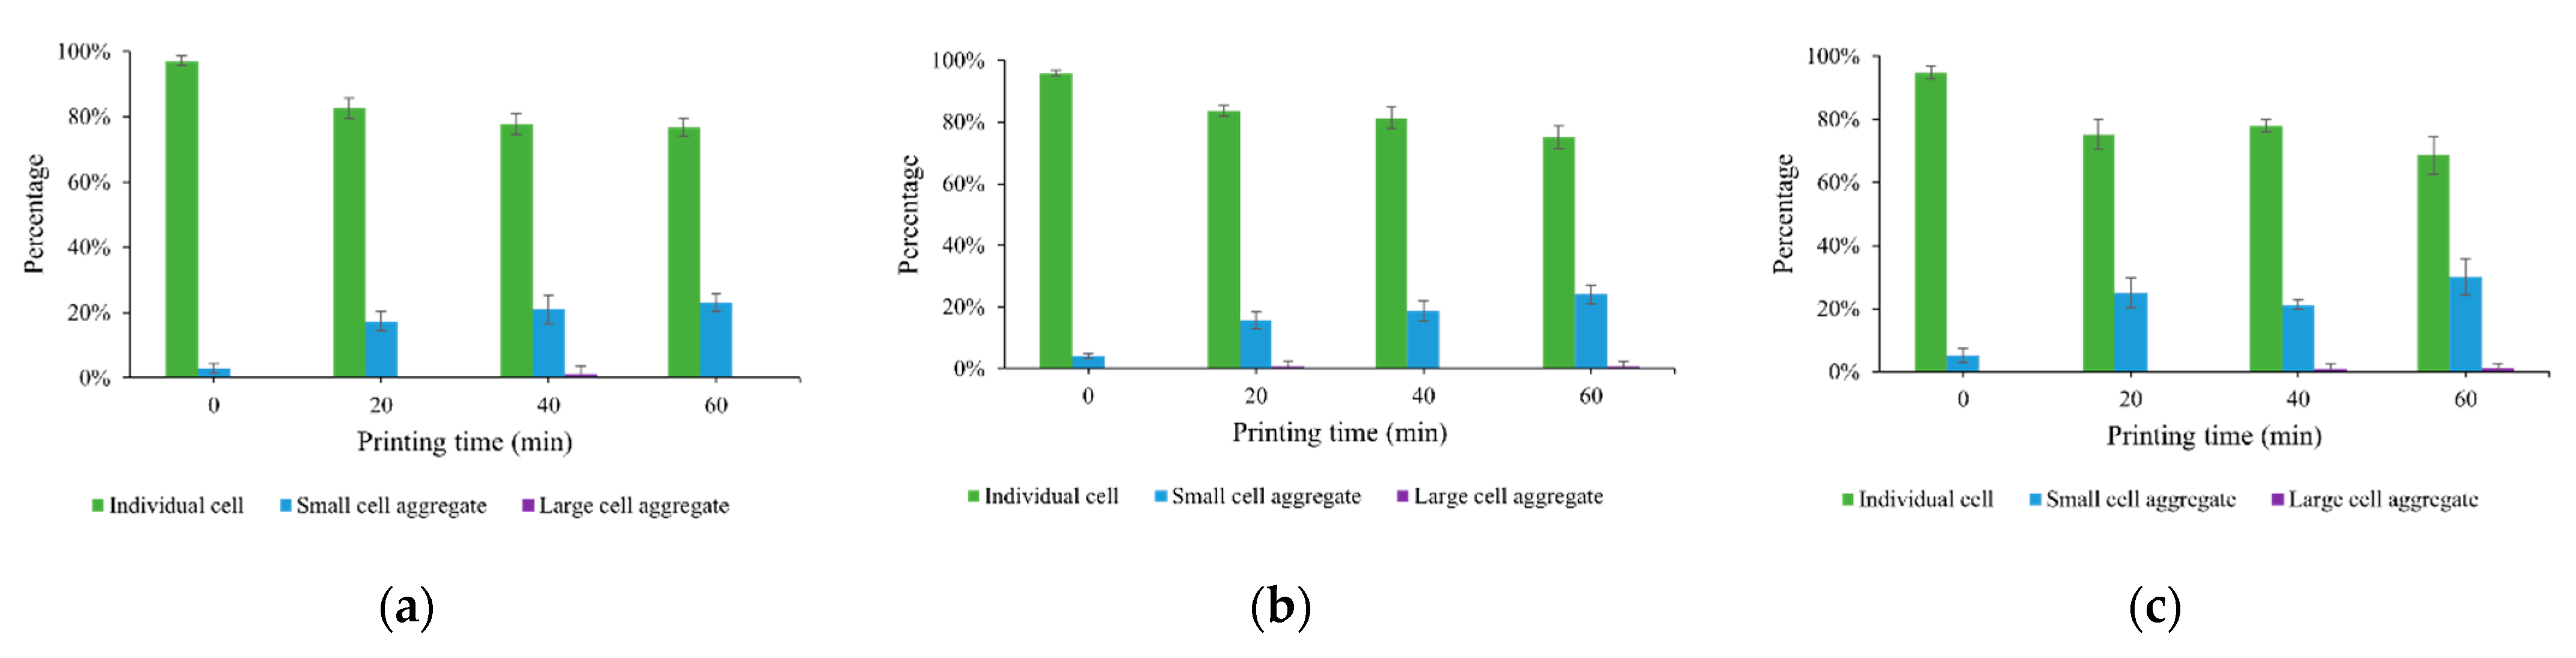
3.2. Cell Aggregation Due to Cell Sedimentation

As printing proceeds, cells are accumulating at the bottom of the bioink reservoir due to cell sedimentation. Similar to the change in cell concentration, due to the loss of cells at the top region, the difficulty of forming cell aggregates is increased. However, due to the accumulation of cells at the bottom, the probability of cell aggregation is increased. During the printing process, the bioink at the bottom of the bioink reservoir is firstly provided to the inkjet nozzle for the formation of cell-laden droplets. Therefore, the cell aggregation at the bottom where cell concentration consistently increases due to the cell sedimentation is the most critical. These formed cell aggregates, especially the large sized cell aggregates, may fully change the overall printing performance (e.g., by changing the droplet formation and the post-printing cell distribution). In this section, cell aggregation at the bottom of the bioink reservoir after different printing time is characterized using the bioink composed of three levels of polymer concentration and cell concentration, respectively.
Figure 5, Figure 6 and Figure 7 representatively shows the cell aggregation percentage at the bottom and different printing time using the bioink composed of 0.5%, 1%, and 1.5% (w/v) sodium alginate, respectively. The cell sedimentation velocity is inversely correlated with polymer concentration. Therefore, with the same initial cell concentration, the cell number at the bottom is also inversely correlated with polymer concentration at the same printing time, and thus cell aggregation is facilitated by a lower polymer concentration and suppressed by a higher polymer concentration. For example, with an initial cell concentration of 1.5 × 10⁶ cells/mL, 70% of the cells at the bottom region remain individual using 0.5% (w/v) sodium alginate at 40-min printing, however, this value increases to 76.4% and 81.3% for 1.5% and 3% (w/v) sodium alginate, respectively. In addition to the facilitation on cell aggregation using small polymer concentrations, cell aggregation phenomenon becomes more severe for a higher cell concentration. For example, using the bioink composed of 0.5% (w/v) sodium alginate and a cell concentration of 2 × 10⁶ cells/mL, there are only 37.1% of the cells at the bottom region still existing as individual cells after 60-min printing compared to 42.7% for a cell concentration of 1.5 × 10⁶ cells/mL and 49.3% for a cell concentration of 1 × 10⁶ cells/mL. In addition, 18.4% of the cells have already become large cell aggregates for 2 × 10⁶ cells/mL, while this value is only 11.8% and 9.2% for a cell concentration of 1.5 × 10⁶ cells/mL and 1 × 10⁶ cells/mL, respectively. Cell aggregates gradually form with the printing time using 1.5% and 3% (w/v) sodium alginate. However, most of the cell aggregates are small cell aggregates composed of 2–4 individual cells with rare large cell aggregates observed. Within a printing time of 60 min, only 1.45% and 1.2% of the cells at the bottom are forming large cell aggregates for 1.5% and 3% (w/v) sodium alginate using the bioink with 2 × 10⁶ cells/mL cell concentration, respectively. Clearly, within a 60-min printing time, polymer concentration has a more significant effect on cell aggregation within the selected parameters. However, if higher cell concentrations are selected (such as ~107 cells/mL) for 3D bioprinting, cell concentration may have a higher impact on cell aggregation due to the significant reduction in cell–cell distance.
Generally, the cell sedimentation and cell aggregation phenomenon become more severe with longer printing time, and the effect of cell aggregation on the printing performance becomes more significant when the bioink with a low viscosity is selected for 3D bioprinting. Specifically, with more cells accumulating at the bottom and adhering together to form cell aggregates with larger sizes, the printing reliability (e.g., the droplet formation process during inkjet-based bioprinting) may become highly unstable, and the printing quality (e.g., the post-printing cell distribution) may be dramatically decreased. Meanwhile, when the size of the cell aggregates becomes comparable to that of the inkjet-dispenser (e.g., 120 µm), the inkjet nozzle is blocked, and jetting is discontinued. Recently, researchers have commenced studies focusing on the mitigation of cell sedimentation and aggregation. Generally, there have been two main directions, including the addition of biocompatible materials and consistently stirring the bioink during the printing process [38]. For example, Chahal et al. attempted to mitigate cell sedimentation and maintain the stability of cell suspensions by adding Ficoll PM400 [26]. It was reported that by adding a percentage of 10% to 15% Ficoll PM400, cells reached a neutral buoyancy state and cell sedimentation was greatly suppressed. Parsa et al. continuously stirred the bioink within the bioink reservoir during the printing process and successfully maintained the uniformity of the cell distribution [27]. Even though both approaches have been reported to be effective on the mitigation of cell sedimentation and aggregation, they also have their limitations. For example, for the first approach attempting to mitigate cell sedimentation by adding biocompatible materials may only work well for one specific cell type. When heterogeneous cell types are suspended within the bioink for the bioprinting of a construct with complexities, this approach may not be effective on the mitigation of cell sedimentation and aggregation of other cell types [38]. Meanwhile, for the second approach of consistently stirring the bioink reservoir during the printing process, the cell viability has been reported to reduce [27]. To conclude, existing approaches have limitations on the mitigation of cell sedimentation and the resulting cell aggregation. Therefore, a more effective approach to better mitigate cell sedimentation and improve the printing performance is necessary. For the future potential approaches, they should hold attributes such as the ability to accommodate multiple cell types and maintain the cellular activities such as cell viability and proliferation and differentiation ability.

4. Conclusions

This study primarily quantifies cell sedimentation-induced cell concentration change and cell aggregation during inkjet-based bioprinting. Three concentrations of sodium alginate including 0.5%, 1.5%, and 3% (w/v) are mixed with 3T3 fibroblasts to prepare the bioink with three levels of cell concentrations: 1, 1.5, and 2 × 10⁶ cells/mL. The cell concentration at the top, middle, and bottom region of the bioink reservoir is measured after 20-, 40-, and 60-min printing time, respectively; and the percentage of cells forming cell aggregates at the bottom is characterized after 20-, 40-, and 60-min printing time, respectively. The major conclusions are summarized as follows: (1) with 0.5% (w/v) sodium alginate, after around 40-min printing time, almost all the cells have sedimented from the top region. In addition, due to the cell accumulation at the bottom of the bioink reservoir, the cell concentration is more than doubled after 60-min printing time. On the contrary, due to the slow cell sedimentation velocity with 1.5% and 3% (w/v) sodium alginate, the uniformity of the bioink is still highly maintained after 60-min printing, where the least difference is between the cell concentration of 0.91 × 10⁶ cells/mL at the top and 1.11 × 10⁶ cells/mL at the bottom using 3% (w/v) sodium alginate; (2) more cell aggregates are observed at the bottom as printing time increases, and severe cell aggregation phenomenon has been observed at the bottom using 0.5% (w/v) sodium alginate starting from 40-min printing time. With the highest cell concentration 2 × 10⁶ cells/mL, 60.9% of the cells have formed cell aggregates at 40-min printing time compared to 4.3% at 0-min printing time. However, cell aggregation is dramatically suppressed by increasing the polymer concentration. With 3% (w/v) sodium alginate, only 31.4% of the cells at the bottom form cell aggregates at 60-min printing time. Cell sedimentation and aggregation have been broadly recognized as critical challenges significantly affecting the printing performance during 3D bioprinting. The investigation of the consequences of cell sedimentation (e.g., cell concentration change and cell aggregation) are critical to better understand the cell sedimentation and aggregation mechanism. Future work may include a more detailed study on the effect of cell sedimentation and the resulting aggregation on the printing performance by investigating their effects on the droplet formation process and post-printing cell distribution.

Author Contributions

Conceptualization, H.X. and C.X.; Methodology, H.X. and C.X.; Formal Analysis, D.M.M.S. and H.X.; Writing—Original Draft Preparation, H.X.; Writing—Review & Editing, C.X. and H.X.; Supervision, C.X.; Project Administration, C.X. All authors have read and agreed to the published version of the manuscript.

Funding

This research received no external funding.

Institutional Review Board Statement

Not applicable.

Informed Consent Statement

Not applicable.

Data Availability Statement

Data available on request from the corresponding author.

Conflicts of Interest

The authors declare no conflict of interest.

References

  1. Murphy, S.V.; Atala, A. 3D bioprinting of tissues and organs. Nat. Biotechnol. 2014, 32, 773–785. [Google Scholar] [CrossRef] [PubMed]
  2. Zhang, B.; Luo, Y.; Ma, L.; Gao, L.; Li, Y.; Xue, Q.; Yang, H.; Cui, Z. 3D bioprinting: An emerging technology full of opportunities and challenges. Bio-Des. Manuf. 2018, 1, 2–13. [Google Scholar] [CrossRef]
  3. Gungor-Ozkerim, P.S.; Inci, I.; Zhang, Y.S.; Khademhosseini, A.; Dokmeci, M.R. Bioinks for 3D bioprinting: An overview. Biomater. Sci. 2018, 6, 915–946. [Google Scholar] [CrossRef] [PubMed] [Green Version]
  4. Ji, S.; Guvendiren, M. Recent advances in bioink design for 3D bioprinting of tissues and organs. Front. Bioeng. Biotechnol. 2017, 5, 23. [Google Scholar] [CrossRef] [Green Version]
  5. Wang, S.; Lee, J.M.; Yeong, W.Y. Smart hydrogels for 3D bioprinting. Int. J. Bioprint. 2015, 1, 3–14. [Google Scholar] [CrossRef] [Green Version]
  6. De Melo, B.A.; Jodat, Y.A.; Cruz, E.M.; Benincasa, J.C.; Shin, S.R.; Porcionatto, M.A. Strategies to use fibrinogen as bioink for 3D bioprinting fibrin-based soft and hard tissues. Acta Biomater. 2020, 117, 60–76. [Google Scholar] [CrossRef]
  7. Lee, A.; Hudson, A.; Shiwarski, D.; Tashman, J.; Hinton, T.; Yerneni, S.; Bliley, J.; Campbell, P.; Feinberg, A. 3D bioprinting of collagen to rebuild components of the human heart. Science 2019, 365, 482–487. [Google Scholar] [CrossRef]
  8. Xin, S.; Chimene, D.; Garza, J.E.; Gaharwar, A.K.; Alge, D.L. Clickable PEG hydrogel microspheres as building blocks for 3D bioprinting. Biomater. Sci. 2019, 7, 1179–1187. [Google Scholar] [CrossRef]
  9. Narayanan, L.K.; Huebner, P.; Fisher, M.B.; Spang, J.T.; Starly, B.; Shirwaiker, R.A. 3D-bioprinting of polylactic acid (PLA) nanofiber–alginate hydrogel bioink containing human adipose-derived stem cells. ACS Biomater. Sci. Eng. 2016, 2, 1732–1742. [Google Scholar] [CrossRef]
  10. Garreta, E.; Oria, R.; Tarantino, C.; Pla-Roca, M.; Prado, P.; Fernandez-Aviles, F.; Campistol, J.M.; Samitier, J.; Montserrat, N. Tissue engineering by decellularization and 3D bioprinting. Mater. Today 2017, 20, 166–178. [Google Scholar] [CrossRef] [Green Version]
  11. Gaebel, R.; Ma, N.; Liu, J.; Guan, J.; Koch, L.; Klopsch, C.; Gruene, M.; Toelk, A.; Wang, W.; Mark, P. Patterning human stem cells and endothelial cells with laser printing for cardiac regeneration. Biomaterials 2011, 32, 9218–9230. [Google Scholar] [CrossRef]
  12. Cubo, N.; Garcia, M.; Del Canizo, J.F.; Velasco, D.; Jorcano, J.L. 3D bioprinting of functional human skin: Production and in vivo analysis. Biofabrication 2016, 9, 015006. [Google Scholar] [CrossRef] [PubMed] [Green Version]
  13. Duan, B.; Hockaday, L.A.; Kang, K.H.; Butcher, J.T. 3D bioprinting of heterogeneous aortic valve conduits with alginate/gelatin hydrogels. J. Biomed. Mater. Res. Part A 2013, 101, 1255–1264. [Google Scholar] [CrossRef] [PubMed] [Green Version]
  14. Li, J.; Chen, M.; Fan, X.; Zhou, H. Recent advances in bioprinting techniques: Approaches, applications and future prospects. J. Transl. Med. 2016, 14, 1–15. [Google Scholar] [CrossRef] [Green Version]
  15. Nakamura, M.; Kobayashi, A.; Takagi, F.; Watanabe, A.; Hiruma, Y.; Ohuchi, K.; Iwasaki, Y.; Horie, M.; Morita, I.; Takatani, S. Biocompatible inkjet printing technique for designed seeding of individual living cells. Tissue Eng. 2005, 11, 1658–1666. [Google Scholar] [CrossRef]
  16. Ozbolat, I.T.; Hospodiuk, M. Current advances and future perspectives in extrusion-based bioprinting. Biomaterials 2016, 76, 321–343. [Google Scholar] [CrossRef] [PubMed] [Green Version]
  17. Xiong, R.; Zhang, Z.; Chai, W.; Chrisey, D.B.; Huang, Y. Study of gelatin as an effective energy absorbing layer for laser bioprinting. Biofabrication 2017, 9, 024103. [Google Scholar] [CrossRef]
  18. Wang, Z.; Abdulla, R.; Parker, B.; Samanipour, R.; Ghosh, S.; Kim, K. A simple and high-resolution stereolithography-based 3D bioprinting system using visible light crosslinkable bioinks. Biofabrication 2015, 7, 045009. [Google Scholar] [CrossRef]
  19. Gudapati, H.; Dey, M.; Ozbolat, I. A comprehensive review on droplet-based bioprinting: Past, present and future. Biomaterials 2016, 102, 20–42. [Google Scholar] [CrossRef] [Green Version]
  20. Li, X.; Liu, B.; Pei, B.; Chen, J.; Zhou, D.; Peng, J.; Zhang, X.; Jia, W.; Xu, T. Inkjet bioprinting of biomaterials. Chem. Rev. 2020, 120, 10793–10833. [Google Scholar] [CrossRef]
  21. Xu, H.; Casillas, J.; Xu, C. Effects of printing conditions on cell distribution within microspheres during inkjet-based bioprinting. AIP Adv. 2019, 9, 095055. [Google Scholar] [CrossRef]
  22. Saunders, R.E.; Gough, J.E.; Derby, B. Delivery of human fibroblast cells by piezoelectric drop-on-demand inkjet printing. Biomaterials 2008, 29, 193–203. [Google Scholar] [CrossRef] [PubMed]
  23. Saunders, R.E.; Derby, B. Inkjet printing biomaterials for tissue engineering: Bioprinting. Int. Mater. Rev. 2014, 59, 430–448. [Google Scholar] [CrossRef]
  24. Xu, H.; Zhang, Z.; Xu, C. Sedimentation study of bioink containing living cells. J. Appl. Phys. 2019, 125, 114901. [Google Scholar] [CrossRef]
  25. Sendekie, Z.B.; Bacchin, P. Colloidal jamming dynamics in microchannel bottlenecks. Langmuir 2016, 32, 1478–1488. [Google Scholar] [CrossRef] [Green Version]
  26. Chahal, D.; Ahmadi, A.; Cheung, K.C. Improving piezoelectric cell printing accuracy and reliability through neutral buoyancy of suspensions. Biotechnol. Bioeng. 2012, 109, 2932–2940. [Google Scholar] [CrossRef] [PubMed]
  27. Parsa, S.; Gupta, M.; Loizeau, F.; Cheung, K.C. Effects of surfactant and gentle agitation on inkjet dispensing of living cells. Biofabrication 2010, 2, 025003. [Google Scholar] [CrossRef]
  28. Zhang, Z.; Xu, C.; Xiong, R.; Chrisey, D.B.; Huang, Y. Effects of living cells on the bioink printability during laser printing. Biomicrofluidics 2017, 11, 034120. [Google Scholar] [CrossRef]
  29. Adhikari, J.; Roy, A.; Das, A.; Ghosh, M.; Thomas, S.; Sinha, A.; Kim, J.; Saha, P. Effects of processing parameters of 3D bioprinting on the cellular activity of bioinks. Macromol. Biosci. 2021, 21, 2000179. [Google Scholar] [CrossRef]
  30. Pepper, M.E.; Seshadri, V.; Burg, T.; Booth, B.W.; Burg, K.J.; Groff, R.E. Cell settling effects on a thermal inkjet bioprinter. In Proceedings of the 2011 Annual International Conference of the IEEE Engineering in Medicine and Biology Society, Boston, MA, USA, 30 August–3 September 2011; pp. 3609–3612. [Google Scholar]
  31. Lee, A.; Sudau, K.; Ahn, K.H.; Lee, S.J.; Willenbacher, N. Optimization of experimental parameters to suppress nozzle clogging in inkjet printing. Ind. Eng. Chem. Res. 2012, 51, 13195–13204. [Google Scholar] [CrossRef]
  32. Ringeisen, B.R.; Othon, C.M.; Barron, J.A.; Young, D.; Spargo, B.J. Jet-based methods to print living cells. Biotechnol. J. Healthc. Nutr. Technol. 2006, 1, 930–948. [Google Scholar] [CrossRef] [PubMed]
  33. Schwab, A.; Levato, R.; D’Este, M.; Piluso, S.; Eglin, D.; Malda, J. Printability and shape fidelity of bioinks in 3D bioprinting. Chem. Rev. 2020, 120, 11028–11055. [Google Scholar] [CrossRef] [PubMed]
  34. Axpe, E.; Oyen, M.L. Applications of alginate-based bioinks in 3D bioprinting. Int. J. Mol. Sci. 2016, 17, 1976. [Google Scholar] [CrossRef] [Green Version]
  35. Zhang, M.; Krishnamoorthy, S.; Song, H.; Zhang, Z.; Xu, C. Ligament flow during drop-on-demand inkjet printing of bioink containing living cells. J. Appl. Phys. 2017, 121, 124904. [Google Scholar] [CrossRef]
  36. Xu, C.; Chai, W.; Huang, Y.; Markwald, R.R. Scaffold-free inkjet printing of three-dimensional zigzag cellular tubes. Biotechnol. Bioeng. 2012, 109, 3152–3160. [Google Scholar] [CrossRef]
  37. Xu, C.; Zhang, M.; Huang, Y.; Ogale, A.; Fu, J.; Markwald, R.R. Study of droplet formation process during drop-on-demand inkjetting of living cell-laden bioink. Langmuir 2014, 30, 9130–9138. [Google Scholar] [CrossRef] [PubMed]
  38. Xu, H.; Liu, J.; Zhang, Z.; Xu, C. Cell sedimentation during 3D bioprinting: A mini review. Bio-Des. Manuf. 2022, 1–10. [Google Scholar] [CrossRef]
Figure 1. Experimental setup.
Machines 10 00315 g001
Figure 2. Cell concentrations measured at different regions after different printing time using the bioink composed of 0.5% (w/v) sodium alginate and a cell concentration of (a) 1 × 10⁶ cells/mL, (b) 1.5 × 10⁶ cells/mL, and (c) 2 × 10⁶ cells/mL.
Machines 10 00315 g002
Figure 3. Cell concentrations measured at different regions after different printing time using the bioink composed of 1.5% (w/v) sodium alginate and a cell concentration of (a) 1 × 10⁶ cells/mL, (b) 1.5 × 10⁶ cells/mL, and (c) 2 × 10⁶ cells/mL.
Machines 10 00315 g003
Figure 4. Cell concentrations measured at different regions after different printing time using the bioink composed of 3% (w/v) sodium alginate and a cell concentration of (a) 1 × 10⁶ cells/mL, (b) 1.5 × 10⁶ cells/mL, and (c) 2 × 10⁶ cells/mL.
Machines 10 00315 g004
Figure 5. Cell existing forms at the bottom of the bioink reservoir using the bioink composed of 0.5% (w/v) sodium alginate and a cell concentration of (a) 1 × 10⁶ cells/mL, (b) 1.5 × 10⁶ cells/mL, and (c) 2 × 10⁶ cells/mL.
Machines 10 00315 g005
Figure 6. Cell existing forms at the bottom of the bioink reservoir using the bioink composed of 1.5% (w/v) sodium alginate and a cell concentration of (a) 1 × 10⁶ cells/mL, (b) 1.5 × 10⁶ cells/mL, and (c) 2 × 10⁶ cells/mL.
Machines 10 00315 g006
Figure 7. Cell existing forms at the bottom of the bioink reservoir using the bioink composed of 3% (w/v) sodium alginate and a cell concentration of (a) 1 × 10⁶ cells/mL, (b) 1.5 × 10⁶ cells/mL, and (c) 2 × 10⁶ cells/mL.
Machines 10 00315 g007
Publisher’s Note: MDPI stays neutral with regard to jurisdictional claims in published maps and institutional affiliations.

