Article

Modeling and Predicting the Machined Surface Roughness and Milling Power in Scot’s Pine Helical Milling Process

1
Co-Innovation Center of Efficient Processing and Utilization of Forest Resources, Nanjing Forestry University, Nanjing 210037, China
2
College of Furnishings and Industrial Design, Nanjing Forestry University, Nanjing 210037, China
3
Department of Wood and Forest Sciences, Laval University, Quebec City, QC G1V 0A6, Canada
*
Author to whom correspondence should be addressed.
Machines 2022, 10(5), 331; https://doi.org/10.3390/machines10050331
Submission received: 11 April 2022 / Revised: 29 April 2022 / Accepted: 30 April 2022 / Published: 1 May 2022

Abstract

:
Helical milling with the advantages of stable machining process, a well-machined surface quality, etc., is an interest of researchers and producers. Machined surface roughness (arithmetic mean deviation (Ra) and maximum height of the assessed profile (Rz)) and milling power consumption as two main machining characteristic parameters were studied and chosen as response factors to evaluate the machinability of Scots pine helical milling. Input variables included helical angle of milling cutter, rotation speed of main shaft, and depth of milling. Response surface methodology was applied for the design of experiments, data processing and analysis, and optimization of the processing parameters. The results showed that Ra and Rz decreased with an increase in helical angle and rotation speed of main shaft, though increased with an increase in depth of milling. Milling power increased when the helical angle and depth of milling increased and showed a slight downward trend as the rotational speed increased. The quadratic models were applied to predict the values of Ra, Rz, and milling power due to the high values of R2 of 0.9895, 0.9905, and 0.9885, respectively. The plot of predicted and actual values also indicated that the created models had good predictability. The optimized combination of helical angle, rotation speed, and depth of milling are 64°, 7500 r/min, and 0.5 mm, respectively. The effects of input variables and the quantitative relation between input variables and response variables were revealed clearly. These achievements will be useful for guiding the selection of helical milling parameters to achieve the purposes of improving processed surface quality and saving the processing power consumption.

1. Introduction

In the context of green manufacturing and “Industry 4.0”, intelligent, efficient, and low-carbon manufacturing have become the main goals of modern manufacturing industry [1]. Cutting is an important process for wooden products’ manufacturing and also one of the significant energy consuming links [2,3,4]. At the same time, the machined surface roughness is a significant criterion to evaluate the quality of processed wooden materials [5,6], because the aesthetic value of the wooden products is closely related to their characteristic of surface morphology [7,8], and the surface roughness has a direct effect on the performance of gluing and coating [9,10,11,12]. Helical milling, which has the advantages of high machined surface quality and cutting stability, has been concerned and studied [13,14,15,16]. The effects of helical milling parameters on machined Scots pine wood surface roughness and milling power consumption have not yet been revealed. Hence, the milling power consumption and surface quality during the helical milling process must be modeled and predicted. Additionally, it is essential to apply optimized machining parameters to reduce milling power and improve machined surface quality so as to realize the purpose of high efficiency and low consumption processing.
In recent years, researchers have focused on the cutting parameters’ optimization and modeling methodologies to reveal the variation trend of cutting forces, power consumption, processed surface roughness, etc., and the quantitative relation between input and output parameters in materials’ helical cutting processes [17,18,19]. The results of previous studies have showed that the helical cutting parameters had a significant influence on cutting forces, cutting power, and surface roughness [15,20]. For example, the specific cutting energy and cutting power consumption of medium density fiberboard increased with the helical angle increased, but decreased with the increase in milling depth [21]. In the wood planning, the planer tool’s helical edge with the values from 45° to 65° generated almost the same amount of cutting power as the conventional straight tools. However, the cutting power consumption increased gradually when the helical angle increased to 75° and 85° [22]. Therefore, the trend of cutting power consumption varies with the changes of processing parameters.
During the evaluation of materials machining properties, the indexes of Ra and Rz are widely applied [23]. In helical cutting processes, the input parameters have a direct influence on the machined surface quality [5]. The results of published works have indicated that the helical angle had most significant influence on Ra, followed by the spindle speed and depth of milling in wood plastic composites (WPCs)’s milling process. The increased helical angle resulted in a significant increase in Ra. However, the values of Ra decreased when the spindle speed increased [15]. During the stone–plastic composite (SPC) milling process, Ra tended to decrease with the increase in helical angle and spindle speed, but decrease with the decrease in feed rate and cutting depth [13]. A similar result of the effects of helical angle and depth of cutting on Ra were also achieved in luxury vinyl tiles (LVTs)’s milling process [14]. Due to the significant effects of input parameters on machined surface quality, it is essential to create a mathematical model to predict the surface roughness in the helical cutting process and to provide guidance for selecting reasonable processing parameters.
However, a suitable and accurate model and optimization method is hard to establish for predicting the surface quality and cutting power consumption [24]. In recent years, the artificial neural network (ANN) [25], neuro-fuzzy inference system (NFIS), improved particle swarm optimization (IPSO) algorithm [19,26], and response surface methodology (RSM) [27] have been normally adopted to describe the relationship between input and output parameters (such as cutting force, surface quality, cutting power, etc.). Those different methods all show ideal prediction accuracy in their own fields. Among them, RSM can establish a continuous variable surface model to evaluate the factors and their interactions that affect the machining process and to determine the optimal level range. Moreover, the number of experimental groups is relatively small, which has the advantage of significantly saving manpower and material resources. However, up until now, there has been no complete mathematical model for predicting the milling power and surface roughness of solid wood in helical milling, especially for Scots pine (Pinus sylvestris L.).
In this study, the helical angle of milling cutter (λ), rotation speed of main shaft (n), and depth of milling (h) were selected as input processing parameters, and the RSM was chosen to arrange the experiments. The effects of input parameters on milling power consumption and surface roughness will be analyzed, then the mathematical model will be created to evaluate the relationship between the input parameters and response parameters. It will provide a solution to reveal the variation trend of surface quality and milling power, and determine the reasonable processing parameters for solid wood helical milling.

2. Materials and Methods

2.1. Materials

All the samples were prepared from the sapwood of Scots pine (Pinus sylvestris L.) logs and then dried to a moisture content of about 11%. The size of samples for milling experiments was 120 mm × 80 mm × 18 mm (Longitudinal × Tangential × radial). In total, 85 samples were prepared for the milling experiments to meet the requirement of 5 repetitions for each group. Meanwhile, the density, modulus of rupture, modulus of elasticity, and moisture content of Scots pine wood were tested by Chinese standards of GB/T1933-2009, GB/T1936.1-2009, GB/T1936.2-2009, and GB/T1931-2009, respectively. Moreover, the detailed results for these properties were shown in Table 1.

2.2. Experimental Setup

Up-milling was chosen in this study, which was performed on a computerized numerical control milling center (MGK01, Nanxing Machinery Co. Ltd., Dongguan, China). The maximum values of the main parameters of feed rate and spindle rotation speed are 50 m/min and 24,000 r/min, respectively. The surface roughness of Ra and Rz, which is applied to describe the quality of milled wood surface, was measured by a surface topography profilometer (DSX510, Olympus, Co. Lt., Tokyo, Japan). The test area is located in the middle of milled surface, with a sampling length of 10 mm. The test direction is parallel to the wood fiber direction and also parallel to the milling feed direction. Each surface roughness test was repeated five times; the meaning value of these five results was chosen to estimate the surface roughness. The dynamic power change at different cutting stages was recorded by a three-phase power analyzer with a maximum sampling frequency of 50 KHz (AN87300, Ainuo Co., Ltd., Qingdao, China). Referring to existing literatures, the milling power is equal to the power in the cutting phase minus the power in the unloading operation phase [21,28].

2.3. Design of Experiments

In the present study, Box–Behnken Design (BBD) of RSM was selected for the experimental design as well as data analysis and processing parameters’ optimization. To obtain as high surface quality and as lower milling power consumption as possible simultaneously, helical angle of milling cutter, main shaft rotation speed, and depth of milling were chosen as the input variables, while Ra, Rz, and milling power consumption were the response variables. These three input parameters and their ranges were selected by a preliminary test, previous studies, and actual processing requirements [28,29]. The detailed levels of those input variables are presented in Table 2. Both the analysis of experimental data and the illustrative figures were accomplished by using Design-Expert (Version 12.0.1.0, Stat-Ease, Inc., Minneapolis, MN, USA) software. Equation (1) [28,30] was employed to obtain the interactive effects between the input and response variables.
Y = b 0 + i = 1 k b i X i + i , j k b i j X i X j + i = 1 k b i i X i 2
where Y represents the predicted response parameters, while Xi and Xj represent the input variables. The term of b0 is the constant coefficient and the terms of bii, bij are the interaction coefficients. The quality of the fitted models was assessed by the correlation coefficient (R2). F-value (Fisher variation ratio) and probability value (Prob > F) are the two main indexes indicating the significance and adequacy of the created models.

3. Results and Discussion

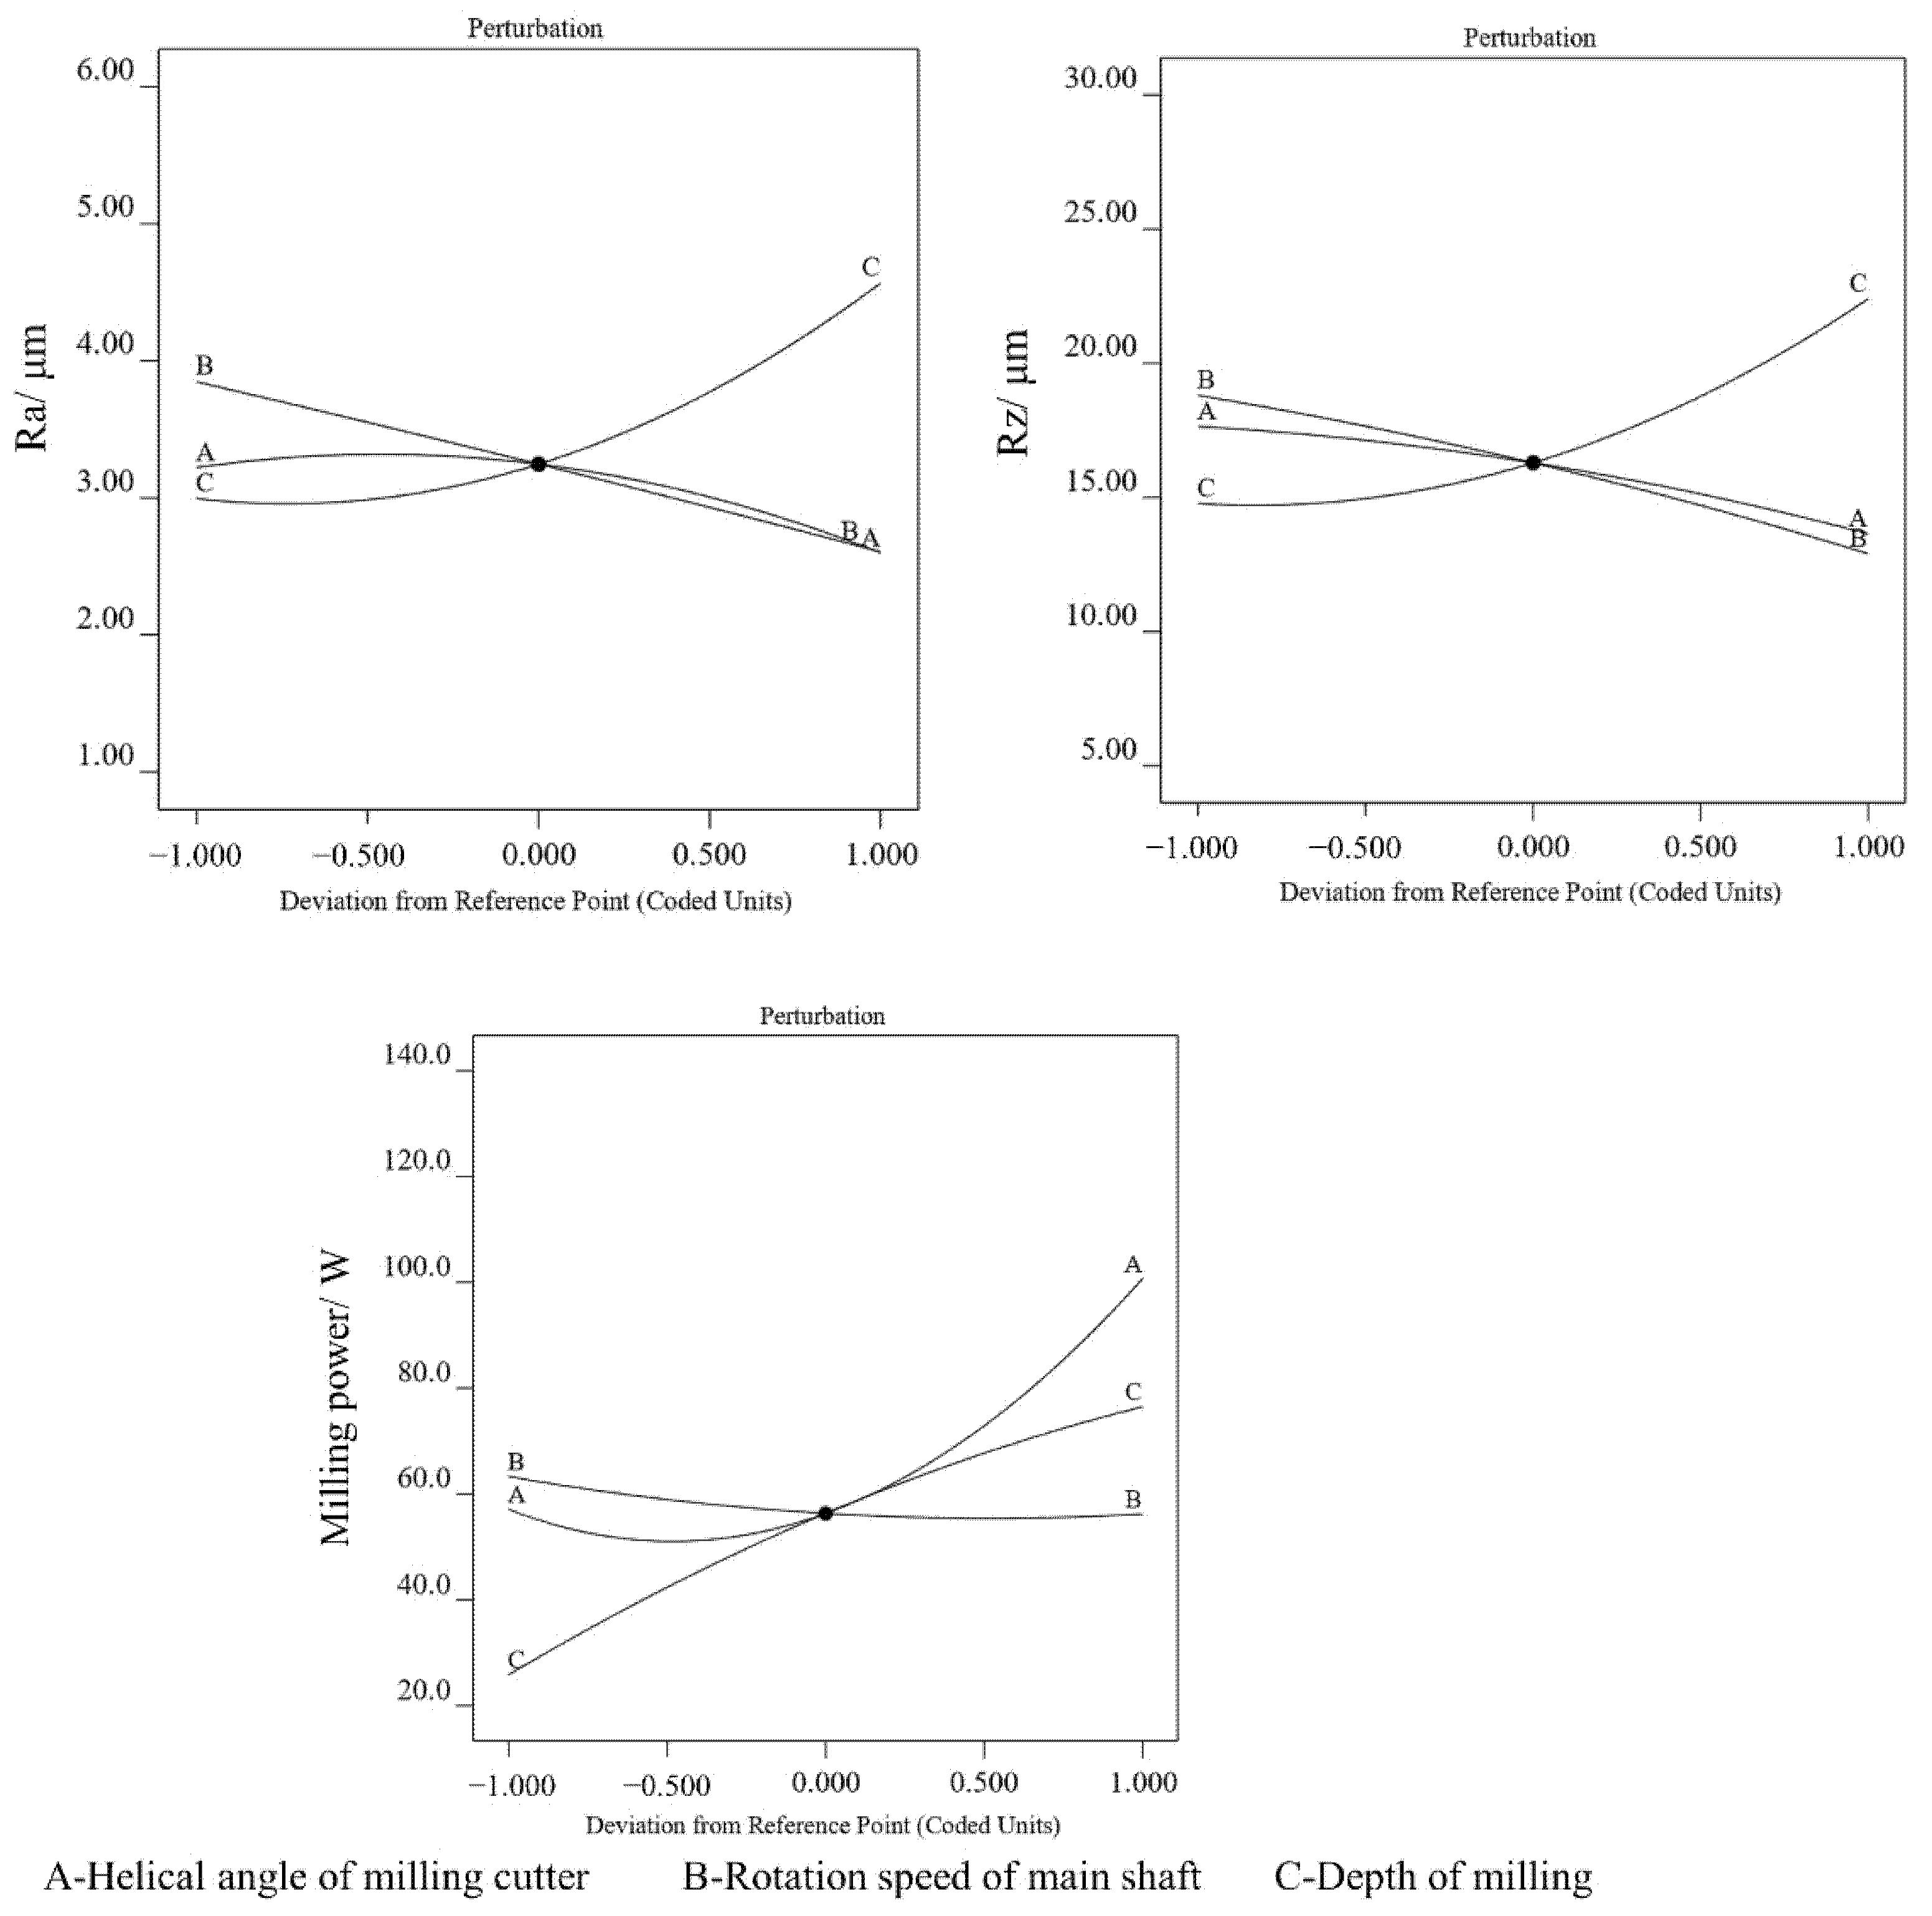
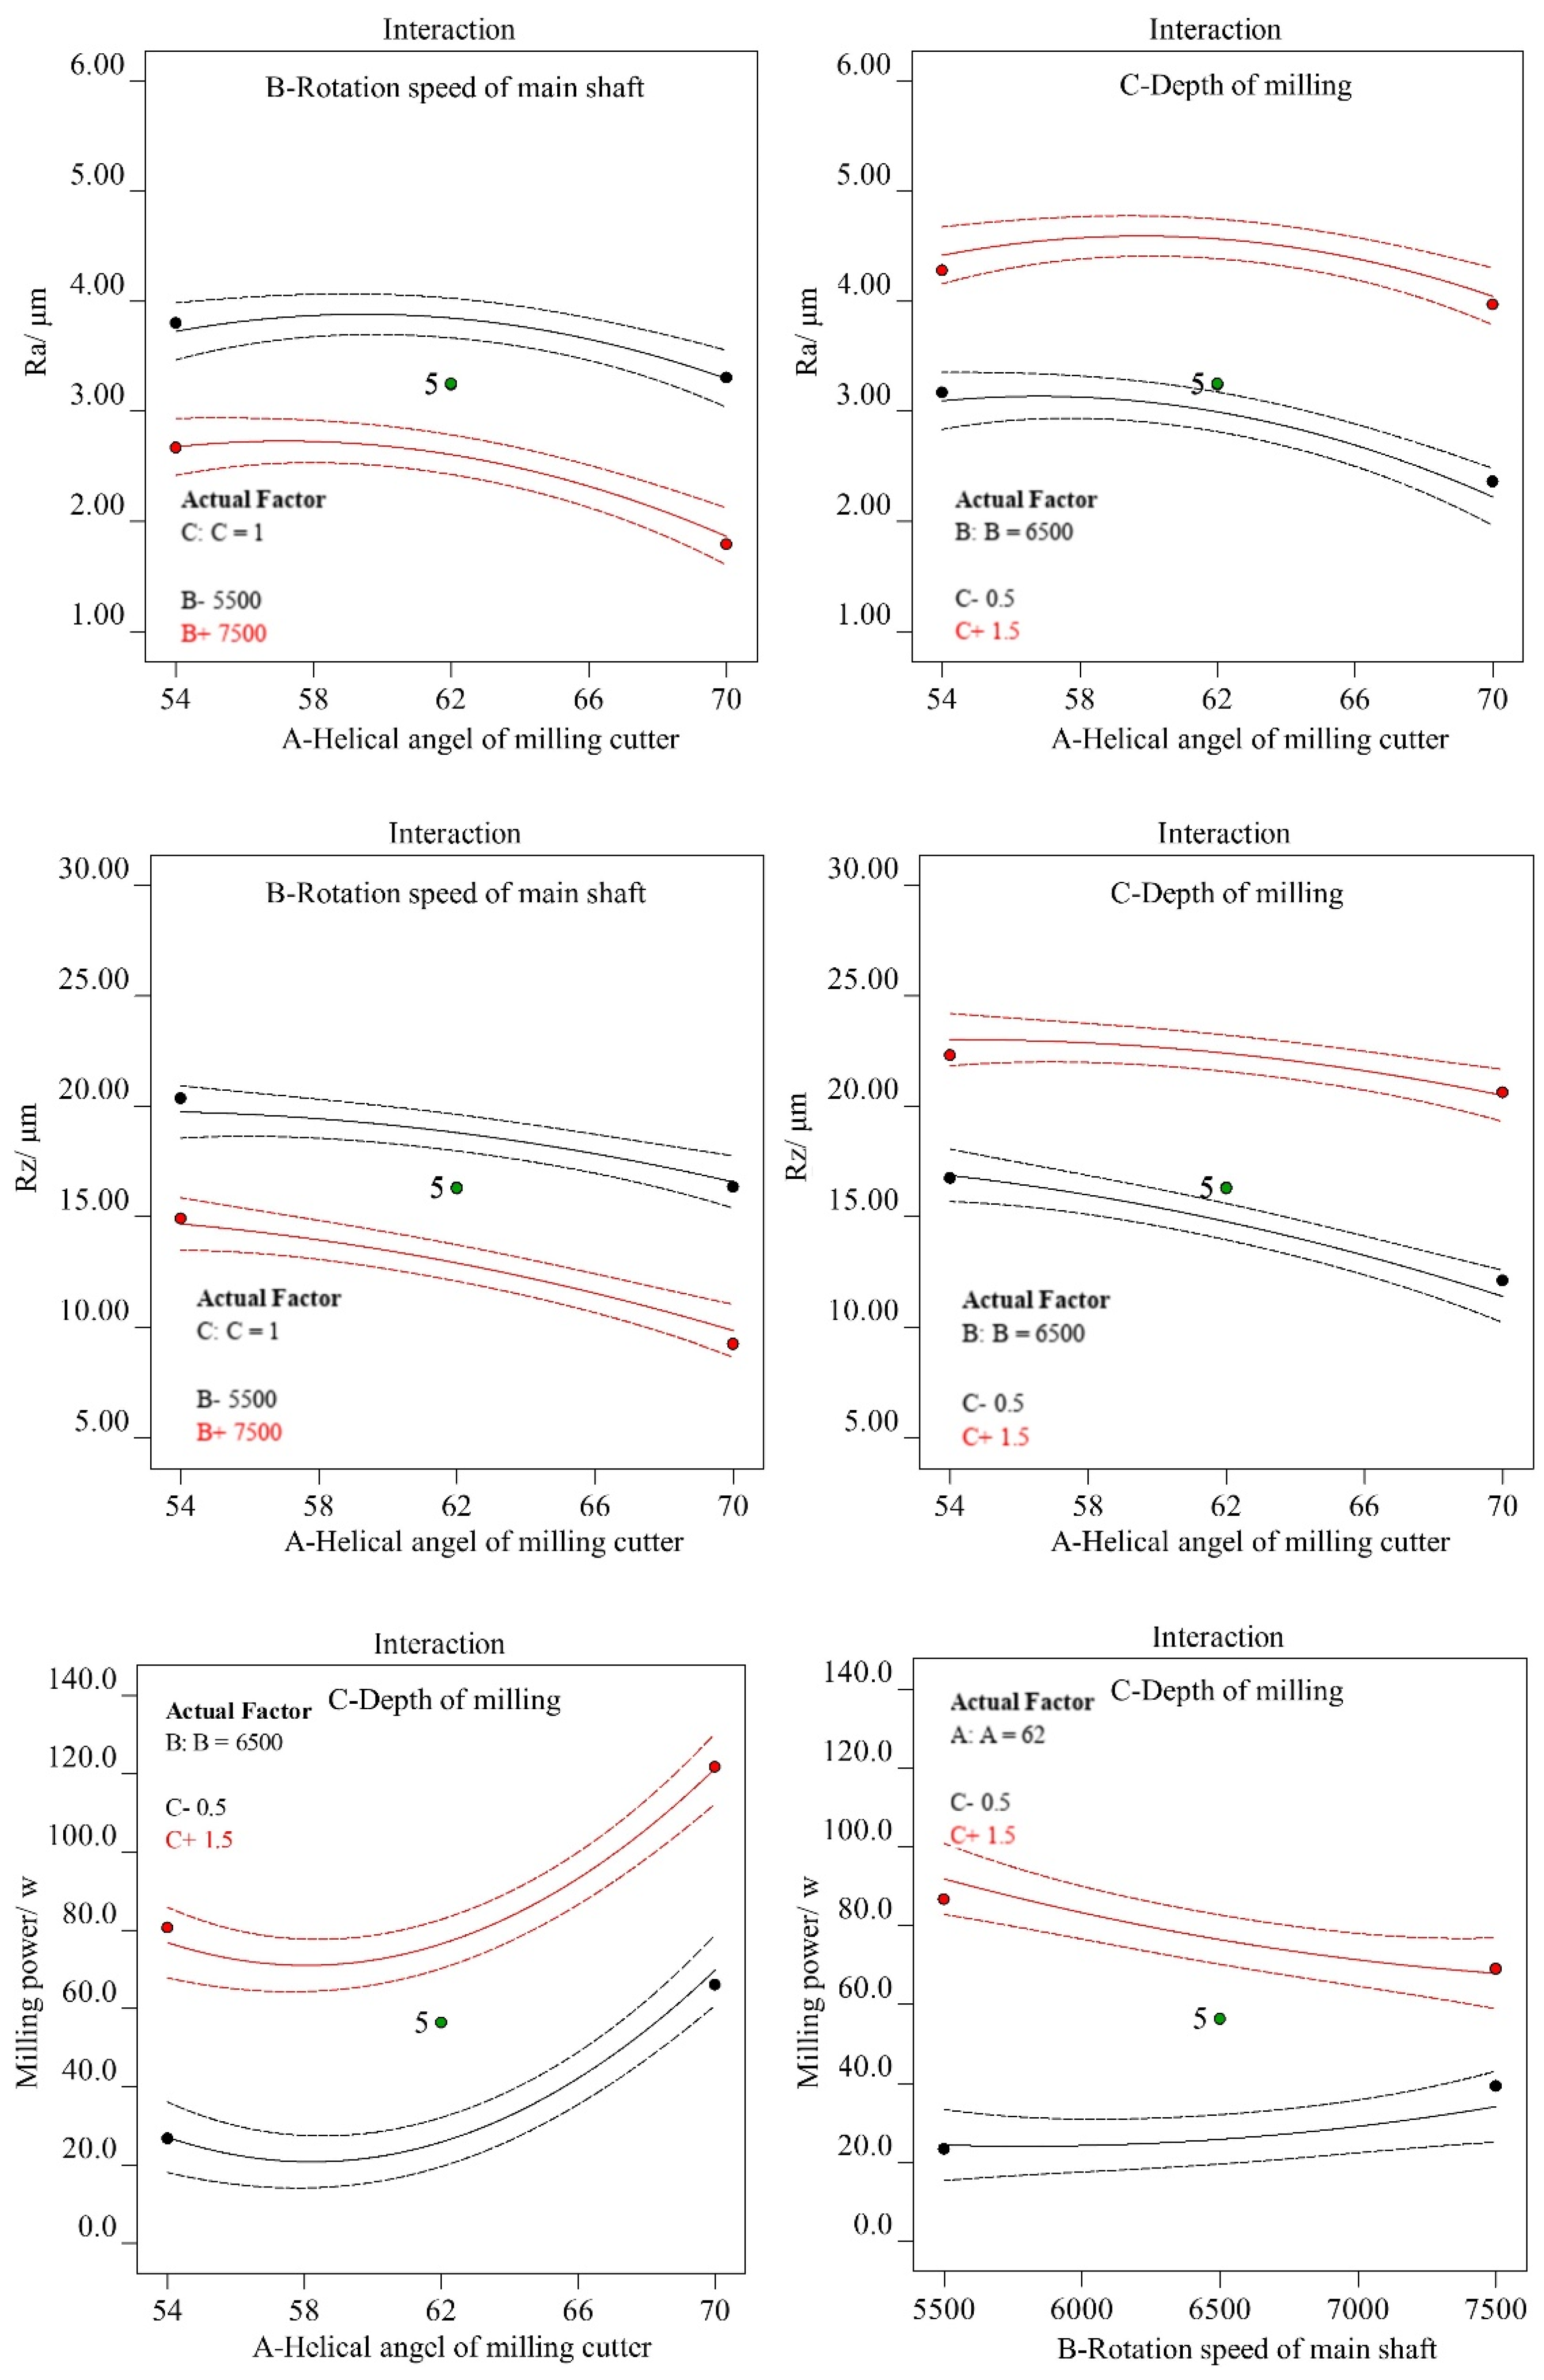
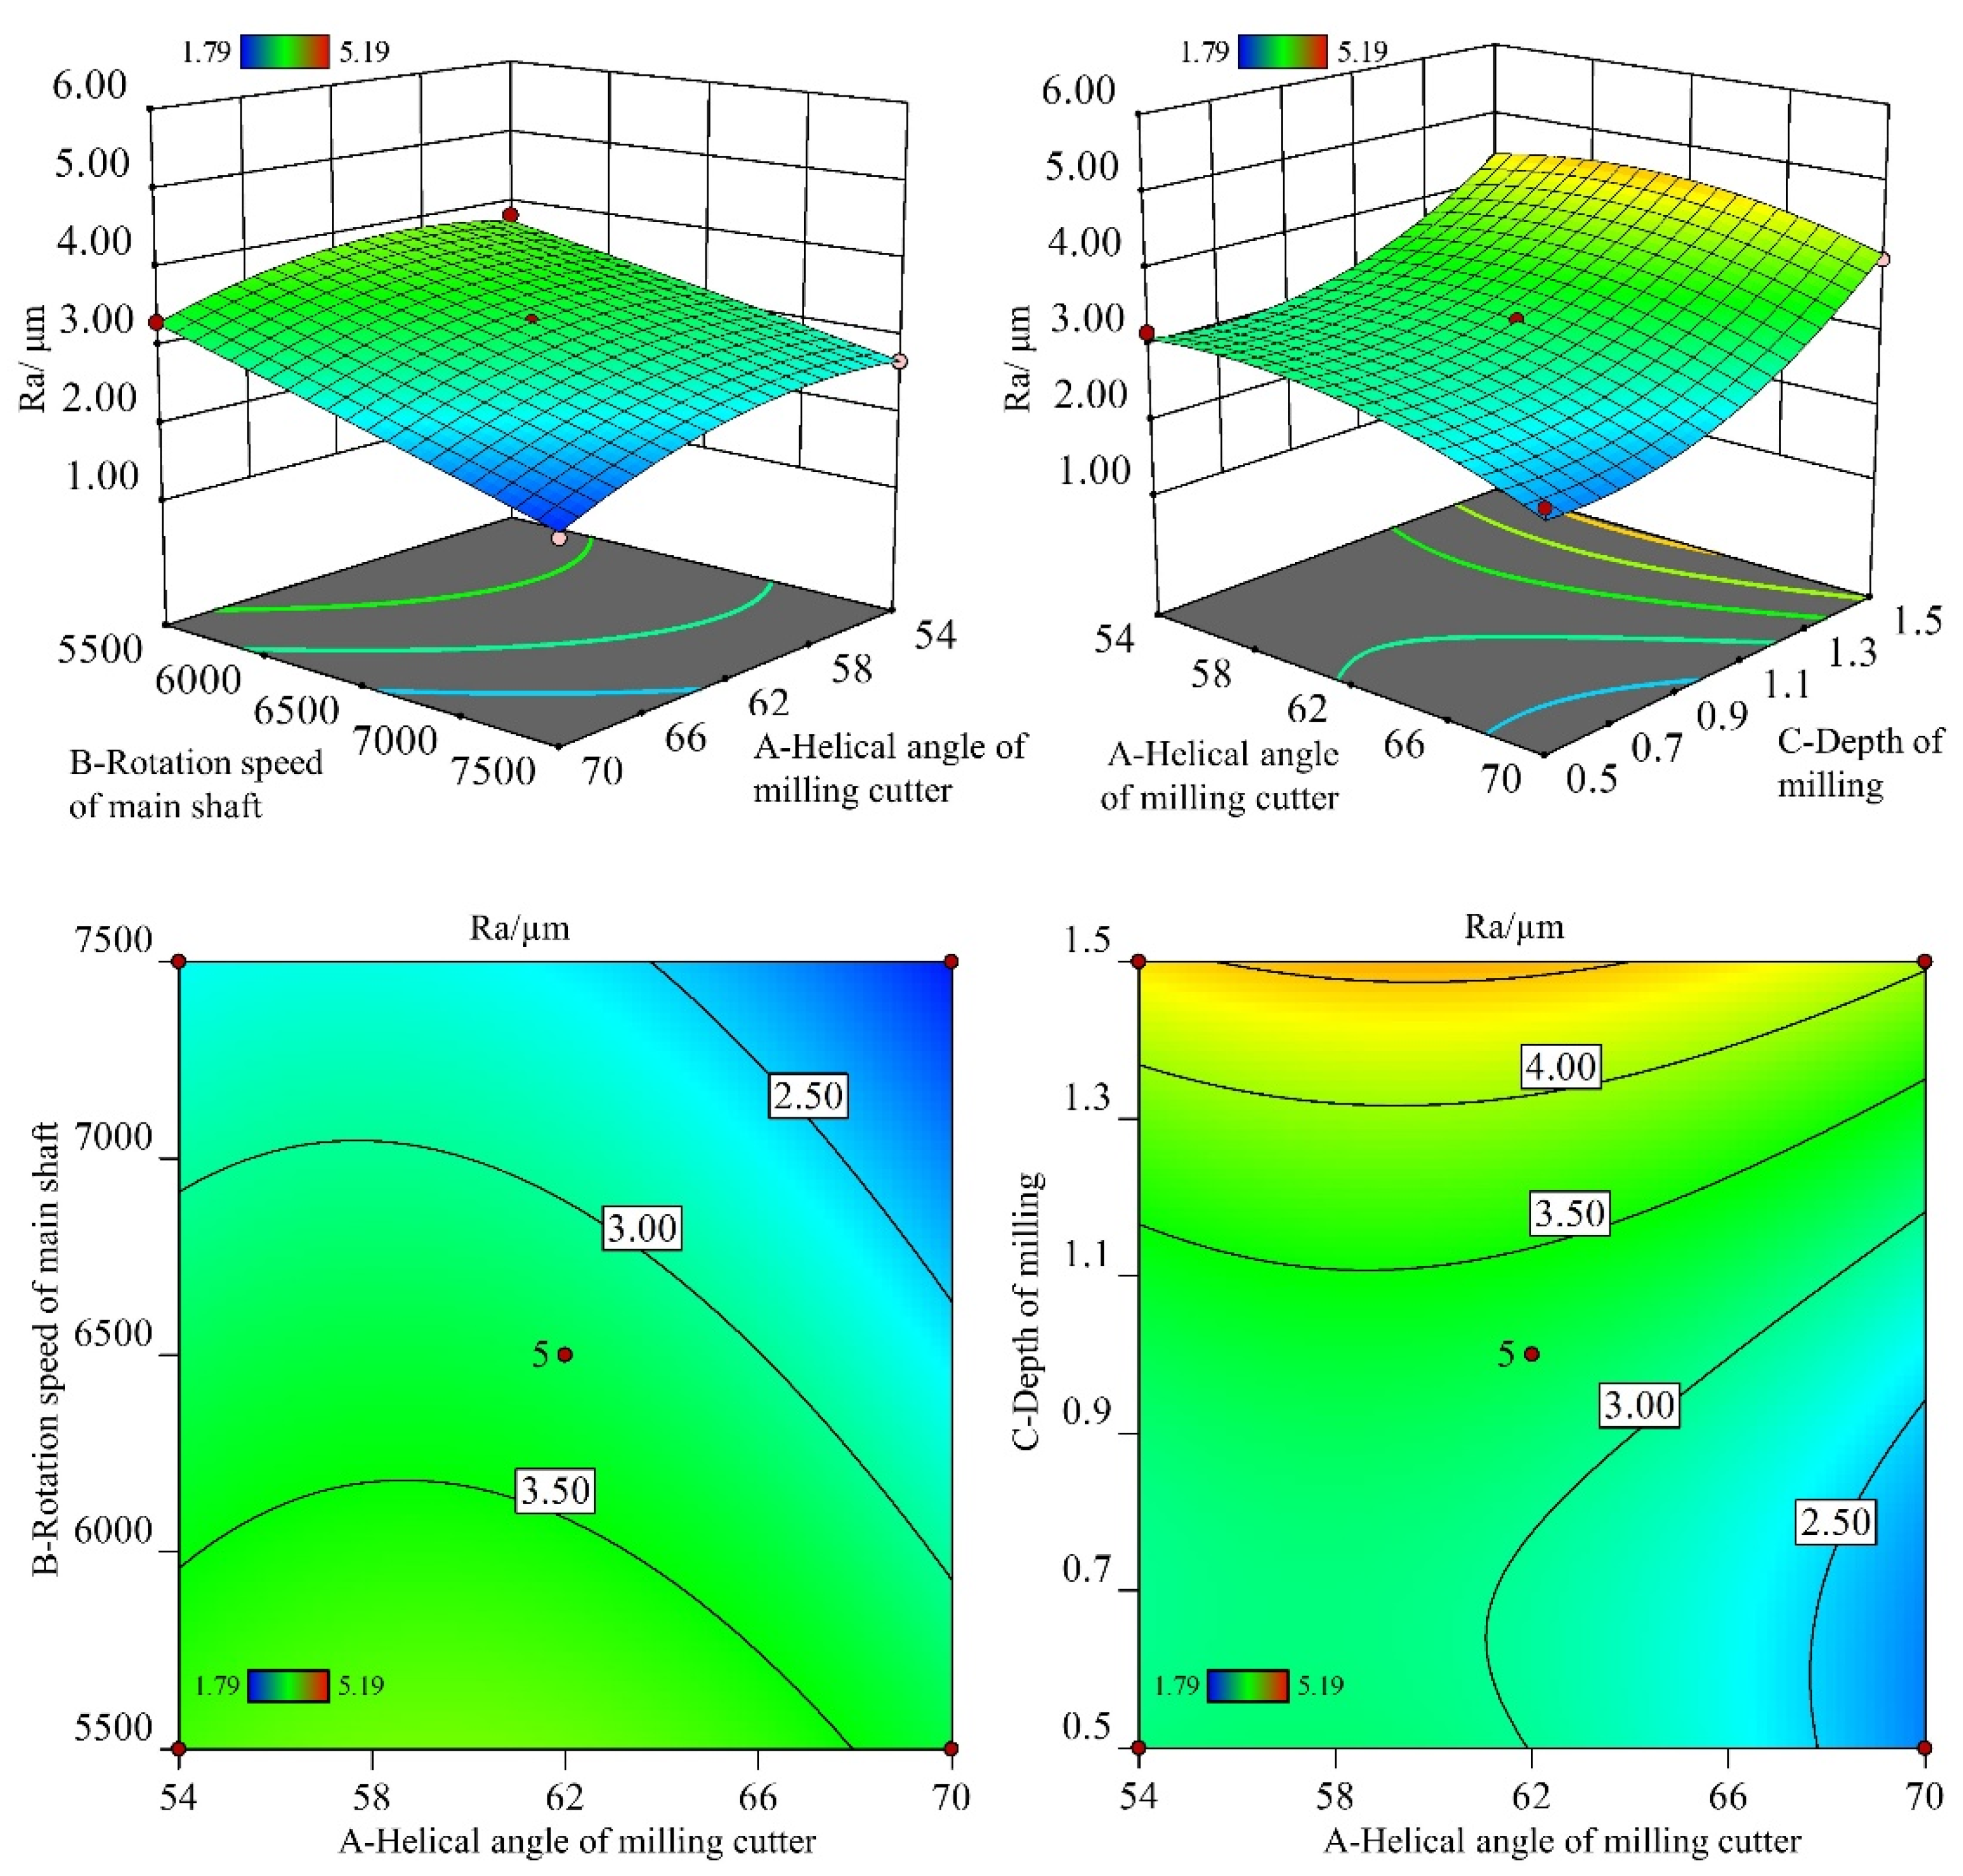
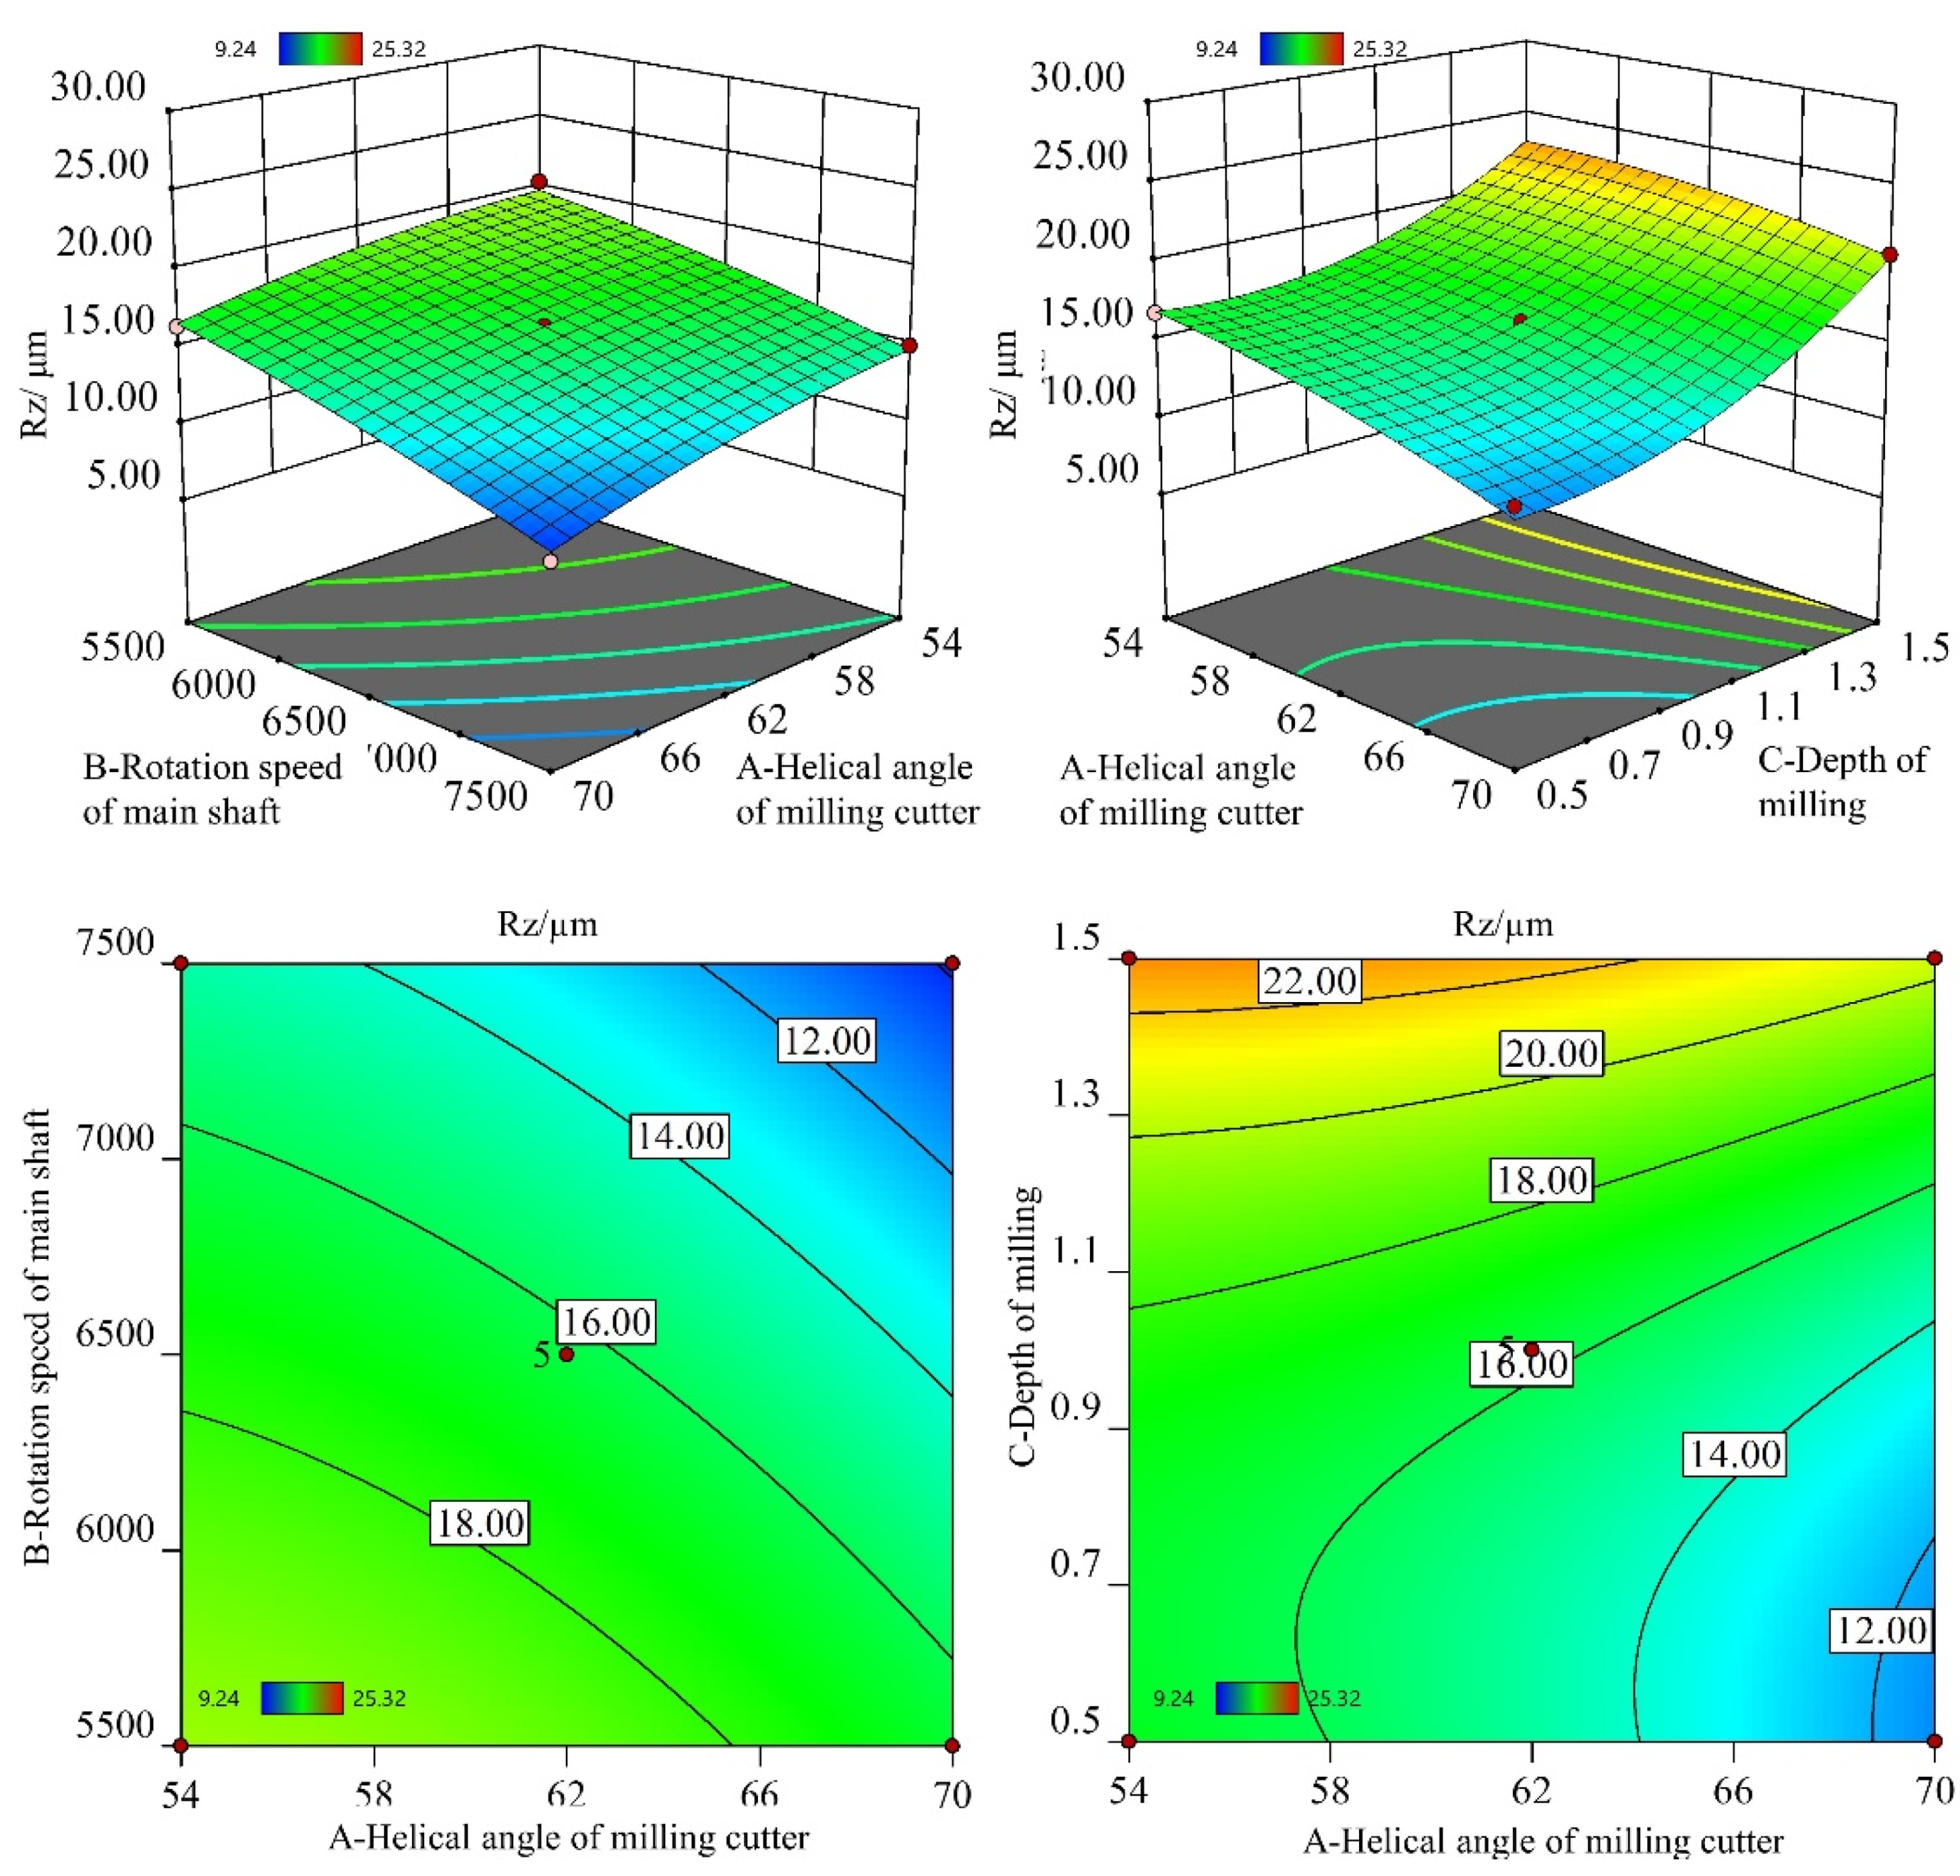
3.1. Influences of Input Variables on Ra and Rz

The experimental design and results based on BBD for Scots pine up-milling are shown in Table 3. To reveal the change rule of the response factors with the input factors, the results were analyzed by Design-Expert software, and the detailed influence trend of input factors on Ra, Rz, and milling power is shown in Figure 1.
It is obvious that the input parameters had significant effects on Ra and Rz; moreover, with the increase in the helical angle and rotation speed of the main shaft, the formation of a higher quality surface took place; that is, the values of Ra and Rz decreased. However, the parameters of Ra and Rz increased with the increase in milling depth. The probable reason for this is that the milling width increases more gently with the increase in the helical angle of the milling cutter, which induces the milling process smoother. This result has a good agreement with the LVTs’ materials helical milling process [14]. When the rotation speed of main shaft increases and milling depth decreases, the quantity removed per tooth during Scots pine wood milling process decreases, and less resistance acts on the knife edge, thus reducing the milling vibration and resulting in a smoother machined surface [13].
Apart from the main parameters, the interactions between input parameters also have influences on the response factors. The interacting effects of the helical angle and main shaft rotation speed (λ × n) and helical angle and depth of milling (λ × h) were also analyzed. Figure 2 presents how the λ × n and λ × h are related to Ra and Rz. It indicates that the values of Ra and Rz decreased with an increase in helical angle and main shaft rotation speed. Moreover, the combination of increased helical angle and decreased milling depth induced a decrease in the surface roughness. Hence, it is concluded that the Ra and Rz can be minimized with a higher helical angle, higher rotation speed, and lower depth of milling combinations. Moreover, Figure 3 and Figure 4 indicate that the minimum Ra and Rz could be achieved by the highest helical angle, the highest rotation speed, and the lowest depth of milling combination.

3.2. Influences of Input Variables on Milling Power

During the milling process, the input variables affect the materials’ removal rate, stability of machining process, and milling force, etc., which have significant influences on milling power consumption [21]. It is observed that the milling power increased with the increase in helical angle and depth of milling but decreased with the increase in the rotation speed of the main shaft (shown in Figure 1). When the helical angle increased, the resultant cutting force increased, and more energy is required to overcome these milling resistances. This result was confirmed in wood–plastic composites’ and stone–plastic composites’ cutting process [15,30]. The increase in depth of milling directly leads to the increase in material removal rate, which required more energy to take away the wood material. For the rotation speed of the main shaft, the cutting force decreased under the high rotation speed of the main shaft [2,31]. The decreasing of the cutting force has a positive effect on decreasing the milling power consumption. However, the increase in rotation speed induced the power consumption in the unloading operation phase, which will induce an increase in the total milling power and a decrease in power efficiency. This was revealed in previous research studies [32,33].
In Figure 2, the interacting influences of λ × h and n × h on milling power are also presented. Higher milling power consumption resulted from increasing helical angle and depth of milling. When the depth of milling was at a low level of the selected ranges, the increase in rotation speed did not have a significant effect on the variation of milling power (as shown in Figure 5). However, the increased rotation speed decreased the milling power when the depth of milling was at a high level. This is because the material removal rate is extremely increased when the depth of milling was at a higher level, meanwhile the milling resistance also increased. However, the rotation speed had a positive effect, decreasing the cutting force.

3.3. Analysis of Variance (ANOVA)

ANOVA is used to determine the influence of controllable factors on research results by analyzing the contribution of variation from different sources to total variation [27,34]. The detailed ANOVA results of Ra, Rz, and milling power were presented in Table 4, Table 5 and Table 6. p-values less than 0.05 indicate that model terms are significant. In this case, λ, n, h are significant model terms for Ra and Rz, and the λ, h are significant terms for milling power. The interaction of λ × h is also significant for Rz. The F-value analysis reveals the depth of milling as the most important factor for Ra and Rz, followed by the rotation speed of the main shaft and then the helical angle. For the milling power, the depth of milling is the most important factor, followed by the helical angle and then the main shaft rotation speed.

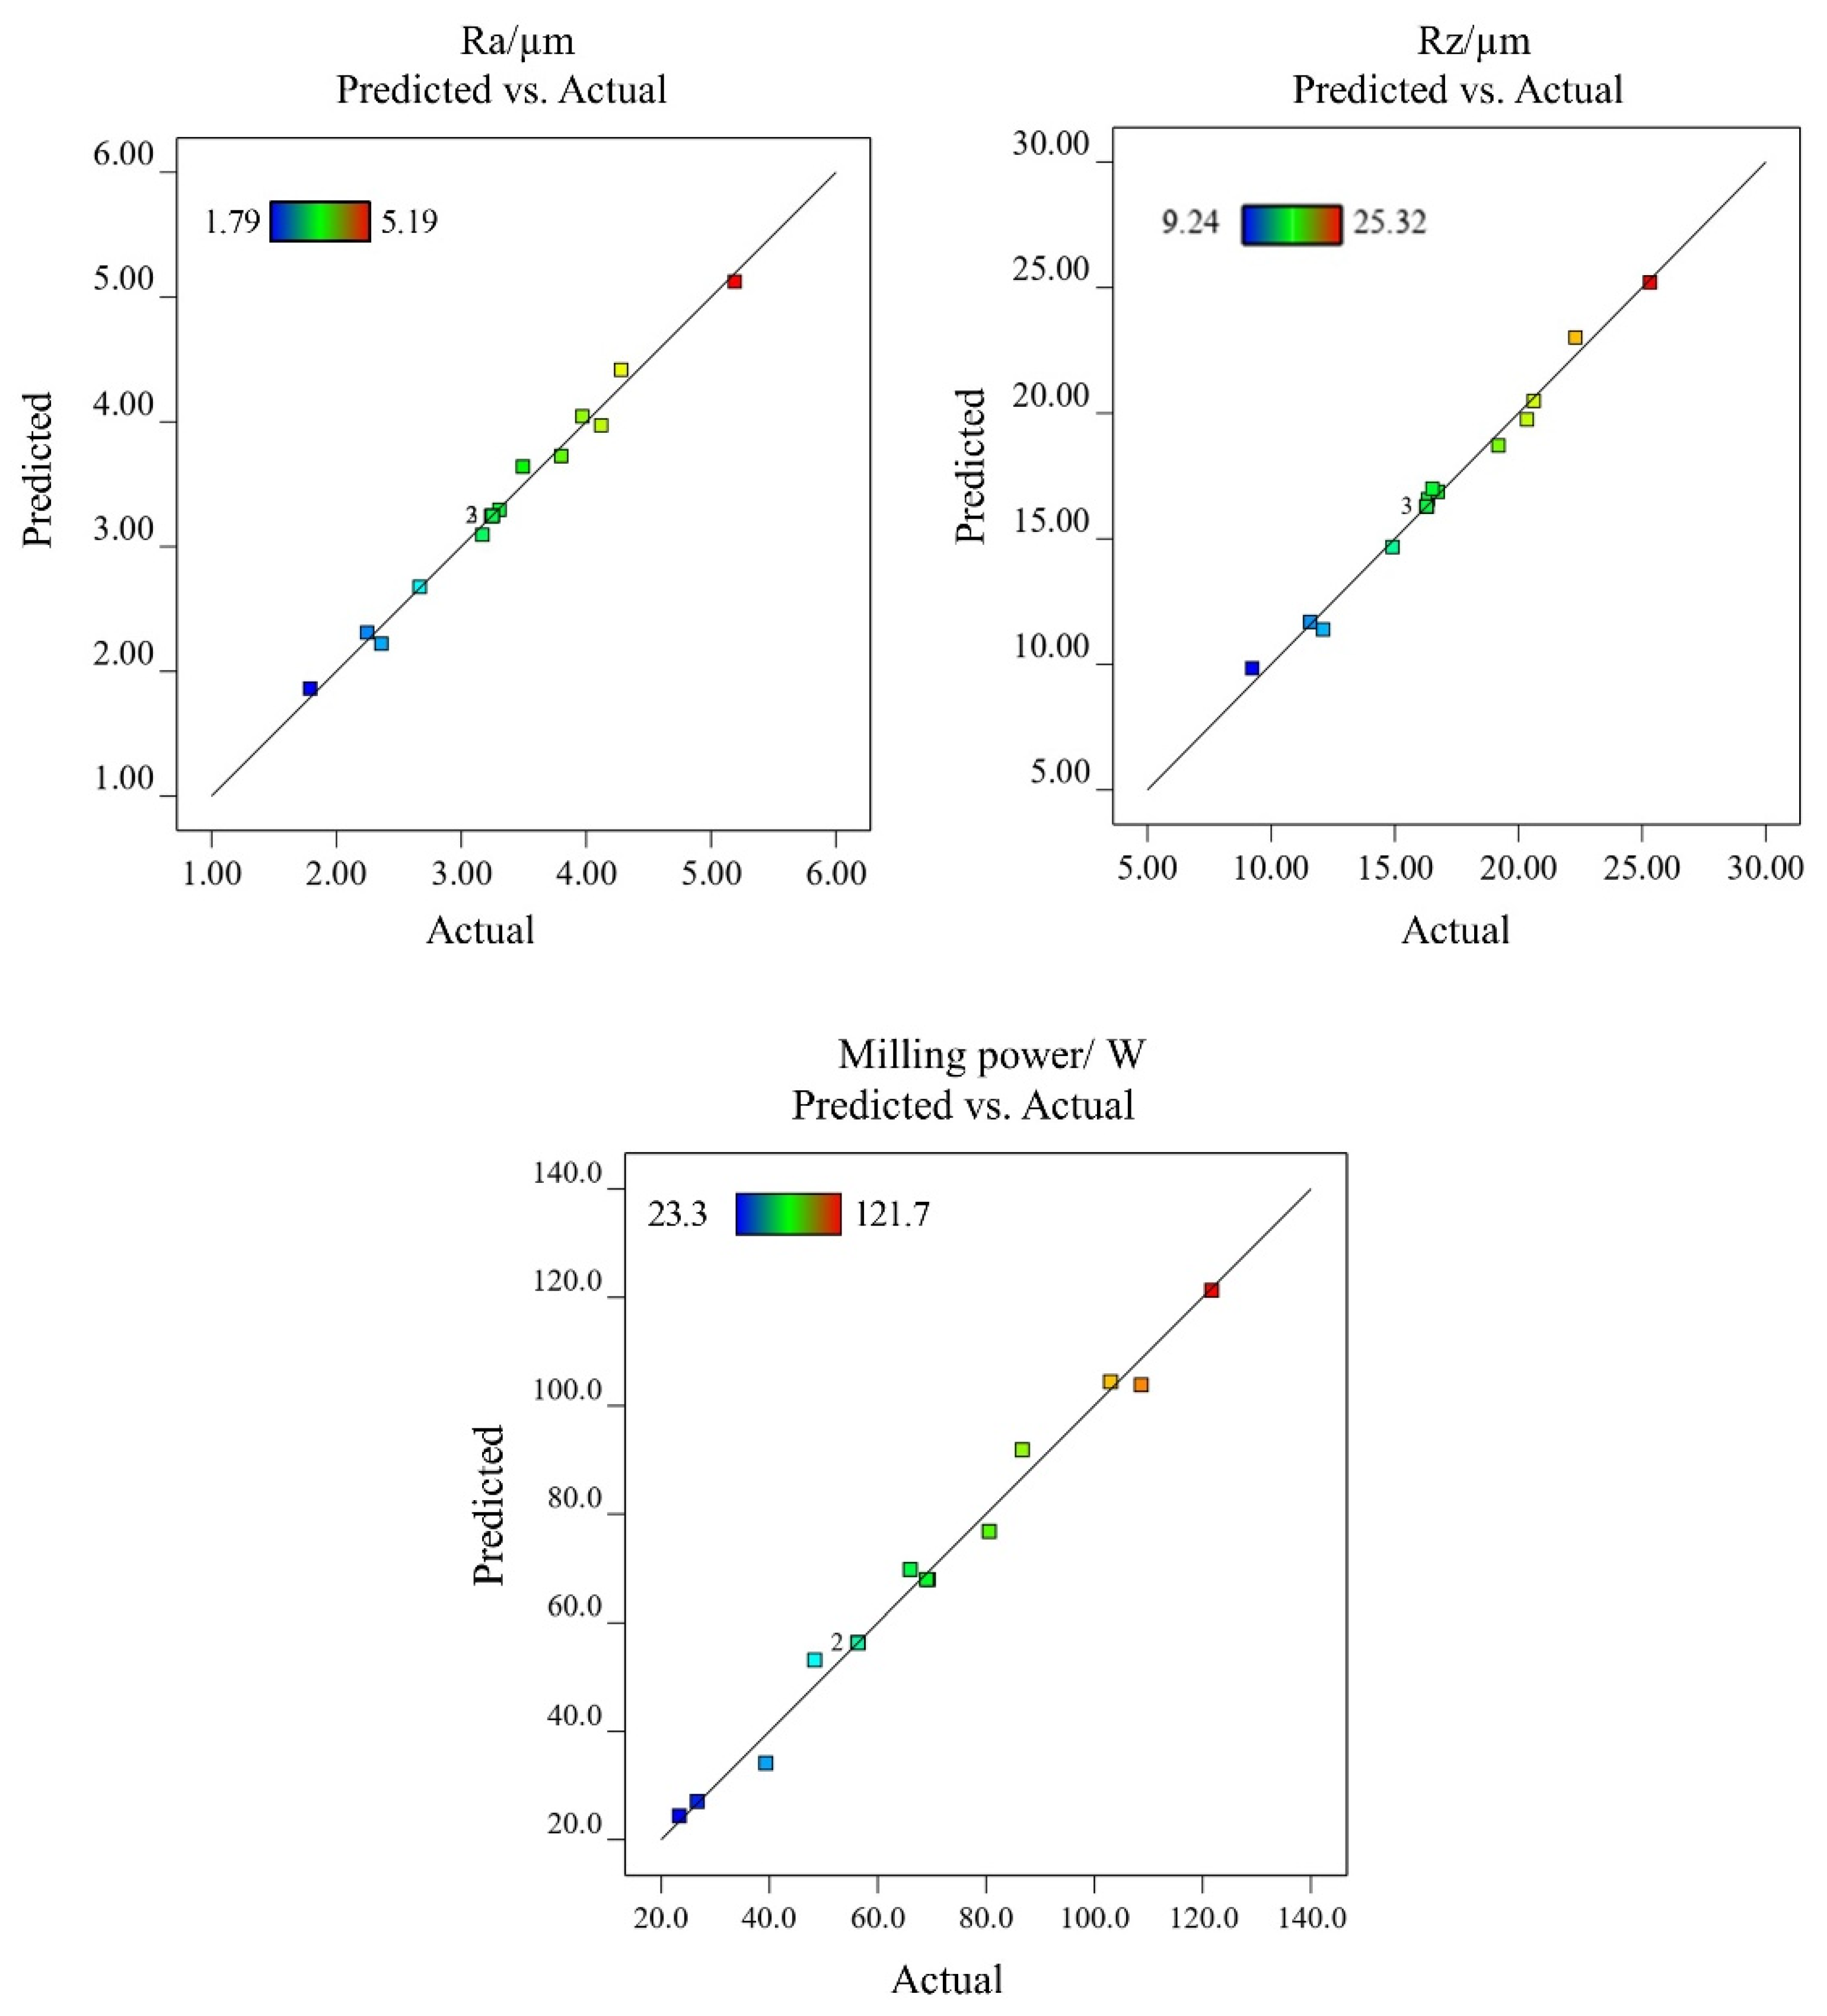
3.4. Regression Models for Ra, Rz, and Milling Power

For a quantitative description of the relationship between input variables and response variables, the quadratic models were selected due to their highest correlation coefficient (Table 7). The higher the correlation coefficient, the better the fitting effect of the model is. The graph of predicted vs. actual values for Ra, Rz, and milling power also indicates that the model prediction values are very close to the actual test-measured values (Figure 6). The coded models for the above three response parameters are shown by Equations (2)–(4).
R a = 3.25 0.3116 × A 0.6207 × B + 0.7863 × C 0.0958 × A × B + 0.1250 × A × C + 0.0445 × B × C 0.3365 × A 2 0.0189 × B 2 + 0.5354 × C 2
R z = 16.29 2.00 × A 2.95 × B + 3.81 × C 0.4144 × A × B + 0.7391 × A × C 0.2982 × B × C 0.6436 × A 2 0.4358 × B 2 + 2.30 × C 2
M i l l i n g   p o w e r = 56.33 + 21.80 × A 3.54 × B + 25.32 × C + 3.83 × A × B + 0.44 × A × C 8.42 × B × C + 22.58 × A 2 + 3.43 × B 2 5.17 × C 2

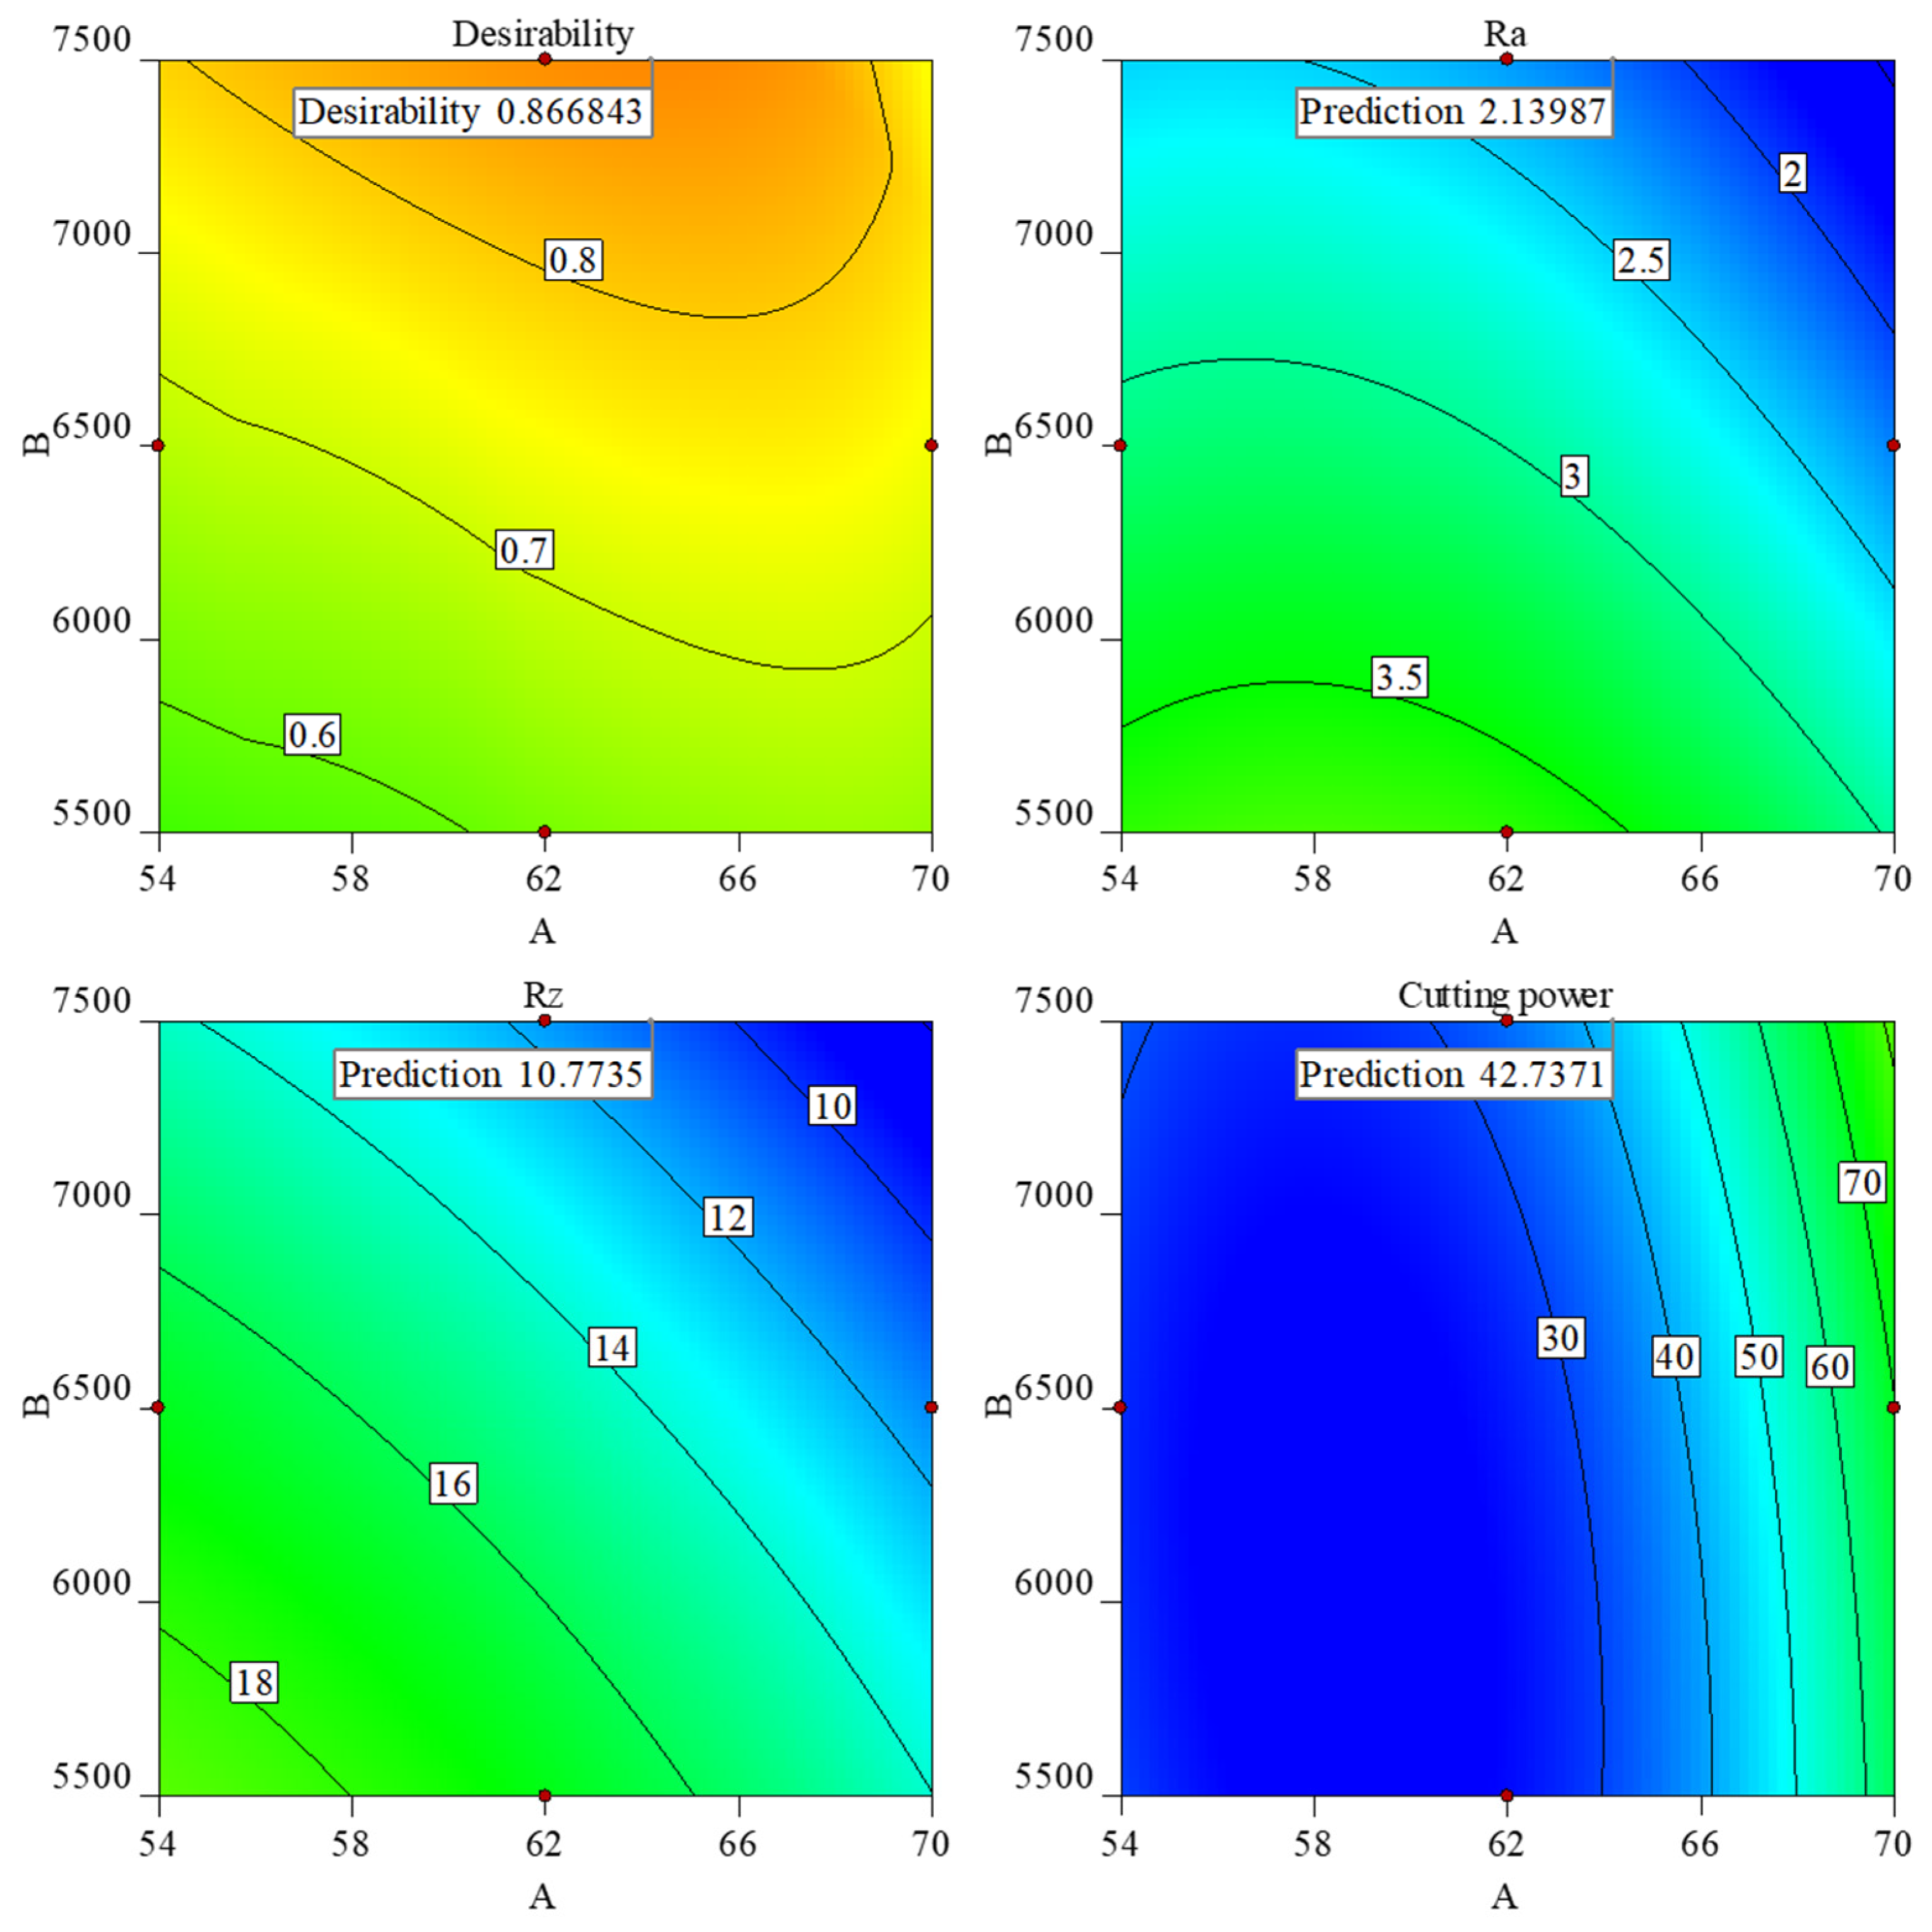
3.5. Optimization of Processing Parameters

In wood materials’ processing, smoother machined surface and lower milling power consumption are more anticipated and welcomed. In this study, the optimization conditions for input parameters are “in range” and the goals of selected two response parameters are “minimize”. The optimized combination of helical angle, rotation speed, and depth of milling are 64°, 7500 r/min and 0.5 mm, respectively. The minimized Ra, Rz, and milling power are 2.14 μm, 10.77 μm, and 42.7 W, respectively, with the desirability of 0.867 (Figure 7).

4. Conclusions

The surface roughness of Ra, Rz, and milling power consumption in the Scots pine helical up-milling process were measured and researched. The input parameters had significant effects on the response parameters, and the quadratic models were created to describe the relationships between input variables and response variables. The effects of helical angle, main shaft rotation speed, and depth of milling have good agreement with the present studies. The optimized combination of helical milling parameters was achieved by RSM, and it was meaningful to choose milling parameters reasonably in the real manufacturing process. The detailed conclusions are shown as follows:
(1)
Ra, Rz, and milling power are influenced significantly by the helical angle, rotation speed of main shaft, and depth of milling. The increased rotation speed of main shaft and helical angle decrease the values of Ra and Rz. Nevertheless, Ra and Rz increase with an increase in milling depth. Milling power also increases with an increase in helical angle and depth of milling, however decreases if the main shaft rotates at a faster speed;
(2)
The quadratic models are competent for modeling the relationship between input parameters and response parameters due to the high values of R2. The relative errors between predicting results and test results are very small.
(3)
The optimized combination of helical angle, rotation speed, and depth of milling are 64°, 7500 r/min, and 0.5 mm, respectively. The minimized Ra, Rz, and milling power are 2.14 μm, 10.77 μm, and 42.7 W, respectively, with the desirability of 0.867.

Author Contributions

Conceptualization, R.L. and X.W.; methodology, F.Y.; software, R.L.; validation, R.L. and X.W.; formal analysis, R.L.; investigation, F.Y.; resources, X.W.; data curation, F.Y.; writing—original draft preparation, R.L.; writing—review and editing, X.W.; visualization, F.Y.; supervision, X.W.; funding acquisition, R.L. All authors have read and agreed to the published version of the manuscript.

Funding

University-Industry Collaborative Education Program (202101148006, 202002316001).

Institutional Review Board Statement

Not applicable.

Informed Consent Statement

Not applicable.

Data Availability Statement

Data are contained within the article.

Acknowledgments

This research was funded by University-Industry Collaborative Education Program (202101148006, 202002316001), the project from International Cooperation Joint Laboratory for Production, Education, Research and Application of Ecological Health Care on Home Furnishing.

Conflicts of Interest

The authors declare no conflict of interest.

References

  1. Zhu, J.; Wang, X. Research on enabling technologies and development path of intelligent manufacturing of wooden furniture. J. For. Eng. 2021, 6, 177–183. [Google Scholar] [CrossRef]
  2. Guo, X.; Wang, J.; Buck, D.; Zhu, Z.; Ekevad, M. Cutting forces and cutting quality in the up-milling of solid wood using ceramic cutting tools. Int. J. Adv. Manuf. Technol. 2021, 114, 1575–1584. [Google Scholar] [CrossRef]
  3. Dong, W.; Hu, J.; Tian, G.; Qiu, X.; Guo, X. Machine energy utilization rate during milling of PVC/calcium powder/wood fiber composites. J. For. Eng. 2021, 6, 107–112. [Google Scholar] [CrossRef]
  4. Sun, Q.; Zhou, X.; Weng, J.; Li, X.; Zhou, H. Numerical simulation and experiment validation for characteristics of gas-solid flow in chip discharging field with vertical milling on MDF. J. For. Eng. 2021, 6, 74–81. [Google Scholar] [CrossRef]
  5. Liu, Q.; Gao, D.; Xu, W. Effect of Sanding Processes on the Surface Properties of Modified Poplar Coated by Primer Compared with Mahogany. Coatings 2020, 10, 856. [Google Scholar] [CrossRef]
  6. Yan, X.; Chang, Y. Effect of MF-Coated Epoxy Resin Microcapsules on Properties of Waterborne Wood Coating on Basswood. Coatings 2020, 10, 785. [Google Scholar] [CrossRef]
  7. Singer, H.; Özşahin, Ş. Prioritization of factors affecting surface roughness of wood and wood-based materials in CNC machining: A fuzzy analytic hierarchy process model. Wood Mater. Sci. Eng. 2020, 17, 63–71. [Google Scholar] [CrossRef]
  8. Javidikia, M.; Sadeghifar, M.; Songmene, V.; Jahazi, M. Effect of turning environments and parameters on surface integrity of AA6061-T6: Experimental analysis, predictive modeling, and multi-criteria optimization. Int. J. Adv. Manuf. Technol. 2020, 110, 2669–2683. [Google Scholar] [CrossRef]
  9. Liu, Y.; Hu, J.; Wu, Z. Fabrication of coatings with structural color on a wood surface. Coatings 2020, 10, 32. [Google Scholar] [CrossRef] [Green Version]
  10. Yan, X.; Wang, L. Preparation and Performance of a Waterborne UV/Al Low Infrared Emissivity Coating. Appl. Sci. 2020, 10, 6423. [Google Scholar] [CrossRef]
  11. Wu, Y.; Wu, X.; Yang, F.; Ye, J. Preparation and Characterization of Waterborne UV Lacquer Product Modified by Zinc Oxide with Flower Shape. Polymers 2020, 12, 668. [Google Scholar] [CrossRef] [PubMed] [Green Version]
  12. Liu, Q.; Gao, D.; Xu, W. Effect of Paint Process on the Performance of Modified Poplar Wood Antique. Coatings 2021, 11, 1174. [Google Scholar] [CrossRef]
  13. Zhu, Z.; Buck, D.; Guo, X.; Cao, P. High-quality and high-efficiency machining of stone-plastic composite with diamond helical cutters. J. Manuf. Processes 2020, 58, 914–922. [Google Scholar] [CrossRef]
  14. Zhu, Z.; Cao, P.; Guo, X.; Wang, X.; Zhang, F.; Gao, Y. Machinability of Luxury Vinyl Tiles during Plain Milling Using a Helical Cutter. Materials 2019, 12, 2174. [Google Scholar] [CrossRef] [PubMed] [Green Version]
  15. Wu, Z.; Zhang, F.; Hu, Y.; Zhu, Z.; Guo, X. Study on helical milling performance of wood-plastic composites. CIRP J. Manuf. Sci. Technol. 2022, 37, 143–154. [Google Scholar] [CrossRef]
  16. Abidi, A.; Ben Salem, S.; Yallese, M.A. Machining quality of high speed helical milling of carbon fiber reinforced plastics. Proc. Inst. Mech. Eng. Part C-J. Mech. Eng. Sci. 2022, 236, 1049–1066. [Google Scholar] [CrossRef]
  17. Wu, Y.; Zhang, W.; Yang, Z.; Wang, Y. Influence factors of drilling power of wood structural component. J. For. Eng. 2020, 5, 36–41. [Google Scholar] [CrossRef]
  18. Wei, W.; Li, Y.; Li, Y.; Yang, G.; Ji, K.; Chen, Z.; Mei, C. Research progress on tool wear for cutting wood-based composites. J. For. Eng. 2020, 5, 21–28. [Google Scholar] [CrossRef]
  19. Xu, L.; Huang, C.; Niu, J.; Wang, J.; Liu, H.; Wang, X. Prediction of cutting power and surface quality, and optimization of cutting parameters using new inference system in high-speed milling process. Adv. Manuf. 2021, 9, 388–402. [Google Scholar] [CrossRef]
  20. Zhu, Z.; Buck, D.; Guo, X.; Xiong, X.; Xu, W.; Cao, P. Energy Efficiency Optimization for Machining of Wood Plastic Composite. Machines 2022, 10, 104. [Google Scholar] [CrossRef]
  21. Li, R.; He, C.; Xu, W.; Wang, X. Modeling and optimizing the specific cutting energy of medium density fiberboard during the helical up-milling process. Wood Mater. Sci. Eng. 2022. [Google Scholar] [CrossRef]
  22. Darmawan, W.; Gottlober, C.; Oertel, M.; Wagenfuhr, A.; Fischer, R. Performance of helical edge milling cutters in planing wood. Eur. J. Wood Wood Prod. 2011, 69, 565–572. [Google Scholar] [CrossRef]
  23. Akkus, H.; Yaka, H. Experimental and statistical investigation of the effect of cutting parameters on surface roughness, vibration and energy consumption in machining of titanium 6Al-4V ELI (grade 5) alloy. Measurement 2021, 167, 108465. [Google Scholar] [CrossRef]
  24. Bustillo, A.; Pimenov, D.Y.; Mia, M.; Kapłonek, W. Machine-learning for automatic prediction of flatness deviation considering the wear of the face mill teeth. J. Intell. Manuf. 2021, 32, 895–912. [Google Scholar] [CrossRef]
  25. Dong, W.; Guo, X.; Hu, Y.; Wang, J.; Tian, G. Discrete Wavelet Transformation and Genetic Algorithm—Back Propagation Neural Network Applied in Monitoring Woodworking Tool Wear Conditions in the Milling Operation Spindle Power Signals. Bioresources 2021, 16, 2369–2384. [Google Scholar] [CrossRef]
  26. Tien, D.H.; Duc, Q.T.; Van, T.N.; Nguyen, N.-T.; Duc, T.D.; Duy, T.N. Online monitoring and multi-objective optimisation of technological parameters in high-speed milling process. Int. J. Adv. Manuf. Technol. 2021, 112, 2461–2483. [Google Scholar] [CrossRef]
  27. Li, R.; He, C.; Chen, Y.; Wang, X. Effects of laser parameters on the width of color change area of poplar wood surface during a single irradiation. Eur. J. Wood Wood Prod. 2021, 79, 1109–1116. [Google Scholar] [CrossRef]
  28. Li, R.; Yao, Q.; Xu, W.; Li, J.; Wang, X. Study of Cutting Power and Power Efficiency during Straight-Tooth Cylindrical Milling Process of Particle Boards. Materials 2022, 15, 879. [Google Scholar] [CrossRef]
  29. Zhu, Z.; Buck, D.; Guo, X.; Cao, P.; Wang, J. Cutting performance in the helical milling of stone-plastic composite with diamond tools. CIRP J. Manuf. Sci. Technol. 2020, 31, 119–129. [Google Scholar] [CrossRef]
  30. Wu, Z.; Buck, D.; Jin, D.; Guo, X.; Cao, P.; Zhu, Z. Investigation on Milling Quality of Stone–Plastic Composite Using Response Surface Methodology. JOM 2022, 74, 2063–2070. [Google Scholar] [CrossRef]
  31. Zhu, Z.; Buck, D.; Cao, P.; Guo, X.; Wang, J. Assessment of Cutting Forces and Temperature in Tapered Milling of Stone–Plastic Composite Using Response Surface Methodology. JOM 2020, 72, 3917–3925. [Google Scholar] [CrossRef]
  32. Nasir, V.; Mohammadpanah, A.; Cool, J. The effect of rotation speed on the power consumption and cutting accuracy of guided circular saw: Experimental measurement and analysis of saw critical and flutter speeds. Wood Mater. Sci. Eng. 2020, 15, 140–146. [Google Scholar] [CrossRef]
  33. Rajko, L.; Koleda, P.; Barcik, S.; Koleda, P. Technical and Technological Factors’ Effects on Quality of the Machined Surface and Energetic Efficiency When Planar Milling Heat-treated Meranti Wood. Bioresources 2021, 16, 7884–7900. [Google Scholar] [CrossRef]
  34. Nasir, V.; Cool, J. Cutting power and surface quality in sawing kiln-dried, green, and frozen hem-fir wood. Wood Sci. Technol. 2021, 55, 505–519. [Google Scholar] [CrossRef]
Figure 1. Influence trend chart for different input variables.
Machines 10 00331 g001
Figure 2. The plot of interaction influences on Ra, Rz, and milling power.
Machines 10 00331 g002
Figure 3. The 3D surface and contour graphs for Ra.
Machines 10 00331 g003
Figure 4. The 3D surface and contour graphs for Rz.
Machines 10 00331 g004
Figure 5. The 3D surface and contour graphs for milling power.
Machines 10 00331 g005
Figure 6. The plot of predicted vs. actual values for Ra, Rz, and milling power.
Machines 10 00331 g006
Figure 7. The contour plot of optimization.
Machines 10 00331 g007
Table 1. The results of some physical and mechanical properties of Scots pine samples.
Work PieceDensityModulus of RuptureModulus of ElasticityMoisture Content
Scots pine0.52 g/cm371 MPa12,234 MPa11.2%
Table 2. Input variables and their levels.
VariablesCodesLevels
−101
Helical angle of milling cutter (λ)/°A546270
Rotation speed of main shaft (n)/r/minB550065007500
Depth of milling (h)/mmC0.51.01.5
Table 3. The results of Ra, Rz, and milling power consumption in Scots pine helical up-milling.
StandardRunFactorsRa/μmRz/μmMilling Power/W
λn/r/minh/mm
1145455001.03.80 20.35 69.3
297055001.03.30 16.34 108.7
3135475001.02.67 14.91 48.3
4127075001.01.79 9.24 103.0
5155465000.53.17 16.75 26.7
687065000.52.36 12.10 66.0
775465001.54.28 22.31 80.6
8117065001.53.97 20.62 121.7
9176255000.53.49 16.52 23.3
1036275000.52.25 11.58 39.3
1126255001.55.19 25.32 86.7
1256275001.54.12 19.19 69.0
13166265001.03.24 16.27 56.3
1446265001.03.25 16.29 56.3
1566265001.03.25 16.31 56.3
1616265001.03.24 16.29 56.3
17106265001.03.25 16.29 56.3
Table 4. ANOVA results of Ra.
SourceSum of SquaresDegrees of FreedomMean SquaresF-Valuep-Value
Model10.5291.1773.08<0.0001
λ0.776910.776948.570.0002
n3.0813.08192.69<0.0001
h4.9514.95309.2<0.0001
λ × n0.036710.03672.290.1737
λ × h0.062510.06253.910.0887
n × h0.007910.00790.49540.5043
λ20.476710.476729.80.0009
n20.001510.00150.09410.7679
h21.2111.2175.47<0.0001
Residual0.112070.0160
Lack of fit0.111830.0373
Pure Error0.000140.0000
Cor Total10.6316
Table 5. ANOVA results of Rz.
SourceSum of Squares Degrees of FreedomMean SquaresF-Valuep-Value
Model245.12927.2481.25<0.0001
λ32.05132.0595.63<0.0001
n69.68169.68207.87<0.0001
h116.261116.26346.82<0.0001
λ × n0.686710.68672.050.1954
λ × h2.1812.186.520.0379
n × h0.355710.35571.060.3372
λ21.7411.745.20.0566
n20.799810.79982.390.1663
h222.25122.2566.38<0.0001
Residual2.3570.3352
Lack of fit2.3530.7819
Pure Error0.000840.0002
Cor Total247.4716
Table 6. ANOVA results of milling power.
SourceSum of Squares Degrees of FreedomMean SquaresF-Valuep-Value
Model11671.5491296.8467.03<0.0001
λ3802.6513802.65196.54<0.0001
n100.371100.375.190.0568
h5130.1715130.17265.15<0.0001
λ × n58.7158.73.030.1251
λ × h0.774410.77440.040.8471
n × h283.361283.3614.650.0065
λ22146.512146.5110.94<0.0001
n249.59149.592.560.1534
h2112.711112.715.830.0465
Residual135.44719.35
Lack of fit135.44345.15
Pure Error0.000440.0001
Cor Total11806.9816
Table 7. Results of ANOVA for the different models.
Responses
Parameters
ModelsSDR2Adjusted R2Predicted R2
RaLinear0.380.82810.78840.6434
2FI0.410.83820.74110.1821
Quadratic0.130.98950.97590.8317
RzLinear1.510.88090.85340.7571
2FI1.620.89390.83030.4817
Quadratic0.580.99050.97830.8483
Milling powerLinear14.610.76510.71090.5475
2FI15.590.79410.67060.1054
Quadratic4.400.98850.97380.8165
Publisher’s Note: MDPI stays neutral with regard to jurisdictional claims in published maps and institutional affiliations.

