1. Introduction
Nowadays, the demand for precise miniaturized products, characterized by tight tolerances and high-quality surface finish, is increased in different industries. Moreover, hard and brittle materials are widely used in numerous applications due to their superior characteristics in physical, mechanical, optical, and electronic properties. However, the conventional machining of such materials is difficult due to their high hardness and low fracture toughness. The milling process is one of the most precise and flexible machining operations, producing a variety of complex shapes. Nevertheless, the milling operation has some drawbacks, such as the deformation and the vibration between the cutter and the workpiece, which affects machining accuracy. Additionally, the non-conventional methods, such as the electrical discharge machining, electrochemical machining, laser machining, ion-beam machining, and electro-beam machining, which are used to process hard and brittle materials, have obvious cons, such as the long preparation time, the high setup cost, the low processing efficiency, and the high environmental requirements. These drawbacks result in a long production time and a high manufacturing cost [
1]. Therefore, there is a need to develop alternative technologies to overcome these drawbacks. To solve the above-mentioned problems, many researchers applied vibration on the tool or the workpiece during the machining operations in order to improve the produced surface finish, to extend the tool life, to decrease the cutting forces, and to reduce the burr formation [
2,
3].
Vibration-assisted machining (VAM) is a technique applied at a certain frequency and amplitude on the tool or the workpiece to achieve better cutting performance. It can be classified into two types based on the mode of vibration introduced to the tool or the workpiece, namely one-dimensional (1D) VAM, where the vibrated tool is driven in reciprocating motion, and two-dimensional (2D) VAM, where the vibrated tool is driven in an elliptical motion [
4]. Investigations concluded that the application of 2D VAM is more effective than 1D VAM [
2,
3,
5] because the frictional forces in 2D vibration could be reversed, resulting in the reduction in the cutting forces and the temperature, in achieving a better surface finish, and in extending the tool life. VAM has been applied to several machining processes, including turning, milling, drilling, and grinding, for the processing of hard and brittle materials. To improve the process performance and to achieve higher product quality, VAM has been applied to the milling process distinguished by its high accuracy and ability to produce complex parts [
6,
7,
8,
9,
10,
11,
12,
13,
14,
15].
Some investigations applied the 2D vibration on the tool by using different methods. Moriwaki et al. [
7] developed a 2D tool vibrator of a unique double-structure spindle system, which is only limited to low-frequency vibration processes (maximum 167 Hz). Ammouri et al. [
8] introduced a bi-directional ultrasonic elliptical vibration actuator; however, similar asymmetrical designs have to be exact and restricted, and they require accurate and precise installation in order to prevent the occurrence of errors of vibrator motion resulting from the unbalance of the internal forces that would result from the asymmetrical structure. Kim et al. [
9] applied 2D vibration on a cutting tool bolted with two orthogonally connected stacked piezoelectric plates. Similar designs would negatively affect the motion accuracy due to the cross-coupling displacement resulting from the vibration in the two different directions.
From another perspective, some investigations adopted the generation of the 2D vibration on the workpiece. Chern et al. [
10] investigated the effect of VAM using a 2D vibrating worktable on the workpiece quality during micro milling. The vibration was applied using two perpendicular piezoelectric actuators connected to the slideways to ensure the uniaxial and accurate actuator motion. However, the design caused the occurrence of the coupling-effect problem. Ding et al. [
11] applied the 2D VAM using a flexure mechanism driven by piezo actuators. The design was characterized by its structural compactness, high stiffness, and the absence of friction; however, the design would not operate at high resonance frequencies and would potentially cause the occurrence of the coupling-effect problem. Ding et al. [
12] introduced another device for 2D VAM and studied the micro end milling process for a vibrating workpiece. The design was simple; however, the accuracy of the workpiece vibration would possibly be affected by the setup weight. Chen et al. [
13] proposed a novel 2D non-resonant vibration stage for the milling process based on the double flexure hinges to overcome the coupling effect of the flexure-based designs. The applied vibration was of low frequency, and the actual displacement of the actuators in both directions was measured using a modular capacitive sensor.
Concerning the generated vibrational motion, some trials were established toward monitoring and online controlling of the motion. Jung et al. [
14] developed a novel 2D vibration monitoring and online controlling system by measuring the internal data of the vibration device without using external displacement sensors. The system was not expensive, but it was composed of many electrical components with complicated connections. Baraya and Hossam [
16] proposed an electromechanical system for measuring and calibrating the transducer output amplitude. The desired transducer’s output amplitudes were obtained by changing the input voltage and frequency values; however, the system was limited to 1D vibration.
The previously developed 2D vibratory devices demonstrate different limitations affecting the performance and accuracy of VAM. This paper presents a design of a 2D vibratory device that overcomes these limitations and provides more stability to the process, as follows:
Preventing the coupling-effect problem of the two perpendicular vibration modes by generating a predetermined path for the vibrating table in a uniaxial direction using a linear guideway and by separating the two vibration modes to two different and independent horizontal levels.
High precision for the vibration motion of the workpiece through the symmetrical design that provides an equal loading capacity in the two vibration directions and a high rigidity against the machining load.
Application of high-frequency vibration in the ultrasonic range, which permits the benefit of a high interrupted mechanism of the cutting process.
Providing the control to the workpiece vibration in a simple and inexpensive technique to control the applied vibration.
Easy installation, low running cost, and easy maintenance because of the simple device design composed of simple mechanical components that are easy to manufacture and are directly assembled. Additionally, the replacement of any damaged component is easy.
The following sections of this paper will introduce the design of the 2D vibratory device, the verification of the design using the finite element analysis (FEA), the calibration of the manufactured device, the introduction of a developed unit to control the amplitude of the generated vibration at determined frequencies, and the slot-milling experiments are to be conducted to experimentally validate and test the function of the 2D vibratory device by investigating the performance of the slot-milling process in terms of the cutting forces and slot width accuracy.
2. Materials and Methods
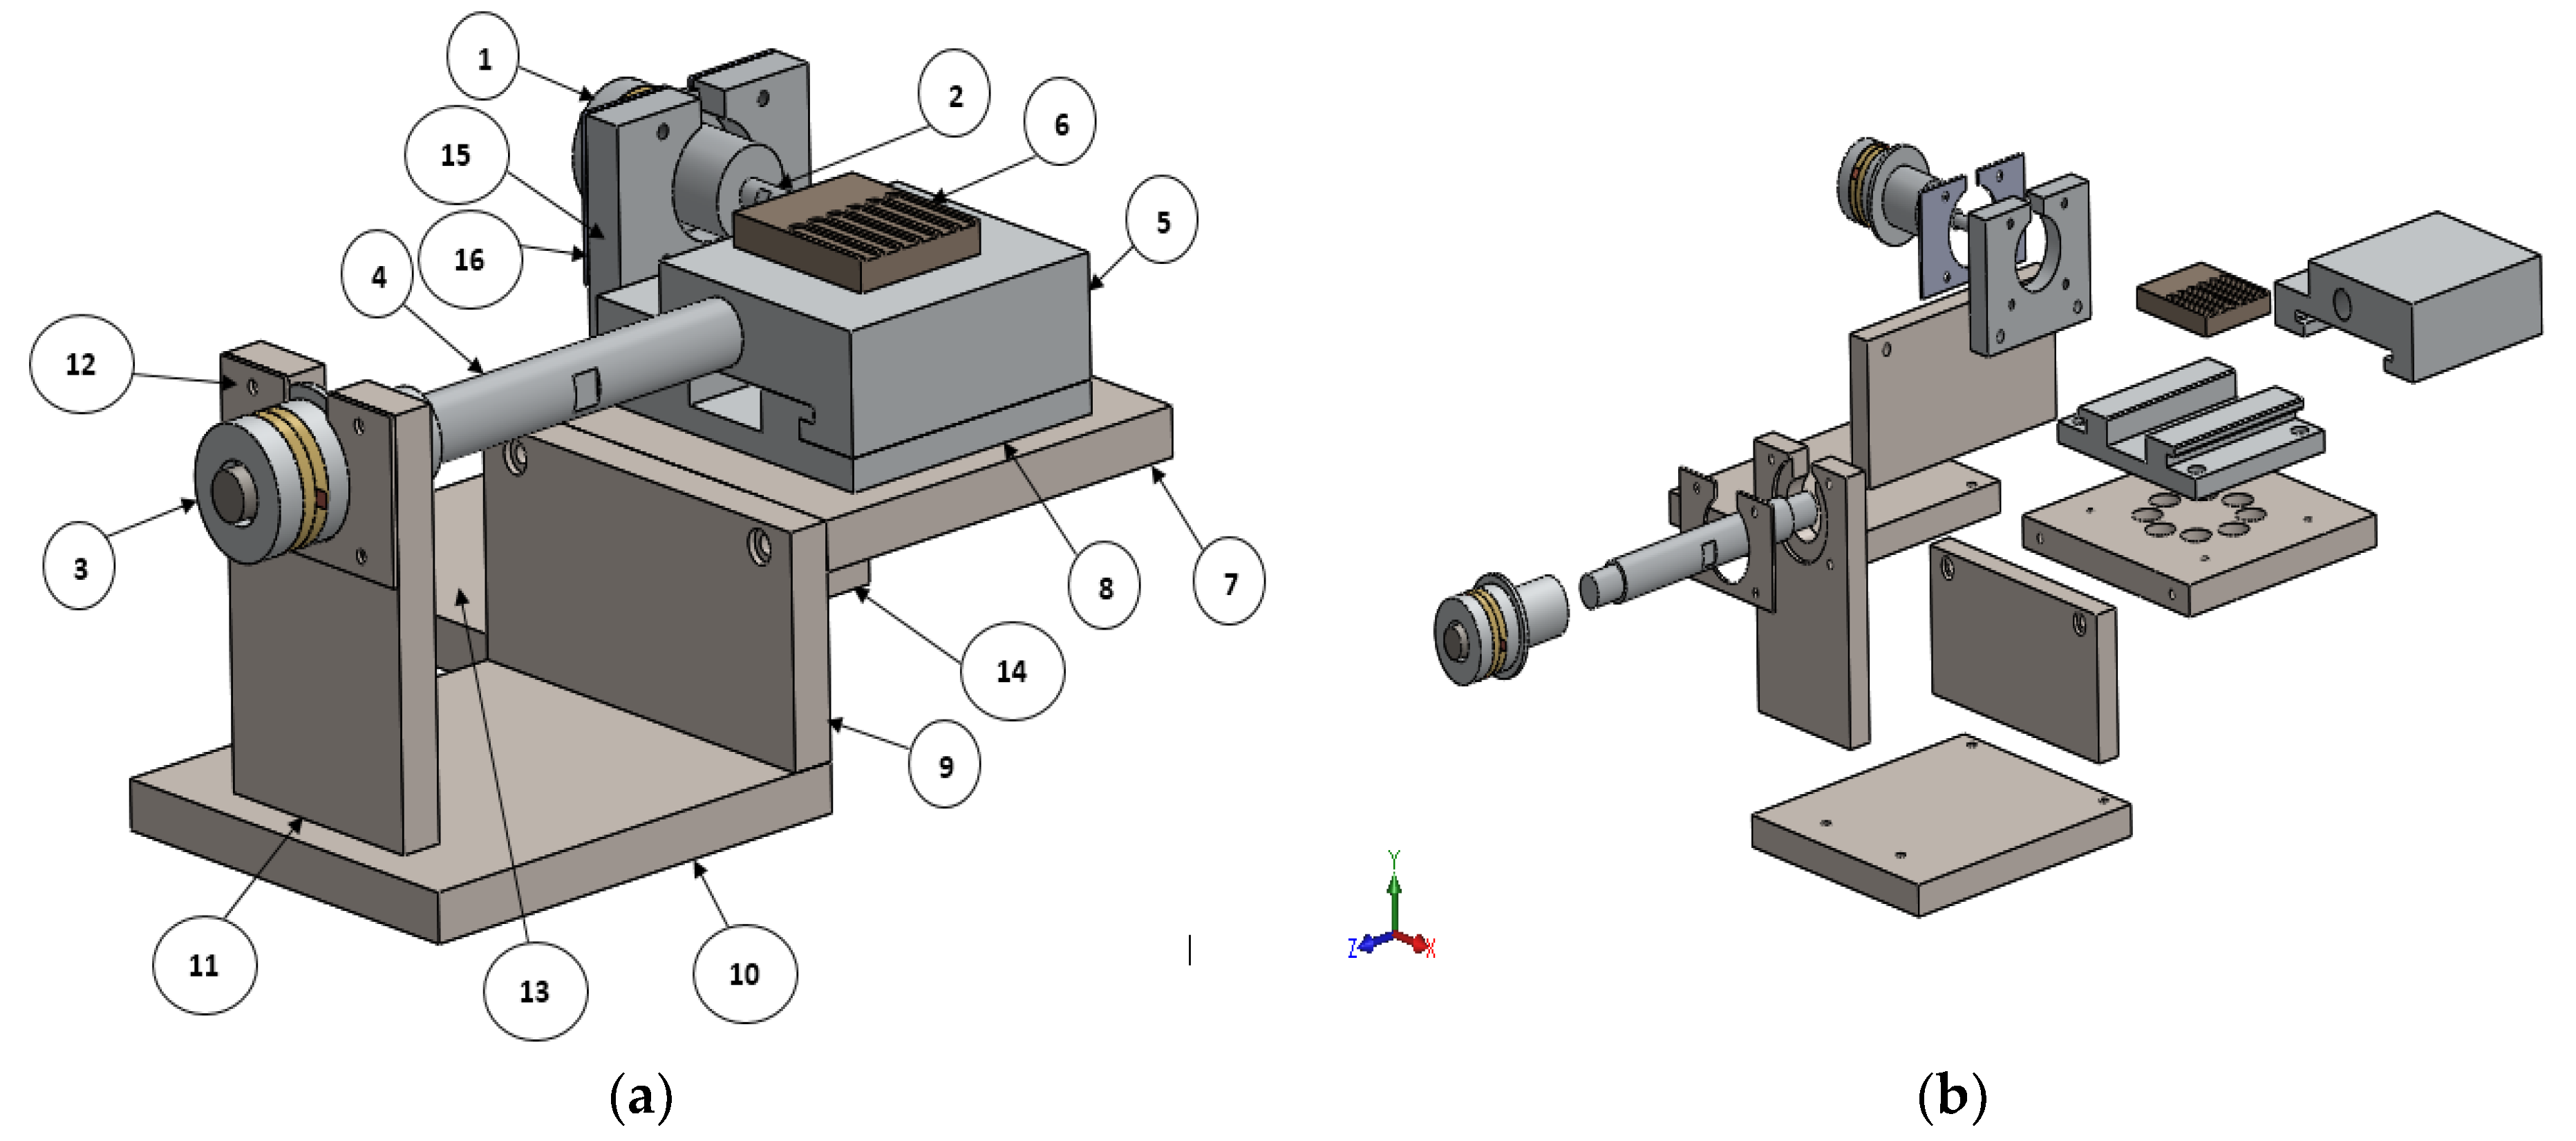
Design approach of the two-dimensional vibratory device: The designed 2D vibratory device, introduced by Engy et al. [
17], as shown in
Figure 1, is to be used for cutting materials with the aid of vibration in the feed and thrust directions applied to the workpiece using the transducers “T1” (1) and “T2” (3), respectively.
The components of each piezoelectric transducer are shown in
Figure 2 and are held together through a compressive pre-load using a bolt (1). The applied ultrasonic resonance frequency is of 30 kHz and of maximum 10 µm amplitude in the feed and thrust directions. To design the transducers and to derive their initial dimensions, the procedure of Baraya and Hossam [
16] is adopted to determine the proper horn lengths, providing a resonance frequency of the system (close to the original frequency of the bare transducer) and an acceptable amplification of the vibration amplitude. The dimensions of the piezoelectric discs are 38 mm × 15 mm × 5 mm for transducer T1 and 40 mm × 16 mm × 5 mm for transducer T2 based on the setup weight, the workpiece dimensions, the slider table, the operating vibration mode, and the output vibration needed.
Table 1 and
Table 2 illustrate the properties of the piezoelectric material and the component materials of the vibratory device, respectively. The Langevin transducer includes the piezoelectric material generating the vibration and the metal material (copper electrodes and aluminum front and back mass) transmitting the vibration. For fixing transducer T2, as shown in
Figure 1, a steel stand (9) and a steel base (10) are assembled to provide a robust and stiff support.
Transducer T1 is supported by an aluminum stand (15) fixed to the aluminum slider table (5). The stand of T1 is to vibrate with the slider table over the linear guideways, thus, the material of the T1 stand was determined to be aluminum for its light weight and good acoustic properties to efficiently transmit the vibration.
Modeling of transducers: Finite element (FE) analysis using ANSYS was conducted to model the T1 and T2 transducers, as shown in
Figure 3, to verify their vibration at 30 kHz and maximum of 10 µm amplitude. The initial dimensions of all the components were determined based on theoretical calculations; the material types and connections to other parts were defined, and the model was meshed. FE static structure analysis was conducted by applying the needed torque to the bolt connecting the transducer components, which affects its resonance frequency.
The results of the FE analysis, illustrated in
Figure 4, confirmed that the applied bolt torque would not cause the generation of high stresses leading to the failure of the transducer parts.
In order to observe the resonance frequency of the transducers, FE modal analysis was performed to obtain the vibration mode shapes.
Figure 5d and
Figure 6d show Mode 4 presenting the longitudinal vibration in the axial direction for both transducers. The resonance frequencies of 30.641 and 30.521 kHz for T1 and T2 transducers, respectively, were in good agreement with the theoretical calculations for both transducers.
FE harmonic analysis was performed using a maximum 300 Volt peak to peak (Vpp) on the piezoelectric ring face, and the results, presented in
Figure 7, confirmed that the transducer maximum displacement at the resonance frequency would occur at the horn end tip for both transducers.
Design of the slider table and linear guideway: The dimensions of the slider table and linear guideway are assigned based on the dimensions of the workpiece, the base plate, the dynamometer (Kistler quartz 4-component type 9272), and the applied cutting forces affecting the system. Equation (1) is used to initially assign the dimensions of the slider table, given that the maximum force applied on it is 300 N [
14,
18,
19,
20]:
where (
) is the resulting stress to be compared to the strength of the slider table material (aluminum), (
) is the applied cutting forces on the slider table, and (
) is the cross-sectional area of the slider surface.
In order to initially assign the dimensions of the linear guideway, Equation (2) is considered, since the pressure on the mating surfaces affects the wear resistance of the slideways:
where
and
denote the average pressure on the mating surfaces (resulting from the applied cutting forces) and the permissible average pressure, respectively.
The forces acting on the two flat slideways, illustrated in
Figure 8, are the cutting forces (feed
, thrust
, and axial
), slider weight (
), unknown forces on the mating surfaces (
,
, and
), frictional forces (
,
, and
; where
is the friction coefficient), and the pulling force vibrating the slider on the guideways (
).
The unknown forces (
,
, and
) are calculated from the following equilibrium conditions:
By assigning the length of the slider table (
) and the respective width of the slideway faces (
,
, and
) on which the forces
,
, and
are, respectively, acting,
can be determined as follows:
By comparing the average pressure with the permissible values (determined by Mehta [
21]), the assumed dimensions (
,
,
, and
) were confirmed.
For the assigned material and dimensions, the sliding action between the slider and the guideway is achieved according to
where
is the static friction between two mating surfaces,
is the mass of the slider,
is the gravitational acceleration, and
is the vibrational force calculated as follows:
where
is the mass of the transducer,
is the maximum acceleration, f is the frequency of the applied vibration, and
is the amplitude of the applied vibration. For both the slider table and the guideways made of aluminum, the value of
was larger than (
), which permits the slider table to properly slide over the guideways.
Following the verification of the transducers’ design by means of theoretical calculations and FE analysis, all the components of the designed device were manufactured to validate the design, as in the following section.
3. Performance Evaluation of the 2D Vibratory Device
The vibration is transferred from the transducer to the attached component to be vibrating through the horn attached to both of them. Moreover, the horn amplifies the input amplitude of the vibration in order to achieve a large sufficient amplitude at the output end for the attached component [
22,
23]. However, different parameters affect the resulting transferred vibration amplitude of the attached component, such as the physical and the thermal behavior of its material, the dynamics of its mass, the friction between the contact surfaces, and the interaction between the cutting tool and the workpiece during the cutting process. For this reason, some researchers relied on the trial-and-error method for developing their transducer designs, which is expensive, laborious, and time consuming [
24]. Other researchers based their designs on modeling the horns attached [
25,
26,
27] or on measuring the vibration amplitude at the horn end [
28].
In this work, the desired vibration amplitude to be transferred to the workpiece will be affected by these different parameters for the two transducers used. Thus, the resulting vibration amplitude at the workpiece will vary from the designed one. For this reason, measurement of the designed vibration amplitude for the two transducers will be conducted at their horn end because the vibration amplitude at this point is still equal to the designed one and not yet affected by the previously mentioned parameters. This designed vibration amplitude will be correlated to the measured voltage of the two transducers circuits. Consequently, when the measured voltage of the two transducers circuits varies during the cutting process, this will indicate a variation of the vibration amplitude due to one or more of the previously mentioned parameters, and the variation of the vibration amplitude would be compensated by varying the input voltage of the two transducers circuits.
In this section, a calibration procedure is introduced to evaluate the performance of the 2D vibratory device by determining the applied bolt torque, the input voltage to the transducer and the operating time of a stable performance of the transducers, the horn length of the transducers, the relation between the vibration amplitude and the transducer voltage, and the values of the digital potentiometer steps used as the input for the transducer circuit.
3.1. Natural Frequency Calibration of Transducers
The first step to validate the transducers’ design was to measure their resonance frequency using the circuit shown in
Figure 9.
The function generator is connected to the oscilloscope channel 1 to measure the supplied voltage, and the oscilloscope channel 2 is connected to the resistance for measuring its current flow. At the resonance frequency, the voltage (channel 1) and the current (channel 2) must be in phase. By changing the frequency value using the function generator until the signals of channel 1 and channel 2 become in phase, the frequency attained is the resonance frequency.
The resonance frequency measuring setup, shown in
Figure 9, was used to evaluate the needed torque to be applied to the transducers for achieving the saturation level for the resonance frequency, to determine the effect of the input voltage and the operating time over the resonance frequency and the resistor voltage, and to check the measured resonance frequency of the system when adding the attachments to the transducer is close to the resonance frequency of the bare transducer in order to allow a fine control and readjustment of the desired vibration amplitude, as described in the following sections.
3.1.1. Applied Torque to Pre-Stressed Bolt
The resonance frequencies of the transducers at an input voltage of 15 Vpp are affected by the applied bolt torque, as illustrated in
Figure 10a and
Figure 11a. Experimentally, the higher the torque, the more stable the resonance frequency, and the common saturation torque for both transducers was 30 N.m that provided acceptable stresses using the FE analysis. The relations between the resistance voltage (of the circuit in
Figure 9) and the different applied bolt torques of both transducers are shown in
Figure 10b and
Figure 11b. At 20 N.m torque, the resistance voltage for both transducers was at its lowest value, which permits the highest voltage at the transducers. However, a boundary of at least 30 N.m torque is necessary for attaining the required resonance frequency.
Moreover, a higher torque margin is required to compensate for the saturation due to the heat generation from transducers usage. Furthermore, torque values are not to exceed 45 and 50 N.m for T1 and T2, respectively, which cause the piezoelectric rings to be broken. To satisfy all the desired conditions, the torque values were determined to be 35 and 40 N.m for transducers T1 and T2, respectively.
3.1.2. Optimum Input Voltage and Operating Time
After a definite operating time for the transducers, the optimum input voltage should provide the least variation of the resistance voltage and of the resonance frequency from their original starting values. Experimental tests were conducted to investigate the effect of the input voltage and the operating time on both variations, as shown in
Figure 12 and
Figure 13. After 15 min operating time and at input voltage of 15 and 20 Vpp for both transducers, as shown in
Figure 12a and
Figure 13a, the maximum variation of the resonance frequency was 0.03 and 0.025 kHz for transducers T1 and T2, respectively. These small values are acceptable because despite the fact that these variations would affect the vibration amplitude of the transducer, the required vibration amplitude would be attained by readjusting the input voltage of the transducer circuit in order to compensate the change of the vibration amplitude, as described in
Section 3.2 and
Section 3.3 of this work. Therefore, any input voltage of 10, 15, and 20 Vpp would be used during the operating time of 5 to 15 min. Conversely, the maximum acceptable variation of the resistance voltage of 1% of the input voltage, not affecting the output vibration amplitude, would be of 0.1, 0.15, and 0.2 Vpp for the input voltage 10, 15, and 20 Vpp, respectively. Moreover, the transducers will be used during cutting experiments for a process duration of 5 min. For the T1 and T2 transducers,
Figure 12b and
Figure 13b show that any input voltage of 10 and 15 Vpp would be used for 5 min without affecting the output vibration. To conclude, the input voltage of 15 Vpp would be preferable for 5 min processing because it provides acceptable variation of the resonance frequency and the resistance voltage, which would lead to a higher input voltage to the transducers, resulting in a higher output vibration amplitude.
3.1.3. Horn Length of T1 and T2 Transducers
The resonance frequency of the transducer is affected by its horn length, which is determined from the calculated ultrasonic wavelength derived from the wave velocity and the targeted resonance frequency. The optimum value of the horn length leads to the closest resonance frequency to that of the bare transducer.
Using FE analysis for a resonance frequency of 30 kHz for the system, the horn lengths for the T1 and T2 transducers were estimated to be 20 and 63 mm, respectively. The horns were manufactured and experimentally validated to check the resonance frequency by comparing it to the targeted frequency. For transducer T1, the comparison was conducted between the bare transducer, the transducer with attached horn, and the transducer with horn and workpiece attached, where the resonance frequencies were 32.54, 29.624, and 32.71 kHz, respectively. For transducer T2, the comparison was conducted between the bare transducer, the transducer with attached horn, and the transducer with horn and slider components attached, where the resonance frequencies were 31.17, 30.81, and 32.67 kHz, respectively. Therefore, the estimated horn lengths for T1 (20 mm) and T2 (63 mm) were validated.
3.2. Measurement and Calibration of Transducers’ Amplitude
The second step to validate the transducers’ design was to measure their vibration amplitude. The concept of Baraya and Hossam [
16] for calibrating the transducer (determining the voltage needed to generate the desired vibration amplitude) of a 1D vibratory device using an electromechanical system is adopted and developed for the 2D case using the circuit shown in
Figure 14.
A micrometer head with a scale value of 0.001 mm is opposing the transducer end. When the micrometer anvil contacts the horn end, the resistance voltage drops to zero value, and the micrometer reading indicates the vibration amplitude. The digital multimeter was applied to measure the voltage
across the resistance (103 Ω) and the capacitor. By subtracting the input voltage
from the
, the transducer voltage (
), which generates the required vibration, is determined:
For the T1 and T2 transducers, the measurement process of the output vibration amplitude was conducted by changing the input voltage to the transducer circuit and measuring the resulting output vibration amplitude and
. By applying Equation (11),
for T1 and T2 are determined. To attain a regression model for the needed voltage for the T1 and T2 transducers, leading to the desired output vibration amplitude, the design of experiment (DOE) technique was applied with six replications. From the analysis of variance (ANOVA), the regression models for both transducers were obtained:
The model was significant because the p-value of the F-test was less than 0.05, and the R-sq value was higher than 80 % for T1 (85.7 %) and T2 (93.8 %). Therefore, Equations (12) and (13) would be used for the estimation of the needed for different desired output vibration amplitudes.
3.3. Control Unit
In order to adjust the input voltage of the transducer by which the required vibration amplitude is generated, a control unit was developed, as shown in
Figure 15.
The digital multimeter (6) is used for measuring and the digital multimeter (9) for measuring the resistance voltage (Rmean). A digital potentiometer is responsible for delivering a fraction of the total input voltage (20 Vpp) to Rmean. This voltage fraction is then amplified and delivered as the input voltage of the transducer circuit to generate the required vibration. When the measured voltage increases above its designed value, this would indicate that the amplitude decreased lower than the desired value due to any possible reason. In this case, the input voltage of the transducer circuit is readjusted in order to compensate the change of the vibration amplitude.
During the cutting experiments, the required vibration amplitude would be obtained by setting the transducers voltage to the values derived from the regression models presented in Equations (12) and (13). The input voltage of Rmean for each transducer circuit is specified according to the required transducer voltage.
Figure 16 shows the effect of changing the digital potentiometer steps on the voltage of Rmean and the transducers’ voltage. Therefore, the desired vibration amplitude would be obtained during the cutting experiments by adjusting the digital potentiometer to a defined step that will provide the required input voltage to the transducers.
4. Cutting Experiments and Results
Slot-milling experiments were conducted (with/without applying the 2D vibration) in order to experimentally validate and test the function of the 2D vibratory device by investigating the performance of the slot-milling process in terms of the cutting forces and slot width accuracy.
4.1. Slot-Milling Experiments
The effect of the machining parameters and of the application of the 2D vibration on the performance of the slot-milling process of austempered ductile iron (ADI) was investigated by using the developed device.
ADI is a relatively new engineering material with exceptional combination of mechanical and physical properties and with a good potential to be used for numerous applications in automotive components that require precise machining. These properties return to their distinct and unique microstructure, which contains spheroidal graphite in a matrix of fine acicular ferrite within carbon-enriched stabilized austenite (referred to as ausferrite). In the early stages of its development, the ADI engineering applications were faced with many machining difficulties, and some of these doubtlessly persist to these days. The hardest grades of ADI may reach hardness values of around 50 HRC, which represents a real challenge for any large-volume machining operation. With softer grades of ADI with typical hardness of 300–330 BHN, the matrix structure contains up to 30–40% retained austenite, which would rapidly work harden during machining and could be subjected to mechanically induced martensitic transformation. This phase reduces the machinability of ADI compared with steel of similar hardness.
One grade of ADI was used in this research during the slot-milling experiments because of its optimal ductility and enhanced machinability through the development of a dual-phase matrix (DPM) of ausferrite and proeutectoid ferrite [
29]. This ADI grade was produced by austenitization of ductile iron at 820 °C for 60 min and then by austempering at 350 °C for 90 min; its hardness was 324 HB.
Table 3 illustrates the composition of the ADI grade used in the slot-milling experiments.
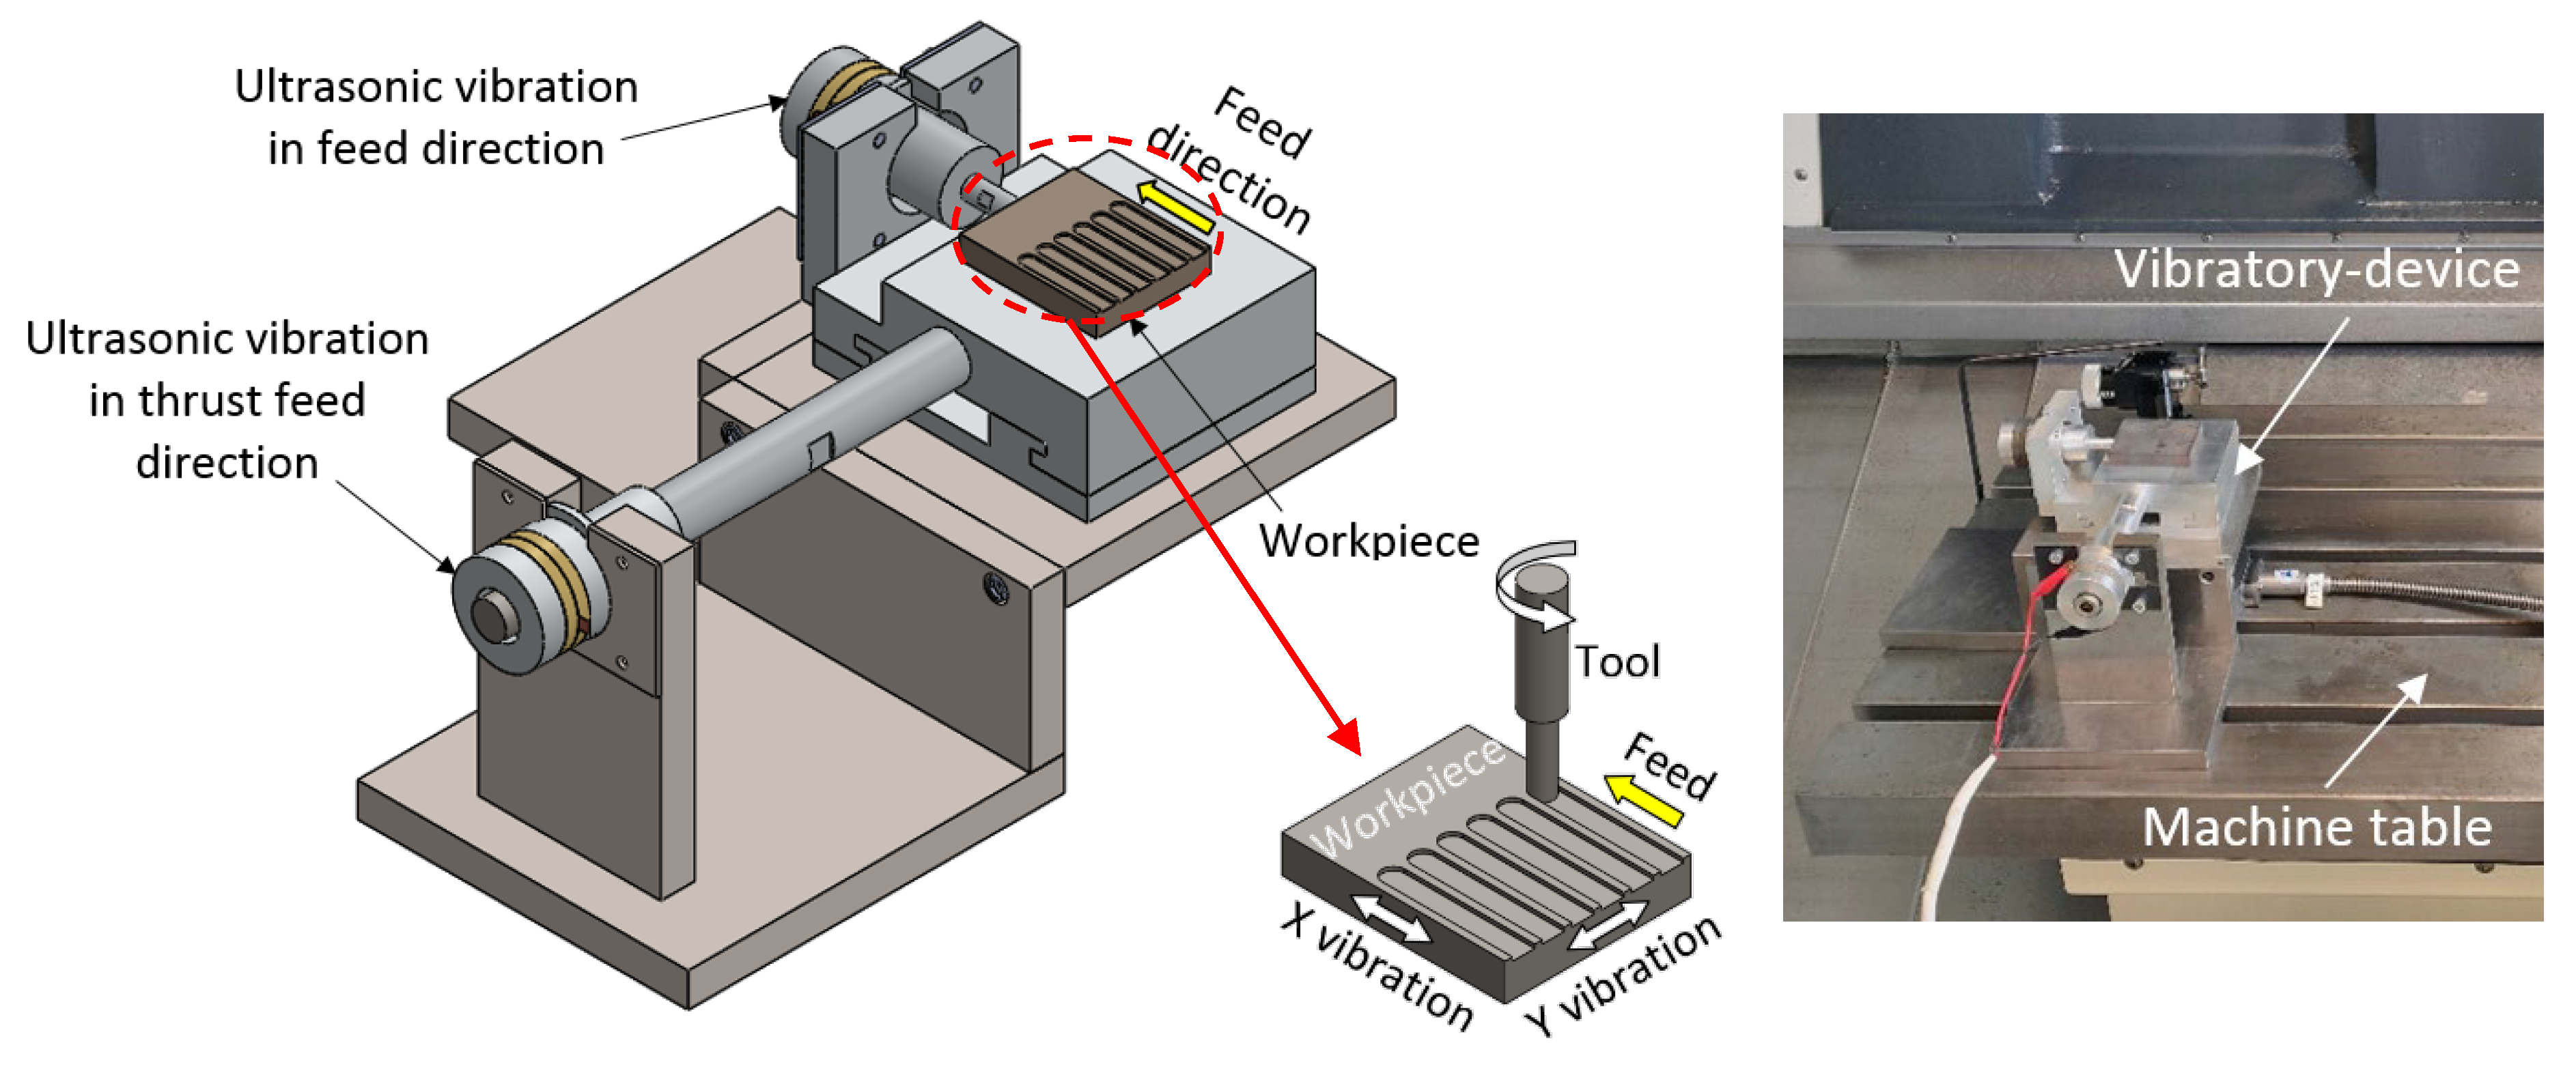
The slot-milling experiments were conducted on the DMG Mori Ecomill 600V Vertical Machining Centre. The workpiece was clamped on the developed 2D vibratory device attached to the machine table, which generated the ultrasonic vibration to the workpiece in both the feed direction (X direction) and the thrust feed direction (Y direction), as shown in
Figure 17.
The 2D vibratory device was designed to generate an amplitude of maximum 10 µm in X and Y directions. Some previous investigations [
12,
13] applied the vibration during the milling experiments with an amplitude around the value of 5 µm. In the current work, the control system provided the vibration of the workpiece with a fixed operating frequency of 32 kHz at the amplitude of 5 and 3 µm in X and Y directions, respectively. The vibration amplitude in the Y direction was determined to be less than that of the X direction in order to reduce its negative effect on the accuracy of the slot width. The cutting tool used for the slot-milling process was a 6 mm diameter four-flute carbide end mill coated with aluminum titanium nitride (AlTiN).
The slot-milling process for the ADI material was investigated at two levels of the machining parameters (rotational speed, cutting feed, and depth of cut), as listed in
Table 4.
Small values of the depth of cut (0.05 and 0.25 mm) were assigned to avoid the effect of the self-excited vibration and the rapid tool wear on the machined surface topography [
30]. Moreover, the small values of the depth of cut limit the heat generation in the cutting zone, which improves the cutting process performance [
31]. Furthermore, Razfar et al. [
32] and Liu et al. [
33] concluded that the performance of the ultrasonic-assisted milling improves at small values of the depth of cut.
The performances of the slot-milling process were investigated in terms of the cutting forces and slot width accuracy. The cutting forces were measured in two directions (X in the feed direction and Y in the thrust feed direction) using a quartz four-component dynamometer (Kistler dynamometer type 9272, with a sensitivity of -7,8 PC/N and a threshold of 0.01 N for Fx and Fy; with Kistler data acquisition type 5697A for operating the charge amplifier type 5070A), and the slot width was measured using a measuring microscope (Mahr, MarVision MM 320).
4.2. Cutting Forces
The effects of the machining parameters and the 2D vibration on the cutting forces (Fx) and (Fy) are illustrated in
Figure 18 and
Figure 19, respectively. Results showed that both forces had a very similar trend. In the conventional milling (CM), Fx and Fy decrease with the decrease in the depth of cut (DoC), the increase in the rotational speed, and the decrease in the feed rate. In the 2D ultrasonic-assisted milling (USM), the effect of changing the DoC over the cutting forces is identical to that effect in CM.
In the 2D USM, Fx and Fy decrease with the increase in the rotational speed only at a higher value of the feed rate, which is a similar behavior to that in CM. On the other hand, Fx and Fy increase with the increase in the rotational speed at a lower value of the feed rate. This deviation of the behavior in USM compared to CM is attributed to the fact that a lower value of the feed rate leads to the increase in the cutting time and therefore leads to the increase in the USM effect because the number of separations between the cutting tool and the workpiece increases. Consequently, the number of impacts of the cutting tool on the workpiece increases and causes the work hardening of the workpiece material, which results in higher cutting forces [
34]. Moreover, the higher the value of the rotational speed (magnification of 2.7), the higher the number of impacts caused by the USM effect, and thus, the more work hardening of the workpiece material. Therefore, the cutting forces increase with the increase in the rotational speed at a lower value of the feed rate.
In the 2D USM, Fx and Fy increase with the increase in the feed rate only at a lower value of the rotational speed, which is a similar behavior to that in CM. However, Fx and Fy increase with the decrease in the feed rate at a higher value of the rotational speed. This deviation of the behavior in USM compared to CM is attributed to the previously introduced work hardening of the workpiece material for a lower value of the feed rate at a high rotational speed.
Generally, the application of USM resulted in a better performance of the process in terms of the decrease in the cutting forces because of the interrupted cutting mechanism. The effect of applying USM in the Y direction (normal to the feed direction) is smaller than that in the X direction (feed direction) because the vibration amplitude in the Y direction (3 µm) is smaller than that in the X direction (5 µm). Smaller vibration amplitude leads to less indentation to the workpiece material resulting from the impact between the cutting tool and the workpiece, as introduced by Fang et al. [
35]. Moreover, the application of USM has a small effect over the cutting forces for the small value of the depth of cut, especially for Fy, because of the small vibration amplitude in the Y direction. The application of USM results in a negative effect on the process performance in terms of the cutting forces at a lower value of the feed rate due to the work hardening of the workpiece material.
4.3. Slot Width Accuracy
The 2D vibratory device provides ultrasonic vibration to the workpiece in the two directions, X and Y. One of the quality measures of the produced slot is the slot width accuracy, which is affected by the elliptical motion generated from the vibration in both directions, X and Y. Furthermore, the vibration in the Y direction (the lateral direction of the slot) has a more significant effect over the slot width accuracy than that in the X direction (the longitudinal direction of the slot). In order to evaluate the slot width accuracy, two measurements of the slot width were conducted at the entrance and the exit of the slot-milling process to determine the slot width variation. The effects of the machining parameters and the 2D vibration on the slot width accuracy in terms of the slot width variation are illustrated in
Figure 20.
In the conventional milling (CM), the slot width accuracy decreases, since the slot width variation increases with the increase in the depth of cut (DoC), which causes the increase in the area of attachment and detachment of the cutting tool and the workpiece. Therefore, there will be more resistance in the attachment and detachment area, leading to the increase in the slot width variation. Furthermore, the slot width variation increases with the increase in the rotational speed due to the lower stability (low rigidity) of the cutting tool at a higher value of the rotational speed, especially for a cutting tool of a small diameter (6 mm diameter). Moreover, the slot width variation increases with the decrease in the feed rate because a lower value of the feed rate leads to more contact time and to more friction between the cutting tool and the machining surface.
In the 2D ultrasonic-assisted milling (USM), the effect of changing the DoC, the rotational speed, and the feed rate over the slot width accuracy is identical to that effect in CM. Yet, the slot width variation in USM is higher in magnitude than that of CM because of the generated elliptical motion causing an interrupted contact between the tool and the workpiece in the perpendicular direction to the slot length. For this reason, the vibration amplitude in the X direction (the longitudinal direction of the slot) was assigned to be 5 µm and was only 3 µm in the Y direction (the lateral direction of the slot) in order to reduce the undesirable effect of applying the vibration in both directions, X and Y, on the slot width accuracy.


