Article

Modelling Particle Motion during High-Voltage Electrostatic Abrasive Implantation Based on Multi-Physics Field Coupling

1
School of Mechanical Engineering, Donghua University, Shanghai 200051, China
2
School of Mechanical Engineering, Shanghai Jiao Tong University, Shanghai 200240, China
3
MoE Key Lab of Artificial Intelligence, AI Institute, Shanghai Jiao Tong University, Shanghai 200240, China
*
Author to whom correspondence should be addressed.
Machines 2022, 10(5), 406; https://doi.org/10.3390/machines10050406
Submission received: 23 March 2022 / Revised: 16 May 2022 / Accepted: 18 May 2022 / Published: 23 May 2022

Abstract

:
Electrostatic abrasive implantation technology is a classical process based on electrostatic field to implant abrasive particles into base material. However, there is still not a quantitative model to ensure the implantation performance due to the fact that the electrostatic abrasive implantation is a complex multi-physics coupled process. To ensure the quality of sandpaper and elucidate the complex motion mechanism of Al2O3 based abrasive particles in a high voltage electrostatic field, a multi-physical field coupling simulation model is proposed. First, the mechanical model is constructed for the complex problem of the electrostatic abrasive implantation process. Then, the field model is established for the problem that the superposition of multi-physical fields leads to complicated environmental conditions. Finally, the evaluation model is established for the problems that the abrasive planting effect is difficult to evaluate and the planting parameters are difficult to adjust. Besides, a tailored electrostatic abrasive planting testing equipment is designed for the implantation performance analysis purpose. Single-parameter electrostatic abrasive planting experiments were conducted to analyze and verify the effect of different pole plate voltage and pole plate spacing on the abrasive implantation rate. To ensure the implantation performance, the applicable pole plate spacing ranges from 30 mm to 50 mm and the suitable voltage is 20–40 kV according to the simulation result in the proposed two models. Meanwhile, the implantation rate experimentation shows the coupling field model coincides with the experiments better. The key factors affecting the electrostatic abrasive planting process are identified, and a feasible multi-physical field coupled abrasive particle motion simulation model is proposed.

1. Introduction

Sandpaper has a wide range of applications in various industries [1,2,3,4,5]. The base material is generally paper and leather. The abrasive is generally corundum, whose mainly composition is Al2O3. The binder is various vegetable adhesives or synthetic adhesives, such as epoxy resin. At present, sandpaper is mainly prepared by the gravity method and electrostatic method. Under the action of gravity, the process of releasing the abrasive particles from the feed bin to the surface of the adhesive layer and adhering to it is called the gravity method. This method is easy to operate but the performance of solidity and sharpness of particle is poor. When the abrasive particles fall freely, their movement is irregular. The particles do not have their tip facing outward. The electrostatic method uses a high-voltage electrostatic field, relying on the electrical properties to make the abrasive become electrically charged and adsorbed on the substrate coated with adhesive. In this method, the blunt end of the particles faces inward and the tip faces outward, thus making the sandpaper with excellent grinding performance. The industrial production process of sandpaper is shown in Figure 1. The grains rise upward by the force of the electric field and enter the base material, forming a dense abrasive coating (Figure 1d).
However, the research on electrostatic abrasive implantation is relatively small, and there is a lack of complete theoretical research on this technology. Its quantitative analysis is rare in the research field since the underlying physics is multiple field coupling case. Most of the studies are about the principal analysis of high-voltage electrostatic field and the characteristics of particle motion in the electric field.
Chen et al. [6] demonstrated uniformly distributed ultrafine diamond particles by using electrostatic spray deposition technique. The effect of electrode voltage, liquid flow and receiving height on the diamond abrasive layer was analyzed. Zhao et al. [7] investigated the electrostatics process for particle. The electrical potential field was measured three-dimensionally and proved that the electrical field strength increased with decreasing nozzle-plate distance. Kazuhito et al. [8] obtained fundamental information for diamond abrasive grains using electrostatic force. Urs et al. [9] proposed a simplified model of the sizing process to investigate the possibility of using an electrostatic technique for the sizing of two kinds of granular abrasive materials. Jeffery et al. [10] investigated the translational motion and rotation about one axis of an ellipsoid in a viscous fluid.
The models proposed in these studies could not accurately describe the actual motion of abrasive particles due to the limitations of the experiment conditions. In recent years, simulation software has given an effective means to study the motion of particles. The particle models include the corona discharge model, the flow field model and the particle dynamics model [11,12,13,14]. The governing equations describing the corona discharge include Poisson’s equation and the current continuity equation. Long et al. [12] developed an unstructured finite volume method to solve the system equations. The flow field model is using the time-averaged Navier–Stokes equations based on the electro-hydrodynamic effect. Zhao et al. [14] employed a hybrid finite-element method to analyze the single wire-plate electrostatic precipitator. The particle dynamics can be modeled using the Euler method or the Lagrangian method [13].
Schmid et al. [15] used simulation methods to calculate the particle dynamics in electrostatic precipitators. They studied the effects of electric field strength and turbulence strength on the particle motion law. Yang et al. [16] coupled the particle corona discharge, flow field, particle charging and transport processes through simulation to study the effects of charged particle concentration on electric field, ion density, particle charging and migration. It was found that the particle space charge on the electric field distribution and ion density in the direction of gas flow. Wissdorf et al. [17] applied the COMSOL particle tracking module to simulate ion motion at atmospheric pressure and obtained the gas flow structure in a confined flow region. Cao et al. [18] studied ellipsoidal particles in a fully coupled manner by direct numerical simulation methods and dynamic grid techniques migration. They investigated rotational motion in a microfluidic channel under the action of a magnetic field. After systematically studying the charging mechanism and motion characteristics of particles in two-phase flow, Gu and Wei [19] performed numerical simulations of particle motion in electrostatic precipitator and wind-abrasive motion. They obtained the trajectories of particles and the results of the effects of various parameters in multiphysics fields on particle motion. These studies provide a good idea for this paper to study the motion of abrasive particles in electrostatic field and air flow field in electrostatic abrasive planting.
This paper intends to conduct a multi-physics field coupling simulation analysis based on COMSOL software for the gravity field, electric field, and fluid field of electrostatic abrasive planting process through finite element analysis. Firstly, the force equations of each physical field are calculated based on the mechanical analysis, and the moving process of abrasive particles is solved to construct the mechanical model. Then, according to the field parameters obtained from the study, the COMSOL field coupling tool is used to construct the electrostatic abrasive planting field model. Finally, the effect evaluation model is established and single-parameter electrostatic abrasive planting experiments are conducted to compare the simulation model and the real experimental effect.

2. Model and Method

2.1. Governing Equations

The electrostatic abrasive implantation process is shown in Figure 2. Firstly, the abrasive particles fall on the conveyor belt from the hopper and move forward with the conveyor belt at a uniform speed Vx. Next, the particles are charged under the action of the electric field after entering the electric field. Then, the charged particles fly upward under the action of the electric field force and enter the base material which coated with adhesive. After drying and other procedures, the sandpaper is finally formed.
Based on the principle of material mechanics for the force analysis of abrasive particles entering the adhesive layer, this mechanical equation is introduced inside the model to study the movement model of abrasive inside the adhesive layer. The adhesive force equation [11] for the adhesive layer is:
F = μ 1 A u l
with:
  • F the adhesive force on abrasive particles, N;
  • μ1 the kinematic viscosity of the adhesive, Pa·s;
  • A the area of contact between abrasive and adhesive layer, m2;
  • u the abrasive velocity, m/s;
  • l the depth of abrasive into the adhesive layer, m.
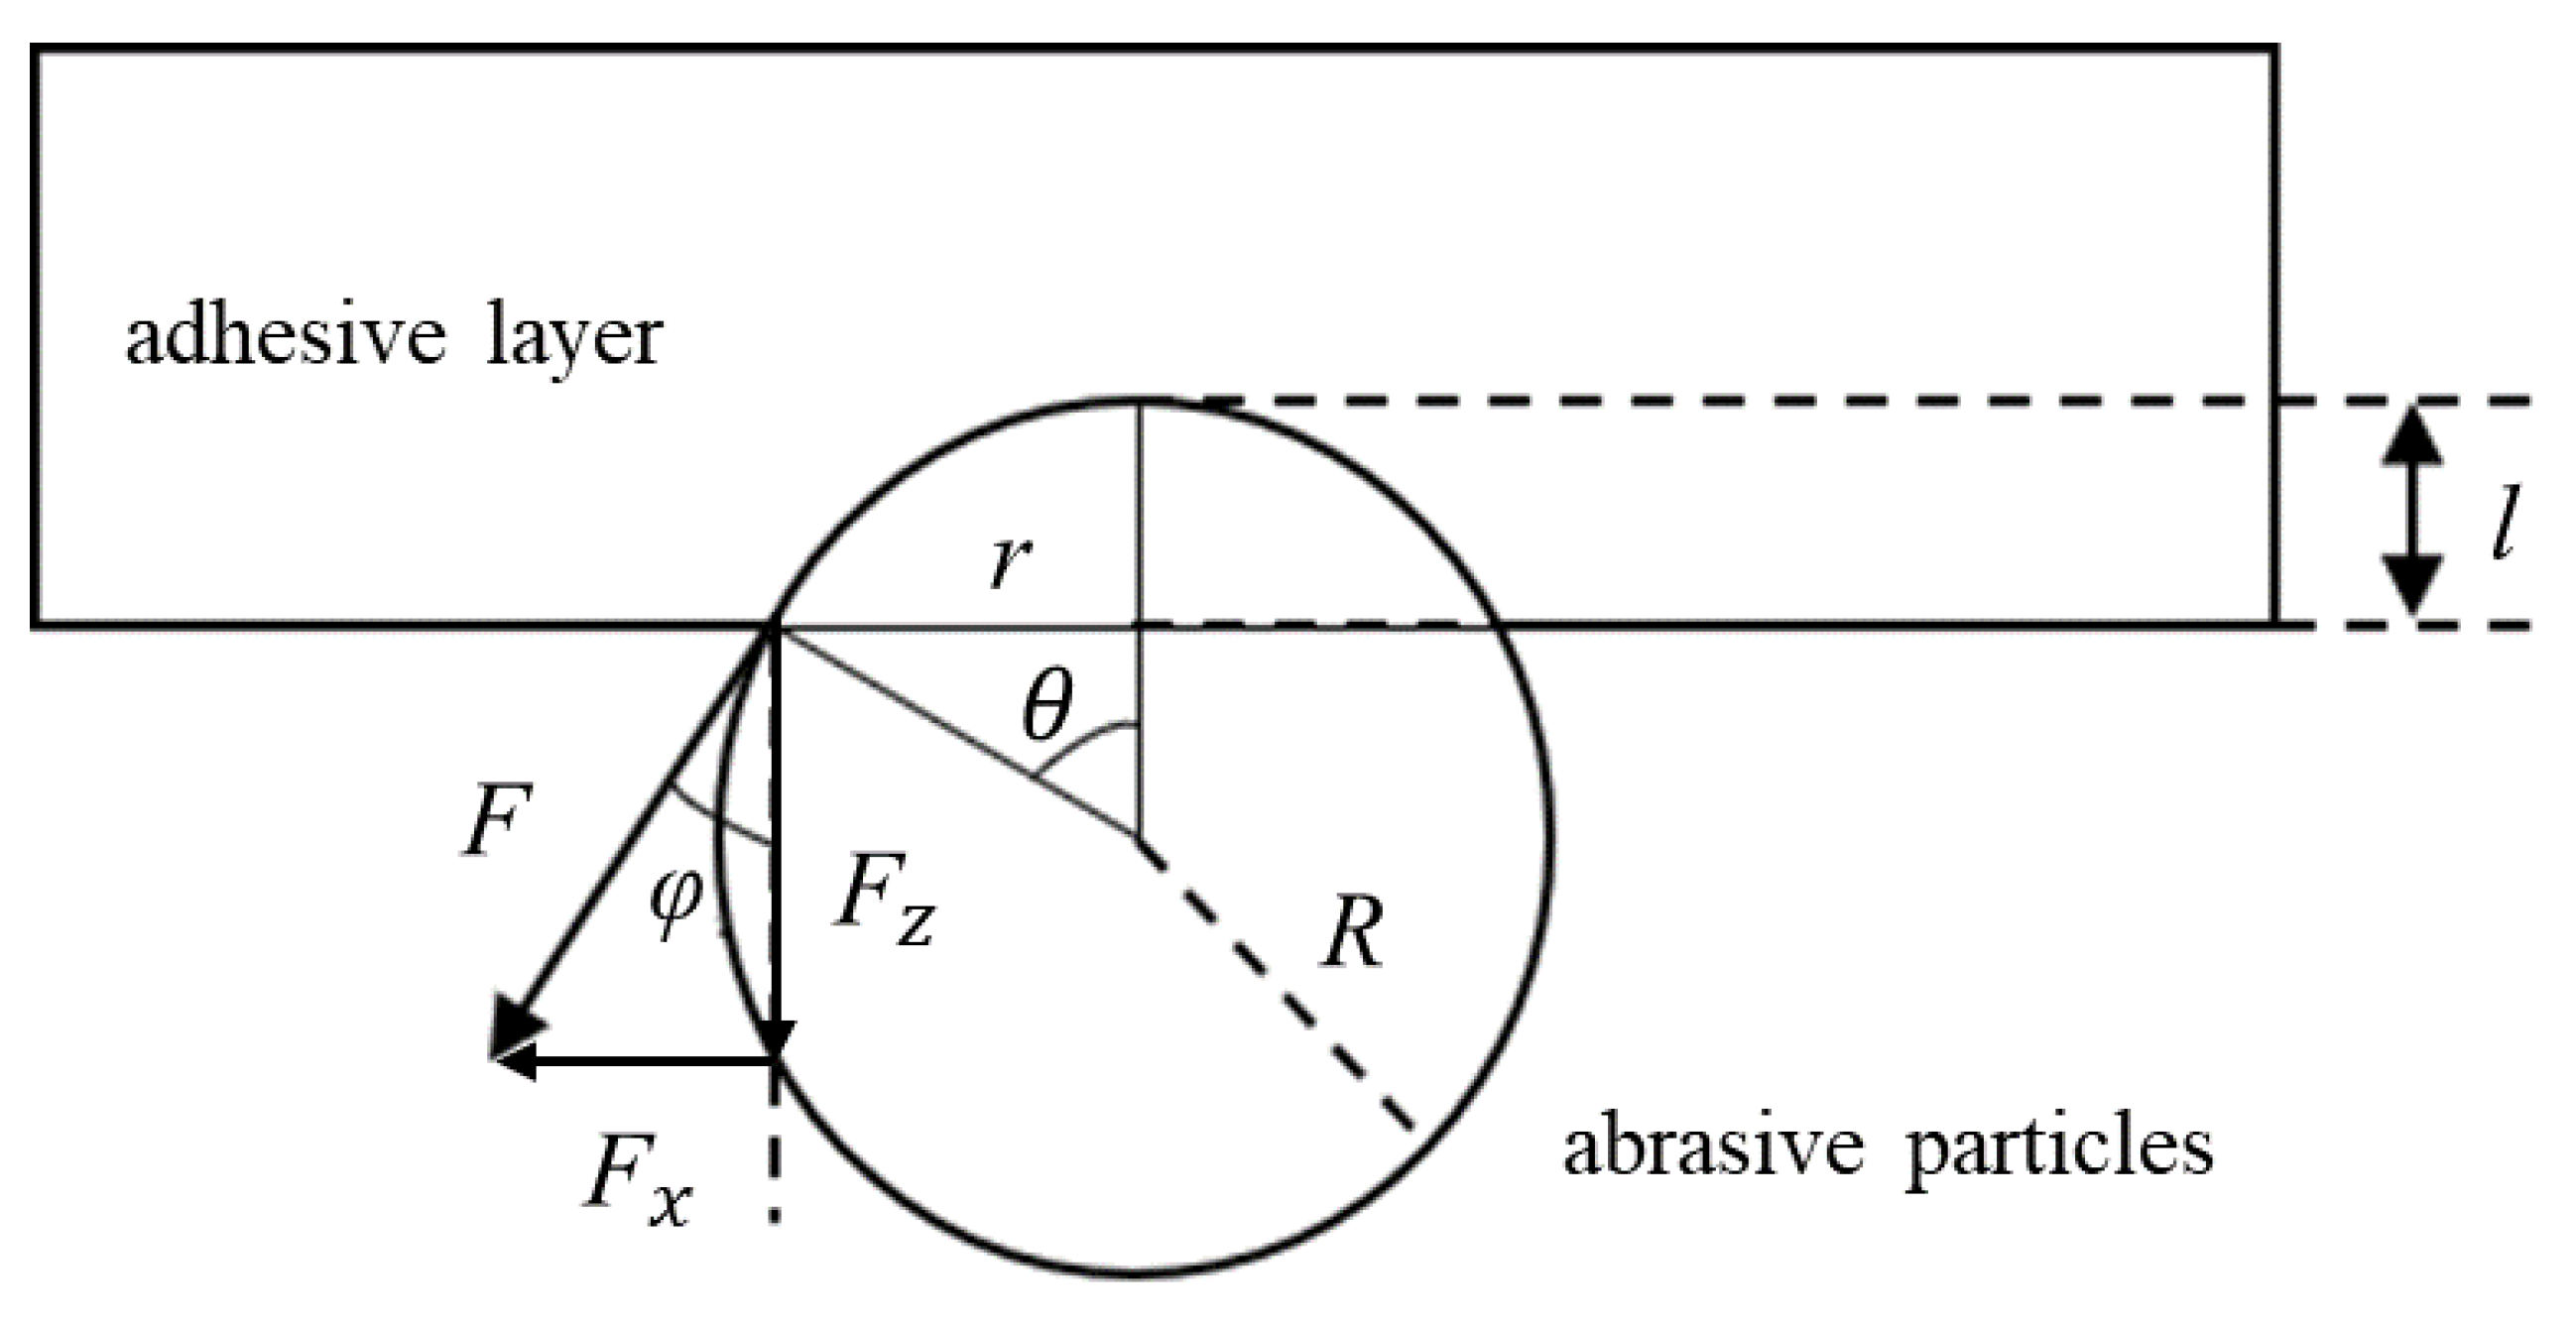
The force analysis of the spherical abrasive particles in the adhesive layer is shown in Figure 3. φ and θ are the reciprocal angles and R is the radius of the sphere.
With θ as the independent variable and as the variable element, the variable area element dA of the sphere into the colloid is:
d A = 2 π r R d θ = 2 π R 2 sin θ d θ
where r = Rsinθ, the depth of abrasive into the adhesive layer, m.
The variable force element dFz in the vertical direction is:
d F z = μ 1 d A u l sin θ = 2 π R μ 1 u sin 2 θ 1 cos θ d θ
where l = (1 − cosθ)R, the depth of abrasive into the adhesive layer, m.
The total force in the vertical direction dFz is
F z = 0 θ d F z = 2 π R μ 1 u 0 θ sin 2 θ 1 cos θ d θ = 2 π R μ 1 u 0 θ ( cos θ + 1 ) d θ = 2 π R μ 1 u ( sin θ + θ )
where θ = arccos ( R y R )   , θ ( 0 , π 2 ) .
The abrasive particles enter the electric field and then charged by the electric field. The particle charging models assume that the particle charge is constant and can be calculated using the theory of White [20]:
q = π 12 ε 0 ε r ( ε r + 2 ) R 2 E
where q is the charge on particles, εr is the particle dielectric constant, ε0 is the vacuum dielectric constant and E is the local electric field.
The electric field force on the particle is:
F e = E q
When the speed of abrasive particles in the adhesive layer is 0, this resistance with its opposite direction will change instantaneously and in the opposite direction, hindering the particles from the adhesive layer, and this force is greater than or equal to the resistance before stagnation. In addition, the particle will still be subject to the electric field force when moving in the adhesive layer, so derive the force equation of the particle inside the adhesive layer as:
Before stagnation:
F z = 2 π R μ 1 u ( sin θ + θ ) m g + E q
After stagnation:
F z = 2 π R μ 1 u ( sin θ + θ ) m g + E q
If the Fz after stagnation is constantly greater than 0, then the abrasive particles will not be dislodged, and if it produces less than 0, it will be affected by dislodging.
As the abrasive moves in the air, it will be obstructed by the fluid, and at the same time, as the speed changes, the abrasive is subjected to the fluid traction force. The fluid traction force equation [21] is
f z = 6 μ 2 R π V z f x = 6 μ 2 R π V x
where μ2 is aerodynamic viscosity, Pa·s; R is particle radius, m; Vz, Vx is the velocity component of the particle in the z-direction and x-direction, m/s. This force is constant in the opposite direction of velocity and is the reflection of fluid viscosity, which in this model is the resistance of air to particle motion.
The force equations for the abrasive particles, are summarized in Table 1.

2.2. Multi-Physics Modelling

2.2.1. Mechanical Model

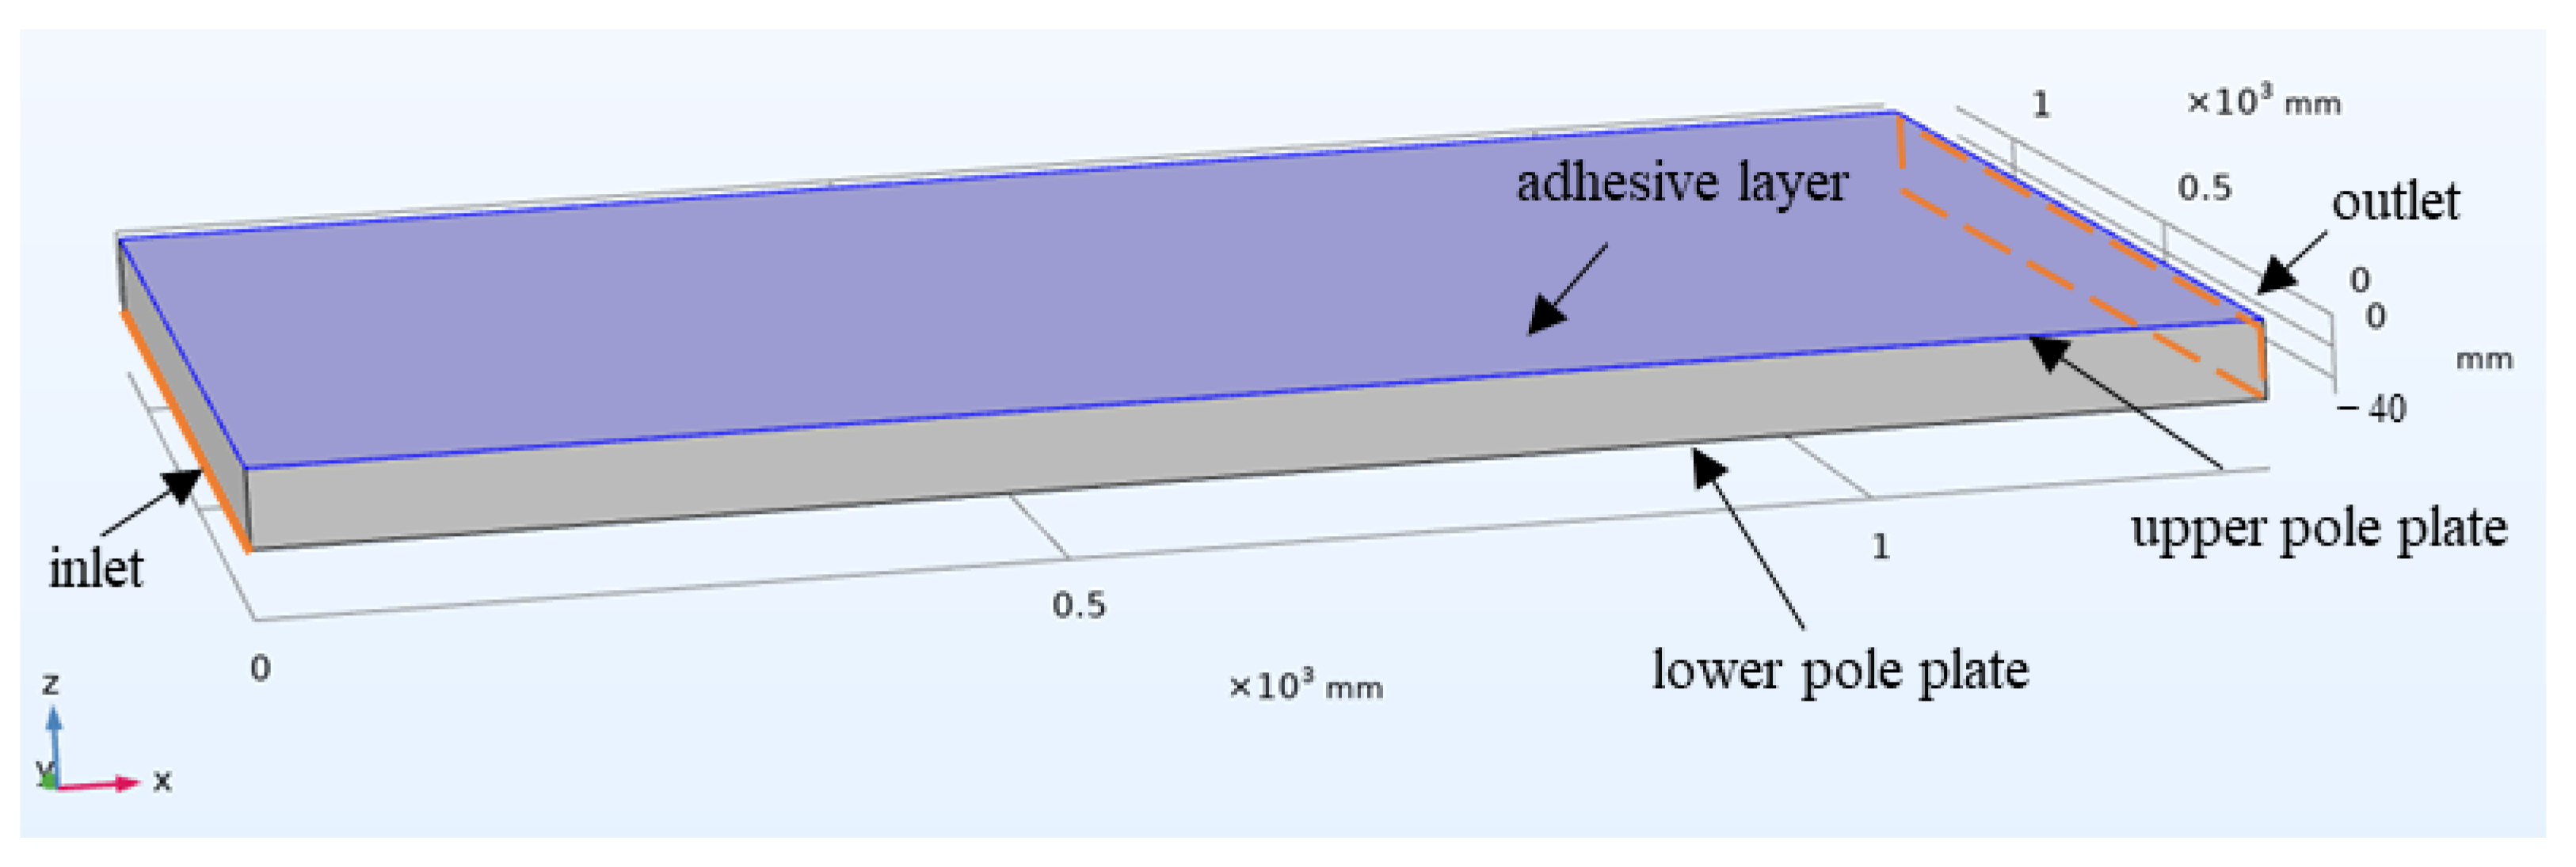
According to the effective size of the actual abrasive planting machine, a rectangular module of size 1250 × 1200 × H mm3 is constructed as the area between the upper and lower pole plates, where H ranges from 30 mm to 100 mm. An area of 1250 × 1200 × d mm3 is set as the adhesive layer below the upper pole plate, where d is the thickness of the adhesive layer and equals 0.25 mm. The adhesive layer area is also inside the electric field domain. The three-dimensional model is constructed as shown in Figure 4.
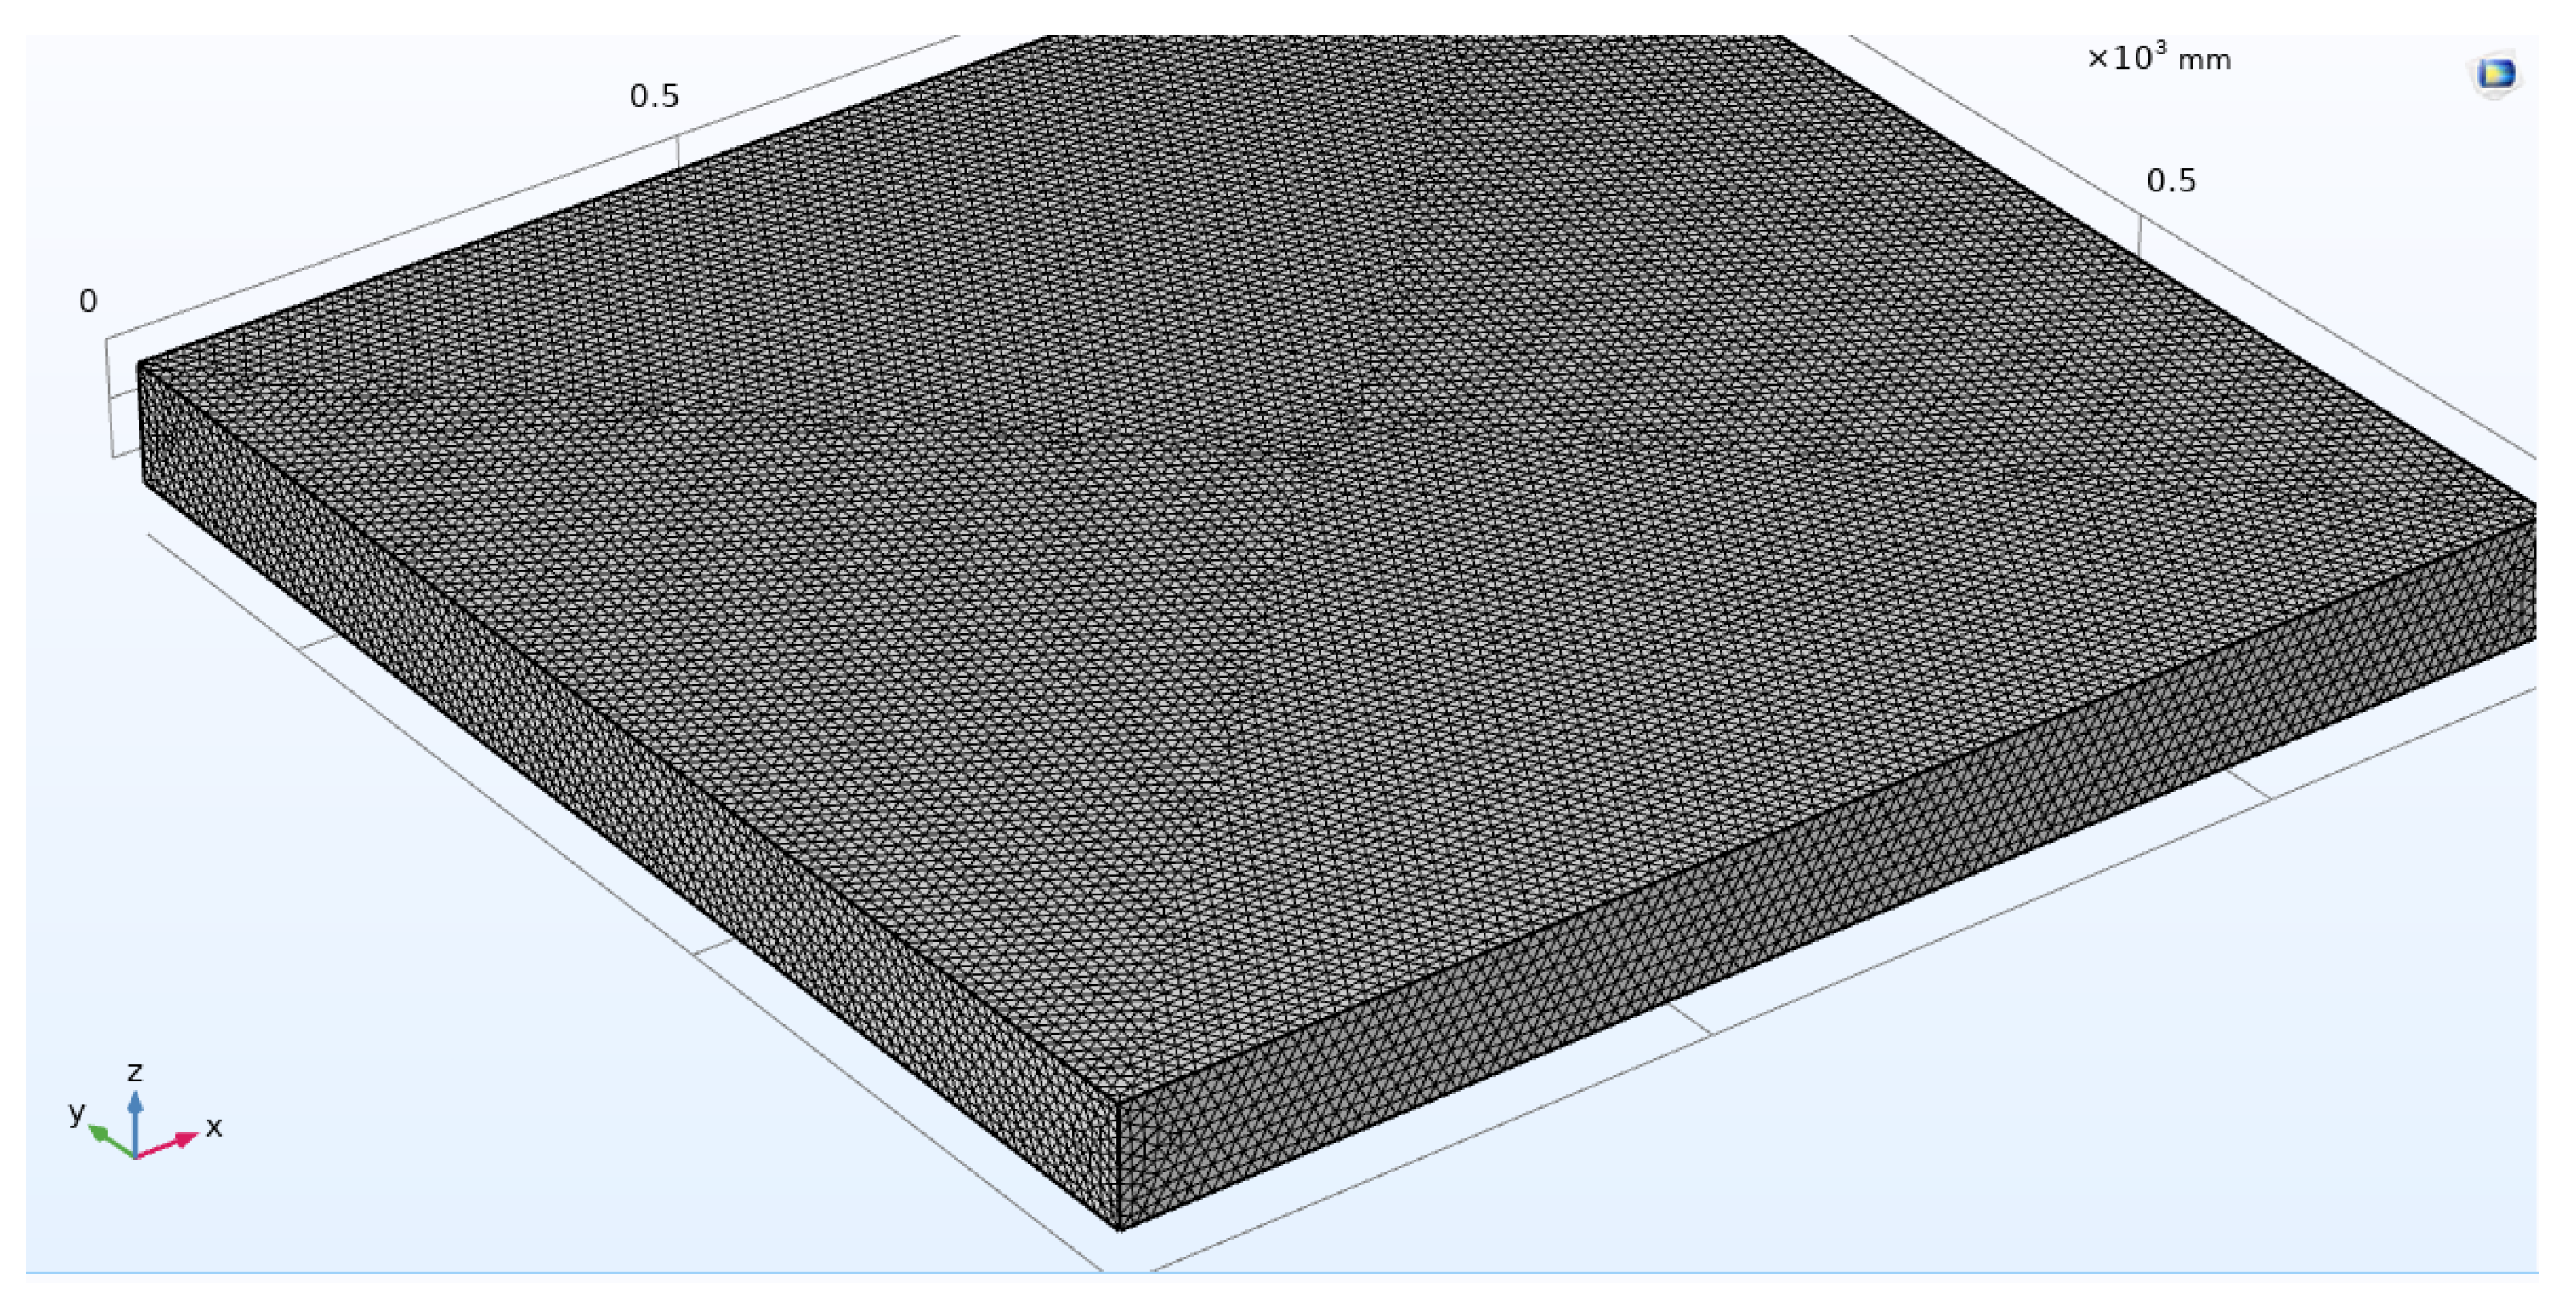
As shown in Figure 5, The grits of sandpaper are usually expressed by the number of mesh, and the size of abrasive particles corresponding to different mesh numbers have different size ranges. In the simulation model, a random function is used to randomly generate spherical abrasive particles with particle size in the range of 0.035–0.045 mm. The abrasive particles are mainly corundum, and their chemical composition is Al2O3. It is assumed that the initial velocity of abrasive particles in the x-direction Vx = 0.1 − 2 m/s. After entering the adhesive layer, Vx = 0.
The force equations calculated above are imported into the COMSOL fluid particle tracking module, and the forces in the electric and flow fields are defined as Fe, and the forces in the adhesive layer are defined as Fg. After that, the mesh is divided, the time step is set, and the model is calculated to study the abrasive implantation rate and the distribution of particles in the adhesive layer of the upper pole plate.

2.2.2. Field Model

A large number of electric charges in the fluid so that the fluid itself is under the action of the electric field force in the strong electric field. The charged area of the flow field is also known as the current field. The flow field can be solved using the time-averaged Navier-Stokes equation and the Reynolds stress standard turbulence model. The time-averaged Navier-Stokes equation is:
· u = 0
ρ 2 ( u · ) u = p + ( μ + μ t ) 2 u + E q
where u is fluid velocity, m/s; ρ 2 is the fluid density, kg/m3; μ is the laminar viscosity coefficient, kg/(m·s); μt is the turbulent viscosity coefficient, kg/(m·s); p is the pressure, Pa.
The Lagrangian model is used to calculate the trajectory of the charged particles in the electric field. Considering the influence of traction force and electric field force on the particle, the force equation of the particle is as follows:
d u p d t = C D 3 ρ 2 | u u p | 4 ρ 1 d p + 6 E q ρ 1 d p 3
C D = a 1 + a 2 Re p + a 3 Re p 2
Re p = ρ 2 | u u p | d p μ
where up is the particle velocity, m/s; ρ 1 is the particle density, kg/m3; q is the particle charge, C.
The field model is based on the basic physical field simulation function of COMSOL, and the specific parameters of the electric field, particle field, and adhesive layer fields are set according to Table 2, after which the abrasive planting process is directly stimulated by the built-in calculation iteration function. First of all, the electric field is set. In industrial production, some companies use sinusoidal alternating current and some use direct current to ensure the quality of coated abrasives, but the most commonly used is a rectangular square wave, which is the most favorable to the stability of the abrasive planting process and reduces the cost of electric field modulation.
The boundary conditions include the electrostatic boundary conditions and the boundary conditions of the fluid tracking module. When setting the voltage, a unit rectangular waveform generation function is used, which is a rectangular waveform with a frequency of 4 Hz, and voltage magnitude of 30–60 kV. The graph of the input voltage waveform is shown in Figure 6. This voltage is applied to the fluid flow particle tracking Fe. As for the boundary conditions of fluid particle tracking module, the entry port of the particles is setting to start from the edge, the leftmost intersection edge from the lower pole plate with the air field is setting as the inlet, the right boundary is setting to the outlet as the vanishing condition, and the upper pole plate is setting as the freezing condition. Then, add the gravitational field by setting the particle properties in the same way as the force field settings above. The material of the adhesive layer and the correction of the physical parameters, such as viscosity and density, are set as shown in Table 3. The final time of the simulations is 1 s and the timestep is 0.01 s.

3. Simulation and Experiments

3.1. Simulation Results

Most of the particles reached the upper pole plate with a very fast speed inside the electric field, and only moved a short distance inside the electric field. The farther the distance, the smaller the number of particles implanted in the adhesive layer, which is consistent with the analysis of the above mechanical equations.
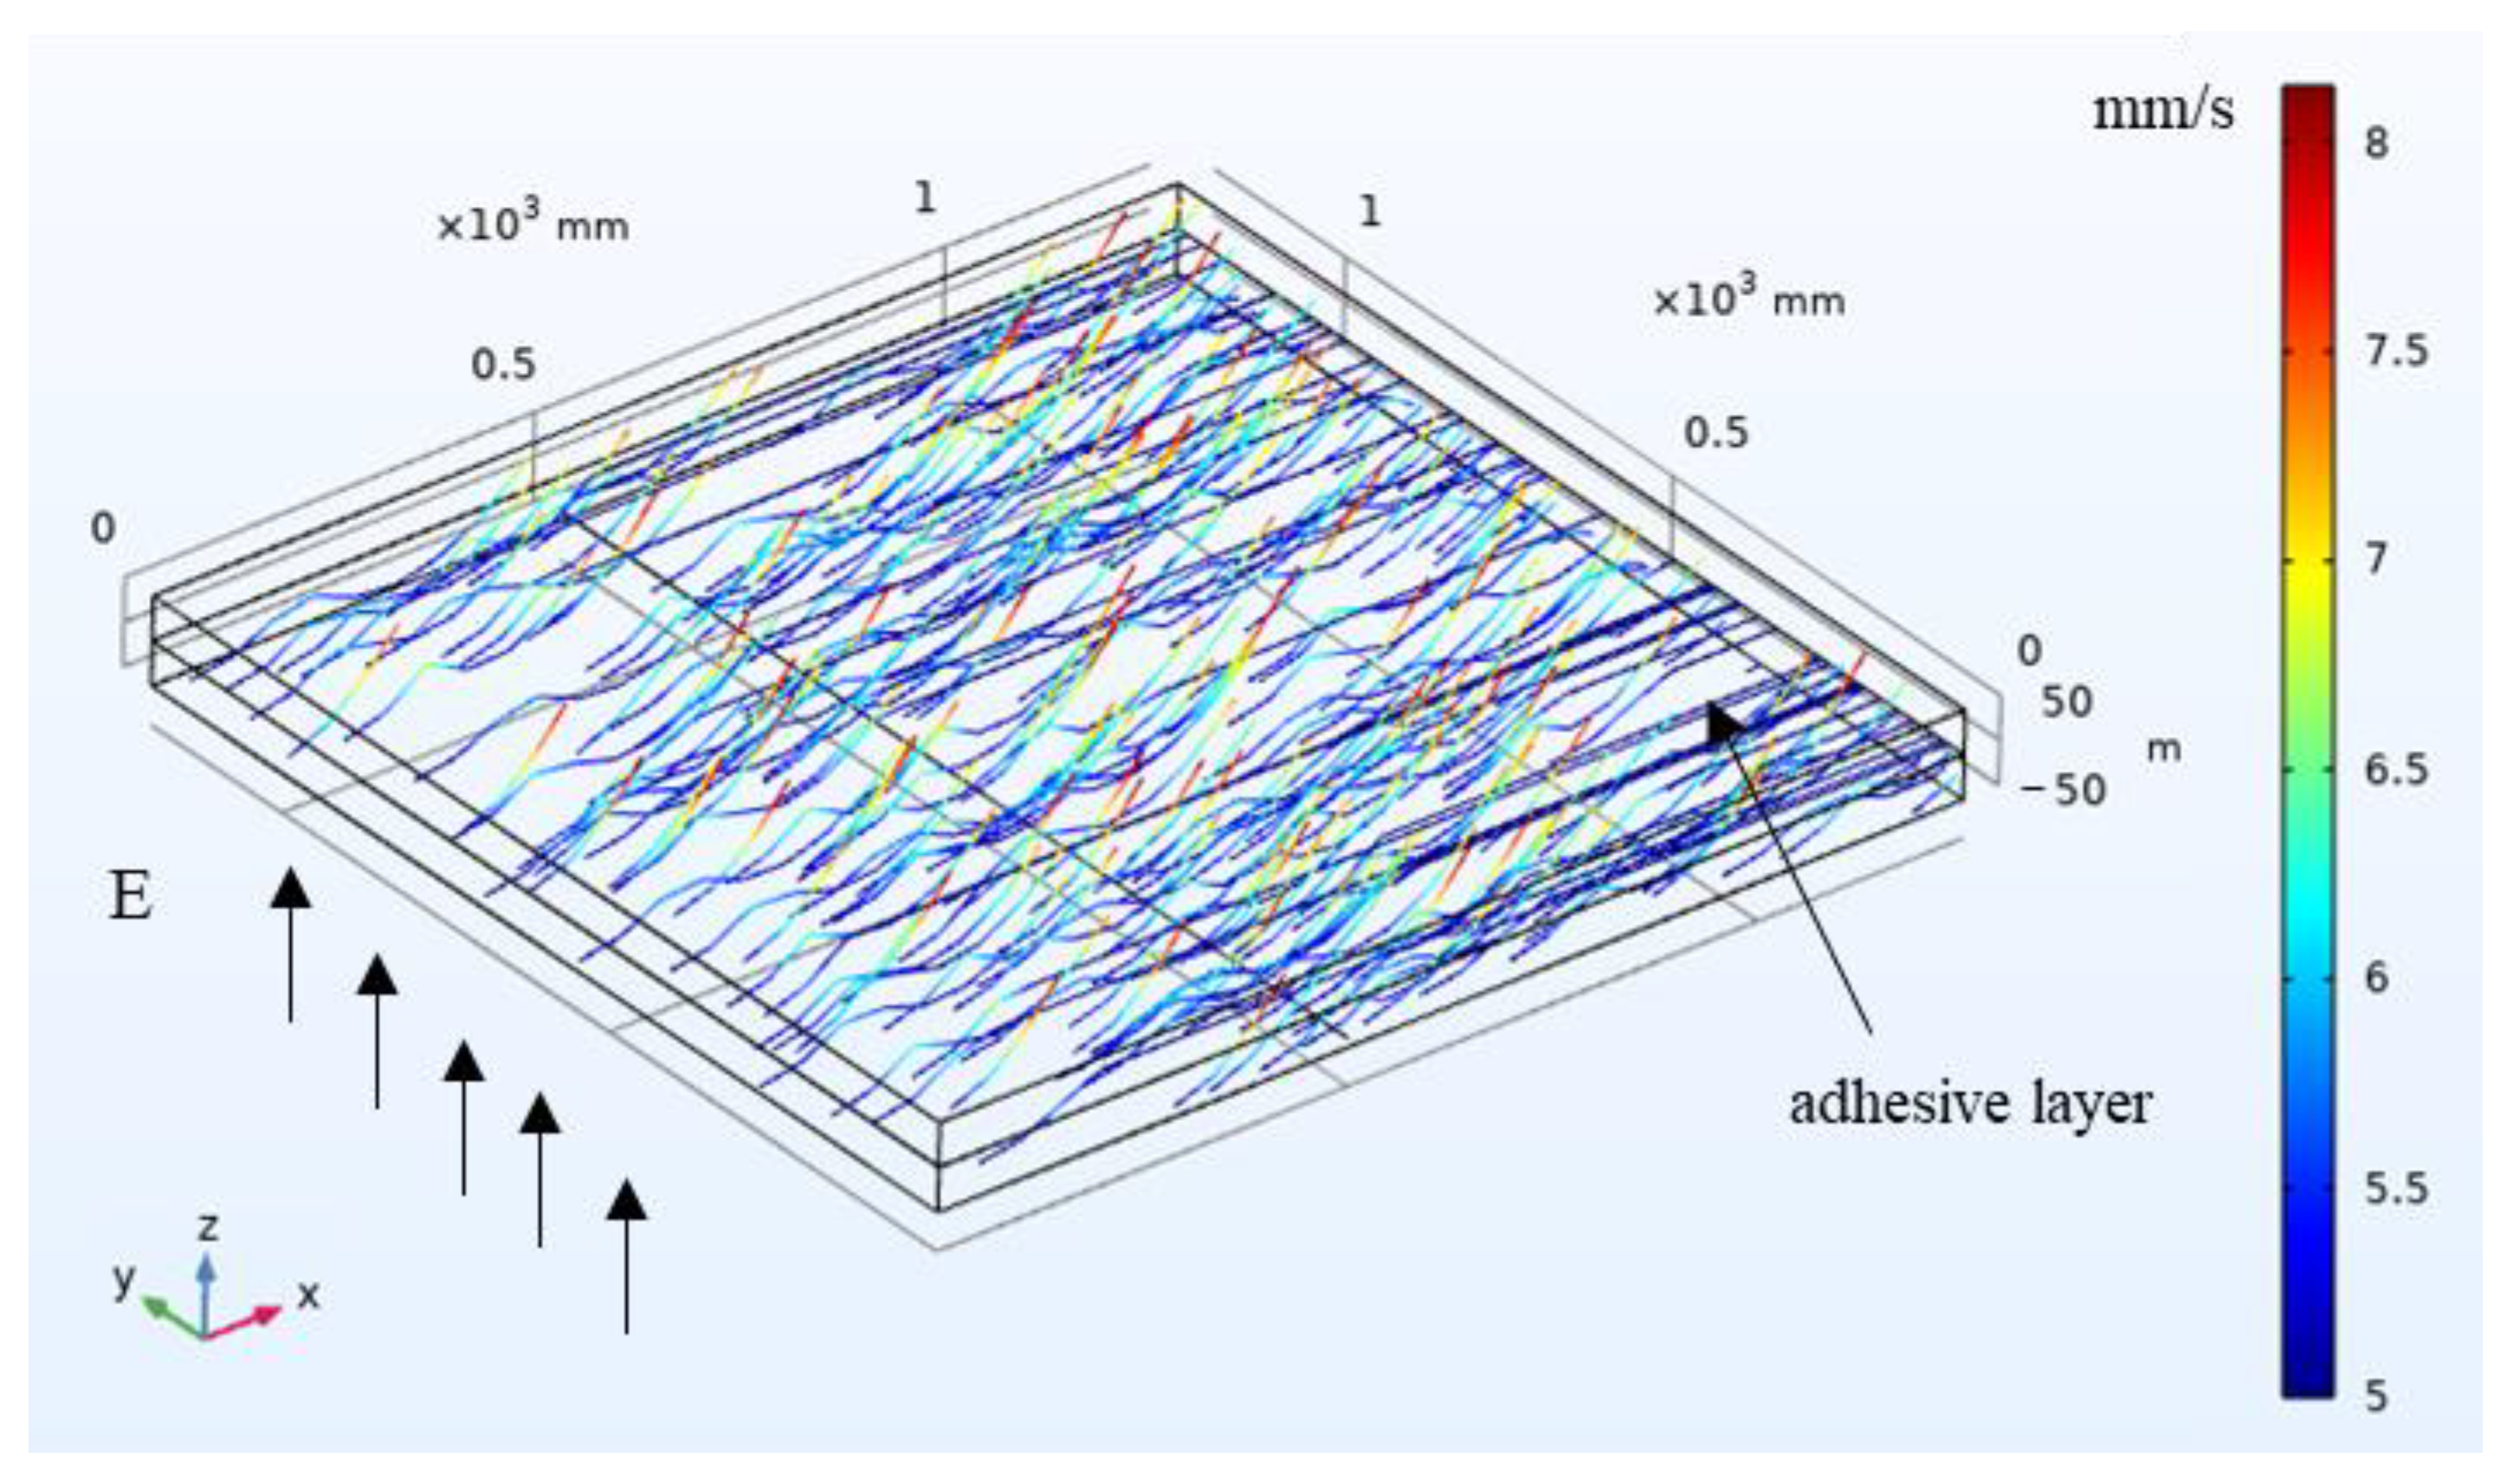
Observing the trajectory of abrasive particles, we can find that there are multiple particle motion states in the figure. In the first one, the particles can be embedded in the adhesive layer; in the second one, the particles reach the adhesive layer, but are not embedded in it; in the third one, the particles fluctuate inside the electric field and do not interact with the adhesive layer. The existence of these three cases shows that the mechanical model construction is close to the actual industrial process and shows that the model construction has some scientific validity.
The simulation results are shown in Figure 7 and Figure 8. The abrasive particles are placed uniformly on the y-axis (i.e., the initial position x = 0). The lower plate is the negative pole and its voltage is alternating. The upper plate is grounding and its voltage is 0. It is assumed that the air is uniformly distributed between the two plates, which generates the resistance to the particles. The color bar indicates the different velocity of the particles, the redder the color, the greater the velocity. For the mechanical model, it takes 1251 s in average for 10 times computation. The 10 times average computational time is 3013 s for the field model, which is about 2.4 times as long as the mechanical model.
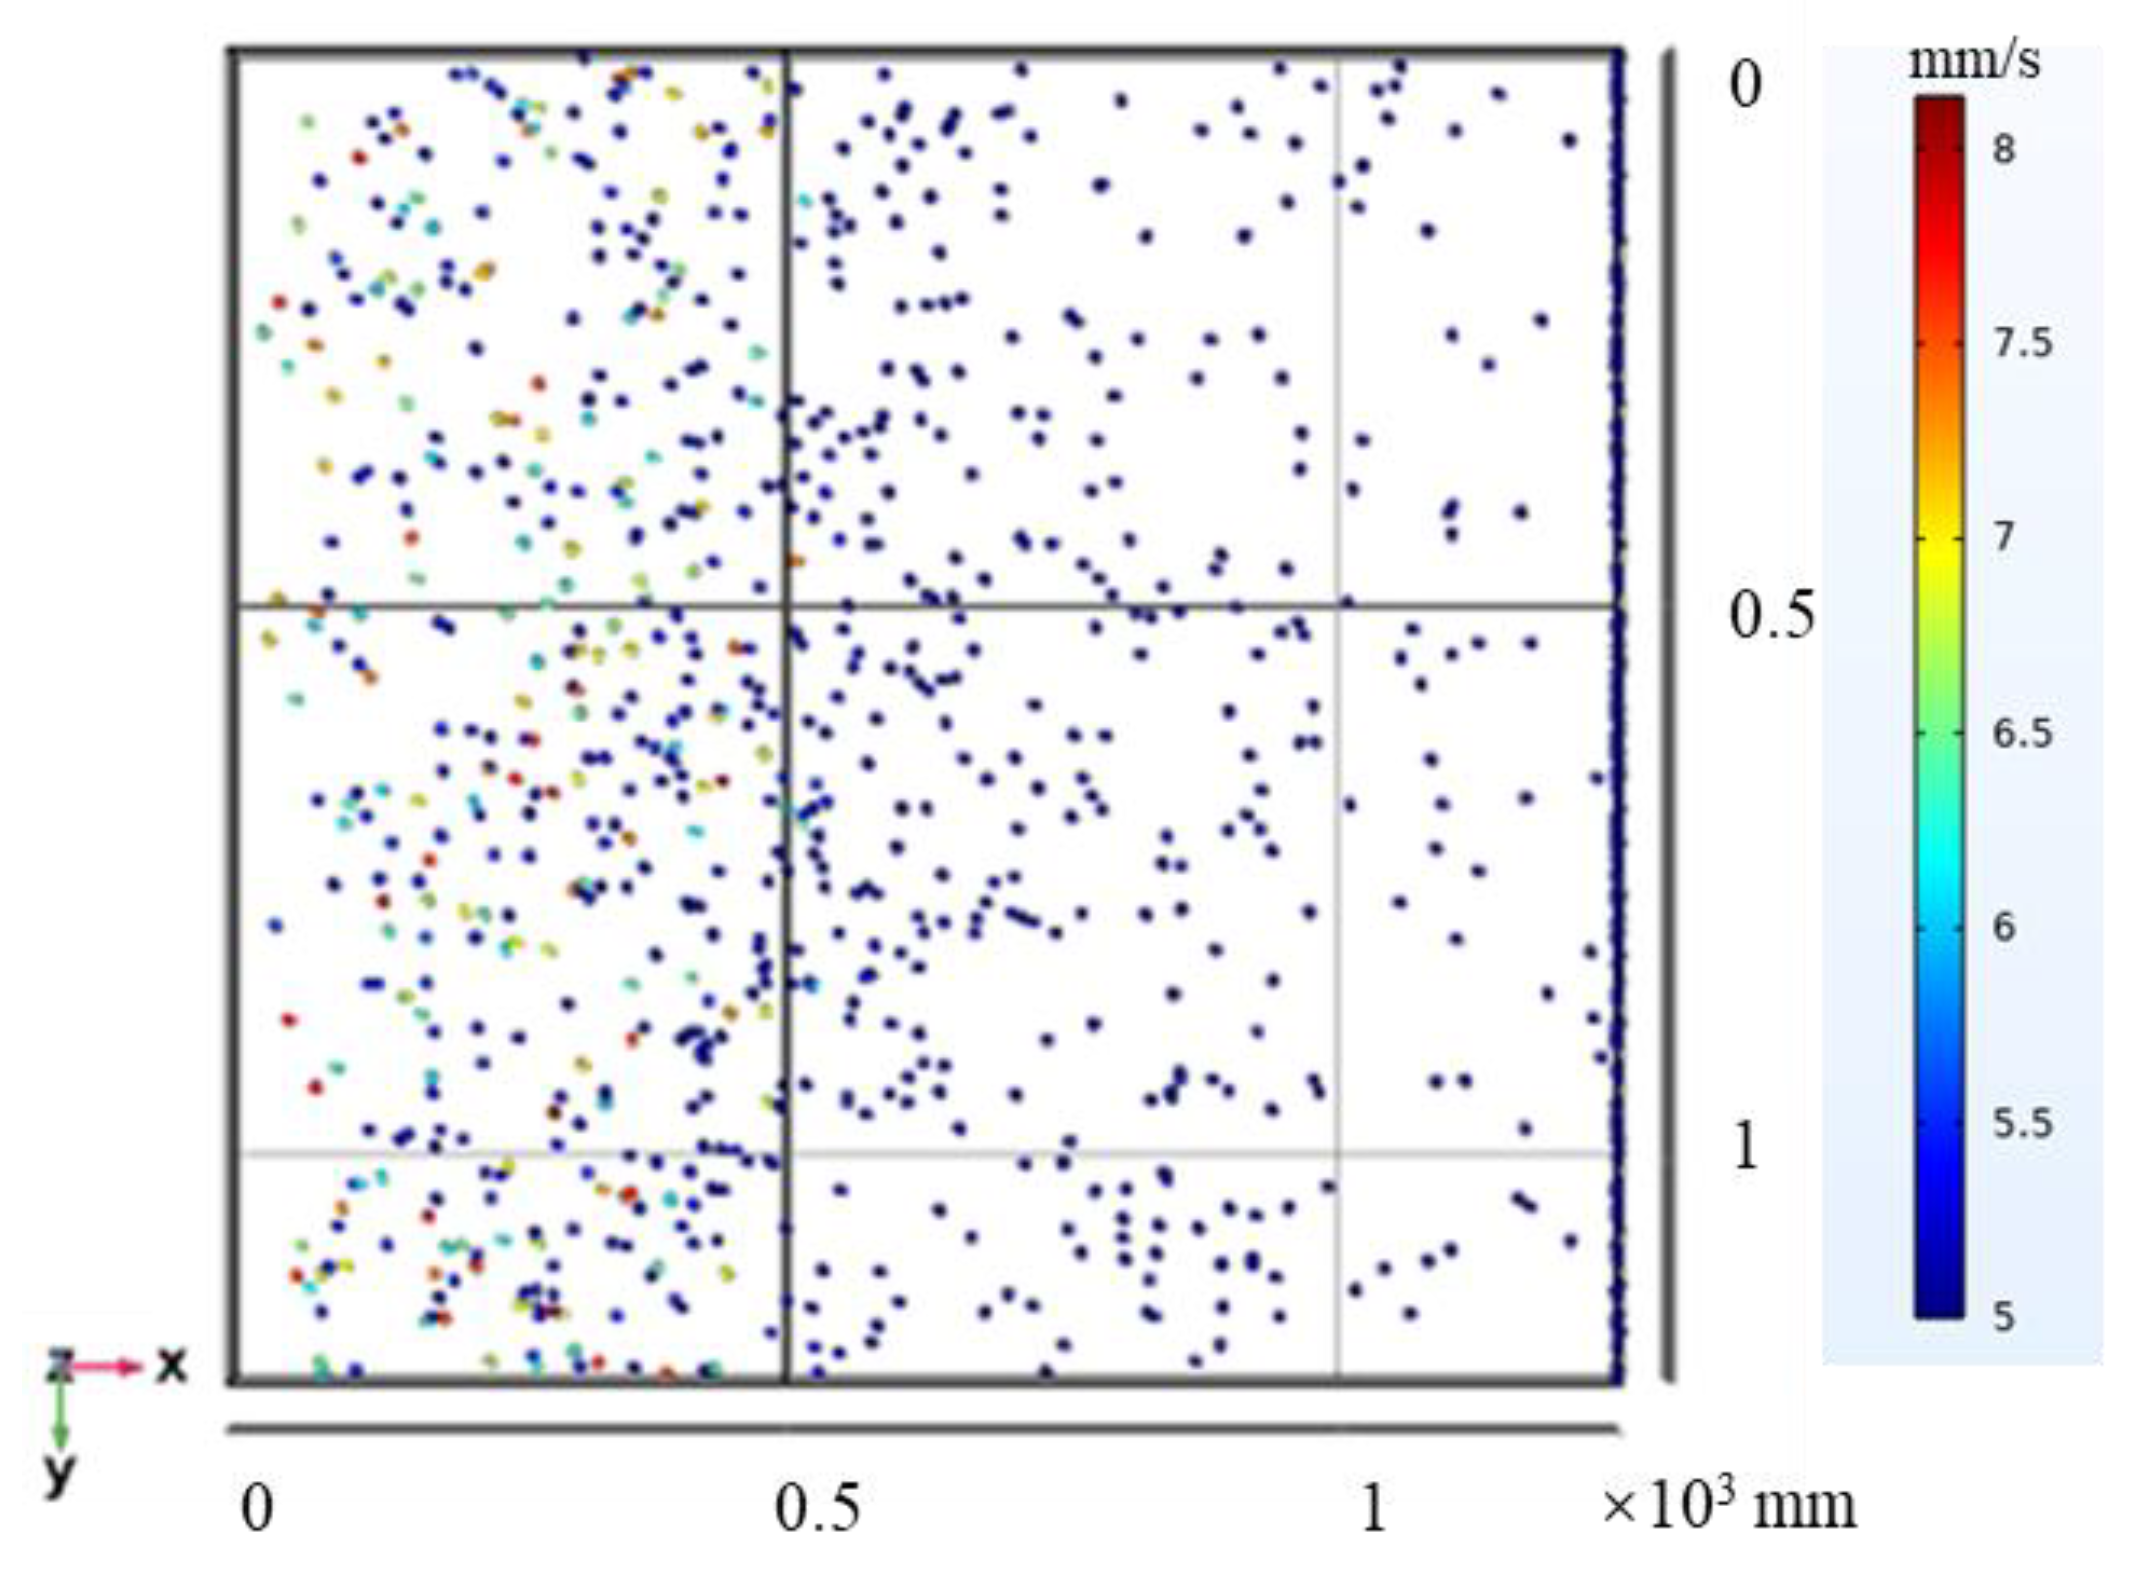
As shown in Figure 9, the number of particles distributed at the proximal end is larger and the number of particles distributed at the distal end is smaller. Most of the particles are directly embedded in the adhesive layer, the velocity is large, and they do not experience reciprocal motion. A small number of particles are detached after contacting with the adhesive layer, and some particles do not interact with the adhesive layer or the reciprocal motion in the electric field. This effect is consistent with the mechanical model, which means that the simulation is more reliable. Figure 10 shows the trajectory of particle motion simulated by the mechanical model, which reflects the state of particle motion as well as the location distribution and other characteristics. Figure 11 shows the particle cloud diagram in the adhesive layer of the field model. Compared with the mechanical model, the number of particles in the adhesive layer of the field model is smaller, and the position of the particles is farther in the x-direction.
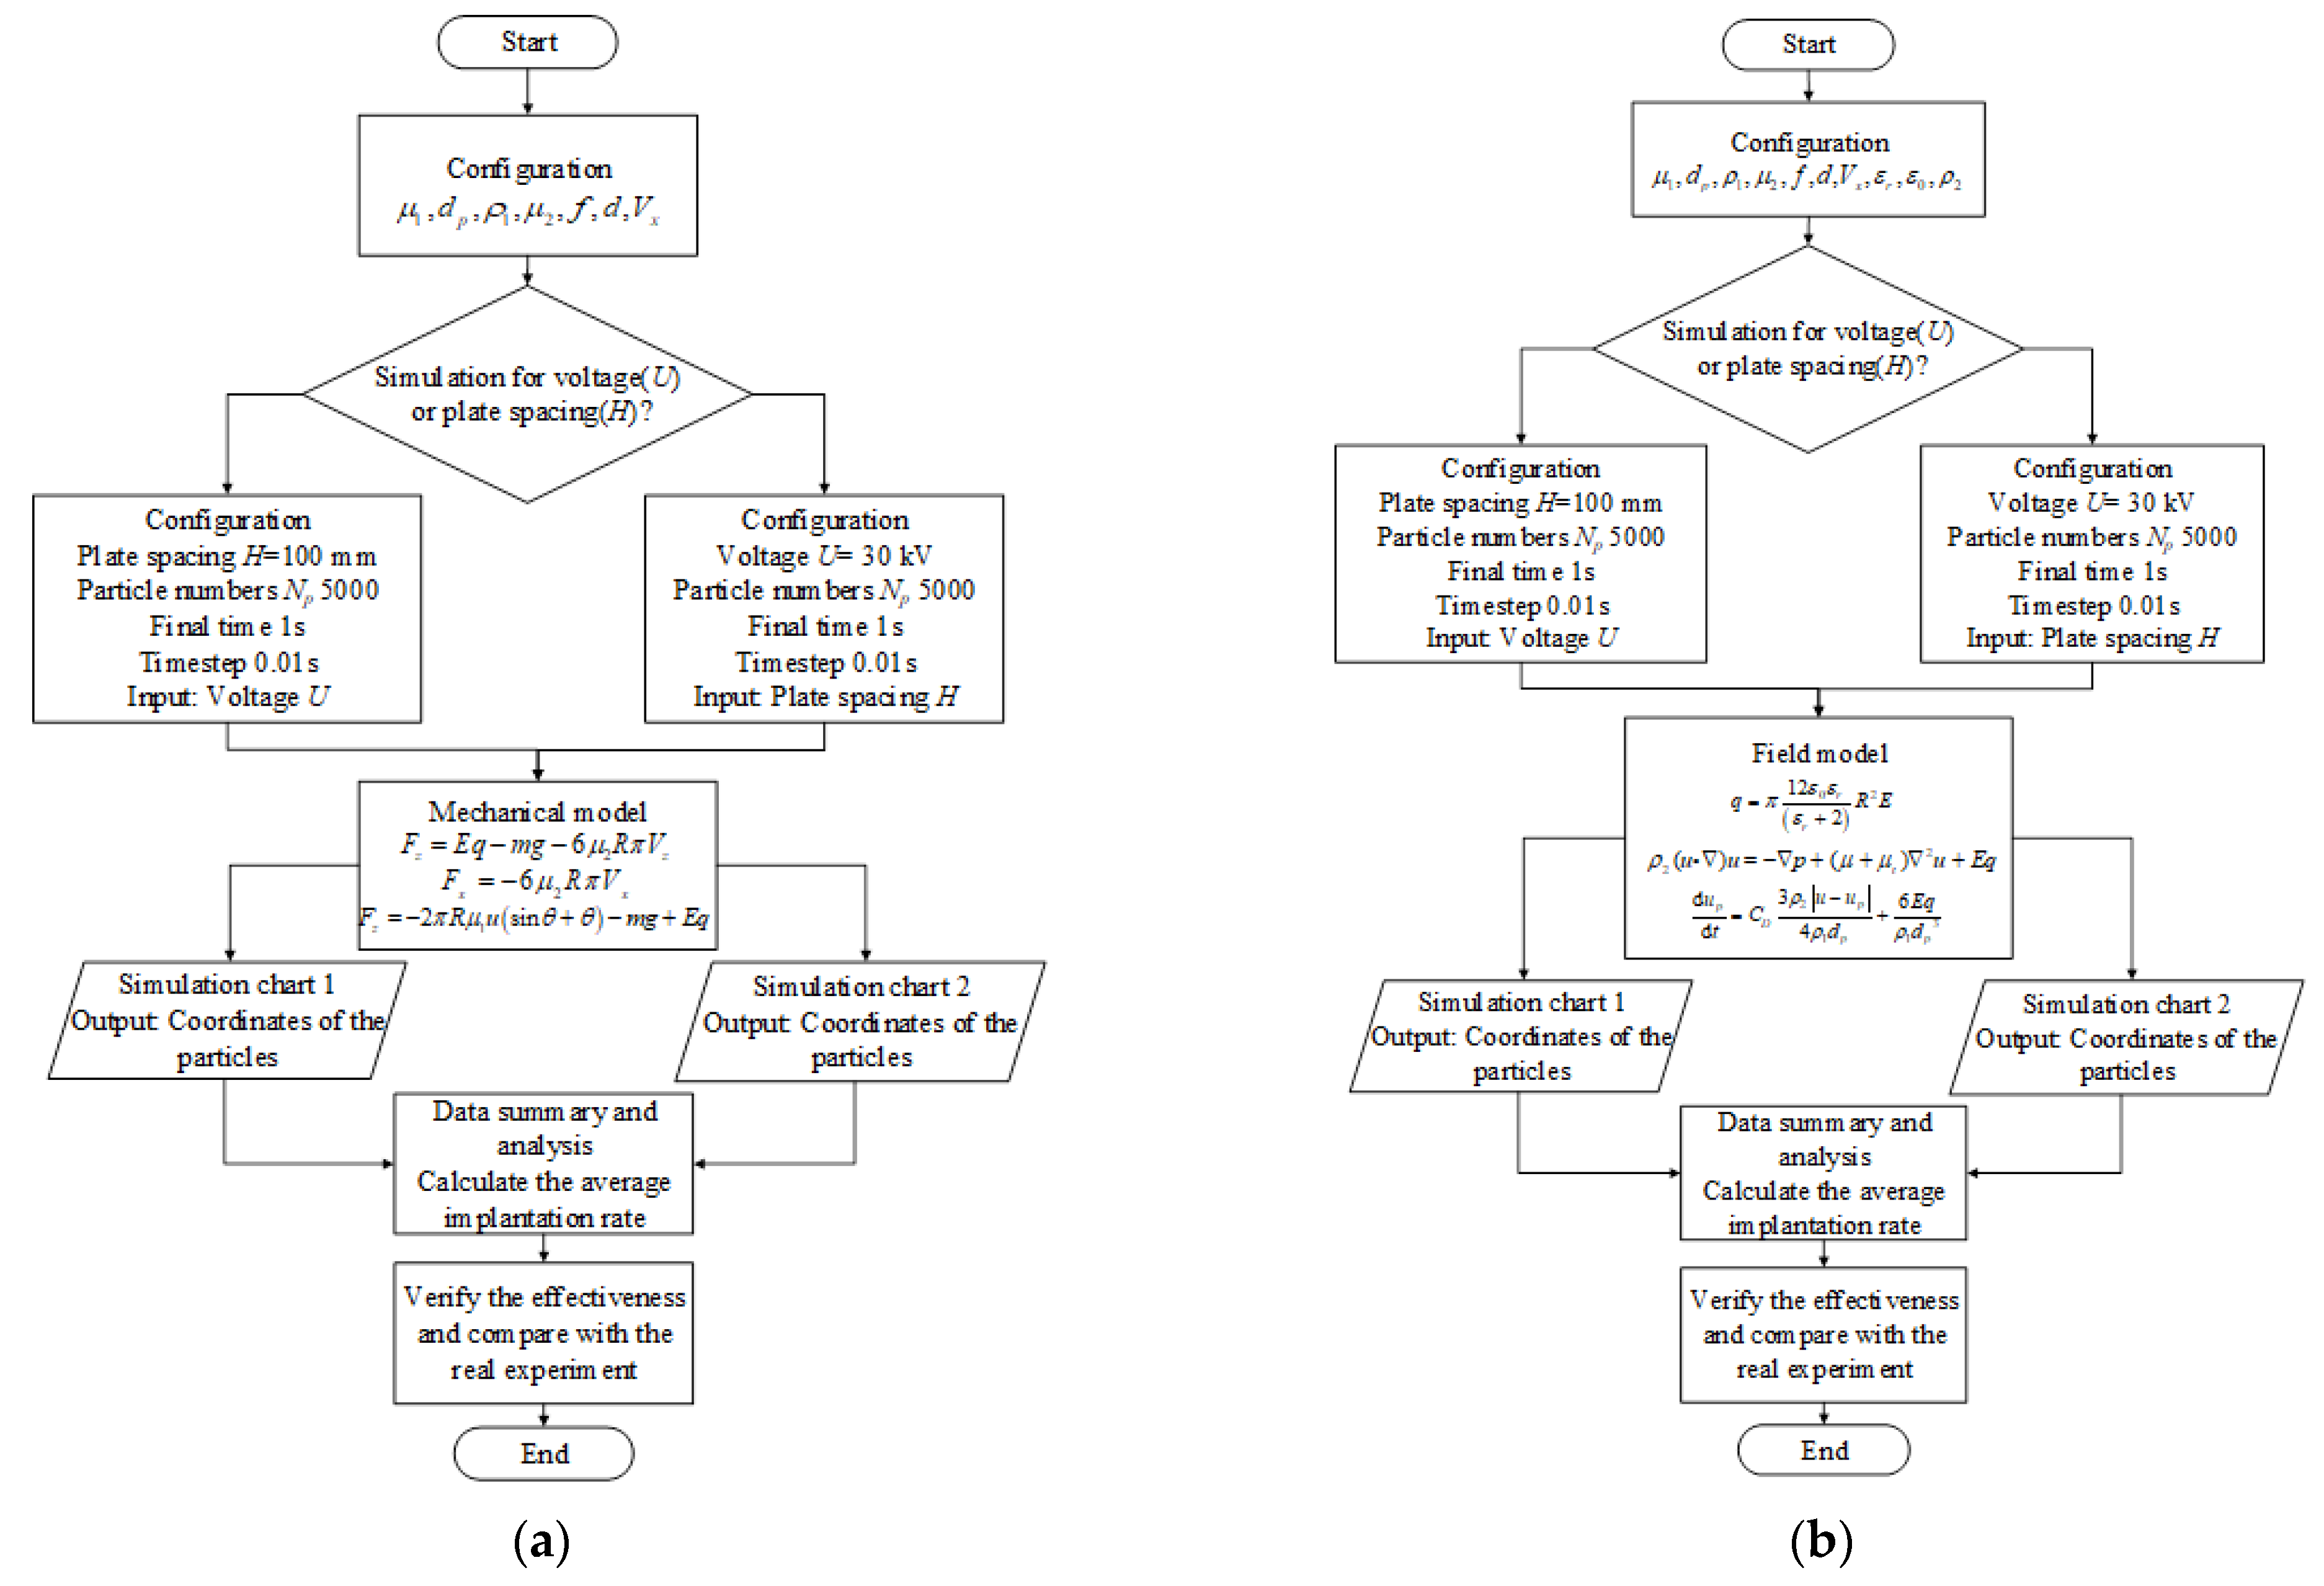
The flowcharts of the mechanical model and the field model are shown in Figure 12. These flowcharts show how the conduct the simulation experiments. As for the mechanical model, the force-motion equation of the particles is established firstly. Then, for different voltages and pole-plate spacing the trajectory of the particles is solved. The sand implantation rate is calculated according to whether the final position of the particles is within the pole-plate range. As for the field model, the action of the flow field on the particles is considered in addition to the action of the electric field, and the electric field, flow field, and particle motion models are coupled in COMSOL Multiphysics. Finally, the simulation results of the mechanical and the field model are compared with the real experiment results.

3.2. Experiments

The electrostatic abrasive planting measuring equipment is shown in Figure 13. The diameter of the electrode plate on the machine is 100 mm, the pole plate spacing can be adjusted in the range of 20 mm–120 mm, and the voltage range is 0–60 kV. This equipment is used to verify the optimal parameters of voltage and plate spacing in the electrostatic abrasive planting. The upper pole plate height is adjustable and a weighing module installed in the lower pole plate. The abrasive planting effect is generally evaluated by the implantation rate δ :
δ = n e n t
where ne is the abrasive particle number embedding in the adhesive layer, nt is the total particle number.
In practice, the weighing method is generally used to measure the implantation rate (i.e., the number of particles is expressed in terms of mass). The implantation rate is calculated by measuring the mass of the lower plate before and after the sand implantation. The implantation rate δ is expressed as:
δ = m t m r m t
where mr is the mass of particle left on the lower plate after implantation, mt is the total particle mass.
To reduce the random error, 10 measurements are made for each parameter. The mean value of the implantation rate is used to describe the planting effect:
δ ¯ = 1 N i = 1 N δ i
where N = 10, N is the times of measurements.

3.2.1. Influence of Pole Plate Voltage

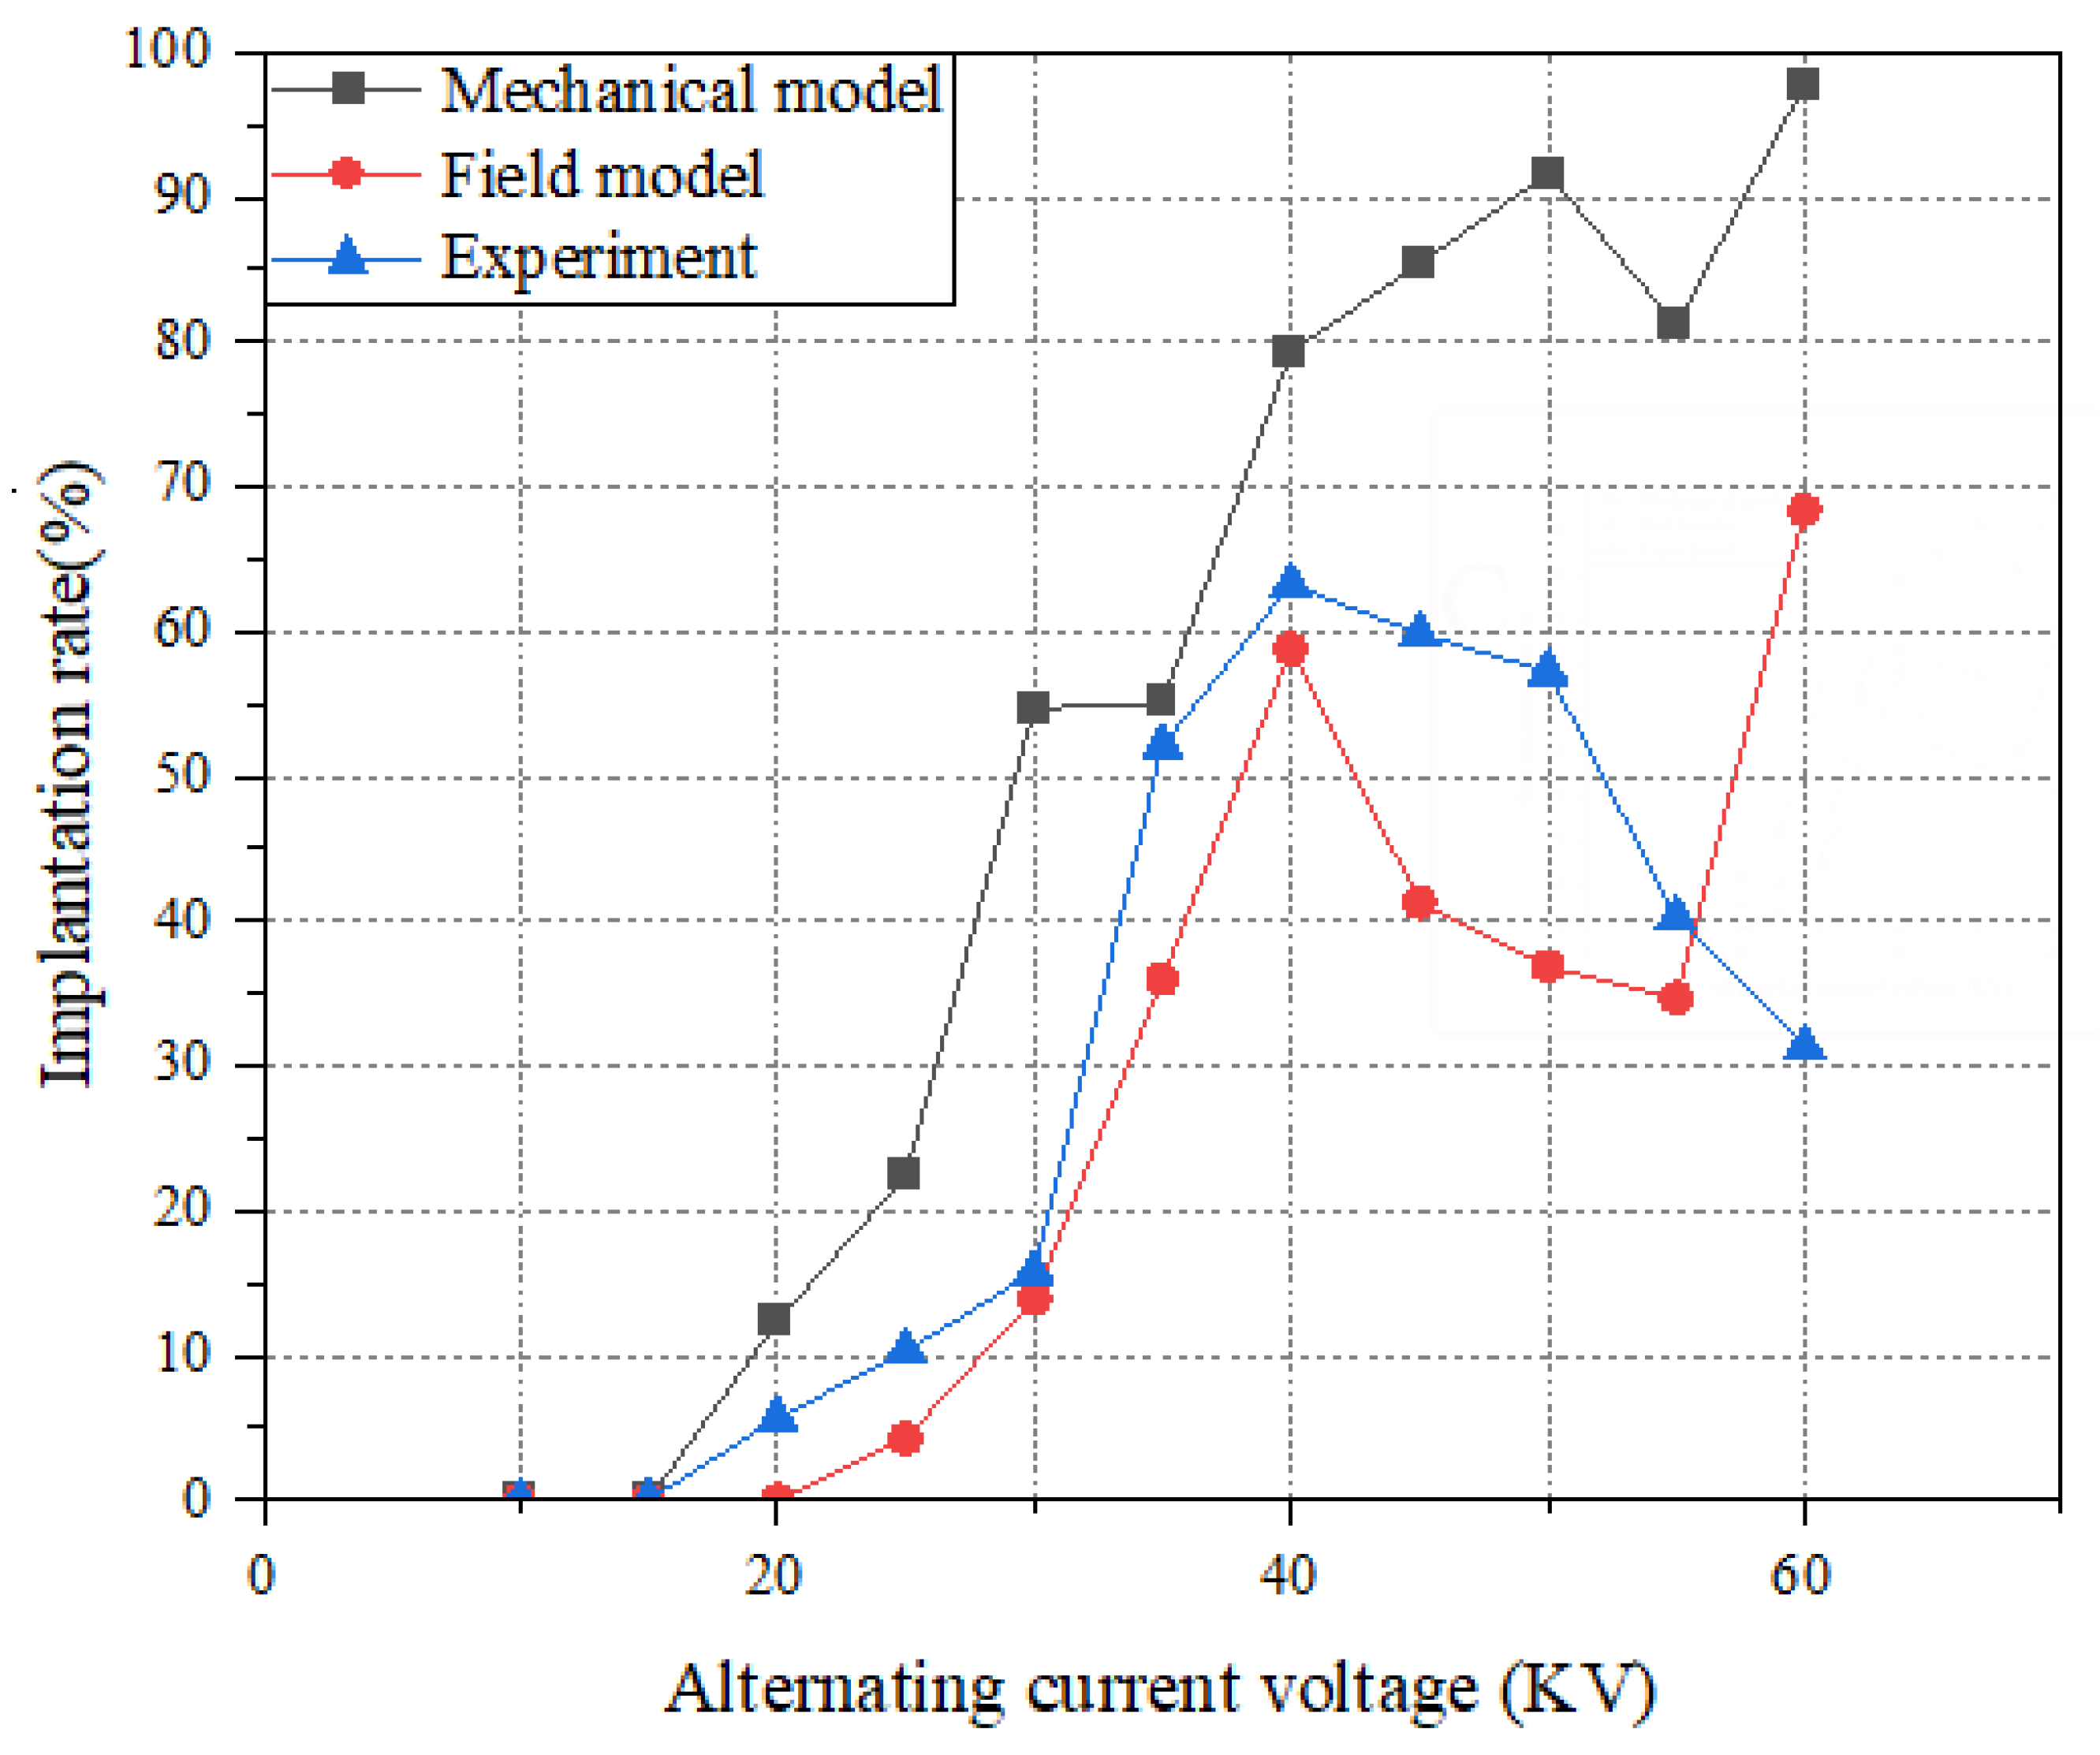
The distance between the pole plates is set to 100 mm, the number of particles entering the electric field is 5000, and the size of the voltage between the two pole plates is changed from 10 kV to 60 kV. The waveform of the voltage is a constant biphasic rectangular wave. The results for different pole plate voltage under the mechanical model and the field model are shown in Table 4. Using relative error to describe the difference between simulation results and the actual experiments. The limit of the acceptable relative error is selected as 30%. The relative error of field model is lower than the mechanical model in most case.
As shown in Figure 14, the field model is more consistent with the experimental results. When the voltage is low and the starting voltage is not reached, the voltage has no effect on the abrasive planting and the particles remain in the same position. When the voltage reaches the starting voltage (i.e., about 20–40 kV), part of the particles moves up, and the abrasive implantation rate increases with the increase of the pole plate voltage. When the voltage is higher than 40 kV, the abrasive implantation rate of the field model and the actual experiment has a certain decrease. The abrasive particles at high voltages may fail to embed in the adhesive layer under the effect of larger negative half-wave if they cannot reach the upper pole plate during the first positive half-wave. For the mechanical model, the implantation rate increases with the voltage, which is higher than the field model.

3.2.2. Influence of Pole Plate Spacing

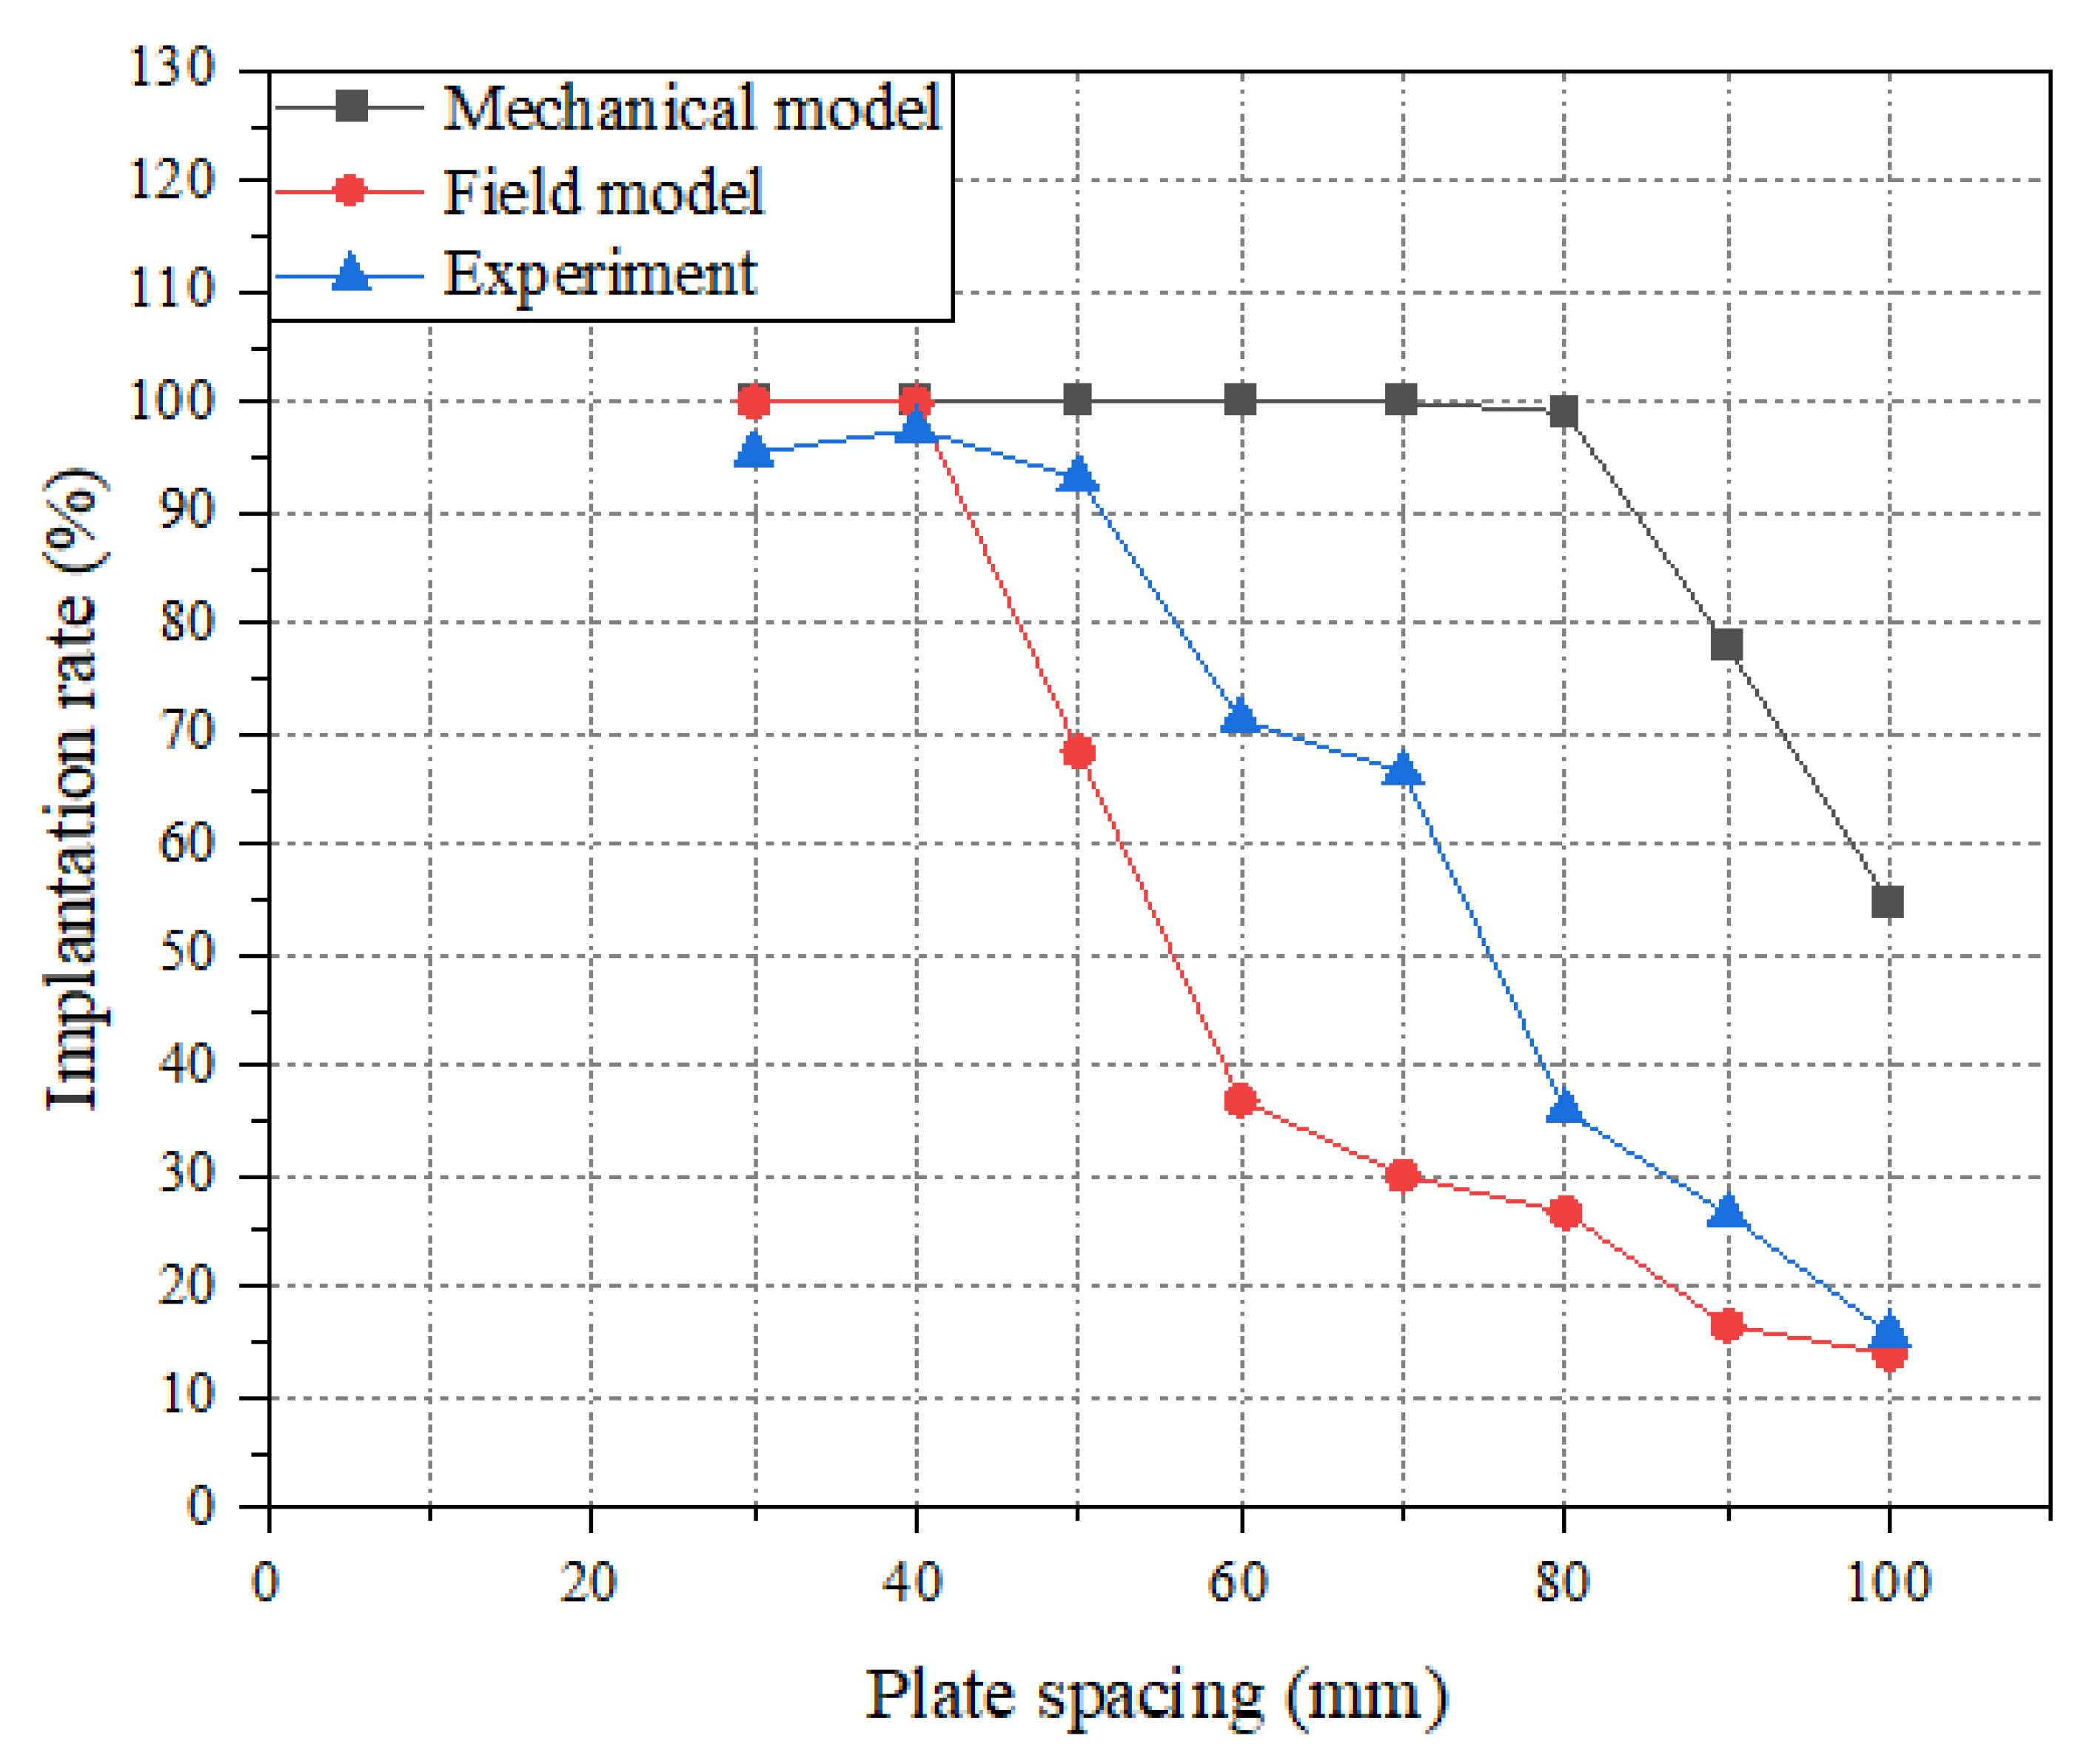
Since the abrasive particles may show a state of motion similar to a simple harmonic motion in the special electric field, that is, the particles move up and down inside the electric field without contacting with the upper and lower pole plates. To prevent this situation, a suitable pole plate spacing is important. When the voltage is too large, the particles will hit into the upper pole plate within the existing pole plate spacing. Therefore, a medium value of voltage is chosen for the analysis on the influence of pole plate spacing. Using the control variable method, the pole plate spacing was changed by controlling the voltage between the plates and the number of particles entering the electric field. The voltage was set to 30 kV and the particle number was set to 5000. The voltage waveform was a biphasic sine wave. The results are shown in Table 5.
As shown in Figure 15, under different plate spacing the results of the field model are also closer to the actual experiments. For the field model, the implantation rate decreases when the plate spacing is larger than 40 mm. For the mechanical model, when the pole plate spacing is small (i.e., the pole plate spacing is 30–70 mm), all of the abrasive particles can be directly embedded into the adhesive layer, and the abrasive implantation rate is up to 100%. When the pole plate spacing continues to increase, the abrasive particles will carry out simple harmonic motion inside the electric field and will not enter the adhesive layer. which leads to the continuous decrease of abrasive implantation rate.
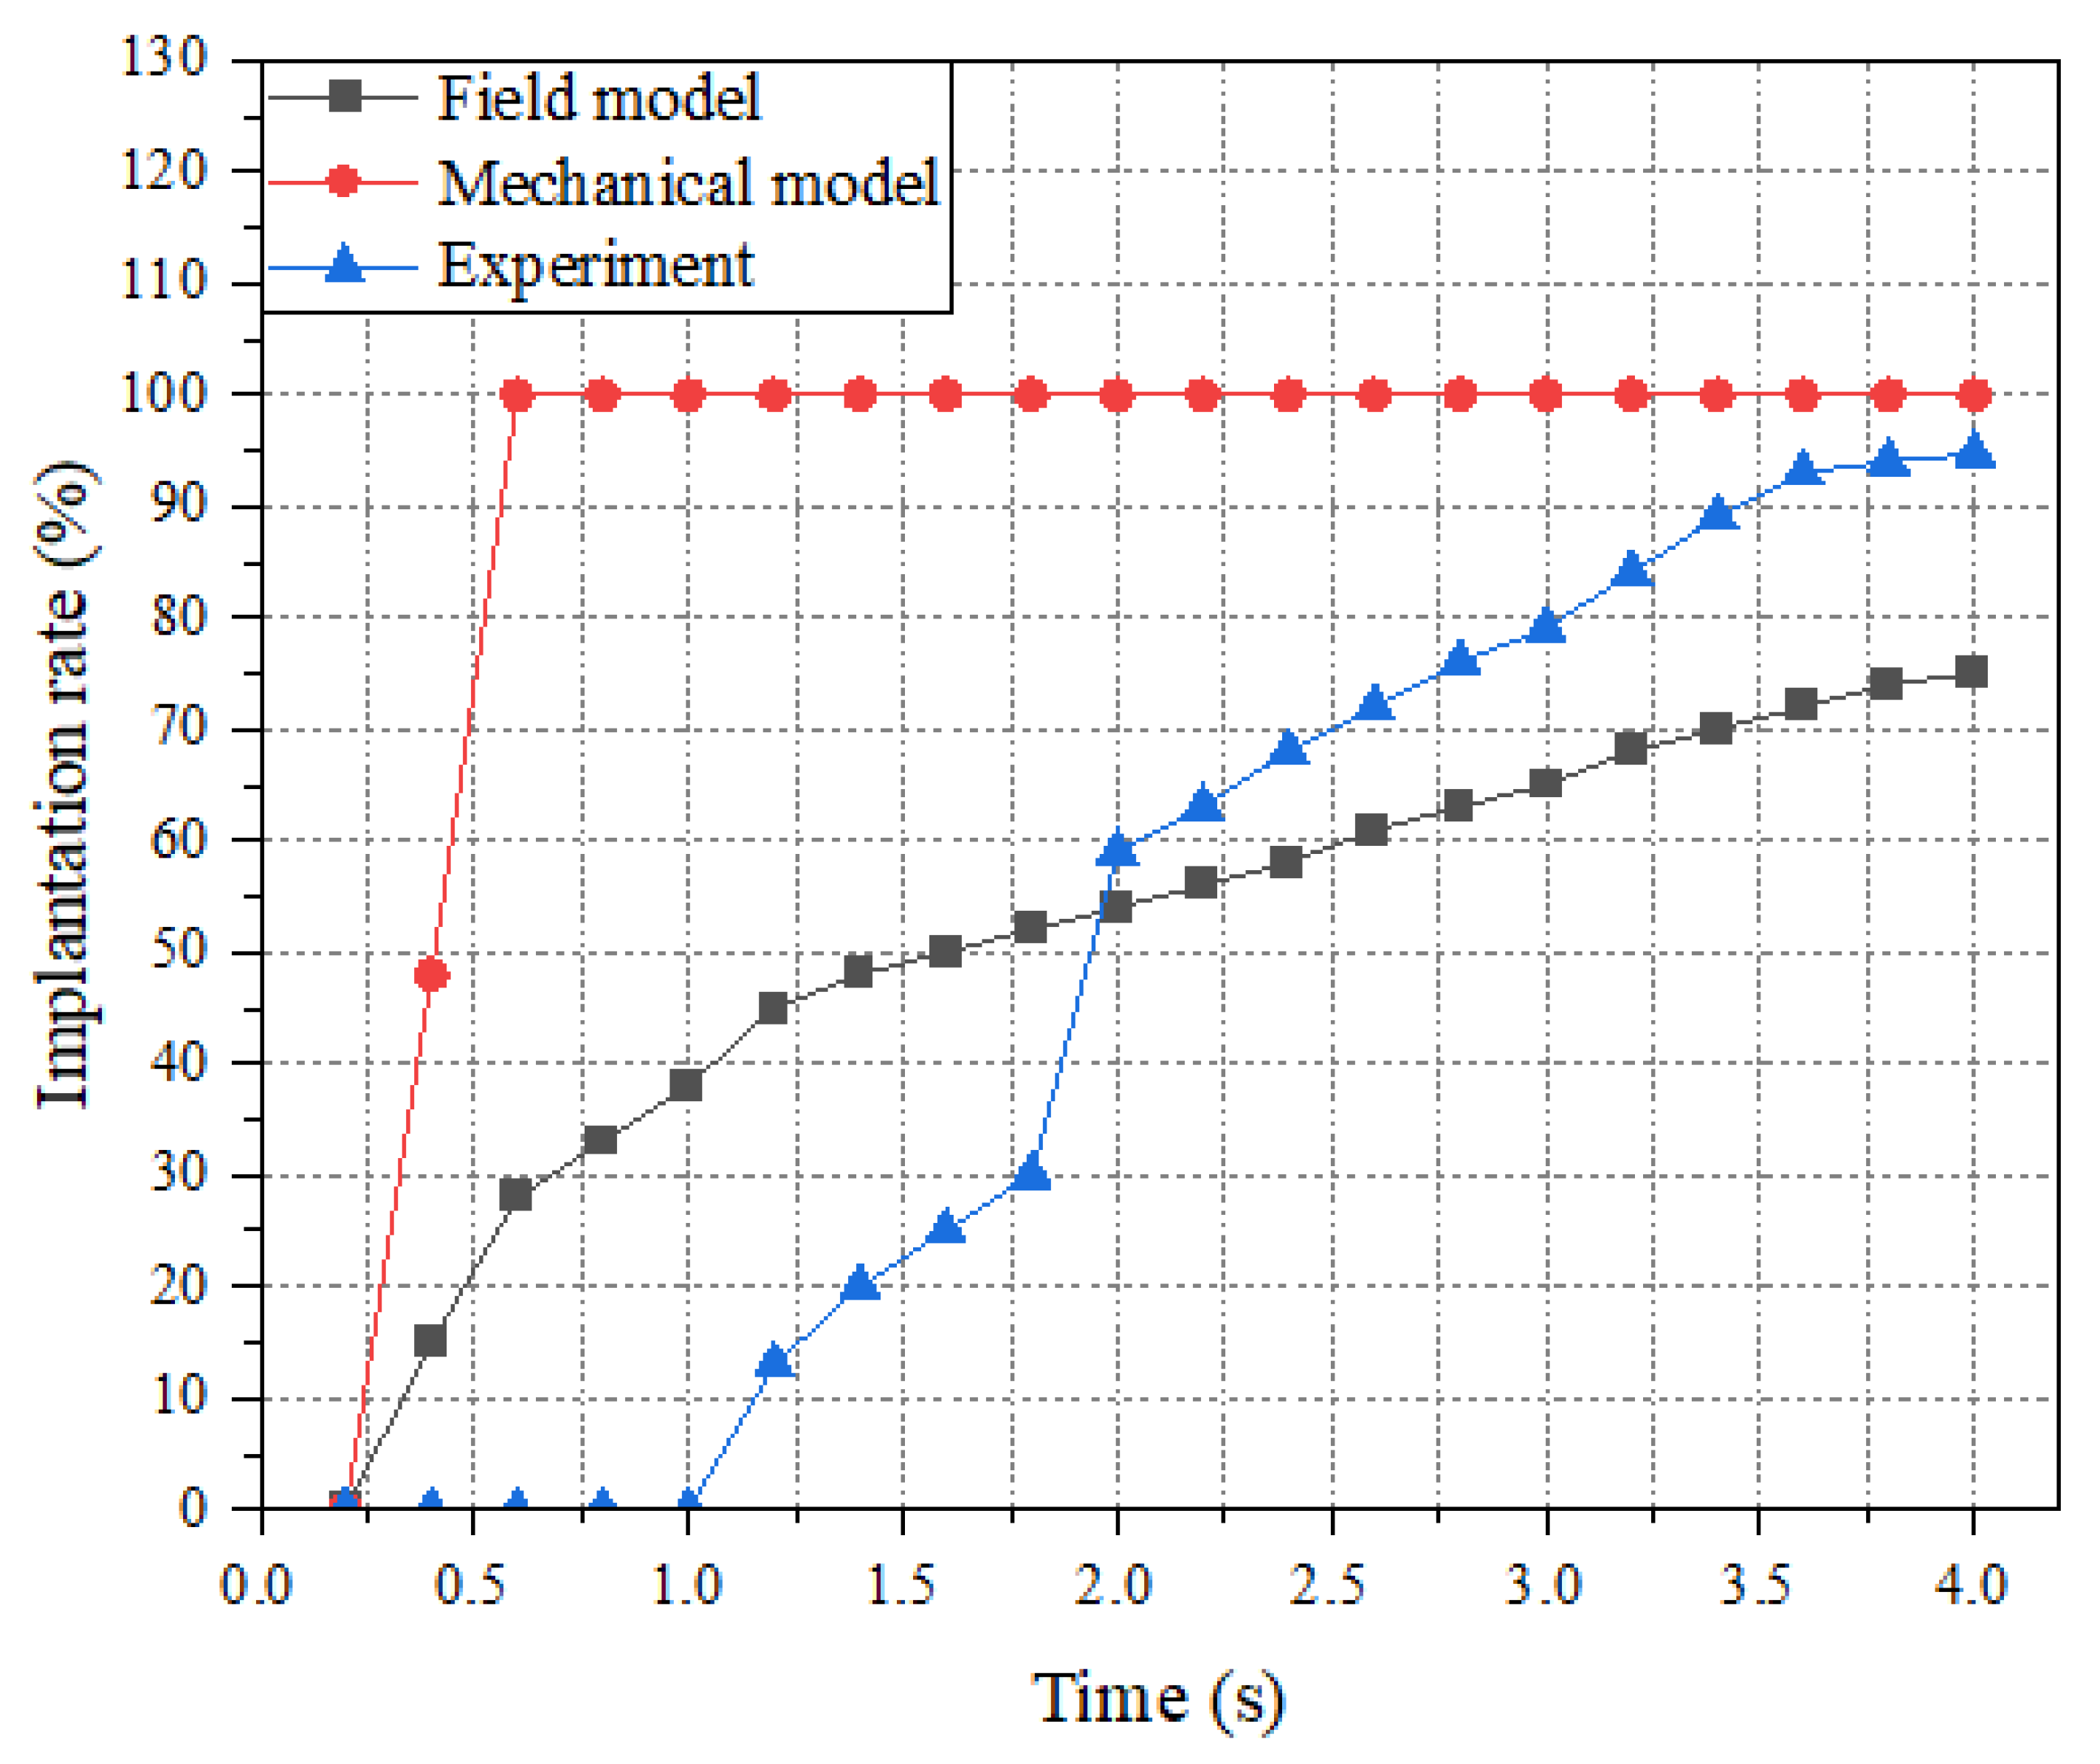
Implantation rate is one of the most effective indicators. The variation of the implantation rate with time in the sand implantation progress is shown in Figure 16. The voltage is 30 kV of 4 Hz and the plate spacing is 50 mm. For the mechanical model, the experimental abrasive implantation rate starts to rise only after the voltage reaches the starting voltage, and then its abrasive implantation rate rises rapidly and reaches 75% in a short time, and then the abrasive implantation rate reaches 100% in the completion stage. The field model starts slowly and there are certain fluctuations in the abrasive planting process with a final abrasive implantation rate of only 75% in the completion stage.
In most cases, the field model has more accurate results and has the same trends as the experimental data. The implantation rate of the field model and the real experiment is lower than the mechanical model. Firstly, the field model takes the ionization effect of the high voltage pole plate on the flow field during the actual experiment into consideration. The charges in the air will form the opposite electric field, which leads to the actual electric field force on the particle is less than the theoretical value. Secondly, due to the perturbation of the flow field, the field model particles are subjected to greater resistance. Thirdly, the rotation and flip of the particles. In a word, compared to the mechanical model, the particles of the field model have longer fly time between the pole plate due to the smaller combined force in the vertical direction. Fewer particles reach the upper pole plate and the implantation rate is lower, which is more consistent with the experimental results.

4. Conclusions

In this paper, the key factors affecting the high voltage electrostatic abrasive planting process are identified, and a feasible multi-physical field coupled abrasive particle motion simulation model is proposed. The constructed mechanical model can clearly describe the physical process of the abrasive implantation. The constructed field model is more consistent with the actual experiments and better for simulations in the industrial condition (i.e., small pole plate spacing and small voltage). The main factors affecting the abrasive planting effect are the voltage and the pole plates spacing. The implantation rate increases gradually with the increase of voltage, and after the voltage reaches a certain value, the abrasive planting effect decreased. The implantation rate decreases with the plate spacing when the spacing is larger than 50 mm. The applicable pole plate spacing is 30–50 mm and the suitable voltage is 20–40 kV. The implantation rate experimentation shows the multi-physical field coupled model consistency with the experiments better than the mechanical model. Based on the proposed simulation model, the abrasive planting parameters under different conditions are optimized, which provides data support for the actual production of enterprises.

Author Contributions

Conceptualization, G.C. and H.Z.; methodology, H.Z.; software, W.W.; validation, H.Z., W.W. and L.G.; formal analysis, H.Z.; investigation, H.Z.; resources, H.Z.; data curation, W.W.; writing—original draft preparation, H.Z.; writing—review and editing, W.W. and L.G.; visualization, H.Z.; supervision, G.C.; project administration, G.C.; funding acquisition, L.G. All authors have read and agreed to the published version of the manuscript.

Funding

This work is supported by Shanghai Municipal Science and Technology Major Project under Grant No. 2021SHZDZX0102.

Institutional Review Board Statement

Not applicable.

Informed Consent Statement

Not applicable.

Data Availability Statement

Not applicable.

Acknowledgments

The authors will thank Wenfeng Shangguan and Tianwei Wu for their involvement in conceptualization of this paper.

Conflicts of Interest

The authors declare no conflict of interest.

References

  1. Ren, L.; Zhang, G.; Wang, Y.; Zhang, Q.; Wang, F.; Huang, Y. A New In-Process Material Removal Rate Monitoring Approach in Abrasive Belt Grinding. Int. J. Adv. Manuf. Technol. 2019, 104, 2715–2726. [Google Scholar] [CrossRef]
  2. Zhang, J.; Yang, Y.; Luo, B.; Liu, H.; Li, L. Research on Wear Characteristics of Abrasive Belt and the Effect on Material Removal during Sanding of Medium Density Fiberboard (MDF). Eur. J. Wood Prod. 2021, 79, 1563–1576. [Google Scholar] [CrossRef]
  3. Leng, Y.F.; Zhang, N. Experiment Research on Abrasive Belt Vibration Grinding Terminal Surface of Work Piece. Adv. Mater. Res. 2011, 154–155, 1240–1243. [Google Scholar] [CrossRef]
  4. Ren, L.; Wang, N.; Pang, W.; Li, Y.; Zhang, G. Modeling and Monitoring the Material Removal Rate of Abrasive Belt Grinding Based on Vision Measurement and the Gene Expression Programming (GEP) Algorithm. Int. J. Adv. Manuf. Technol. 2022, 120, 385–401. [Google Scholar] [CrossRef]
  5. Wang, N.; Zhang, G.; Ren, L.; Pang, W.; Li, Y. Novel Monitoring Method for Belt Wear State Based on Machine Vision and Image Processing under Grinding Parameter Variation. Int. J. Adv. Manuf. Technol. 2022, 1–14. [Google Scholar] [CrossRef]
  6. Chen, F.; Chen, H.; Zhang, L.; Yin, S.; Huang, S.; Zhang, G.; Tang, Q. Controllable Distribution of Ultrafine Diamond Particles by Electrostatic Spray Deposition. Powder Technol. 2019, 345, 267–273. [Google Scholar] [CrossRef]
  7. Zhao, Y.; Yao, J. Electrostatic Characterization of Electrohydrodynamic Atomization Process for Particle Fabrication. Powder Technol. 2017, 314, 589–598. [Google Scholar] [CrossRef]
  8. Ohashi, K.; Kawasuji, Y.; Shinji, Y.; Samejima, Y.; Ogawa, S.; Tsukamoto, S. Fundamental Study on Setting of Diamond Abrasive Grains Using Electrostatic Force for Single-Layered Metal Bond Wheel. Adv. Mater. Res. 2012, 565, 40–45. [Google Scholar] [CrossRef]
  9. Urs, A.; Dragos, C.; Samulia, A.; Iuga, A.; Dascalescu, L. Electrostatic Sizing of Abrasive Particles Using a Free-Fall Corona Separator. Part. Sci. Technol. 2004, 22, 85–92. [Google Scholar] [CrossRef]
  10. Jeffery, G.B. The Motion of Ellipsoidal Particles Immersed in a Viscous Fluid. Proc. R. Soc. Lond. Ser. A 1922, 102, 161–179. [Google Scholar] [CrossRef] [Green Version]
  11. Long, Z.; Yao, Q. Evaluation of Various Particle Charging Models for Simulating Particle Dynamics in Electrostatic Precipitators. J. Aerosol. Sci. 2010, 41, 702–718. [Google Scholar] [CrossRef]
  12. Long, Z.; Yao, Q.; Song, Q.; Li, S. A Second-Order Accurate Finite Volume Method for the Computation of Electrical Conditions inside a Wire-Plate Electrostatic Precipitator on Unstructured Meshes. J. Electrost. 2009, 67, 597–604. [Google Scholar] [CrossRef]
  13. Lei, H.; Wang, L.Z.; Wu, Z.N. EHD Turbulent Flow and Monte-Carlo Simulation for Particle Charging and Tracing in a Wire-Plate Electrostatic Precipitator. J. Electrost. 2008, 66, 130–141. [Google Scholar] [CrossRef]
  14. Zhao, L.; Adamiak, K. Numerical Simulation of the Electrohydrodynamic Flow in a Single Wire-Plate Electrostatic Precipitator. IEEE Trans. Ind. Appl. 2008, 44, 683–691. [Google Scholar] [CrossRef]
  15. Schmid, H.J. On the Modelling of the Particle Dynamics in Electro-Hydrodynamic Flow Fields: II. Influences of Inhomogeneities on Electrostatic Precipitation. Powder Technol. 2003, 135–136, 136–149. [Google Scholar] [CrossRef]
  16. Yang, Z.; Zheng, C.; Liu, S.; Guo, Y.; Liang, C.; Zhang, X.; Zhang, Y.; Xiang, G. Insights into the Role of Particle Space Charge Effects in Particle Precipitation Processes in Electrostatic Precipitator. Powder Technol. 2018, 339, 606–614. [Google Scholar] [CrossRef]
  17. Wissdorf, W.; Pohler, L.; Klee, S.; Müller, D.; Benter, T. Simulation of Ion Motion at Atmospheric Pressure: Particle Tracing Versus Electrokinetic Flow. J. Am. Soc. Mass Spectrom. 2012, 23, 397–406. [Google Scholar] [CrossRef] [Green Version]
  18. Cao, Q.; Li, Z.; Wang, Z.; Han, X. Rotational Motion and Lateral Migration of an Elliptical Magnetic Particle in a Microchannel under a Uniform Magnetic Field. Microfluid. Nanofluid. 2018, 22, 3. [Google Scholar] [CrossRef]
  19. Gu, Z.; Wei, W. Numerical Modeling Methods for Particle Electrification. In Electrification of Particulates in Industrial and Natural Multiphase Flows; Gu, Z., Wei, W., Eds.; Springer: Singapore, 2017; pp. 117–141. ISBN 978-981-10-3026-0. [Google Scholar]
  20. White, H.J. Particle Charging in Electrostatic Precipitation. Trans. Am. Inst. Electr. Eng. 1951, 70, 1186–1191. [Google Scholar] [CrossRef]
  21. Bose, K.; Wood, R.J.K. Optimum Tests Conditions for Attaining Uniform Rolling Abrasion in Ball Cratering Tests on Hard Coatings. Wear 2005, 258, 322–332. [Google Scholar] [CrossRef]
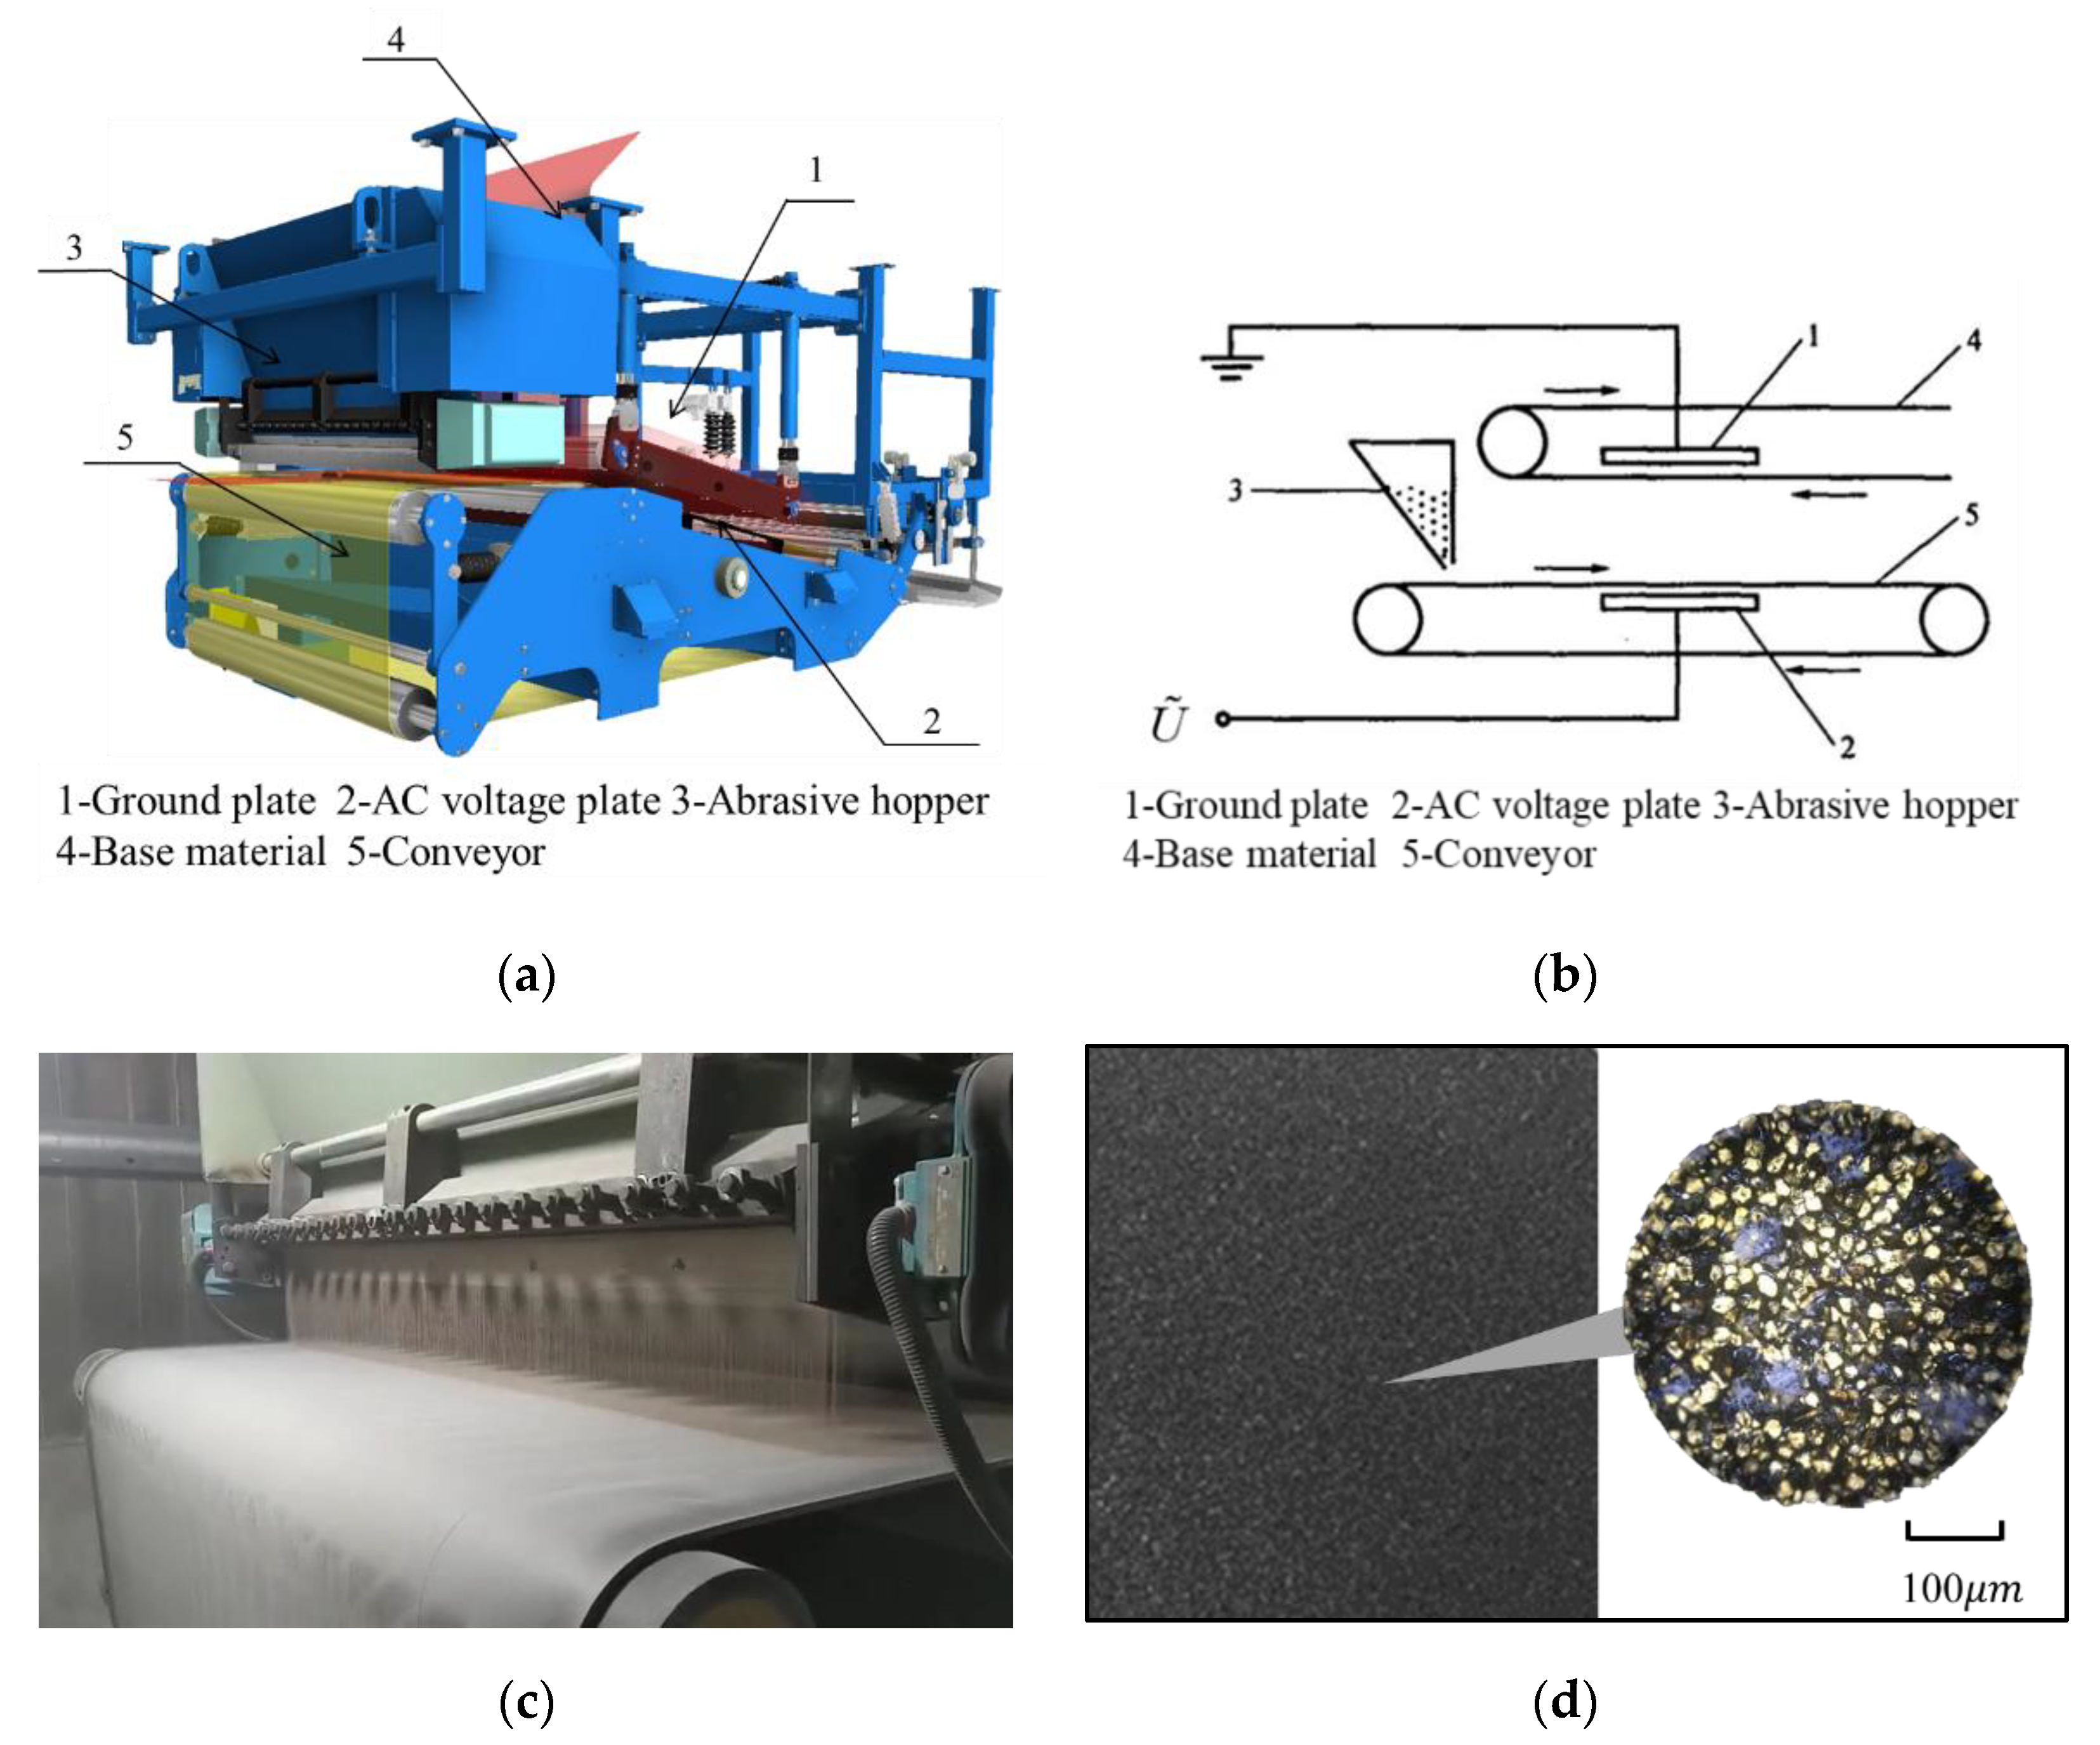
Figure 1. Industrial electrostatic abrasive planting: (a) abrasive planting equipment; (b) abrasive planting schematic diagram; (c) manufacturing site; (d) abrasive paper and its microstructure.
Machines 10 00406 g001
Figure 2. Electrostatic abrasive implantation process.
Machines 10 00406 g002
Figure 3. Diagram of viscous force.
Machines 10 00406 g003
Figure 4. 3D model of the mechanical model.
Machines 10 00406 g004
Figure 5. The meshing of the mechanical model.
Machines 10 00406 g005
Figure 6. The input voltage waveform of simulation model.
Machines 10 00406 g006
Figure 7. Particle motion of the mechanical model.
Machines 10 00406 g007
Figure 8. Particle motion of the field model.
Machines 10 00406 g008
Figure 9. Particles embedded in the adhesive layer in the mechanical model (z = 100 mm).
Machines 10 00406 g009
Figure 10. Abrasive particle paths in the mechanical model.
Machines 10 00406 g010
Figure 11. Particles embedded in the adhesive layer in the field model (z = 100 mm).
Machines 10 00406 g011
Figure 12. Flowchart of the numerical procedure: (a) mechanical model; (b) field model.
Machines 10 00406 g012
Figure 13. Electrostatic abrasive planting measuring equipment. (a) Experiment device; (b) structure diagram.
Machines 10 00406 g013
Figure 14. Comparison of the number of particles at different voltages.
Machines 10 00406 g014
Figure 15. Comparison of the number of particles at different plate spacing.
Machines 10 00406 g015
Figure 16. Abrasive implantation rate at different moments during the experiment and simulation. (30 kV, 4 Hz, 50 mm).
Machines 10 00406 g016
Table 1. Force equations of abrasive particles.
FieldForce Equations
Electric field and fluid field F z = E q m g 6 μ 2 R π V z
F x = 6 μ 2 R π V x
Colloid layer F z = 2 π R μ 1 u ( sin θ + θ ) m g + E q
Table 2. Field model parameters.
ParametersValuesSymbols
Particle size0.035–0.045 [mm]dp
The thickness of the adhesive layer0.25 [mm]d
Viscosity coefficient4 [GPa·s]μ1
Particle density (corundum)3216 [kg/m3] ρ 1
Polar plate spacing30–100 [mm]H
Alternating current voltage0–60 [kV] U ˜
Electric field strengthU/HE
Air density1.293 [kg/m3] ρ 2
Air viscosity17.9 [μPa·s]μ2
Particle relative dielectric constant6.5εr
Air dielectric constant8.854 × 10−12 F/mε0
Table 3. Material parameters of the adhesive layer.
MaterialsViscosity (MPa·s)Density (kg/m3)
Epoxy resin (20 kg) + polyamide (18 kg) + xylene (19 kg)1502.0 × 103
Epoxy resin (20 kg) + polyamide (18 kg) + xylene (18 kg)2002.3 × 103
Table 4. Results for different pole plate voltage.
No.Voltage/kVImplantation Rate/%Relative Error (Mechanical Model)/%Relative Error (Field Model)/%
Mechanical ModelField
Model
Experiment
11000000
21500000
32012.305.62118.86100
42522.384.2610.28117.7058.56
53054.6813.9215.75247.1711.62
63555.13652.115.7430.92
74079.2858.7663.2525.347.10
84585.4241.2859.8242.8030.99
95091.6236.8857.2160.1535.54
105581.1634.6640.22101.7913.82
116097.7868.3831.32212.20118.33
Table 5. Results for different pole plate spacing.
No.Plate Distance/mmImplantation Rate/%Relative Error (Mechanical Model)/%Relative Error (Field Model)/%
Mechanical ModelField
Model
Experiment
13010010095.424.804.80
24010010097.572.492.49
35010068.3893.117.4026.56
46010036.8871.2540.3548.24
5701003066.5250.3354.90
68099.0626.7135.85176.3225.50
79077.8616.4826.51193.7037.83
810054.6813.9215.75247.1711.62
Publisher’s Note: MDPI stays neutral with regard to jurisdictional claims in published maps and institutional affiliations.