1. Introduction
The actual tasks affect human performance in the presence of various factors, such as time, environment, people, and the nature of the process. According to [
1], we can characterize human performance by efficacy (effectiveness) and efficiency. The former can be understood as a person’s success or failure at performing a given task; the latter considers task completion time in light of the corresponding successes or failures. Human error is a dominant factor that affects the likelihood of task failure that could disrupt scheduled operations or damage property and equipment, causing accidents. By actively looking for potential sources of human errors, they can be identified, controlled, and ultimately minimized [
2,
3]. The meaning of the term ‘human error‘ varies, depending on the viewpoint from which we analyze it. Definitions usually fall into three categories: industrial approach (emphasizing the manifestations of errors), psycho-cognitive approach (based on their modes of production), and psycho-dynamic approach to work (combination of both) [
4]. Different approaches may result in different classifications of the term, depending on the objectives of the analysis [
5].
In addition to human errors, another frequently used term is ‘human reliability‘. Although both terms may mean the same thing to many people, their definitions convey their primary difference [
6,
7]. Since humans are unreliable and make errors, we use human factors as the body of knowledge concerned with human abilities and shortcomings [
8]. Today, we widely accept the concept of human factors as an essential part of industries in practically every domain [
9], including railway transport. Koonce and Debons [
10] discuss the historical perspectives of human factors development. The goal of human factor definitions is to make the human interaction with systems such that it enhances performance, increases safety, and increases user satisfaction [
11]. The operator is often a weak point of many systems, limiting the overall level of safety and performance. Thus, human error constitutes a major causal factor for the emergence of accidents in several safety sectors: energy production (nuclear and conventional), transportation systems (aviation, railway, automotive, maritime), medical industry, economic systems, chemical and petrochemical environments, manufacturing, tunnels and other critical infrastructure, and others [
12,
13,
14,
15,
16,
17].
Human operators involved in the transport sector vary depending on the application area. Railway transportation performance cannot be guaranteed just by technically perfect design concepts; other aspects (specific procedures, working regulations, working conditions, job descriptions, delineation of tasks and responsibilities) are also important [
18]. Railway operations’ effectiveness and safety depend on rail traffic rules, equipment reliability, general and safety management, and human factors [
19]. The management of railway system safety and effectiveness cannot ignore the humans working at all levels of the system [
20,
21] since railway accidents result from human error, mechanical failure, or a combination of both. Therefore, the people who operate railway systems must be selected and trained to operate them safely [
22]. Although considering human factors does not have a long tradition in continental Europe [
23], it is necessary to study the human factor reliability in the railway field where the actors are mainly operating personnel (drivers, operators at centralized control posts) and maintenance personnel. The thesis [
24] proposes a taxonomy of railway performance shaping factors. It also identifies the factors that affect railway operators’ performance and assess human performance. Human factors seen as a discipline are concerned with understanding interactions between people and other elements of complex systems [
25]. Different human factor methods become applicable and helpful at different stages of system design [
26]. One of the classic test methods is human performance testing [
27]. Testing and evaluation is a set of methodologies to characterize, measure, assess, and evaluate the technical merit, operational effectiveness, suitability of any human–system interface [
28].
Evaluating existing operational systems requires that specific data regarding task performance in the analyzed system are collected, represented, and analyzed [
26]. Data collection, therefore, represents the cornerstone of any human factor analysis effort. At first sight, all we need is information on human behavior and errors. Unfortunately, this is far more difficult when considered more carefully. Data collection aims to provide all necessary information for undertaking the analysis. One of the leading research methods for human factors research is observation—to get representative human behavior samples during tasks performed over different days under various circumstances [
11]. When defining a task, we can adopt a definition from [
25]: A “task” is a goal-directed behavior performed by one or more people, which involves a coordinated sequence of intentions, perceptions, interpretations/judgments, decisions, and actions directed toward achieving a specific objective within a limited period. Some of the tasks may be critical. The nature of criticality depends on the nature of performed activities, the individual, the operation, and the situation. Accidents in complex systems occur through the accumulation of multiple factors and failures. Reason [
29] proposed the model of “Swiss cheese” to explain their occurrence as a series of factors that line up in just the wrong way, allowing seemingly small details to add up to a major incident. The most critical requirement for the proper and efficient functioning of the railway traffic control rooms is solving the problem of functional competence between the operator and the elements of the control rooms. Grozdanovic in [
30] investigated specific operator-control desk interaction at the Railway Traffic Control Room in Nis, Serbia, using methods of anthropometric measurement of operators; determining the maximum strength of the operator’s arm movements; workload analysis of the operator’s arms, head and trunk movements; and error analysis of operators’ movements in response to visual cues.
This paper focuses on analyzing human operator behavior in the railway traffic control process. We elaborated on three study cases, with a certain level of automation being a vital aspect in selecting work systems. Automation significantly changes the role of people in complex systems and removes the potential for human errors. Designers develop machines to replace or aid human performance for various reasons. According to [
11], we can roughly place these reasons into four categories: processes are either dangerous or impossible for humans to perform the equivalent tasks; processes are difficult or unpleasant (humans carry out the functions poorly); automated functions may not replace but may aid humans by extending their capabilities; or processes are automated because it is technically possible or inexpensive. In our case, almost all of the given reasons play a role. According to ISO 6385 [
31], the term ‘work system‘ involves a combination of people and equipment within a given space and environment, and the interactions between these components within a work organization. Our effort was to cover three technologically different station-signaling systems:
A manually operated electro-mechanical system, supplemented by a few automated functions (such as moving points);
A semi-automated relay-based system enabling central control of the railway station and adjacent lines (without possibility to automate the process of setting up main routes);
A modern computer-based system with a lot of fully automated dispatching functions.
Thus, we analyzed the operator’s behavior in several roles, such as a manual controller (signaler) to a supervisory controller (dispatcher). More details on the meanings of these concepts (roles) are available in [
25]. A typical human operator acting as a supervisory controller is a train dispatcher that plays a leading role in coordination and control systems [
32]. The use of new technologies guarantees new capabilities and functionalities of the control system, but on the other side, it goes hand in hand with rising complexity [
18]. Centralized control systems in high-speed railways are more automatic and complex than in general speed railways; therefore, human error is the main factor in recent high-speed railway accidents. However, the conventional human error rate technique may have some weaknesses, which are overcome by introducing hybrid methods for human error probability evaluation in high-speed railway dispatching tasks (sometimes also mentioned as 3rd generation methods). The rail environment considered here does not concern high-speed railway tasks, the topic of high-speed railways tasks is covered by [
33]. Rail signaling requires an accurate understanding of the system’s state that the operator controls to make correct, timely decisions and take effective action [
34]. Operators must do more than simply perceive the state of their environment. They must understand the integrated meaning of what they are perceiving in light of their goals. In dynamic environments, many decisions are required across a fairly narrow space of time, and tasks are dependent on an ongoing, up-to-date analysis of the environment. Because the state of the environment is constantly changing, often in complex ways, a major portion of the operator’s job becomes that of obtaining and maintaining good situation awareness. Situation awareness is presented as a predominant concern in the system operation, based on a descriptive view of decision making. The decision makers will act first to classify and understand a situation, immediately proceeding to action selection. Endsley [
35] presents the model used to generate design implications for enhancing the operator’s situation awareness.
There are several qualitative and quantitative measures of human performance, using a large variety of strategies and instruments [
30,
36,
37,
38]. The advantages and disadvantages of some of the main techniques for human error analysis are available in [
39]. To assess the reliability of the operator, we used the human reliability assessment (HRA), which is a crucial element of the probabilistic risk assessment (PRA). HRA is a suitable method of analysis to assess the consequences of various human activities on potential risk. The determination of the probability of incorrect execution of a task by the operator (human error probability—
HEP) is a part of the human–machine system’s probability safety analysis (PSA). We usually classify the HRA methods to the methods of the 1st generation (e.g., THERP—technique for human-error rate prediction [
17], HEART—human error rate technique [
40], and SLIM—success likelihood index method [
41]) and the 2nd generation (e.g., CREAM—cognitive reliability and error analysis method [
42], and ATHEANA—a technique for human error analysis [
43]). The method presented in this paper can be extended in the future using the interaction between the equipment and the human operator. Chen et al. [
44] facilitated a hidden Markov model on top of a human cognitive model to capture the sequential faults of a production line worker who suffers from work stress. The Markov chain has the discrepancy of time and state. This characteristic is consistent with the changing law of human factors and can be used to predict the risk of human factors. A human factor evaluation model based on the set pair analysis method and the Markov chain was proposed and applied by [
45].
2. Materials and Methods
Based on the complex railway transportation process and specificities of operating railway interlocking and signaling systems, we decided to use the THERP as the 1st generation HRA method instead of a universal system-wide analysis belonging to the methods of the 2nd HRA category. THERP is a full methodology for assessing human reliability that deals with task analyses (e.g., documentation reviews and walk/talk-through), error identification and representation, as well as the quantification of
HEPs. It has its well-known pros and cons [
17,
38,
46].
There were several reasons why we chose THERP instead of the 2nd HRA generation method:
Our ability to monitor the operator’s activities was, to a certain extent, limited; we depended on the operators’ willingness to be observed and communicate. Therefore, we chose a simplified view (typical for the 1st generation method), identifying a man as a mechanical or electrical component with natural deficiencies and the possibility to fail to perform tasks. It is recommended for applications with such predominant situations, where only one solution is correct (the only correct response to an unexpected situation). If the operator does not respond according to the prescribed procedure, one may assess such behavior as faulty, concluding the operator’s responsibility for the system failure. This approach can be essential in sensitive areas (for safety or design changes);
Additional limitations stemmed from the time the observer was officially allowed to spend at the operator’s site. Due to time-limited access to the individual workplaces, we rejected the usage of the 2nd generation method since we could not analyze the causes of errors and study the interaction of the factors increasing the probability of error, as well as the interdependencies of the so-called performance shaping factors (PSFs);
THERP is a generic tool usable in many sectors (not only in the nuclear industry for which it was designed) and remains the most extensively documented and the most widely used HRA technique from which all subsequent HRA methods are derived;
THERP provides a logical, well-documented record of the factors and errors needed in the HRA. One can easily review the results and examine the used assumptions.
The price paid for using the 1st generation HRA method was a relatively unstructured approach, unknown interaction between certain PSFs, and the fact that the method is highly judgmental based on the assessor’s experience.
From the analyst’s point of view, we modified and implemented a series of the following successive steps, according to [
17]):
- 1.
Getting acquainted with the working environment:
Visit the operator’s workplaces to be assessed;
Obtain information about work procedures, performed tasks, and the influence of the operator on the signaling system;
- 2.
Qualitative assessment:
- 3.
Quantitative assessment:
Assign nominal HEP values to individual operator’s actions;
Estimate relative effects of influencing factors;
Assess the dependencies between individual actions;
Estimate the probabilities of success and failure for each action;
Assess effects of process recovery factors;
- 4.
Interpretation of results:
2.1. Description of Operator Workplaces
Control systems in railways, as in other fields, are of different types and use different technologies to determine their level of automation. Parasuraman et al. [
47] provided a framework and an objective basis for deciding which system functions should be automated and to what extent. Three workplaces chosen for our analysis can be characterized as follows:
Workplace A (Žilina marshalling yard)—the operator works at the railway station, situated on the electrified double-track line, which also serves as a switch station (marshaling yard) at which trains are split-up and newly formed. The operator operates an old manual electro-mechanical signaling system installed in the station inspector’s office. The system is supplemented by a simplified panel of relay connections to the hump signal-box. There is also the section blocking equipment in the station inspector’s office. It is operated independently for directions from/to the Dolný Hričov station. It is an automatic block system without separate line conductors. The operator cooperates with signalers working at three external station boxes. Analyzed working procedures cover a set of activities related to the passage of a transit train through the station, shunting works (in fact realized by signalers), and emergency actions taken in case of failure of the system or its part.
Workplace B (Centralized control point—Žilina station)—the operator (disposition dispatcher) works at the central Žilina railway station, located on the same electrified double-track line. It is an intermediate station through which transit trains pass, terminating trains enter, and departure trains are assembled. The operator at this workplace operates a semi-automatic relay-based signaling system controlled from the control panel at the centralized control point. Analyzed working procedures cover a set of activities related to the following:
Setting up (locking) and releasing (unlocking) main and shunting routes;
Asking for or transmitting single-line permission;
Transmitting permission for locomotives track connected with workplace A;
Transmitting or canceling permission for the operation of the dependent signal box;
Closing and opening railway level crossings (if traffic situation requires that);
Operating emergency buttons with full responsibility of the operator.
The control panel also allows control of individual point movements using manual switches. The operator uses various means of communication (radio station, telephone connector) and records the current traffic situation using an electronic traffic log (in case of its failure, the operator records all activities manually). Since the relay-based system only shows vacancy or occupancy of track sections and cannot display numbers of trains currently located in occupied track sections, the operator must remember or write down which train occupied which track section. The train schedule work primarily determines the operator’s work.
Workplace C (Traffic Control Center Púchov)—unlike both previous workplaces, it is a fully-automated traffic control center that operates several stations and adjacent line sections. It includes the control of five railway stations (Trenčianske Bohuslavice, Trenčín-Zlatovce, Trenčín, Trenčianska Teplá, passing point Nivy), number of switches and the adjacent line sections. The workplace is equipped with a computer-based signaling system. Working procedures are significantly different because this system works mainly in the automatic mode (setting up and releasing transition train routes, and terminating or starting trains). Unlike workplaces A and B, the operator has an overview of the occupancy of individual tracks and identification numbers of trains located in the occupied sections, which significantly facilitates orientation and reduces the amount of information that the operator must remember or write down. All working tasks mentioned above were itemized into individual actions and described in detail in [
48].
A brief overview of the rail infrastructure operated by the Rail Infrastructure Manager (ŽSR) is available in the Annual reports [
49]. Detailed data show the age structure of employees, their total numbers, and education level, and suggest the usage of multi-generation installations in the rail network. Even if the last published data on technological generations of station-signaling systems come from the Annual report 2013, the current situation has not changed much and is similar to the following:
Mechanic interlocking—148;
Electro-mechanical interlocking—68;
Relay-based interlocking—151;
Other interlocking—84;
Electronic interlocking—24;
Remote-controlled interlocking—323 km of lines.
Replacement of electro-mechanical (or even mechanical) and relay-based signaling technologies by computer-based is a slow process, mainly depending on the availability of financial resources. The advantages and disadvantages of all three technological generations result from their brief characteristics.
The electro-mechanical station-signaling systems check whether activities performed by the operator and other operational staff are safe and cannot endanger traffic safety. Information links between system parts are secured primarily by technological redundancy (oversizing) and by the forced sequence of individual actions. The station-signaling system works autonomously, without the possibility of remote control, so the role of the human operator is irreplaceable. Working conditions may require an excellent physical disposition.
The relay-based station-signaling systems replace the operator in information links between the system parts or between the systems. Excluding the human factor significantly increases the safety and the quality of provided services. Information links are secured primarily by using elements with asymmetric failure (inherently fail-safe) and their high reliability, functional check through interdependencies, elements arrangement, and high-quality technology. The station-signaling system consists of a set of automatic devices and links between them, in which the human factor participates. Provided services already allow automating the control of trains and shunting parts movement.
Computer-based signaling systems can be characterized similarly to the previous technology; however, they have dispatch control implemented. Elements with high operational reliability create the information links between the control center and the controlled objects. Information links between the system parts or systems are secured primarily by redundancy, technological complexity, and high reliability (reactive and composite fail-safe).
Table 1 shows a simplified comparison of selected characteristics of all three technologies.
2.2. Data Collection and Processing
To obtain a realistic picture of the work of operators and the influencing factors that affect their performance, we conducted practical research consisting of observing the real work of operators at individual workplaces. To carry out the monitoring process, we chose three time periods of the day corresponding to work shifts (6:00–12:00, 12:00–17:40 and 18:00–24:00), during which there is the highest intensity of traffic and operators work under higher load. The typical duration of the working hours is 12 h, of which 6 h are spent at the workplace. The second period contains a particular time (17:40) when the gradual change of work shifts and the cooperation of outgoing and incoming operators occur. It follows that the operator works independently only until 17:40. These data are the same for all monitored workplaces. While monitoring the operator’s work, we focused on capturing as many as possible numbers and types of performed tasks. In several short periods, in which we could not record operational data due to various circumstances, missing data were supplemented by the Electronic Traffic Diary (ETD) or Traffic Dispatching System (TDS). Thus, we determined the type and frequency of actions that the operator had to perform. Data on the frequency of operations corresponded to the smooth operation (with minimal disruptions to the train schedule).
Table 2 shows sample data recorded at workplace A. Our observation at this workplace lasted 520 min. Symbols TA up to TH represent individual tasks performed by the operator, having the following meanings: TA—communication with co-workers via communications means; TB—work with ETD; TC—setting up a route; TD—releasing a route; TE—transmitting permission for the operation of the dependent interlocking; TF—transmitting single-line permission; TG—transmitting permission for the use of the locomotive track between workplaces A and B, and TH—checking the rear of the train. Then we used observed data to obtain the frequency of individual operations, operator’s commitment and other needed findings (see sections Results and Discussion).
Table 3 shows a similar sample of data recorded at workplace B. The total monitoring time was 810 min. The number and meanings of observed tasks have slightly changed: TA—communication with co-workers via communications means; TB—work with ETD; TC—setting up a shunting route; TD—setting up the main route; TE—transmitting permission for the operation of the dependent interlocking; TF—releasing a route; TG—moving a point individually; TH—transmitting the single-line permission; TI—opening/closing a level crossing installation inside the railway station area; and TJ—transmitting permission for the use of the locomotive track between workplaces A and B.
Finally,
Table 4 shows sample data collected at workplace C. The observation lasted a total of 1110 min. Since the number of observed action types was higher, in
Table 4 we intentionally omitted the columns representing activities not observed during the sample period. The list of them is as follows: TA—communication with co-workers via communications means; TB—work with information systems (in addition to ETD, the operator also used TDS and ADS (arrivals/departures to/from a station)); TC—moving a point individually; TD—changing an automatic setting route sentence; TE—inserting/changing/removing a train number; TF—checking the automatic setting up main routes; TG—setting up the main route; H—releasing the main route; TI—setting up a shunting route; TJ—transmitting permission to operate dependent interlocking; TK—performing an emergency operation; TL—inserting/editing/confirming/removing a warning text; TM—transmitting a single-line permission; TN—confirming/removing a call of the operator; TO—confirming/removing an operational indication; and TP—confirming/removing a fault message.
Table 2,
Table 3 and
Table 4 indicate that the types of tasks are different at individual workplaces, and performing the same operation (e.g., setting up the main route) will require a different number of them. In order to make at least an approximate comparison of workplaces possible, we assume the subsequent grouping of tasks into more easily comparable groups of a similar type (
Section 3.1).
2.3. Event Trees
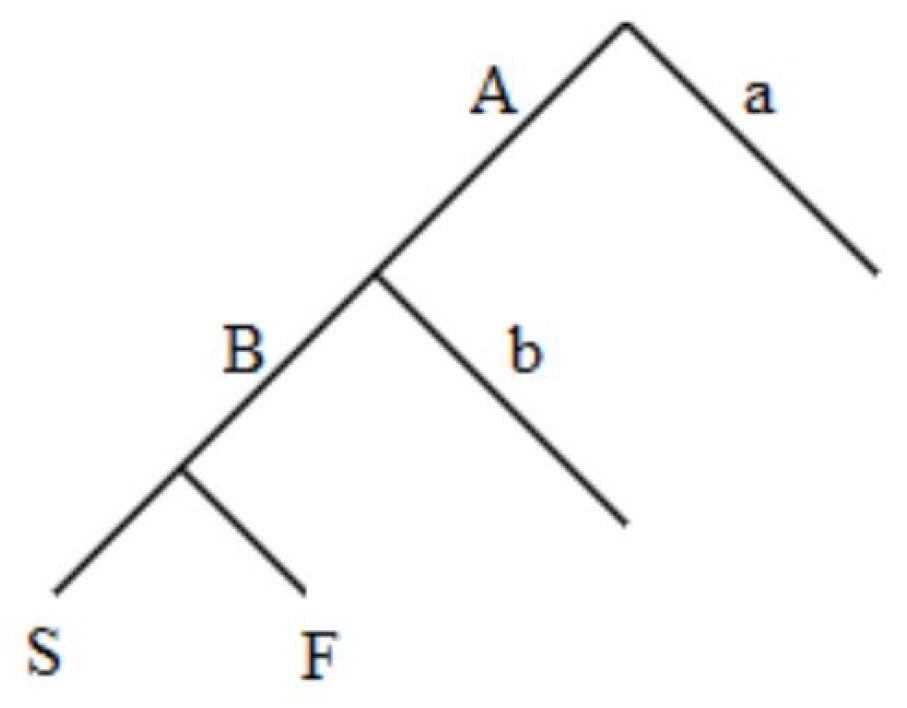
Another part of our qualitative analysis dealt with building event trees (sometimes also called task trees). This methodical approach makes it possible to determine potential conditions and event sequences. Each node of the tree represents an action, the sequence of which is shown from the top downwards. The branch originating from the node to the left (marked with a capital letter) indicates the success; the branch going to the right (marked with a lowercase letter) indicates the failure. To demonstrate the analyst’s approach, let us show an example of the event tree representing an operation performed at workplace B, which ensures setting up the main route (
Figure 1).
Setting up a main route, the operator must select and push the appropriate start and end buttons on the control panel. The meaning of branch A-a is as follows: (A)—the right choice and service of the start button, (a)—incorrect operation of the start button. The meaning of branch B-b is analogical for the end button. The symbol S represents the successful issuing of the order for setting up the main route, and the symbol F represents its failure.
2.4. Quantitative Analysis
We quantified individual branches of the created event trees in the next step. Each branch represents one operator’s action, performable either correctly or incorrectly. By applying the probability of successful or unsuccessful execution of a partial task, we can find out the overall probability of the successful execution of the whole task or, conversely, the probability that the operator may fail to perform the task. For quantitative evaluation, we used recommended data taken from the HRA handbook [
17] and worked with two types of values: the human error probability (
HEP) and the error factor (
EF). To ensure consistency of estimations, we tried to ensure the same or as similar observation conditions as possible: workplaces located in the neighborhood and on the same railway line, the same observer, the same operator within a specific workplace, and the same methodology.
HEP is the probability of an error occurring when performing a given task. Because of the lack of data on distributions of
HEPs for railway domain operators, we used the lognormal distribution and the single-point estimates of
HEPs regarded as medians of this distribution. We used
EF values to designate the range of
HEPs. For example, if we have the nominal value
HEP = 0.003, and
EF = 3, the lower
HEP limit can be obtained as
, and the upper
HEP limit as
. The lower limit represents the 5th percentile of the logarithmic normal distribution of the
HEP value, and the upper limit represents the 95th percentile of the
HEP value. The analyst who knows the evaluated process can apply the appropriate limit of
HEP according to his/her judgment and information obtained about the analyzed process. Getting the
HEP estimate, we can calculate the human success probability (
HSP), according to (1):
Traversing the task tree up to the value of the resulting
HSP, there are various mutually independent actions. Therefore, we can determine the value of the resulting probability of successful execution of the task
P(S) according to the THERP method as the product of all partial
HSPs of each branch in the tree:
where
A represents the
HSP value of the first operation within the task tree and
Z is the
HSP value of the last operation within the task tree. We can use the calculated value of the total
P(
S) and determine the probability of failure
P(
F) of the whole complex task as
Despite existing limitations, using the models and estimated
HEPs from the Handbook [
17] can generally lead to realistic risk assessments and reliability analysis.
Figure 2 shows our understanding of the influence of the operator’s and the signaling system’s failure on accident occurrence. It makes it possible to consider various technological levels of the station-signaling systems and the different roles of the operator. Let us assume the following:
—the probability of hazardous failure of the signaling system;
—the probability of hazardous failure of the signaling system depending on the level of automation and implementation of safety-related functions:
≈ 0—release of the main route; full automation; all safety-related functions performed by the signaling system;
= (0 − 1)—partial automation; not all safety-related functions performed by the signaling system;
= 1—without automation and the signaling system.
—the probability of the signaling system failure and its impact on safety-related functions performed by the signaling system:
= 0—the signaling system is operational;
= (0 − 1)—the signaling system is partially operational; not all safety-related functions are available;
= 1—the signaling system is inoperable; no safety-related function is available.
= 0 the signaling system performs all safety-related functions and fully supervises the operator; operator’s error cannot cause an accident ( = × = 0);
= 1 the signaling system is not available (inoperable or non-existent); it cannot perform any safety-related function ( = 1× = ).
Other essential variables we worked with were the factors influencing operators’ performance. In cooperation with the HRA, the THERP method includes these factors in analyzing the operator’s work in the form of
PSFs. We adopted the values based on [
17]. The interpretation of that approach is as follows: if all the conditions for the operator’s work are optimal, then the multipliers are equal to number 1. It means that they do not affect the calculated probabilities of
HEP. Applying these factors requires a perfect situation awareness, i.e., knowledge of the work environment, behavior and experience of the particular operator, knowledge of the current state of the work process, and knowledge of the available work procedures. With this necessary knowledge, the analyst can adapt the analysis to specific work procedures and operators. For this reason, we also observed the work of operators at different workplaces and at different times of the day to know the potential effects of these influencing factors.
In addition, the operator’s performance is also affected by the very dynamics of the controlled process. In our case, the operator’s load depends on the traffic intensity at the given workplace. To model it, we used the values given in
Table 5,
Table 6 and
Table 7.
Data in tables correspond to experienced operators who have experience with all types of tasks for at least six months. When determining the workload levels of the operator, we must also distinguish between the types of fulfilling the tasks. Two basic types of task performance are under consideration:
- 1.
‘Step-by-step tasks’ are routines, procedural guided tasks, carrying out presc- ribed procedures.
- 2.
‘Dynamic control’ involves a higher degree of human–machine interaction.
The operator also performs tasks on the basis of his/her own decision, monitoring and adherence to various operating procedures.
4. Discussion
The analysis of human reliability is more developed for some areas, and less for others. Inspired by the principles and methods applied in other well-developed domains (especially nuclear power engineering), our intention was to fill the existing gap in the field of railway traffic management. This is a rather conservative area, as a result of which many railway infrastructure managers around the world use multiple technological generations of railway signaling systems, from the oldest to the latest ones. According to our knowledge so far, there are no scientific studies that would compare different aspects of the work of traffic operators working with control systems of different generations, based on different degrees of automation. Therefore, we decided to apply one of the human reliability assessment (HRA) methods to three different workplaces with different degrees of automation—manually controlled (workplace A), semi-automated (workplace B), and automated (workplace C). Particularly, we chose THERP as the 1st generation HRA method. THERP was developed for probabilistic risk assessments of nuclear industry applications (nuclear power plants) but has been applied to other sectors, such as offshore and medical, and is a generic tool that can be applied in other sectors. The reasons for choosing THERP in our study were detailed in the introductory part of
Section 2 (dependence on the willingness of operators to cooperate, limited observation time, well-documented applications in other domains, and nature of controlled process enabling a simplified view).
Implications of our study for human factors theory and methodology, and for the practice of railway operations can be summarized as follows:
Based on our expertise in railway traffic management, we made the transfer of knowledge from other application areas, where HRA methods are widely and successfully used, and based on practical observations, we made the subjective assignment of important data (PSF, HEP) needed for practical THERP implementation;
Using particular examples, we demonstrated the procedure of how to apply the THERP method to railway signaling systems that use different technologies and various degrees of automation;
We also discussed the problem of ensuring at least approximately similar operating conditions that would allow obtaining comparable results in the human operator reliability analysis (e.g., HEP for specific operations, HEP for particular control tasks, and the workload of traffic operators);
Based on the presented approach, the railway infrastructure manager can obtain an idea of the workload of the operators, the distribution of tasks over time, and their composition (numbers and types of operations), which can be beneficial, e.g., when preparing the content of training and testing activities.
4.1. Limitation of the Method
Human reliability assessment (HRA) involves the use of qualitative and quantitative methods to assess human contribution to risk. The method applied in our study (THERP) is used for the purposes of evaluating the probability of a human error occurring throughout the completion of a specific task. It has the following limitations:
It can be very resource intensive and time consuming. It may require a large amount of effort to produce reliable HEP values;
It does not offer enough guidance on modeling scenarios and the impact of PSFs on performance;
The level of detail that is included in THERP may be excessive for many assessments;
As the 1st generation technique, it works on the basis of the simple dichotomy of ‘fits/doesn’t fit’ in matching an error situation in context with related error identification and quantification, i.e., it means that its procedures follow the way conventional reliability analysis models a machine.
Generally, the character of collected data makes it possible to analyze the dynamics of human errors. For example, we could expect to observe a dependence between the time spent at the workplace and the probability of human error. However, the practical results and used method did not allow us to confirm or deny this assumption. The number of observed errors was relatively low, and according to our analysis, their occurrence was more dependent on increased traffic intensity and higher stress caused by the need to perform multiple operations simultaneously.
4.2. Limitation of Application Domain
Comparing different railway signaling systems under the same conditions and in the same workplace is a hypothetical and unattainable task. Even upgrading the old station-signaling system to the new one does not guarantee the same comparable conditions. Implementing a higher degree of automation in the same workplace will naturally extend the implemented functions and change the character and scope of the operator’s activities.
However, many influences can undermine the comparability conditions. Humans have certain mental and physical conditions, resistance to fatigue and emotional stress, the ability to perform more than one task simultaneously (multitasking), and various achieved levels of training. Variable traffic conditions can influence the operator’s workload, create time pressure, cause the operator’s inattention, and evoke improper routine habits. Other factors worth mentioning are the availability of the working procedures, experiences with the tasks of the same type, experiences with known tasks, the time interval between two successive operations, knowledge of the operational situation, and the operator behavior mode (skill based, rule based, and knowledge based). Thus the behavior of different operators or even the same operator in the same traffic situation may not always be the same. It is necessary to take into account the different weights of influencing factors. To eliminate as many influencing factors as possible, or reduce their influence at least, we adopted the following monitoring principles:
We chose such workplaces A, B, C that were situated on the same rail line, close to each other, to ensure similar traffic conditions, and having similar numbers of starting, passing, and ending trains;
We made observations at the exact daily times (the same days of the week and the same working hours) when the same train schedule determined traffic performance;
Each time, we monitored the same operator during the chosen work shifts. This choice also had a practical reason since not every operator was willing to take part in the monitoring process and communicate with the observer;
The same observer performed observations at the same workplace.
4.3. Particular Findings
When presenting results, we grouped operations into three groups to more easily make a comparison possible (
Section 3.1). The obtained data showed the following:
In the considered 3 groups of operations, there are no significant changes in individual work shifts.
The smallest number of operations is expected at Workplace A, which is connected to their manual (and often physically demanding) nature; on the other hand, the operator at the semi-automated workplace B faces the biggest workload.
Full automation at workplace C results in the lowest number of actions requiring the need for human communication and a significant limitation of actions related to ETD.
It is worth reminding that, from the safety point of view, the purpose of railway interlocking and signaling systems is to control or completely replace (if possible) the unreliable human factor, and therefore to reduce the number of actions performed by humans.
Our analysis required the collection of data characterizing the activities of individual operators. In total, we completed approximately 1440 min of monitoring the real operation. As a result, we could observe and analyze all the performed tasks and analyze them in 15 min and 1 h time intervals. The analysis resulted in the creation of event trees. In the quantitative part of the analysis, we used the trees to assign probabilities for each task and calculate final HEP and HSP values. An essential part of the analysis was assigning the influencing factors and their application as multipliers. The results indicate that operators do not make many errors. HEP values are between 0.01 and 0.016. The results of the presented research attracted the attention of the railway infrastructure manager. They made it possible to re-evaluate operators’ workload and working duties at the analyzed workplaces and more suitably deal with additional organizational and technical measures.
4.4. Future Work
Our study is closed under the present situation, i.e., we do not plan to collect more data. However, as reconstruction work is underway on the Púchov–Žilina railway line, there is a chance that workplaces A and B will soon be upgraded to a higher technological level. Then we could repeat our monitoring effort to obtain comparable data from the site with (almost) the same traffic intensity, the same track configuration, and maybe the same operators as well.


