Article

Parametric Analysis of Gas Leakage in the Piston–Cylinder Clearance of Reciprocating Compressors †

POLO Research Laboratories, Federal University of Santa Catarina, Florianópolis 88040-900, Brazil
*
Author to whom correspondence should be addressed.
An Abridged Version of This Manuscript Has Been Presented at the 24th International Compressor Engineering Conference at Purdue, West Lafayette, IN, USA, 9–12 July 2018.
Machines 2023, 11(1), 42; https://doi.org/10.3390/machines11010042
Submission received: 17 November 2022 / Revised: 22 December 2022 / Accepted: 27 December 2022 / Published: 30 December 2022
(This article belongs to the Special Issue Advances in Positive Displacement Compressors)

Abstract

:
Gas leakage is one of the main sources of inefficiencies in low-capacity reciprocating compressors, undermining the compressor performance by reducing the mass flow rate and increasing the energy consumption. In reciprocating compressors, leakage in the piston–cylinder clearance is driven by the piston motion and pressure difference between the compression chamber and the internal environment of the shell. This paper reports a parametric numerical analysis of leakage in the piston–cylinder clearance of a low-capacity reciprocating compressor. A simulation model based on the Reynolds equation is applied throughout the compression cycle to assess the effect of the compressor operating conditions, clearance geometry, piston velocity and piston secondary motion on the leakage and compressor performance. A 3D CFD model is also developed to validate the Reynolds leakage model and to evaluate the effect of the piston secondary motion on leakage, assuming the piston is fixed with predetermined eccentricities. The results show that the compressibility effects are very relevant to estimate the gas leakage. The simulations also revealed that leakage is more detrimental to the compressor performance when it is operating in low back-pressure conditions. Additionally, the piston secondary motion can intensify the gas leakage in the piston–cylinder clearance by up to 90%. On the other hand, the piston velocity only plays a minor role in assessing the leakage.

1. Introduction

Gas leakage through valves and in the piston–cylinder clearance can significantly reduce the volumetric and isentropic efficiencies of small reciprocating compressors used in household refrigeration systems. Silva and Deschamps [1] reported that a gap of 1 µm in valves of small reciprocating compressors can reduce the volumetric and isentropic efficiencies by 2.7% and 4.4%, respectively. Leakage in the piston–cylinder clearance is even more critical and must therefore be carefully considered in the design of small high-efficiency compressors. In most reciprocating compressors adopted in refrigeration systems, the cylinder–piston clearance is filled with a mixture of refrigerant gas and lubricating oil. Because, in addition to its lubricating function, the oil also acts as a sealing element for the piston–cylinder clearance, leakage is expected to be more detrimental to oil-free compressors.
Zuk and Smith [2] presented an analytical model to assess leakage in small gaps between parallel and small tilt angle plates by applying the compressible flow formulation of the Reynolds equation with static boundaries. Ferreira and Lilie [3] developed an analytical model to estimate leakage in the piston–cylinder clearance, considering the piston motion and incompressible fluid flow formulation. Yuan et al. [4] simulated the flow in small clearances with different flow formulations and found that inertial effects are negligible for clearances smaller than 6 µm. In addition, Liang [5] investigated the piston–cylinder clearance of an oil-free linear compressor, addressing the power losses due to leakage with the compressor operating at high pressure ratios. Liang [5] calculated the power loss by means of an analytical expression based on the leakage model proposed by Zuk and Smith [2], indicating an 8.2% loss of power input for nitrogen and losses as high as 27% of power input for R600a.
During the compression cycle, radial forces originating from the drive mechanism give rise to piston secondary motion, which can affect the compressor reliability and gas leakage in the piston–cylinder clearance. Prata et al. [6] and Rigola et al. [7] developed numerical models to calculate the piston secondary motion considering only oil in the piston–cylinder clearance. The authors adopted equations for solving the piston and connecting rod dynamics along with the two-dimensional Reynolds equation for incompressible fluid flow to calculate the pressure field in the clearance.
Grando et al. [8] extended the analysis of Prata et al. [6] by considering the presence of oil and refrigerant in the clearance, with the mixture properties being calculated via the void fraction parameter. The gas leakage was estimated based on the amount of refrigerant dissolved in the leaking oil. Lohn and Pereira [9] numerically predicted gas leakage in the piston–cylinder clearance, considering fixed piston radial misalignments. They found that the compressible fluid flow formulation is required for the analysis. Moreover, the authors suggested the piston secondary motion should be predicted during the compression cycle to estimate gas leak through the piston–cylinder clearance.
The most recent studies concerning leakage were focused on other types of compressors. Kim et al. [10] investigated the leakage during the compression cycle of rolling piston rotary compressor, considering models with and without the lubricating oil presence. A model based on CFD simulations was developed for the pure refrigerant case, whereas the area ratios for the refrigerant and the oil in the radial clearance were estimated by means of a simplified multiphase model. Kim et al. [10] also presented an experimental rig to measure the leakage in a simplified geometry of the rolling piston–cylinder assembly. Santos et al. [11] investigated the refrigerant flow in the piston–cylinder clearance of a linear oil-free compressor by means of a CFD model, showing that the clearance size can significantly reduce the compressor efficiency. Aw and Ooi [12] studied the three-dimensional leakage gas flow in an oil-free revolving vane compressor by means of a CFD model combined with a Fanno flow model. Their results showed a difference of ±15% in comparison with experimental data. The scroll compressor has been the subject of recent leakage analyses, due to the relevance of leakage on its performance. Pereira and Deschamps [13] proposed correlations based on results of numerical simulations to predict the radial and tangential leakage in scroll compressors. Fukuta et al. [14] experimentally investigated the influence of the introduction of a tip seal to prevent radial leakage in scroll compressors, evaluating the influence of different geometric parameters on leakage. Wang et al. [15] numerically studied the influence of deformation induced contact on the radial and tangential leakages in scroll compressors.
As can be seen, the previous studies on piston secondary motion of reciprocating compressors were mainly focused on the lubrication provided by the fluid film in the piston–cylinder clearance. In fact, only Grando et al. [8] attempted to predict gas leakage using a costly multiphase flow model. The present paper reports a numerical analysis of gas leakage in the piston–cylinder clearance based on the two-dimensional Reynolds equation, considering compressibility effects and piston secondary motion. The piston secondary motion was solved using the same approach described in Prata et al. [6], assuming the clearance to be filled with lubricating oil. The presence of lubricating oil in the piston–cylinder clearance also affects the leakage of gas, but it is difficult to assess in what form and in what quantity the oil interacts with the gas flow. Therefore, the gas leakage rate for each position of the piston throughout the compression cycle can be represented by two limiting scenarios: (i) the cylinder–piston clearance filled with a saturated mixture of refrigerant gas and lubricating oil; (ii) only gas in the clearance. In this paper, the gas leakage rate for each position of the piston throughout the compression cycle is predicted for the most critical scenario (ii). This approach is of low computational cost, hence allowing the model to be coupled easily with a simulation model for the compression cycle. The analysis to be presented next considers different compressor operating conditions, rotational speeds, and clearance sizes, allowing the effect of the leakage on the compressor performance to be estimated.

2. Materials and Methods

A representation of the flow geometry and solution domain adopted in this study is shown in Figure 1. A representation of the actual flow geometry associated with the leakage in the cylinder–piston clearance is shown in Figure 1a. On the other hand, Figure 1b shows the simplified solution domain for the region between the piston and the cylinder of length L and clearance h. As can be seen, the solution domain adopts a flattened geometry of the clearance, i.e., does not consider the curvature of the piston–cylinder assembly. This is a well-established practice adopted to numerically solve the dynamics of journal bearings [6,7,8].
When the simulation is carried out considering the piston concentric with the cylinder, the clearance h is constant, otherwise, h varies with coordinates θ and z. The pressure in the compression chamber is higher than the pressure in the compressor internal environment for most of the compression cycle duration. This pressure difference and the piston motion bring about the flow in the piston–cylinder clearance. When the piston moves towards the cylinder head, gas is dragged into the compression chamber and, conversely, when the piston moves in the other direction, the gas is pushed out.
The simulation model assumed the following hypotheses for the flow in the clearance: (i) absence of inertial effects; (ii) the pressure does not vary in the r direction; (iii) the piston–cylinder clearance h is much smaller than the piston and cylinder diameters, so the annular clearance can be treated as a flat channel; (iv) the gas behaves as an ideal gas; (v) the gas dynamic viscosity does not vary in the gap, but it varies from one crank angle to the next; (vi) isothermal flow, (vii) subsonic flow (viii) laminar flow and (ix) continuum flow. Hypotheses (ii) and (iii) are reasonable because (h/L)2 << 1 and (h/R)2 << 1 [16].
Considering the hypotheses (i)–(ix) and replacing the density with pressure via the isothermal flow condition of an ideal gas (i.e., p/ ρ = constant), the governing equation for the compressible flow in the clearance can be modelled by the following simplified form of the Reynolds equation:
1 R 2 θ ( p h 3 p θ ) + z ( p h 3 p z ) = 6 μ V p ( p h ) z   ,
with p and µ representing the static pressure and the fluid dynamic viscosity, respectively, Vp the piston velocity and R the cylinder radius. Further details regarding the derivation of the Reynolds equation can be found in Hamrock et al. [16].
To determine the clearance field
h ( θ , z ) = c [ e t z / L ( e t e b ) ] cos θ ,
The diametric clearance c and the piston top and bottom eccentricity e t and e b (Figure 2) must be known. This is achieved with the model proposed by Prata et al. [6], where it is assumed that the clearance is filled entirely with lubricating oil. These calculations are performed beforehand, determining the piston trajectory, that is, the eccentricities e t and e b , as a function of the crank angle. The results are then used as input values in the leakage simulation model.
The problem can be significantly simplified if we assume that the piston and cylinder are concentric, thus h is constant, and the pressure is only dependent on the z coordinate. In this case, the governing equation is:
d d x ( p d p d x ) = 6 μ V p h 2 d p d x   .
The differential Equations (1) and (3) were numerically solved with the finite volume method (FVM) by dividing the solution domain into equally spaced control volumes to form the computational mesh. The differential equations are discretized in each control volume, resulting in a system of algebraic equations. For Equation (3), only two boundary conditions are needed, p ( z = 0 ) = p c c and p ( z = L ) = p s h , where p c c is the pressure in the compression chamber and p s h is the pressure inside the compressor shell, assumed constant along the compressor cycle. On the other hand, for Equation (1), four boundary conditions are needed, two in the z direction and two in the θ direction:
p ( z = 0 ,   θ ) = p c c
p ( z = L ,   θ ) = p s h
p ( z ,   θ = 0 ) = p ( z ,   θ = 2 π )
p θ ( z ,   θ = 0 ) = p θ ( z ,   θ = 2 π ) ,
where the last two represent the circularity of the domain, assuring the continuity of the pressure and its derivative.
We estimated the pressures at the boundaries of the volumes via the arithmetic mean of the pressures at the neighboring points. The pressure field is calculated by solving the system of algebraic equations with the solver provided by the Eigen library [17]. Since Equations (1) and (3) are non-linear, an initial pressure field is required to determine the coefficients of the algebraic equations. An iterative solution procedure is then employed to update the coefficients until the convergence criteria described in Equation (8) is attained:
max ( p | k p | k 1 ) min ( p | k ) < 10 3 ,
That is, when the maximum difference between two consecutive pressure fields ( p | k and p | k 1 ) divided by the minimum value of pressure in the most recent pressure field is less than 10−3.
Once the pressure field is known, the leakage mass flow rate m ˙ l can be obtained at any section of the domain parallel to the plane using:
m ˙ l = 0 2 π ( ρ h 3 12 μ p z + ρ V p h 2 ) R d θ ,
where ρ is the gas density. The first and second terms inside the parentheses of Equation (9) are the contributions to the leakage given by the pressure difference and piston motion, respectively. We evaluated Equation (9) numerically, estimating the pressure derivative through a second-order approximation.
Two boundary conditions for pressure are needed in the numerical model. The first is the pressure in the compressor internal environment, which is constant throughout the compression cycle, and the second is the pressure in the compression chamber (pcc), which is evaluated at each crank angle (wt) with a simulation model described by Link and Deschamps [18]. This simulation model is also used to determine the piston velocity, dynamic viscosity and density to be applied in Equation (9), throughout the compression cycle. In turn, the model for the flow in the piston–cylinder clearance provides the leakage required to evaluate the compression cycle. When the piston secondary motion is considered, the piston top and bottom eccentricities are previously calculated and used as inputs to the leakage model. Figure 3 illustrates the procedure adopted for the compression chamber model and the coupling with the leakage models. Additionally, five compression cycles are simulated, to guarantee that the solution for the compression cycle is converged.
It is worth mentioning that the valve system is considered ideal, that is, the suction and discharge processes take place at constant pressure (evaporating or condensing pressure, respectively). This simplification was adopted because simulations with and without the solution of the valve dynamics did not show significant difference regarding leakage. The simulations considered different clearances, speeds and operating conditions, and the maximum relative difference obtained was 3.59%. The suction and the discharge valves were modeled by means of a single degree of freedom model, considering typical reed valves employed in small capacity reciprocating compressors. This is a convenient outcome because if valve dynamics was important, the analysis would be restricted to a specific compressor model.

3. Results and Discussion

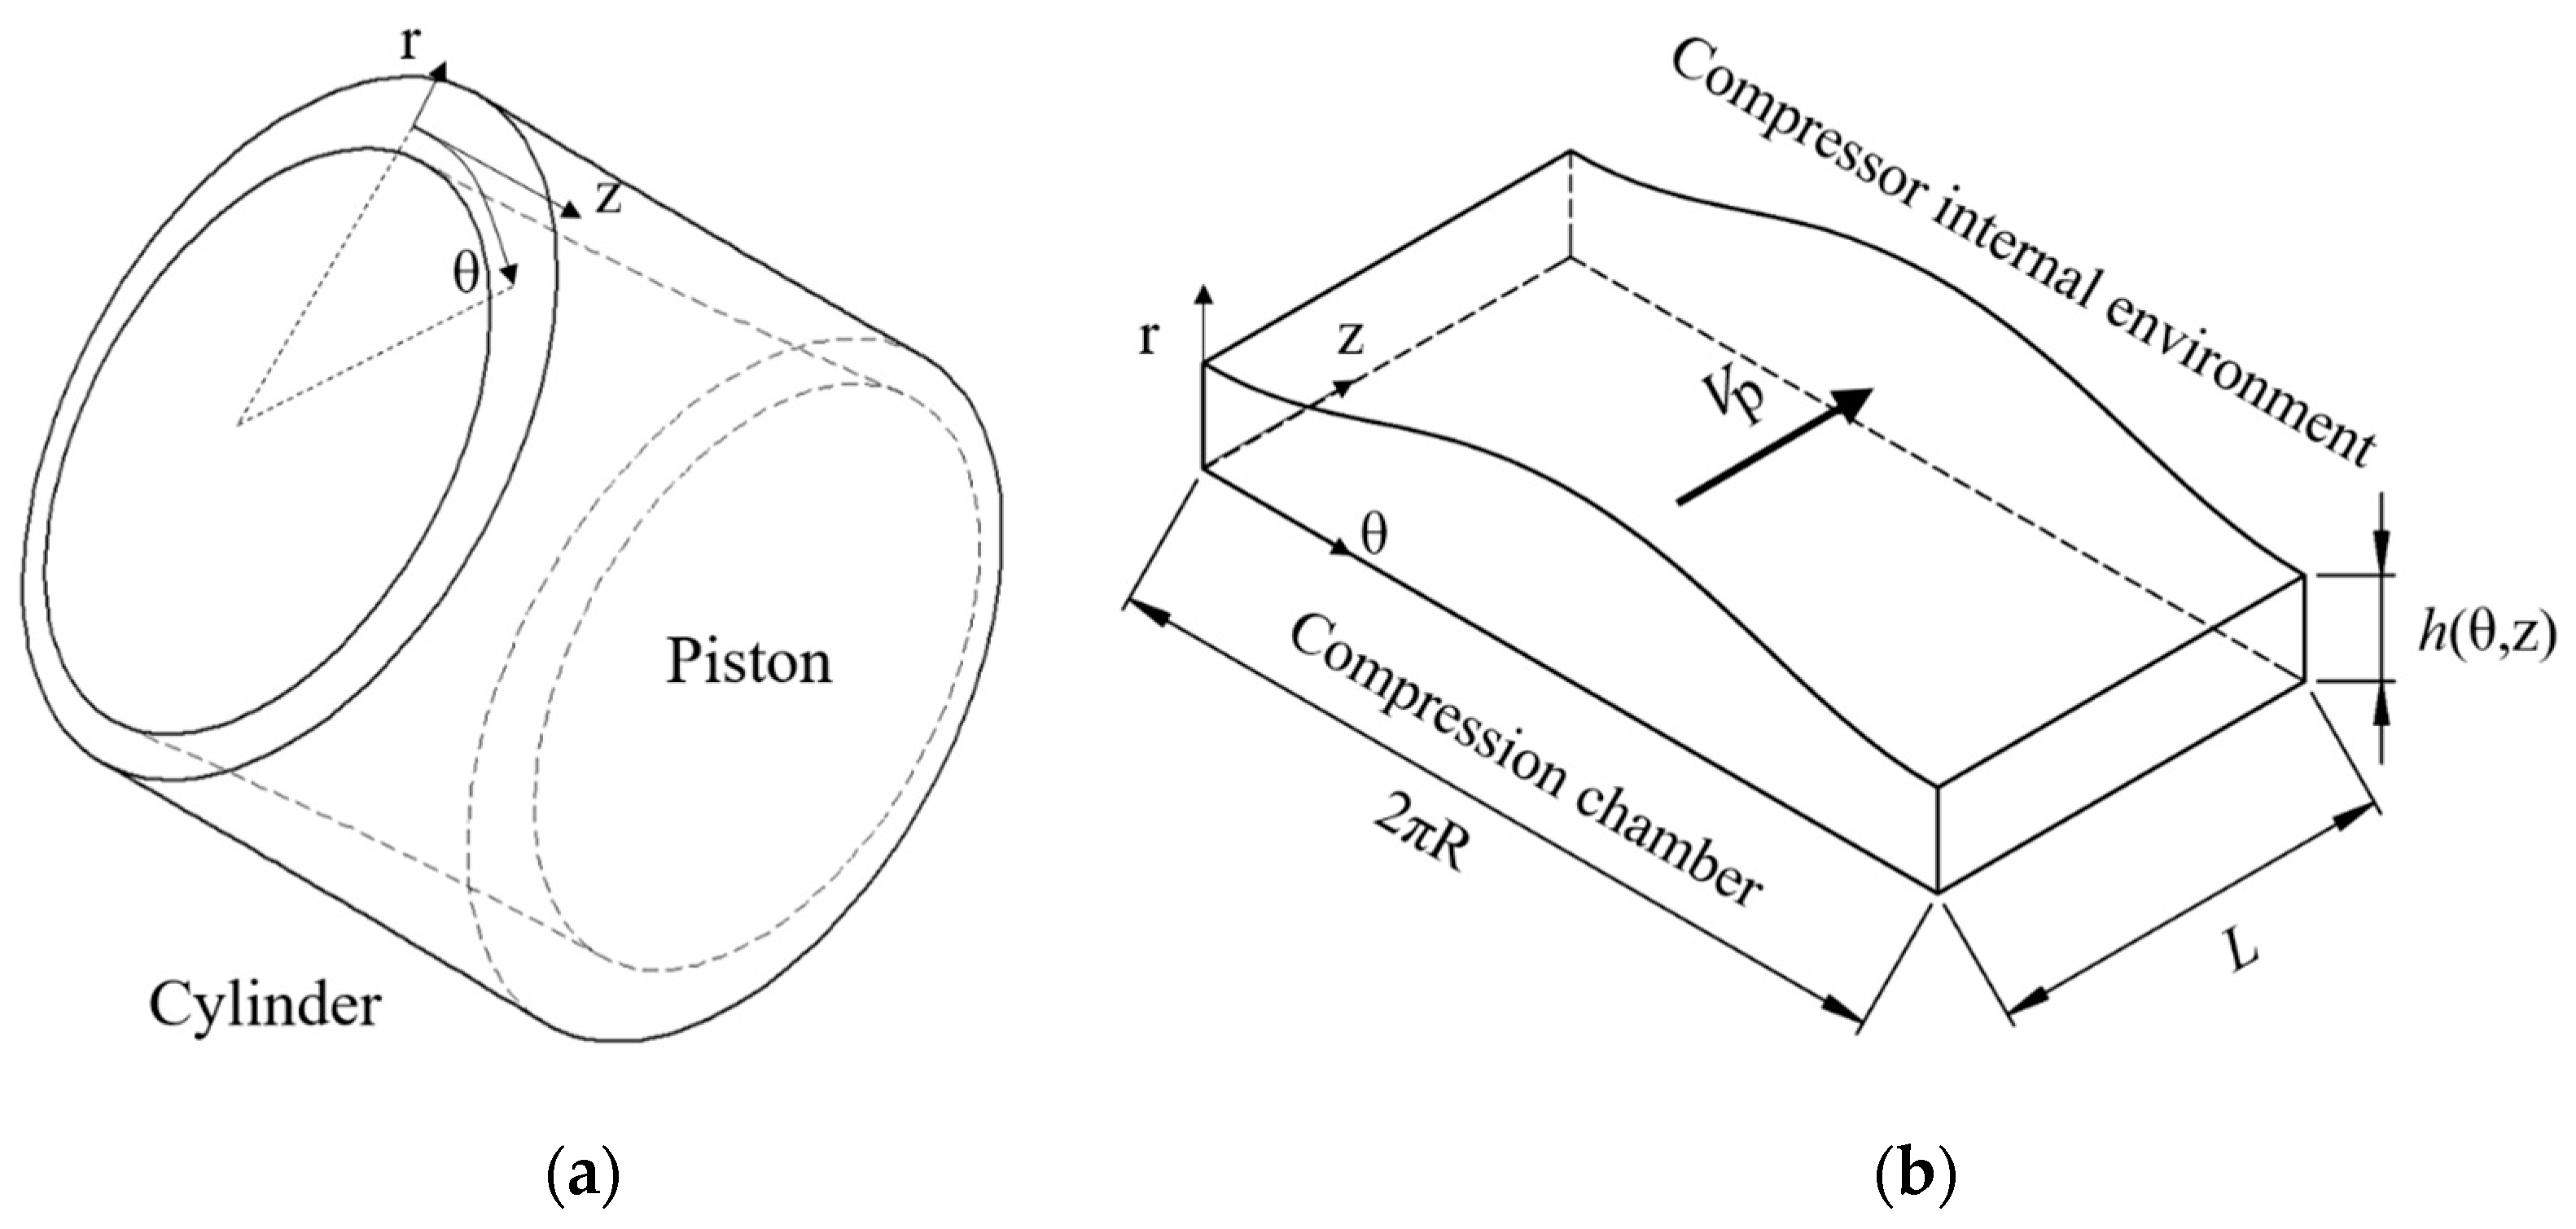
The present investigation considers a low-capacity reciprocating compressor with a displacement of 3 cm3, R = 10.5 mm, L = 18.1 mm, operating with R-600a, operating with condensing temperature of 54.4 °C and evaporating temperature of −23.3 °C, unless stated otherwise. Firstly, the effects of gas compressibility and compressor speed were investigated by applying the 1D model that assumes the piston is concentric inside the cylinder. The 2D model was then adopted to assess the influence of the piston secondary motion on the leakage. It should be mentioned that the results of models were obtained considering the worst-case scenario, in which the clearance is filled only with gas. Naturally, had we considered the oil, the total leakage would be smaller, since the lubricating oil also acts as a sealing agent. However, although oil is not considered when evaluating the leakage of gas, lubrication must be considered to evaluate the piston trajectory required in the 2D model. To this extent, we adopted a model based on the Reynolds equation described by Prata et al. [6]. Further details and the results of each analysis are presented below.

3.1. Verification of the Simplifying Hipotheses

Before carrying out the analysis, it is important to verify the validity of the hypotheses of continuum flow and ideal gas adopted in the simulation model.
A gas can be assumed as a continuum if the molecular mean free path, λ, is small compared to the characteristic length of the flow, L. Rarefaction effects become more important as the Knudsen number, K n   ( = λ / L ) , increases. In fact, the Knudsen number is used to classify different flow regimes as follows: continuum flow ( K n 10 2 ), slip flow ( 10 2 < K n 10 1 ), transitional flow ( 10 1 < K n < 10 ), and free-molecular flow ( K n 10 ). It should be noted that the continuum hypothesis starts to fail when 10 2 < K n 10 1 , but the Navier–Stokes equation can still be used in such situations with modified boundary conditions.
For a simple gas of hard molecules in thermodynamic equilibrium, the mean free path λ is given by the following relationship [19]:
λ = 1 2 π d 2 n   ,
where d and n are the molecular diameter and the number density of the gas, respectively.
The molecular diameter d can be obtained from the viscosity and the Chapman–Enskong theory of transport properties for hard sphere molecules:
μ = 5 16 π m k B T π d 2     ,
where m is the molecular mass, k B (=1.3805 × 10⁻²³ J/K) is the Boltzmann constant and T is the temperature. The mean free path can be expressed more conveniently by combining Equations (10) and (11), resulting:
λ = 16 5 ( 2 π R T ) 1 / 2 μ ρ   .
The mean free path λ is a function of the properties of the flow through the piston–cylinder clearance, which vary with the crank angle ωt. Hence, the Knudsen number was calculated for the entire cycle of compression, using the rigid sphere model described by Bird [19] and considering the LBP operating condition (condensing temperature of 54.4 °C and evaporating temperature of −23.3 °C), since this condition presents the widest range of pressure and temperature.
Figure 4 shows the variation of K n throughout the cycle, for two nominal diametric clearances taken as the characteristic length. As can be seen, part of the cycle is in the slip flow regime when c = 5 µm. However, the most important part of the crank angle for the leakage calculation, i.e., the region where the pressure difference is the greatest (between 90° and 270°), is located within continuum theory, which validates the continuum flow hypothesis adopted herein.
Next, the ideal gas hypothesis was investigated by calculating the compressibility factor Z for isobutane (R-600a), employing the REFPROP [20] software and considering the LBP condition. Figure 5 shows that the minimum compressibility factor along the compression cycle is approximately 91%, so the deviation from ideal gas behavior is less than 10%, allowing the ideal gas hypothesis to be considered with small deviation.

3.2. Results for Concentric Piston and Cylinder (1D Model)

The solution domain for the simplified geometry of concentric piston and cylinder is shown in Figure 6. A first step in the analysis was to verify if the model implementation accurately represents the conceptual description and the solution of the model [21]. In the study reported herein, the model was verified in terms of the truncation error, convergence criterion and implementation of the mathematical equations.
A grid convergence study was performed to assess the sensitivity of the numerical results to the spatial discretization. The grid convergence index (GCI) of Roache [
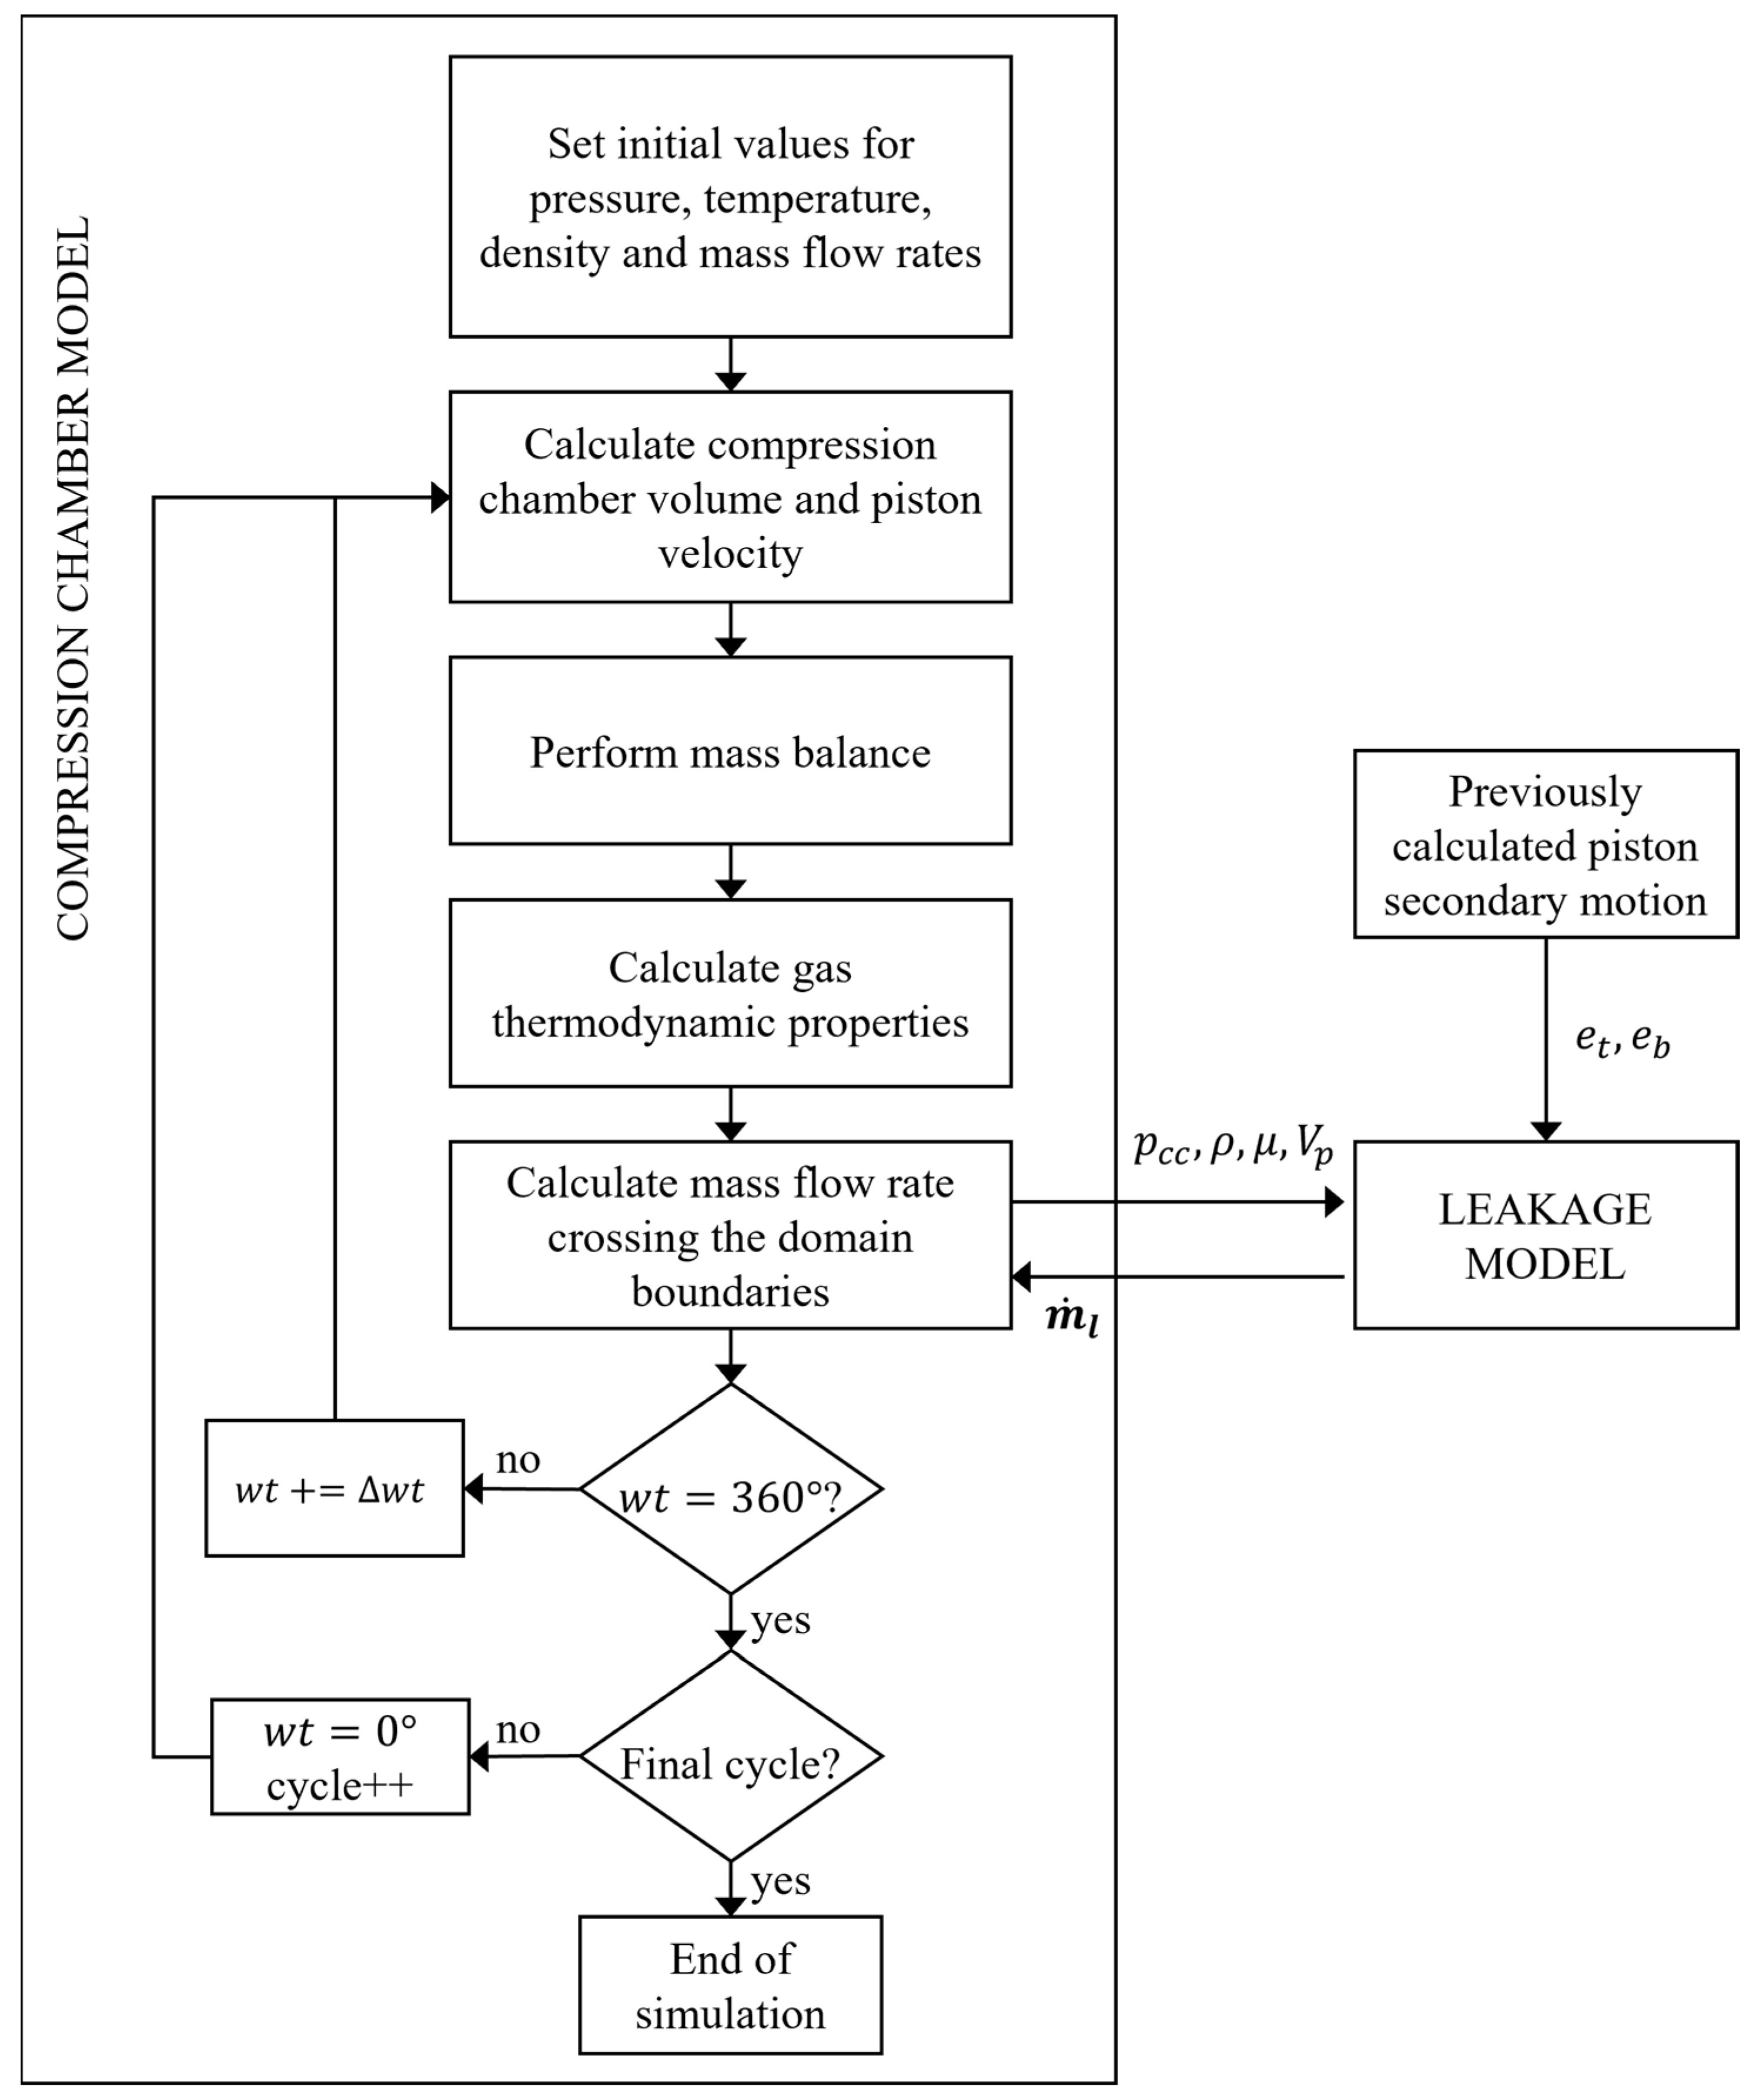
22] was used as a quantitative indicator to assess the required grid resolution. Accordingly, the GCI is applied to each grid resolution and estimates the discretization error via the extrapolation method of Richardson, which represents a measure of the percentage deviation from the calculated value in relation to the asymptotic solution. The GCI ratio is calculated to ensure a grid-independent solution. In this respect, a total of 250 control volumes were employed to discretize the solution domain, i.e., the piston–cylinder clearance, to guarantee that the difference between the model predictions and the estimates obtained via the Richardson extrapolation was less than 0.01%. The compression cycle was solved for small increments of the crank angle (Δwt = 0.001°) without considering the valve dynamics and heat transfer at the compression chamber walls.
The results of the 1D model were initially validated through comparison with the experimental data of Suefuji et al. [23] for mass flow rate of R22 through a channel with a constant clearance (h). The length and width of the channel were 4.5 mm and 126 mm, respectively, whereas the clearance value and the inlet pressure were varied throughout the tests. The temperature was set at 300 K and the outlet pressure was kept at 100 kPa. For completeness, we also compared our results to predictions of other models available in the literature. First, we included the correlation developed by Bell et al. [24] for radial leakage in scroll compressors, which can also be applied for the piston–cylinder clearance if we consider a constant gap. Next, we included the analytical model proposed by Zuk and Smith [2].
As can be seen from Figure 7, the leakage mass flow rate ( m ˙ l ) predicted by the model described herein and the measurements of Suefuji et al. [23] are in reasonable agreement. Table 1 shows the comparison between the measurements and predictions for three representative values of the pressure ratio span of each clearance. As can be seen, the maximum differences are around 10% for h = 9 µm and 21 µm. For the most challenging case for measurements (h = 3.6 µm) the maximum difference between the prediction and experimental data is approximately 40%. We also observe that Bell et al. [24] correlation underpredicts leakage for the three gaps. Additionally, the predictions regarding the Zuk and Smith [2] model were found coincident with the results of our model, which is an expected result, because for constant gap and neglecting piston velocity the two models are the same.
Leakage in the piston–cylinder clearance is brought about by the piston motion and pressure difference between the compression chamber and the internal environment of the compressor shell. The compressor rotational speed (n) or drive frequency determines the piston velocity, which is also responsible for the flow in the piston–cylinder clearance. In order to investigate the effect of the piston velocity on the leakage throughout the compression cycle, the 1D model was applied with different values for the rotational speed.
Figure 8 shows the results of these simulations for the diametric clearance c = 5 µm (radial clearance h = c/2 = 2.5 µm) and the LBP condition. The ‘no velocity’ curve represents the results of Equation (9) with Vp = 0 m/s. The vertical axis represents the relative leakage mass flow rate ( m ˙ l * ), defined as the leakage mass flow rate divided by the mass flow rate that an ideal compressor without leakage could supply. Positive values for m ˙ l * represent gas leaking from the compression chamber and negative values indicate leakage into the compression chamber. The results show that an increase in the piston velocity reduces the leakage rate in the compression and discharge processes (crank angles between 0° and 180°) and the opposite occurs in the expansion and suction processes (crank angles between 180° and 360°). In fact, the piston moves towards the top dead center in the compression process and therefore drags gas into the compression chamber through viscous friction, which reduces the m ˙ l * value. The opposite effect occurs when the piston moves towards the bottom dead center. Figure 8 also shows that the piston velocity plays a minor role in the leakage, with only a small reduction of the overall leakage in the cycle. For instance, even when the piston velocity is increased to n = 5400 rpm the total leakage throughout the cycle is reduced by approximately 5%.
The compressor operating conditions are defined by the evaporating and condensing temperatures of the refrigeration cycle, which defines the compressor suction and discharge pressures. Reference operating conditions used to test refrigeration compressors are the low-back pressure (LBP), medium-back pressure (MBP) and high-back pressure (HBP), as shown in Table 2. The effect of such operating conditions on gas leakage is also investigated.
The results for c = 9 µm and n = 3600 rpm shown in Figure 9 reveal that the leakage mass flow rate in the compressor increases with the evaporating pressure (pevap). This may seem unexpected since the pressure difference decreases as the evaporating pressure increases, keeping the same condensing pressure (7.62 bar). Nevertheless, as indicated by Equation (9), the leakage mass flow rate also depends on the gas density, which is highest for the HBP condition, because the gas temperature in the discharge process reaches its lowest value. This aspect compensates for the smaller pressure difference of the HBP condition. As opposed to the leakage mass rate ( m ˙ l ), the relative leakage ( m ˙ l * ) decreases with evaporating pressure, which shows that the relative influence of the gas leakage is more significant for the LBP case.
The effect of gas compressibility on leakage was investigated by comparing the results of the simulation models for compressible and incompressible fluid flow formulations. In the calculations, the LBP condition and different rotational speeds were considered. Figure 10 shows the results for the leakage mass flow rate for two diametric clearances (c = 5 and 13 µm). As can be observed, fluid compressibility effects are present in the flow and must be considered in the simulation model, otherwise predictions would overestimate the leakage in the piston–cylinder clearance. For instance, for n = 1800 rpm, the leakage predicted with the incompressible fluid formulation is approximately twice the value provided by the compressible fluid model. Hence, even without evidence from measurements, the incompressible formulation can be discarded as a physically meaningful representation of the critical scenario of only gas in the clearance.
The volumetric efficiency and isentropic efficiency are commonly used to assess compressor performance. The volumetric efficiency η v is defined as the ratio between the actual mass flow rate, m ˙ , and the ideal mass flow rate, m ˙ t h :
η v = m ˙ m ˙ t h .
The ideal mass flow rate is that which undergoes no reduction due to different factors such as leakage, cylinder clearance volume, suction gas superheating and flow viscous friction.
The isentropic efficiency is defined as the ratio between the compression power required by an isentropic process and the actual indicated power, i.e.,
η s = W ˙ t h W ˙ .
Figure 11 shows the results obtained for the reduction in the efficiency due to leakage, for different rotational speeds and clearances, considering the LBP condition. The reduction in efficiency is defined herein as the absolute difference between the volumetric and isentropic efficiencies with and without gas leakage (subscript ‘nl’):
Δ η v = | η v η v ,   n l |   ,     Δ η s = | η s η s ,   n l | .
As can be seen in Figure 11, the effect of leakage on the reduction of both efficiencies is more significant for a lower drive speed and larger clearance. In the worst cases, the reduction can reach more than 8% for the volumetric efficiency and more than 22% for the isentropic efficiency.

3.3. Effect of the Piston Secondary Motion

To the authors’ knowledge, there is no available experimental data for leakage in the piston–cylinder clearance of reciprocating compressors when the piston secondary motion is considered. Because of that, the validation of the 2D model was carried out by comparing the model predictions with the results of CFD simulations performed in ANSYS Fluent v15. The simulations considered laminar, steady fluid flow, using a coupled scheme for the pressure and velocity solution, and second order discretization schemes for the momentum, density, and pressure. Five boundary conditions were adopted: (i) pressure at the inlet equal to 7.62 bar; (ii) pressure at the outlet equal to 0.629 bar; (iii) moving nonslip condition for the piston wall; (iv) static nonslip condition for the cylinder wall; (v) symmetry for the faces across the rz plane, as shown in Figure 12.
A mesh convergence study was performed to assess the sensitivity of the numerical results to different levels of discretization. The grid convergence index (GCI) of Roache [22] was then used as a quantitative indicator to assess how far the numerical result was from mesh independence, which in our case was found to be 4% for the 3D model and 0.02% for the 2D model. Figure 13 shows the 2D and 3D mesh model diagrams. Figure 13a depicts the uniform 40 × 40 discretization mesh used in the 2D model, with volume indexation up to n θ = n z = 40. The mesh discretization of the 3D model shown in Figure 13b had 1.6 million hexahedral volumes (32 × 250 × 200 in the r, θ, and z directions, respectively), with a progressive refinement towards the solution domain outlet since the greatest pressure gradient is found in this region.
Figure 14 shows the comparison for two cases, in case 1, the piston is symmetrically tilted, i.e., e t / c = 0.5 and e b / c = −0.5, whereas in case 2, the piston undergoes pure radial displacement: e t / c = e b / c = 0.5, where c = 13 µm and e t and e b are illustrated in Figure 2. For case 1, the comparison between our model and Fluent shows a very good agreement, with a maximum deviation of 3.4%. On the other hand, the difference for case 2 is within 14%, which is still considered acceptable. The increase in deviation from case 1 to case 2 probably comes from the fact that our model neglects the inertial terms. These terms are more important for case 2, because the radial displacement of the piston produces a path with a considerably larger clearance to the leakage flow.
Before calculating the secondary motion of the piston, its influence on the leakage was assessed by prescribing different eccentricities for the piston which was kept in a fixed position. The two configurations depicted in Figure 14 (case 1 and case 2) were analyzed for different values of dimensionless eccentricity ε = e/c. The CFD model employed to obtain the results in Figure 14 was used with the same boundary conditions, except for the piston speed which was considered zero in all cases.
Regarding case 1, Figure 15a shows that leakage decreases in comparison with the concentric case, since the symmetrical tilted position of the piston restricts the gas flow in the clearance, forcing the fluid to circumvent the piston. This effect can be observed by the streamlines depicted in Figure 16 together with the radial clearance field contour, showing the flow is directed towards the regions of greater radial clearance.
Figure 15b compares the leakage for case 2 as a function of piston eccentricities in comparison with the leakage for the concentric case ( Δ m ˙ l ). The results show that leakage is intensified as the eccentricity increases. This is because the piston radial displacement creates a region with high radial clearances, making it easier for the gas to flow through this region. In fact, leakage can increase by up to 150% when the piston is almost contacting the cylinder. This finding is corroborated by Liang [5], who also found that leakage is intensified by a factor of 2.5 when the piston positioning is fully eccentric inside the cylinder.
To assess the influence of piston secondary motion on leakage for the geometry detailed in Figure 17, we first determined the piston trajectory with a lubrication model described by Prata et al. [6], considering the oil alkylbenzene ISO VG 5. The required parameters are listed in Table 3, where zCM is the position of the piston center of mass, Crod is the connecting rod length and CCM is the position of connecting rod center of mass. The piston trajectory was calculated for different piston wrist-pin positions (zp) and different clearances (c). The results for the dimensionless eccentricity ε are shown in Figure 18.
Once the piston trajectory is known, we can determine the thickness of the fluid film for any point inside the clearance (h), applying Equation (2). Then the gas leakage can be predicted throughout the compression cycle using the 2D leakage model. Figure 19 shows the percentage difference between values for the leakage obtained with the 2D model (piston secondary motion) and 1D model (piston concentric motion). It should be noted that that leakage is greatly intensified by the piston secondary motion. Figure 19a shows that the wrist-pin position is a very important parameter, when zp/L = 0.75, i.e., the wrist-pin is located below the piston center, leakage is increased by almost 90%; on the other hand, if the wrist-pin is located in the piston center, the increase in leakage is below 20%. These results can be explained considering the eccentricities reported on Figure 18a, where it shows that zp/L = 0.75 produce the largest eccentricities. As the top and bottom eccentricities increase, and both have the same sign, the piston–cylinder assembly resembles the configuration of case 2 depicted in Figure 14 and analyzed through the results in Figure 15b. Therefore, the piston secondary motion intensifies the overall leakage through the clearance. The same effect can be observed in Figure 19b. As the diametric clearance c increases, the eccentricities in Figure 18b also increase, increasing the leakage in the clearance by approximately 90% when c = 13 µm.

4. Conclusions

A numerical analysis of leakage in the piston–cylinder clearance of a low-capacity reciprocating compressor was carried out based on the Reynolds equation. The piston secondary motion was solved considering the clearance to be filled with lubricating oil. However, the gas leakage rate for each position of the piston throughout the compression cycle was predicted for the most critical scenario, i.e., only gas in the clearance. The results of the leakage model were initially validated through comparisons with experimental data available in the literature. A simulation model for the compression cycle was then coupled to the leakage model, allowing the analysis of leakage in the piston–cylinder clearance throughout the compression cycle. The effects of operating conditions, represented by the evaporating and condensing temperatures, compressor speed, gas compressibility and piston secondary motion on gas leakage were investigated. We found that the piston velocity plays a minor role in the leakage, with only a small reduction in the overall leakage when the piston velocity is considerably high. The results also show that leakage increases with the evaporating pressure when the condensing pressure is kept constant. Nonetheless, leakage becomes more detrimental as the evaporating pressure is decreased because the compressor mass flow rate decreases to greater extent when the evaporating pressure is lowered. Furthermore, the simulations revealed that predictions with an incompressible fluid formulation strongly overestimate leakage. Concerning the compressor volumetric and isentropic efficiencies, leakage was found to be more detrimental in the case of small rotational speeds. The results also demonstrate that gas leakage can be significantly increased by the excessive piston secondary motion brought about by poor design of the piston wrist-pin position.

Author Contributions

Conceptualization, C.J.D.; methodology, V.M.B. and C.J.D.; software, V.M.B.; validation, V.M.B. and C.J.D.; formal analysis, V.M.B. and C.J.D.; investigation, V.M.B.; writing—original draft preparation, V.M.B.; writing—review and editing, C.J.D.; visualization, V.M.B.; supervision, C.J.D.; project administration, C.J.D.; funding acquisition, C.J.D. All authors have read and agreed to the published version of the manuscript.

Funding

This research was funded by Nidec-GA and EMBRAPII (“Development of new technologies for refrigeration compressors’’ Project). Additional funding was provided by the National Institutes of Science and Technology (INCT) Program (CNPq Grant No. 404023/2019-3; FAPESC Grant No. 2019TR0846).

Data Availability Statement

The data presented in this study are available on request from the corresponding author. The data are not publicly available due to privacy.

Conflicts of Interest

The authors declare no conflict of interest. The funders had no role in the design of the study; in the collection, analyses, or interpretation of data; in the writing of the manuscript; or in the decision to publish the results.

References

  1. Silva, L.R.; Deschamps, C.J. Modeling of gas leakage through compressor valves. Int. J. Refrig. 2015, 53, 195–205. [Google Scholar] [CrossRef] [Green Version]
  2. Zuk, J.; Smith, P.J. Computer Program for Viscous Isothermal Compressible Flow Across a Sealing Dam with Tilt Angle; NASA Technical Note D-5373; National Aeronautics and Space Administration: Washington, DC, USA, 1969.
  3. Ferreira, R.T.S.; Lilie, D.E.B. Evaluation of the leakage through the clearance between piston and cylinder in hermetic compressors. In Proceedings of the International Compressor Engineering Conference at Purdue, West Layette, IN, USA, 11–13 July 1984. [Google Scholar]
  4. Yuan, X.; Chen, Z.; Fan, Z. Calculating model and experimental investigation of gas leakage. In Proceedings of the International Compressor Engineering Conference at Purdue, West Layette, IN, USA, 14–17 July 1992. [Google Scholar]
  5. Liang, K. Analysis of oil-free linear compressor operated at high pressure ratios for household refrigeration. Energy 2018, 151, 324–331. [Google Scholar] [CrossRef]
  6. Prata, A.T.; Fernandes, J.R.S.; Fagotti, F. Dynamic analysis of piston secondary motion for small reciprocating compressors. J. Tribol. 2000, 122, 752–760. [Google Scholar] [CrossRef]
  7. Rigola, J.; Pérez-Segarra, C.D.; Oliva, A. Numerical simulation of piston leakage over hermetic reciprocating compressors behavior. In Proceedings of the International Conference of Compressors and their Systems, West London, UK, 7–9 September 2009. [Google Scholar]
  8. Grando, F.P.; Priest, M.; Prata, A.T. Lubrication in refrigeration systems: Numerical model for piston dynamics considering oil-refrigerant interaction. J. Eng. Tribol. 2006, 220, 245–258. [Google Scholar] [CrossRef]
  9. Lohn, S.K.; Pereira, E.L.L. Numerical investigation of the gas leakage through the piston-cylinder clearance of reciprocating compressors. In Proceedings of the International Compressor Engineering Conference at Purdue, West Layette, IN, USA, 14–17 July 2014. [Google Scholar]
  10. Kim, G.; Min, B.; Na, S.; Choi, G.; Kim, D. Estimation of leakage through radial clearance during compression process of a rolling piston rotary compressor. J. Mech. Sci. Technol. 2017, 31, 6033–6040. [Google Scholar] [CrossRef]
  11. Santos, C.J.; Dutra, T.; Deschamps, C.J. Scrutinizing the sources of inefficiencies in the piston-cylinder clearance of an oil-free linear compressor. Int. J. Refrig. 2019, 104, 513–520. [Google Scholar] [CrossRef]
  12. Aw, K.T.; Ooi, K.T. Leakage study of a lubricant-free revolving vane compressor. Int. J. Refrig. 2021, 124, 122–133. [Google Scholar] [CrossRef]
  13. Pereira, E.L.L.; Deschamps, C.J. Numerical analysis and correlations for radial and tangential leakage of gas in scroll compressor. Int. J. Refrig. 2020, 110, 239–247. [Google Scholar] [CrossRef]
  14. Fukuta, M.; Sotani, T.; Motozawa, M. Leakage and friction characteristics at sliding surface of tip seal in scroll compressor. Int. J. Refrig. 2021, 125, 104–112. [Google Scholar] [CrossRef]
  15. Wang, C.; Zhang, S.; Zhao, Z.; Cheng, J.; Wu, J. Study on the contact and size of radial and flank leakage gaps of scrolls in a scroll compressor with CFD/CSM simulations. Int. J. Refrig. 2022; accepted. [Google Scholar]
  16. Hamrock, B.J.; Schmid, S.R.; Jacobson, B.O. Fundamentals of Fluid Film Lubrication, 2nd ed.; Marcel Dekker Inc.: New York, NY, USA, 2004. [Google Scholar]
  17. Eigen: A C++ Template Library for Linear Algebra. Available online: Eigen.tuxfamily.org (accessed on 17 November 2022).
  18. Link, R.; Deschamps, C.J. Numerical modeling of startup and shutdown transients in reciprocating compressors. Int. J. Refrig. 2011, 34, 1398–1414. [Google Scholar] [CrossRef]
  19. Bird, G.A. Molecular Gas Dynamics and the Direct Simulation of Gas Flows, 1st ed.; Clarendon Press Publication: Oxford, UK, 1994. [Google Scholar]
  20. REFPROP: NIST Reference Fluid Thermodynamic and Transport Properties Database Version 10. Available online: Nist.gov/srd/refprop (accessed on 17 November 2022).
  21. AIAA. Guide for the Verification and Validation of Computational Fluid Dynamics Simulations; AIAA G-077-1998: Reston, VA, USA, 1998. [Google Scholar]
  22. Roache, P.J. Verification and Validation in Computational Science and Engineering; Hermosa: Albuquerque, NM, USA, 1998; Volume 895. [Google Scholar]
  23. Suefuji, K.; Shiibayashi, M.; Tojo, K. Performance analysis of hermetic scroll compressor. In Proceedings of the International Compressor Engineering Conference at Purdue, West Layette, IN, USA, 14–17 July 1992. [Google Scholar]
  24. Bell, I.H.; Groll, E.A.; Braun, J.E.; Horton, W.T. A computationally efficient hybrid leakage model for positive displacement compressors and expanders. Int. J. Refrig. 2013, 36, 1965–1973. [Google Scholar] [CrossRef]
Figure 1. Leakage in the piston–cylinder clearance: (a) actual flow geometry; (b) solution domain.
Machines 11 00042 g001
Figure 2. Piston eccentric position.
Machines 11 00042 g002
Figure 3. Schematic of the solution procedure.
Machines 11 00042 g003
Figure 4. Knudsen number along the compression cycle for different diametric clearances and LBP condition.
Machines 11 00042 g004
Figure 5. Compressibility factor along the compression cycle for LBP condition.
Machines 11 00042 g005
Figure 6. Representation of the solution domain (piston–cylinder clearance) and its boundaries for the concentric 1D model.
Machines 11 00042 g006
Figure 7. Comparison between results obtained with the 1D model (solid line), Bell et al. [24] correlation (dashed line), Zuk and Smith [2] model and experimental data (markers) reported by Suefuji et al. [23].
Machines 11 00042 g007
Figure 8. Relative instantaneous gas leakage rate for different rotational speeds; c = 5 µm, LBP condition: (a) n = 1800 rpm; (b) n = 5400 rpm.
Machines 11 00042 g008
Figure 9. Gas leakage for different compressor operating conditions.
Machines 11 00042 g009
Figure 10. Prediction of leakage obtained with compressible and incompressible fluid flow formulations for different rotational speeds: (a) c = 5 µm; (b) c = 13 µm.
Machines 11 00042 g010
Figure 11. Reduction due to leakage for different rotational speeds and clearances: (a) volumetric efficiency; and (b) isentropic efficiency.
Machines 11 00042 g011
Figure 12. Solution domain and boundary conditions adopted in the CFD model.
Machines 11 00042 g012
Figure 13. Discretization mesh adopted in the simulation models: (a) 2D model; (b) 3D model.
Machines 11 00042 g013
Figure 14. Comparison between the leakage predicted by the 2D-model Reynolds equation model (black markers) and the leakage calculated by 3D simulations in Fluent (white markers).
Machines 11 00042 g014
Figure 15. Variation of leakage due to piston secondary motion in comparison with the concentric configuration for: (a) case 1, piston symmetrical tilt; (b) case 2, piston radial displacement.
Machines 11 00042 g015
Figure 16. Streamlines of the gas leakage in the clearance plotted over the radial gap field contours.
Machines 11 00042 g016
Figure 17. Geometry used in the piston secondary motion analysis.
Machines 11 00042 g017
Figure 18. Piston dimensionless eccentricity (filled symbol: top, empty symbol: bottom); n = 1800 rpm, LPB condition: (a) different zp/L ratios and c = 9 µm; (b) different clearances and zp/L = 0.56.
Machines 11 00042 g018
Figure 19. Percentage variation of leakage due to piston secondary motion (n = 1800 rpm, LPB condition): (a) different pin positions and c = 9 µm; (b) different clearances and zp/L = 0.56.
Machines 11 00042 g019
Table 1. Comparison between the present predictions and experimental data of Suefuji et al. [23].
h = 3.6 µmh = 9 µmh = 21 µm
Pressure Ratio0.250.410.620.340.570.840.530.660.86
Exp. data [10−6 kg/s]35.89.802.1619447.58.6972237690.5
Prediction [10−6 kg/s]21.57.052.3417247.69.6874937498.3
Δ %−39.9−28.18.3−11.30.211.43.7−0.58.6
Table 2. Compressor operating conditions.
DenominationEvaporating
Temperature
Evaporating PressureCondensing
Temperature
Condensing Pressure
LBP−23.3 °C0.629 bar54.4 °C7.62 bar
MBP−6.7 °C1.23 bar
HBP7.2 °C2.01 bar
Table 3. Values of the parameters used to calculate piston trajectory.
ParameterValue
zCM/L0.442
zP/L0.56
Piston mass19.7 g
Connecting rod mass24 g
CCM/Crod0.7
Piston moment of inertia1460 g mm2
Connecting rod moment of inertia9678 g mm2
n1800 rpm
Oil viscosity (T in Kelvin)exp((A + CT)/(1 + BT)) [Pas]
    A   −14.098
    B   −6.6277 × 10⁻³
    C   6.4476 × 10⁻²
Disclaimer/Publisher’s Note: The statements, opinions and data contained in all publications are solely those of the individual author(s) and contributor(s) and not of MDPI and/or the editor(s). MDPI and/or the editor(s) disclaim responsibility for any injury to people or property resulting from any ideas, methods, instructions or products referred to in the content.

