Article

Optimization of the Bionic Wing Shape of Tidal Turbines Using Multi-Island Genetic Algorithm

1
School of Marine Engineering, Jiangsu Ocean University, Lianyungang 222005, China
2
Makarov College of Marine Engineering, Jiangsu Ocean University, Lianyungang 222005, China
3
College of Shipbuilding Engineering, Harbin Engineering University, Harbin 150006, China
4
National Ocean Technology Center, Tianjin 300112, China
*
Author to whom correspondence should be addressed.
These authors contributed equally to this work.
Machines 2023, 11(1), 43; https://doi.org/10.3390/machines11010043
Submission received: 28 November 2022 / Revised: 21 December 2022 / Accepted: 24 December 2022 / Published: 30 December 2022
(This article belongs to the Section Turbomachinery)

Abstract

:
In this study, we improved the energy acquisition efficiency of tidal turbines with bionic airfoils by optimizing the seagull, long-eared owl, sparrowhawk, and two-dimensional airfoils, thereby obtaining a better lift–drag ratio. We used Isight software to integrate the Integrated Computer Engineering and Manufacturing (ICEM) software and used Fluent simulation software, batch operation file, and multi-island genetic algorithm to maximize the lift–drag ratio as the objective function for optimizing the original airfoil. The optimized upper airfoil profile was distributed upward from the starter wing, and the thickness of the upper wing was the greatest. Meanwhile, the lower airfoil profile was thinner and more curved. The thickness of the three airfoils was distributed backward from the front of the wing, with the maximum thickness at the front, and the maximum camber was distributed backward from the front. The three optimized wings exhibited a maximum lift–drag ratio at an angle of attack of approximately 5°, with the sparrowhawk wing having a maximum lift–drag ratio of 80.87 at an angle of attack of 6°, the seagull wing having a maximum lift–drag ratio of 76.82 at an angle of attack of 4°, and the long-eared owl wing having a maximum lift–drag ratio of 68.43 at an angle of attack of 5°.

1. Introduction

The ocean covers 70% of the earth’s area and has an abundance of energy resources, which have attracted considerable research attention recently [1,2]. A tidal turbine is a device that transforms the kinetic energy of ocean currents into mechanical energy and has less drastic changes in load and provides highly stable power output and low flow interference in the operating flow field [3]. In addition, the hydrodynamic performance of turbine blades is closely related to the airfoil section [4]. The National Renewable Energy Laboratory (NREL) in the US has developed nine different NREL-S airfoils [5]. The Swedish Institute of Aeronautics and Research has been performing studies on airfoils for many years and has developed three airfoil families, namely FFA-W1-XXX, FFA-W2-XXX, and FFA-W3-XXX. The Chinese Academy of Sciences has developed the CAS-W1-XXX airfoil, and the Ocean University of China has developed the OUC-TT-XX airfoil [6,7]. In addition, some studies have developed tidal turbines and wind turbines based on the bionic wing shapes of marine animals and birds. However, directly using a bionic airfoil is not conducive to achieving the optimal performance of the tidal turbine. Therefore, the initial bionic wing shape should be optimized to make it more suitable for the operating conditions of hydraulic turbines. For example, Yuan et al. used the NACA4418 airfoil as the initial airfoil [8]. A parametric model of the airfoil was established through the Jukovsky conformal transformation method. Grasso used the Bezier curve to parametrically fit the airfoil [9], calculated the fitness function using RFOIL software, established a hybrid scheme by combining a genetic algorithm (GA) and a gradient class algorithm to obtain the optimal solution, and finally realized an airfoil with high aerodynamic performance. Wickramasinghe et al. used a particle swarm optimization algorithm to analyze a low-speed airfoil and developed a new fluid evaluation scheme with good optimization results [10]. Timnak and Jahangirian developed an optimized airfoil design using an improved GA [11], which was faster and more effective than the conventional algorithm. Le-Duc and Nguyen combined the computational fluid dynamics (CFD) method with the improved GA to simulate an airfoil under specific conditions [12]. The results and experimental data were analyzed to verify the reliability of the method. Tan et al. fitted a series of NACA airfoils with B spline curves [13], parametrically modeled them, and used a multi-objective genetic algorithm to obtain optimal results.
Liu et al. performed 3D point cloud scanning to analyze the wings of seagulls, mergansers, teal ducks, and long-eared owls and performed inverse reconstruction of the airfoils in different sections [14]. Liao scanned the wings of the long-eared owl and sparrowhawk and established 3D models of their geometric features [15], as well as analyzed the aerodynamic and acoustic characteristics of the two birds. The results indicated that the angle of attack of the long-eared owl airfoil stall increased with the increase in the incoming flow rate. Thus, long-eared owl wings are less prone to boundary layer separation at high speeds. Wang and Liu used a coupling method to design a bionic wing shape with leading and trailing edge serrations based on the long-eared owl wing shape [16]. The results indicated that the bionic coupled airfoil notably reduced the surrounding noise and effectively suppressed the wing–tail separation vortex.
Some studies have applied the profiles of seagulls, sparrowhawks, and long-eared owls to turbines and fan blades and obtained satisfactory results. However, the direct application of the bionic wing type to tidal turbines was not suitable. Thus, these three bionic airfoil types should be optimized to satisfy the tidal turbine design guidelines and for practical operating environments.

2. Bionic Airfoil Modeling

The aerodynamic performance of the wings of a seagull, long-eared owl, and sparrowhawk with a wing shape along 40% of the spreading cross-section is excellent, and the lift–drag ratio is large. Therefore, seagulls, long-eared owls, and sparrowhawks with different flight characteristics were selected as bionic objects in this study. As illustrated in Figure 1, the initial airfoils were realized by modeling the wing shape along 40% of the spreading cross-section of the three bird species.
The equations of the type line functions of the long-eared owl and wing type are as follows [17]:
Y u = Y ( c ) + Y ( t )
Y l = Y ( c ) Y ( t )
where Y u denotes the coordinate of the upper airfoil curve, and Y l denotes the coordinates of curve distribution on the lower surface of the wing. Y ( c ) denotes the coordinates of a mid-arc airfoil. Y ( t ) denotes the relative thickness coordinate of the airfoil. Y ( c ) and Y ( t ) can be expressed as follows:
Y ( c ) c = Y ( c ) max c η ( 1 η ) n = 1 3 S n ( 2 η 1 ) n 1
Y ( t ) c = Y ( t ) max c n = 1 4 A n ( η n + 1 η )
where η = x / c is the dimensionless chord length coordinate, c denotes the chord length, which was considered equal 1 in this study. Y ( c ) m a x denotes the coordinate of the maximum airfoil curvature, and Y ( t ) m a x denotes the coordinate of the maximum airfoil thickness.
Based on the study reported by Liu et al. [14], the fitting relations of the curve and maximum thickness distribution functions of seagull airfoil are as follows:
Y ( c ) max c = 0.14 ( 1 + 1.33 ξ 1.4 )
Y ( t ) max c = 0.1 ( 1 + 3.546 ξ 1.4 )
The fitting relationships of the distribution functions of wing curvature and maximum thickness of the long-eared owl are as follows:
Y ( c ) max c = 0.18 ( 1 + 7.31 ξ 2.77 )
Y ( t ) max c = 0.1 ( 1 + 14.86 ξ 3.52 )
where ξ denotes the airfoil spreading ratio and was assigned a value of 4. In expressions (3) and (4), Sn denotes the polynomial coefficient of the mid-arc in the seagulls’ airfoil, An is the polynomial coefficient of density distribution for the airfoil of the long-eared owl. Table 1 lists the values for Sn and An.
Liu et al. fitted the obtained sparrowhawk wing shape data to the function using MATLAB software [18], and the coordinate function curve of the upper airfoil was expressed as follows:
y u p = 0.0006 x 3 0.0367 x 2 + 1.1094 x + 1.1985
The coordinate function curve of the sparrowhawk’s lower airfoil is as follows:
y l o w = 0.011 x 3 + 0.045 x 2 0.3793 x 1.3623
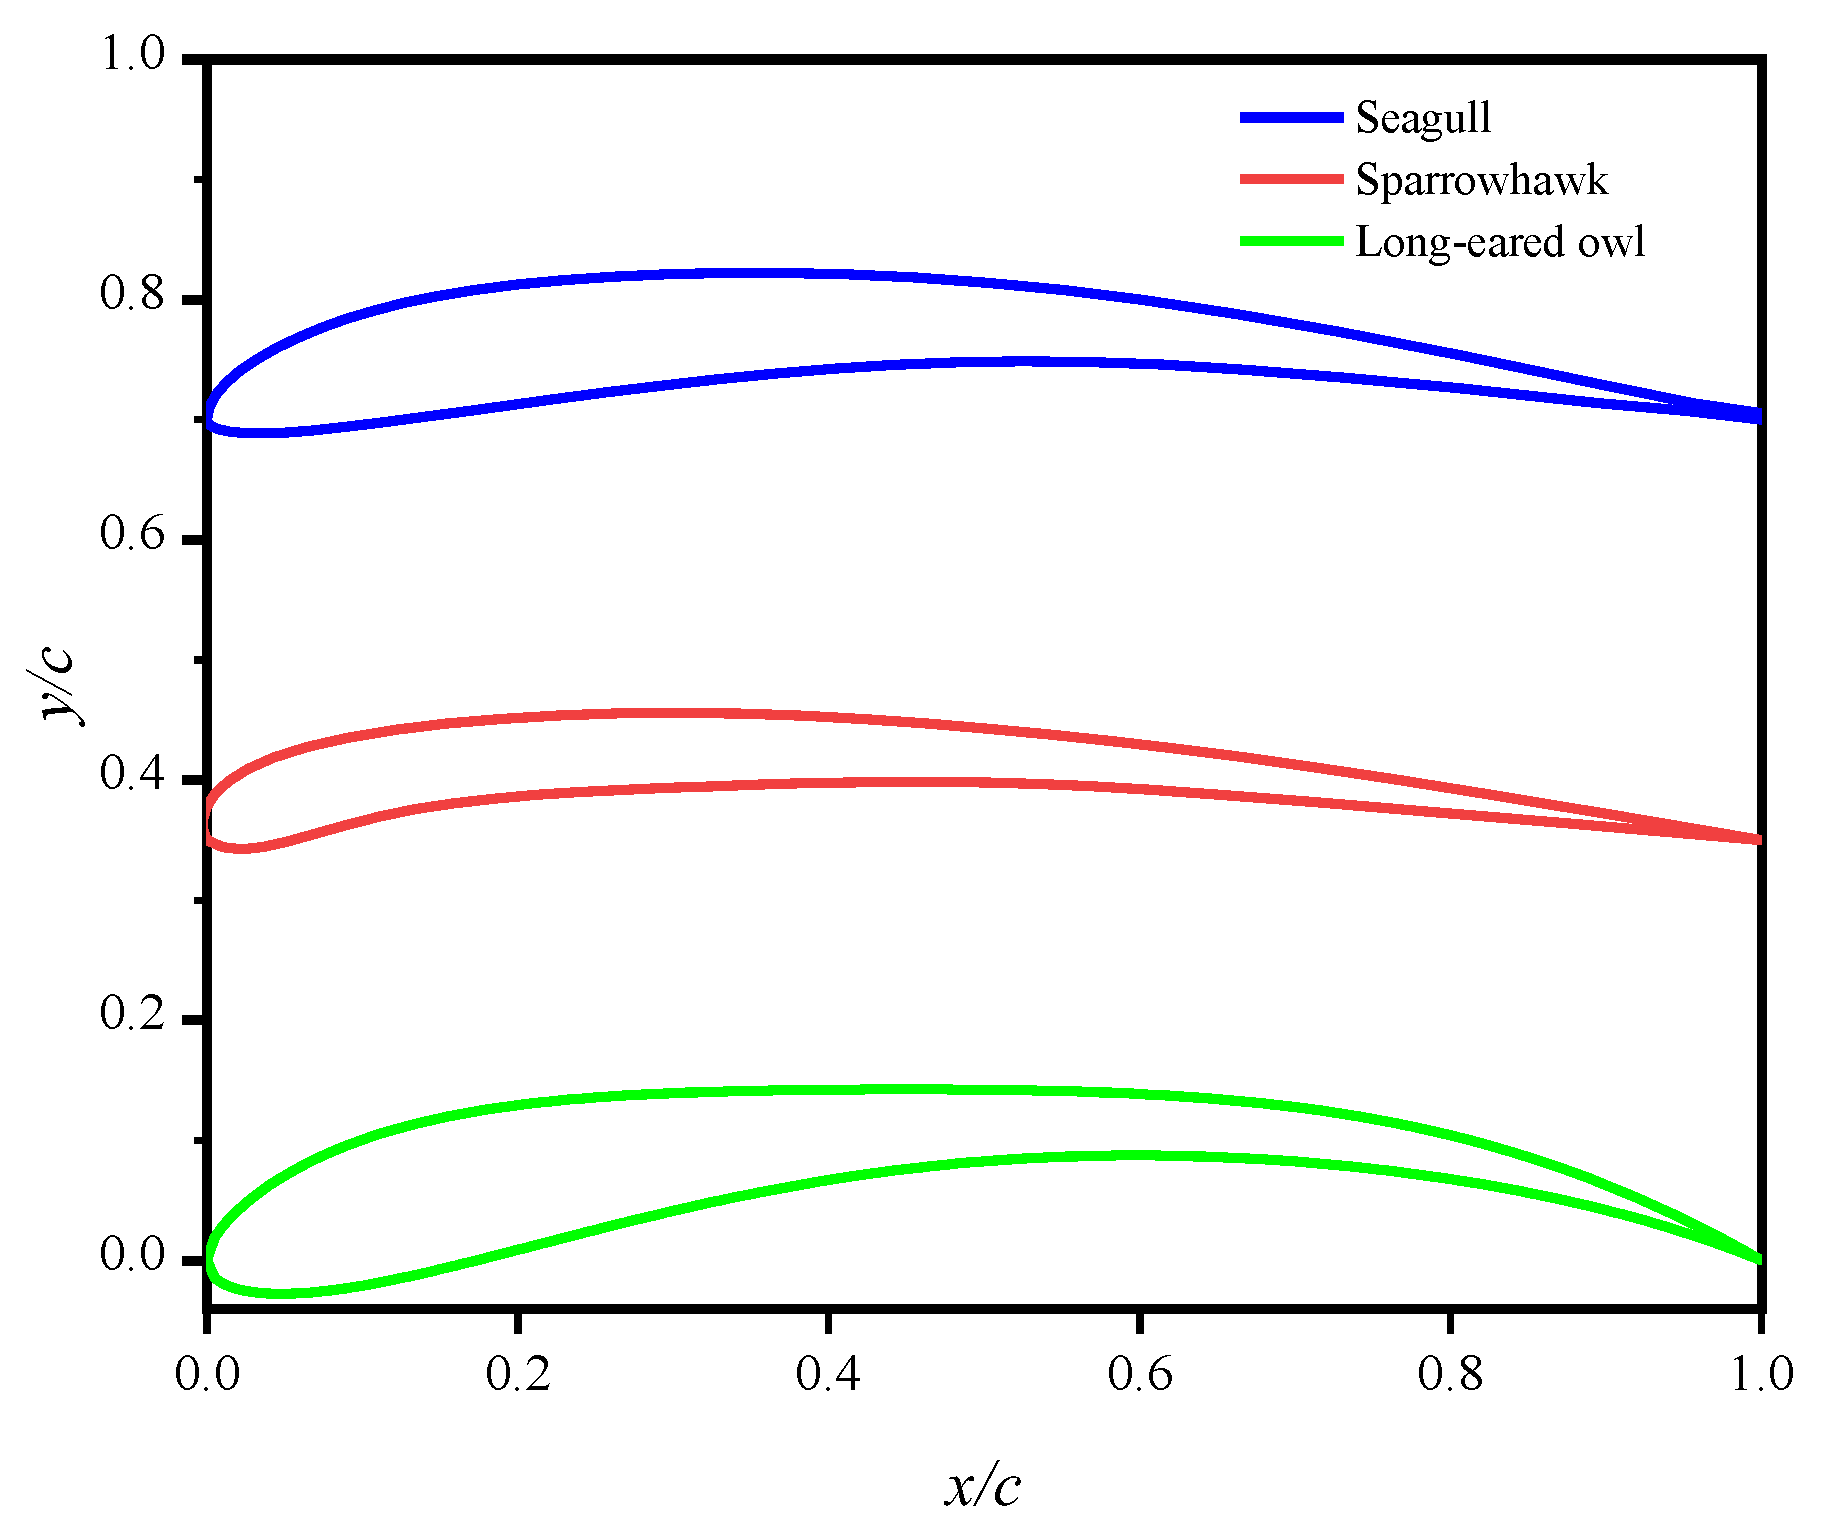
The models of the three bird airfoils were obtained, as displayed in Figure 2.
Some studies have applied the profiles of seagulls, sparrowhawks, and long-eared owls to turbines and fan blades and obtained satisfactory results. Tidal turbine blades typically require 3–5 airfoils for stacking along their tidal spreading direction. Therefore, the airfoils of the seagull, long-eared owl, and sparrowhawk were selected as initial airfoils for optimization. The relative thickness, camber, and trailing edge thickness of the three initial airfoils were different. The parameters of the three airfoils were optimized to achieve the same objectives and compared under the same constraints to determine whether the airfoils were suitable for turbine operating environments. This is further discussed in Section 4.

3. Feasibility Analysis

When the characteristics of the bionic airfoil of birds such as seagulls are applied to wind turbine and aerodynamics research, the dynamic stall effect, incoming flow load, structural strength, and environmental noise should be considered. In a tidal turbine operating environment, the incoming flow velocity is low, the direction is fixed, the torsion angle is small, and stall effects are negligible. Therefore, the lift–drag ratio coefficient, airfoil thickness, and camber are the key parameters of airfoils. Some studies have incorporated the rear edge thickness of the wing into the design to decrease environmental noise during turbine operation. The thrust generated by the rotation of a tidal energy turbine is attributed to airfoil lift, and the Reynolds number has notable influence on two-dimensional airfoil lift and drag coefficient. Furthermore, as reported by Liu et al. [19], Wang et al. [20], Gao et al. [21], and Li et al. [22], the Reynolds number can determine the aerodynamic and hydrodynamic characteristics of the airfoil. For example, when the range of the angle of attack of the airfoil is smaller than the angle of attack of the stall, the drag coefficient of the airfoil decreases and the coefficient of lift increases with increasing the Reynolds number. According to some studies [20,21,22], when the angle of attack is small, the drag coefficient is nearly constant; however, with the progressive increase in the angle of attack, the drag coefficient increases rapidly. The Reynolds number also determines the point in the airfoil where the fluid motion transitions to turbulence. With the increase in the Reynolds number, the transition point from laminar to turbulent flow shifts toward the leading edge of the airfoil. When the boundary layer of the airfoil separates, the pressure drag of the airfoil increases rapidly, thereby resulting in a stall state. This stall state can be prevented in turbine operations by maintaining the angle of attack and increasing the Reynolds number.
The Reynolds number can be expressed as follows:
R e = ρ U c μ
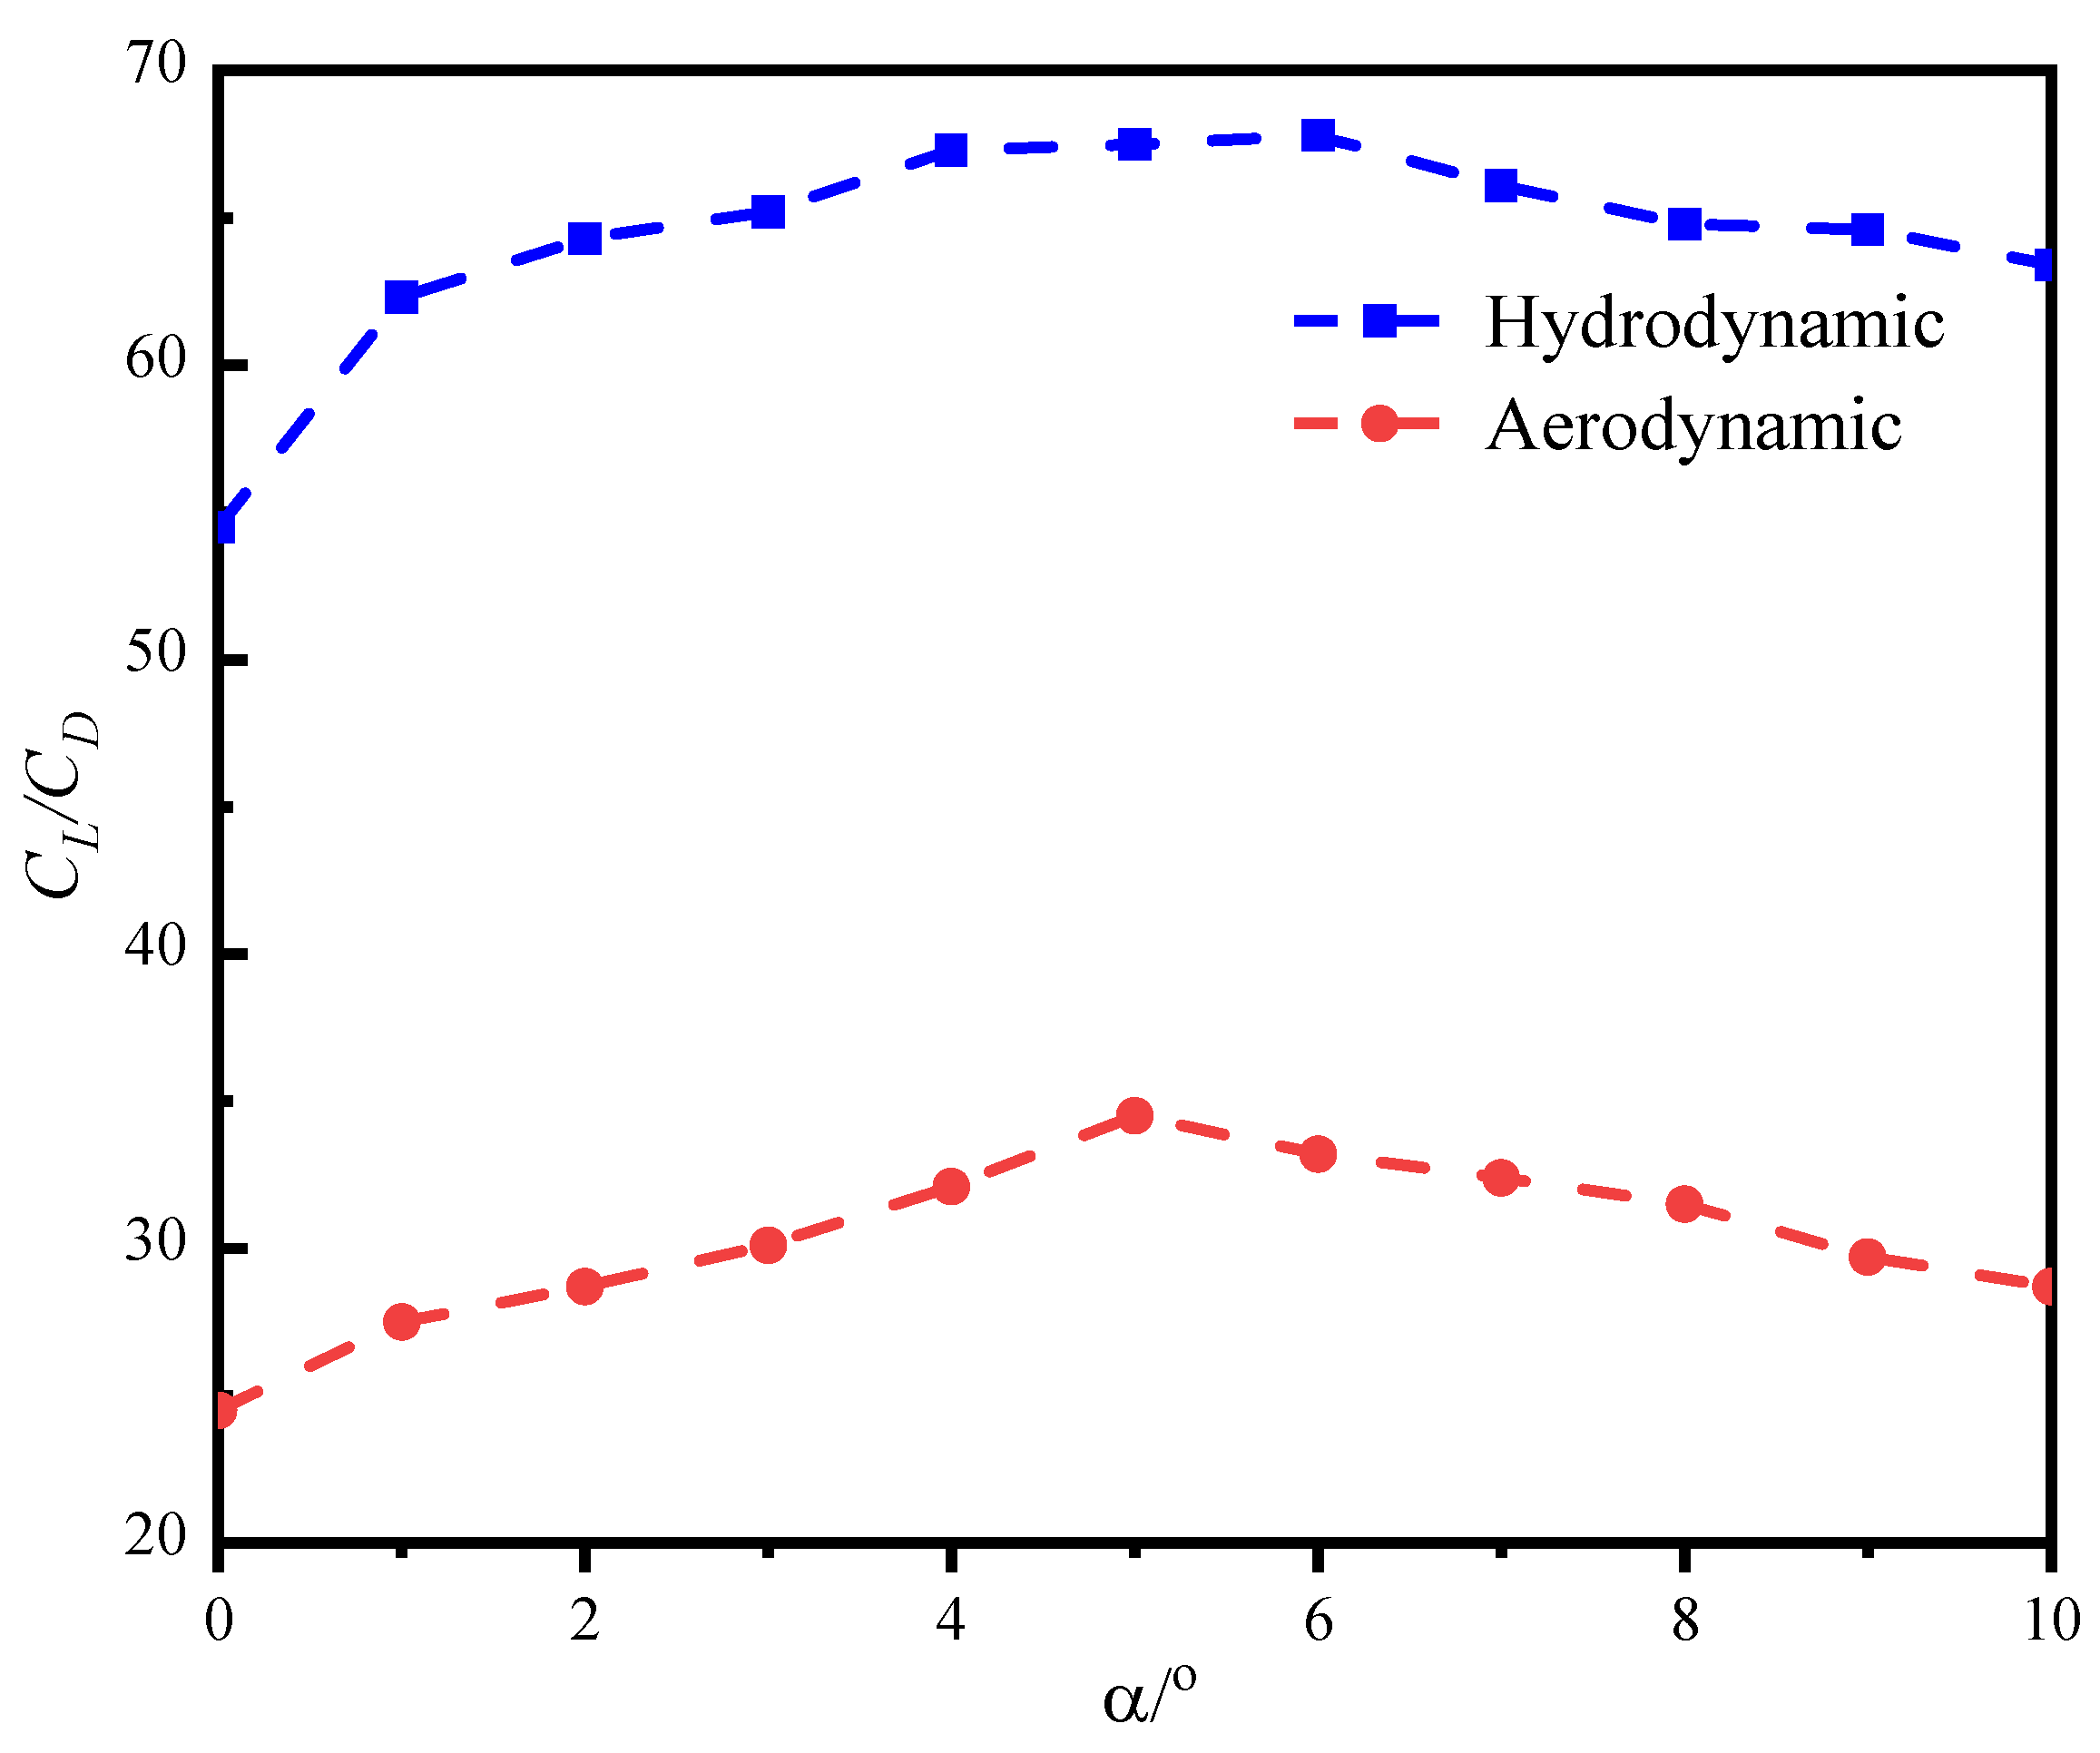
where ρ denotes density, μ denotes the dynamic viscosity factor, U denotes velocity, and c denotes the characteristic length of the streaming field. The densities of water and air are 998 and 1.225 kg/m3, respectively. The aerodynamic viscosity and hydrodynamic viscosity are 0.000018 and 0.00103   Pa s , respectively. For numerical calculations, the incoming flow velocity and characteristic length were considered equal to 1.5 m/s and 1 m, respectively. From the above-given conditions, it can be calculated that the Reynolds number in hydrodynamics is 1.45 × 10⁶ and in aerodynamics is 1.02 × 10⁵. It is clear that the Reynolds number in hydrodynamics is greater than the Reynolds number in aerodynamics. Moreover, the more significant Reynolds number can slow down the airfoil stall effect, thus making the turbine gain energy more stable. The airfoil lift–drag ratio was determined using an SST turbulence model, where the value of y+ was considered equal to 1. The thickness of the first grid layer was 0.0002 m. For hydrodynamic calculations, we used the standard turbulence model. The thickness of the first mesh level was 0.0005 m. In the mesh, the value of y+ was 30. According to the results of numerical simulations, a two-dimensional initial seagull airfoil had a larger lift–drag ratio in the current than in the sky (Figure 3). In Figure 3, α denotes the angle of attack, C L denotes the lift coefficient, C D denotes the drag coefficient, and C L / C D denotes the lift–drag ratio.
The following section of this paper discusses the goal binding of the three bird bionic airfoils to optimize the results for consistency with those under practical turbine operating conditions.

4. Multi-Island Genetic Algorithm

4.1. Introduction to Multi-Island Genetic Algorithm

In 1975, Hayes-Roth proposed the GA [23]—a computational model—to simulate the evolution of organisms based on Darwinian theory of natural selection and genetics. Subsequently, Goldberg assessed the performance of the algorithm [24], summarized the theoretical basis and research results of the GA, and explored the application of the GA to various fields.
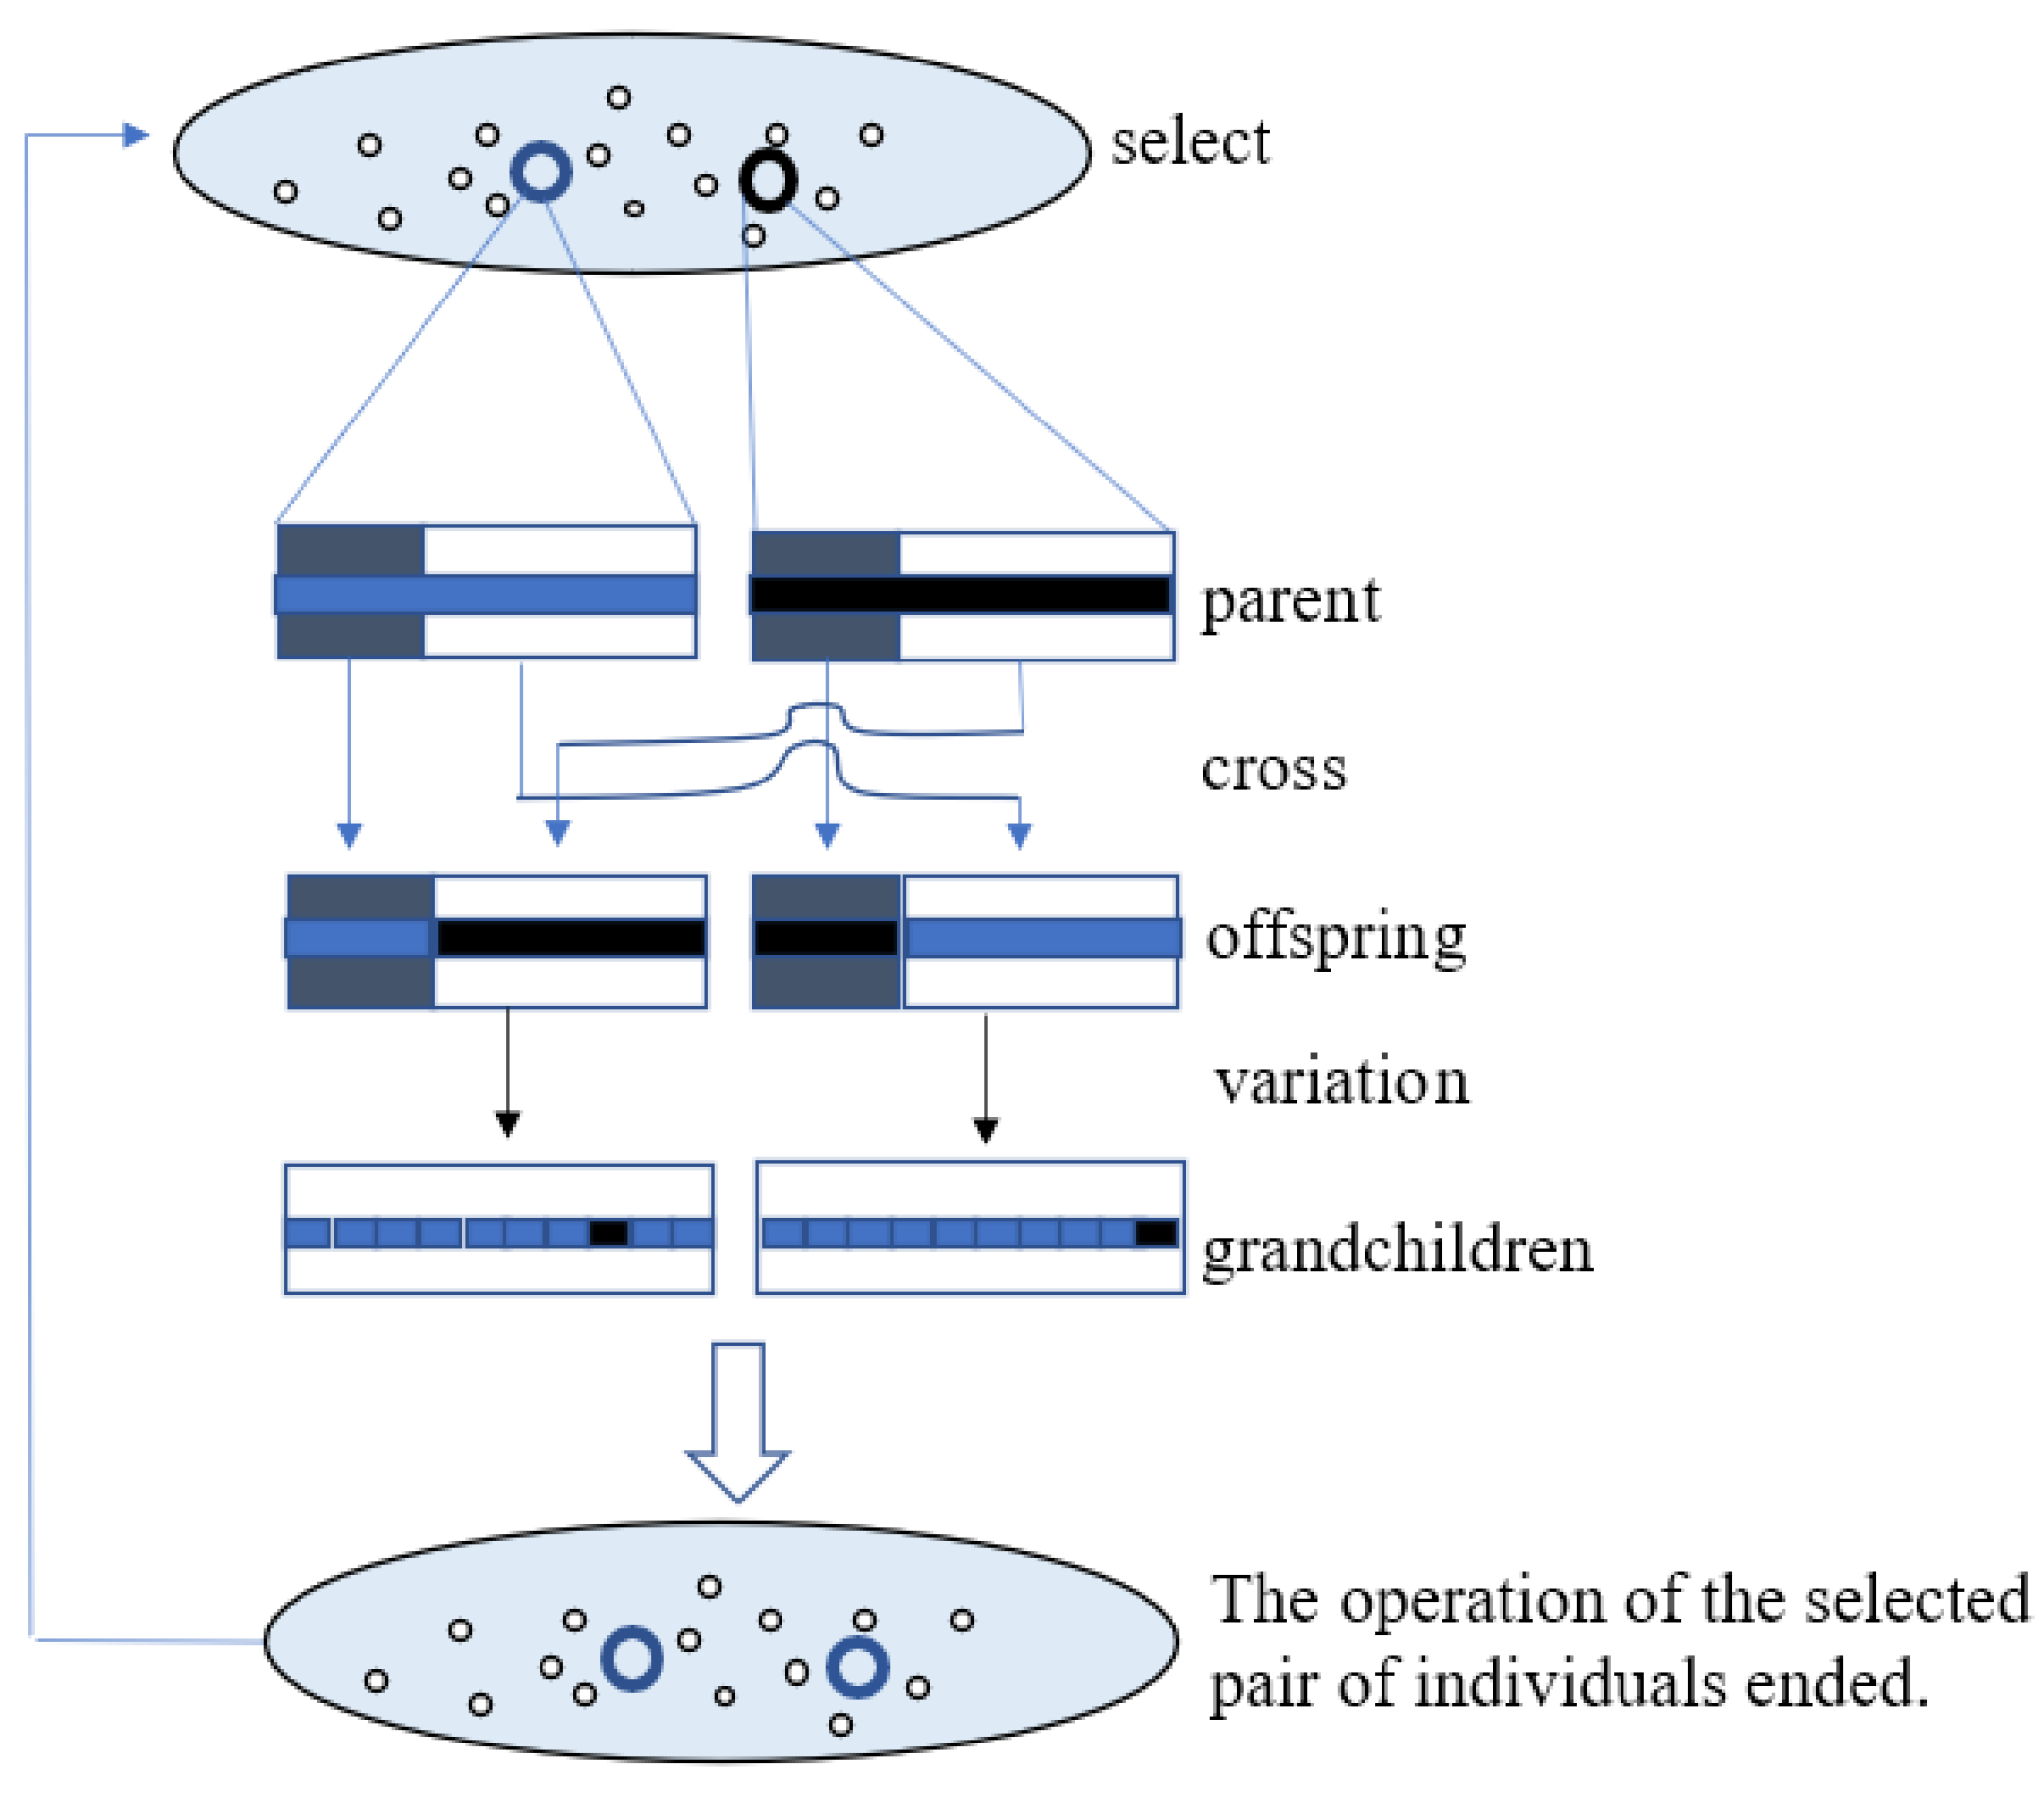
The multi-island genetic algorithm (MIGA) is an improved parallel distributed GA proposed by Miura et al. [25]. The GA does not use external information for evolutionary search but uses a fitness function to search for superiority within a population. As illustrated in Figure 4, the MIGA divides the population into several isolated and independently evolving subpopulations on different islands. The populations in the islands are migrated, and information is exchanged to maintain population diversity and suppress premature maturation. As a pseudo-parallel genetic algorithm, the MIGA is highly effective for determining the optimal global solution for a sample. Compared with conventional GA, MIGA has better global solving ability and higher computational efficiency. Therefore, we used a MIGA for optimization.
MIGA repeatedly uses operators for selection to reproduce from parents to offspring to grandchildren to great grandchildren, thereby increasing the population’s adaptability to the environment.
The algorithm uses the following procedure:
Step 1: The population is initialized;
Step 2: The fitness function of the individuals is calculated;
Step 3: Individuals for the next generation are selected according to a rule determined by their fitness values;
Step 4: Crossover operation is performed with probability Pc;
Step 5: Mutation operation is performed with probability Pm;
Step 6: If the stopping condition is not satisfied, Step 2 is repeated; otherwise, Step 7 is performed;
Step 7: The chromosome with the best fitness value in the population is outputted as the satisfactory or optimal solution to the problem.
The flow of the MIGA is illustrated in Figure 5.
A GA is an global adaption probability optimization search algorithm that simulates the genetic and evolutionary process of organisms in their natural surroundings. The basic idea of a multi-objective problem is to obtain a group of optimal solution sets under the condition that all constraints and individual objective functions are satisfied. In Isight software, 10 parameters can be adjusted for the MIGA. Three basic condition parameters and the seven other advanced condition parameters are configured as displayed in Table 2.

4.2. Optimization Objectives

The structural characteristics of a tidal turbine blade tip (blade spreading to 70–100% position) airfoil are not sufficiently investigated. Airfoils are typically designed thin, and the maximum relative thickness does not exceed 15%. In terms of hydrodynamic characteristics, blade tip airfoil has a high lift coefficient, high maximum lift–drag ratio, satisfactory stall characteristics, and low noise and other characteristics. The blade root (blade spreading to 0–30% position) airfoil requires excellent structural characteristics and airfoil thickness, and the maximum relative thickness is typically greater than 28%; the hydrodynamic characteristics requires has a high maximum lift coefficient of the blade root airfoil. In the middle of the blade airfoil (blade spreading to 30–70% position), the maximum relative thickness is typically within 21–28%, thus requiring high geometric compatibility.
The design objective is to obtain an optimal solution for the angle of attack at which the initial airfoil achieves the maximum lift–drag ratio and the maximum lift coefficient. The maximum lift–drag ratio of the profile at the designed angle of attack is used as an objective function:
f ( x ) = max ( C L C D )
where C L is the profile lift coefficient; C D is the profile drag coefficient. The maximum lift coefficient of the profile at the design angle of attack is also used as an objective function:
f 1 ( X ) = max ( C L )
In multi-objective optimization, the objectives occasionally conflict with each other. Therefore, other factors should be constrained while satisfying the optimization objectives. When the lift–drag ratio is optimal at the designed angle of attack, the lift coefficient should also be constrained to a value no less than the lift coefficient of the initial profile, (i.e., C L C L ( 0 ) ). Similarly, when the lift coefficient is maximized at the designed angle of attack, the lift–drag ratio should be no less than the lift–drag ratio of the initial profile (i.e., C L / C D C L ( 0 ) / C D ( 0 ) ). The bionic airfoil has a maximum lift coefficient at approximately 15° and a maximum lift–drag ratio at approximately 5°. Therefore, the lift coefficient at 15° and the maximum lift–drag ratio at 5° are selected as the optimization objectives.
(1)
Plankton in seawater and seabed particles have considerable influence on turbine blades and high destructive abilities. To satisfy the blade structure and stiffness requirements, its relative thickness should be large.
(2)
For turbine blades, satisfying structural requirements is assigned the highest priority. Therefore, the torque coefficient requirement is not a key factor that influences the turbine airfoil optimization process.
(3)
The direction and velocity of water flow in the turbine operation is bound by certain constraints. Therefore, fatigue is not considered a key factor that influences the tidal energy of the turbine airfoil.

4.3. Constraints

The maximum relative thickness of the initial bionic airfoil is denoted by h 0 . To prevent excessive changes in the geometry of the airfoil after optimization, the relative thickness is set to h 1 . The following constraints can be applied [13]:
t c = h 0
3 % h 1 h 0 h 0 8 %
where t denotes the maximum thickness of the initial wing type.
The maximum thickness of the seagull, sparrowhawk, and long-eared owl airfoils is observed at 10–20% of the chord length from the front edge. To prevent excessive changes in the airfoil geometry after optimization, the following constraint function can be applied:
10 % h t c 20 %
where h t denotes the distance from the position of maximum thickness of the bionic airfoil to the leading edge.
For a two-dimensional airfoil, camber is related not only to the lift–drag ratio of the wing but also to the structural strength of the airfoil. The lift–drag ratio coefficient of the airfoil can be increased by appropriately increasing the curvature. However, an excessively long curvature affects the structural strength of the airfoil. Finally, the similarity between the optimized rear wing and the initial wing should be considered. Therefore, the above three factors can be combined to set constraints [26]:
6 % w c 12 %
where w denotes the camber airfoil.
The maximum lift–drag ratio of the airfoil of the tidal turbine should be increased by appropriately shifting the bend position to the backward edge. The following constraints are applied while ensuring geometric similarity [27,28]:
30 % w f c 50 %
where w f denotes the distance between the bend position and the leading edge of the airfoil.
Considering the strength requirements of the tidal turbine profile airfoil and ensuring geometric similarity, the cross-sectional area can be constrained as follows:
| S S 0 | S 0 8 %
where S denotes the cross-sectional area of the optimized airfoil;   S 0 denotes the cross-sectional area of the unoptimized wing.
The trailing edge of the airfoil is the primary source of noise, which increases with the thickness of the trailing edge. Therefore, the trailing edge should be constrained as follows:
y u , 0.99 y l , 0.99 0.01
where y u , 0.99 and y l , 0.99 denote the y-coordinates of the upper and lower airfoil at the chord length position when the default chord length is 1. However, when the airfoil section was reconstructed in this study, the trailing edge thickness satisfied the design requirements. Therefore, the trailing edge thickness was not constrained.

5. Overall Step Design

Before airfoil optimization, a case was calculated to obtain a script file for ICEM meshing, a log file for Fluent simulation for ICEM grid generation, and a log file for Fluent simulation to prepare for subsequent batch processing. When calculating the cases, an appropriate number of iterative steps was determined to prevent exceedingly few iterative steps from failing to satisfy convergence requirements and to prevent an excessive number of iterative steps that waste calculation time.

5.1. Preoperation

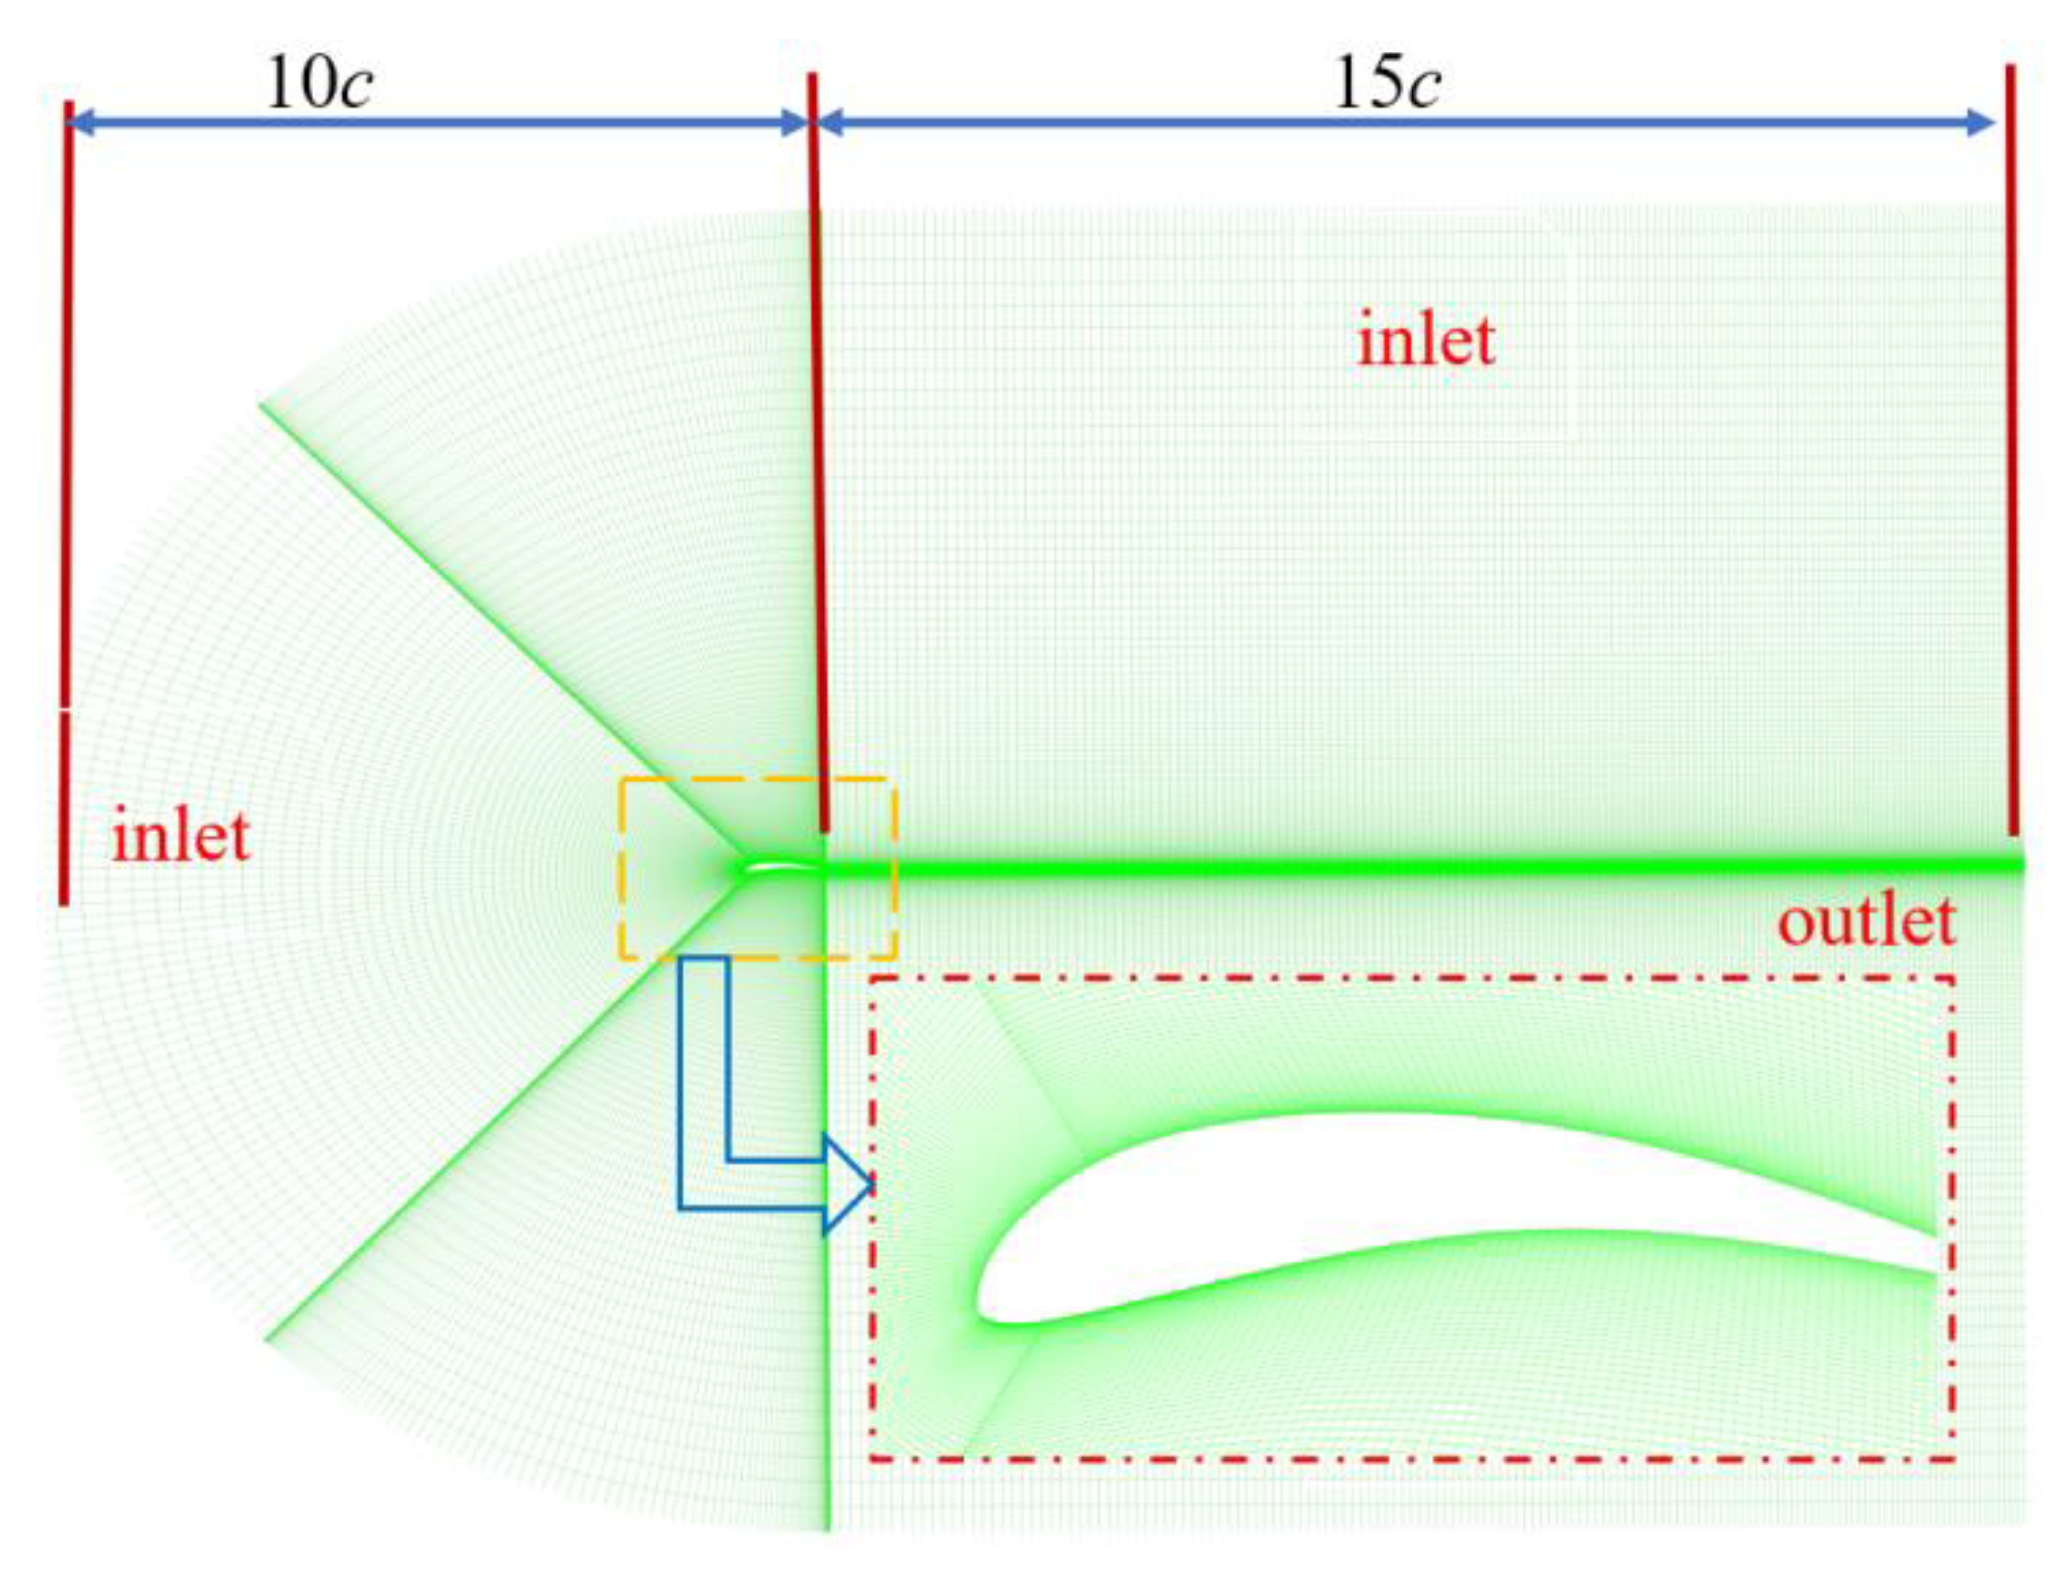
Considering the lower airfoil point of the trailing edge of the seagull airfoil shape as the origin, the distance between the upper and lower sides was set to 10 times the chord length, and the distance between the front and the back was set to 15 times the chord length, as displayed in Figure 6. In front of the airfoil, the upper and lower boundaries were the velocity inlet boundary, the back of the airfoil was set as the pressure outlet boundary, and the airfoil was set as the no-slip wall surface. The velocity inlet boundary of the water flow was 1.5 m/s, and the incoming flow was incompressible. A standard k ε two-equation model was used as the turbulence model [29,30]. Pressure was obtained using a SIMPLE algorithm and momentum discrete term solution in the second-order windward format. After 800 computational iterations, the results converged, and the lift–drag coefficients of the airfoil did not change further.

5.2. Operation Process

Before the optimization of the airfoil, the obtained airfoil data were used to establish a parametric model. The parametric class function/shape function transformation (CST) method is based on the combination of the airfoil type function and shape function [31,32]. The method involves using a class function to determine the type of the airfoil, and a determined shape function was used to represent the specific airfoil. The initial bionic airfoil data points were saved in a “.dat” file, and an 8th-order CST parametric method was selected to fit the initial airfoil.
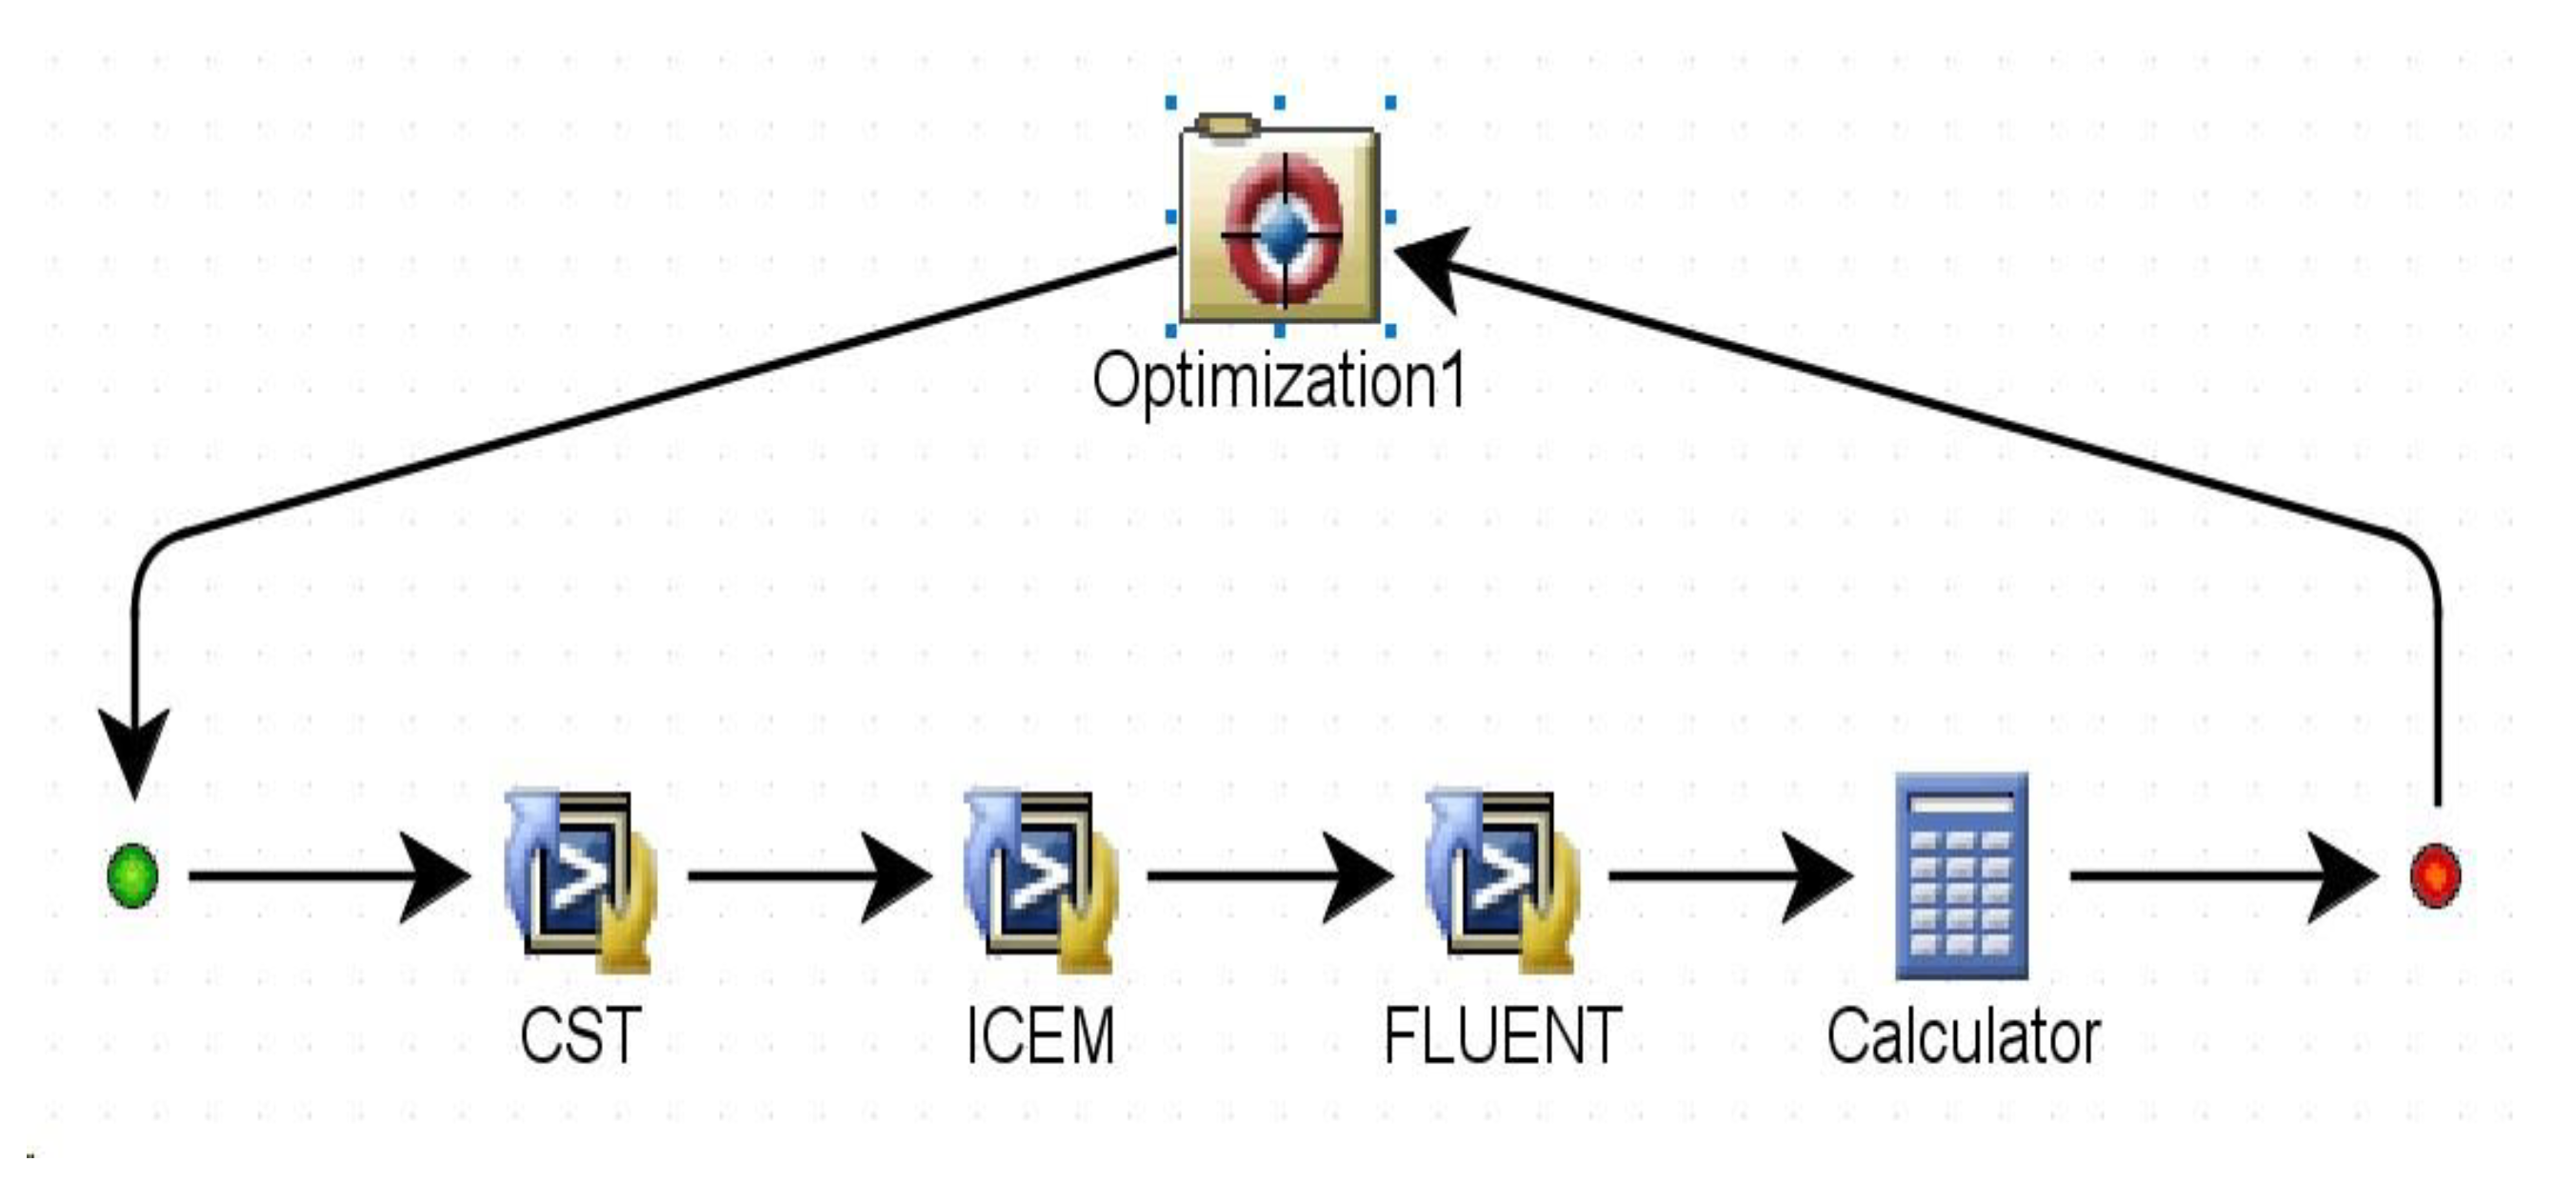
The airfoil developed using the airfoil parameterized module CST was incorporated into the ICEM module to achieve structured grids. After division, the mesh was incorporated into the Fluent module for obtaining the results. The objective parameters were then outputted from the calculation function block. Then, the MIGA was applied to the optimization module. Consequently, the numerical modeling data were post-processed. Thereafter, the lift–drag ratio, pressure, and velocity were varied and the aforementioned operations were repeated until the optimal solution was obtained, as illustrated in Figure 7. The operation process is depicted in Figure 8.

6. Results

6.1. Comparison of Wing Shape before and after Optimization

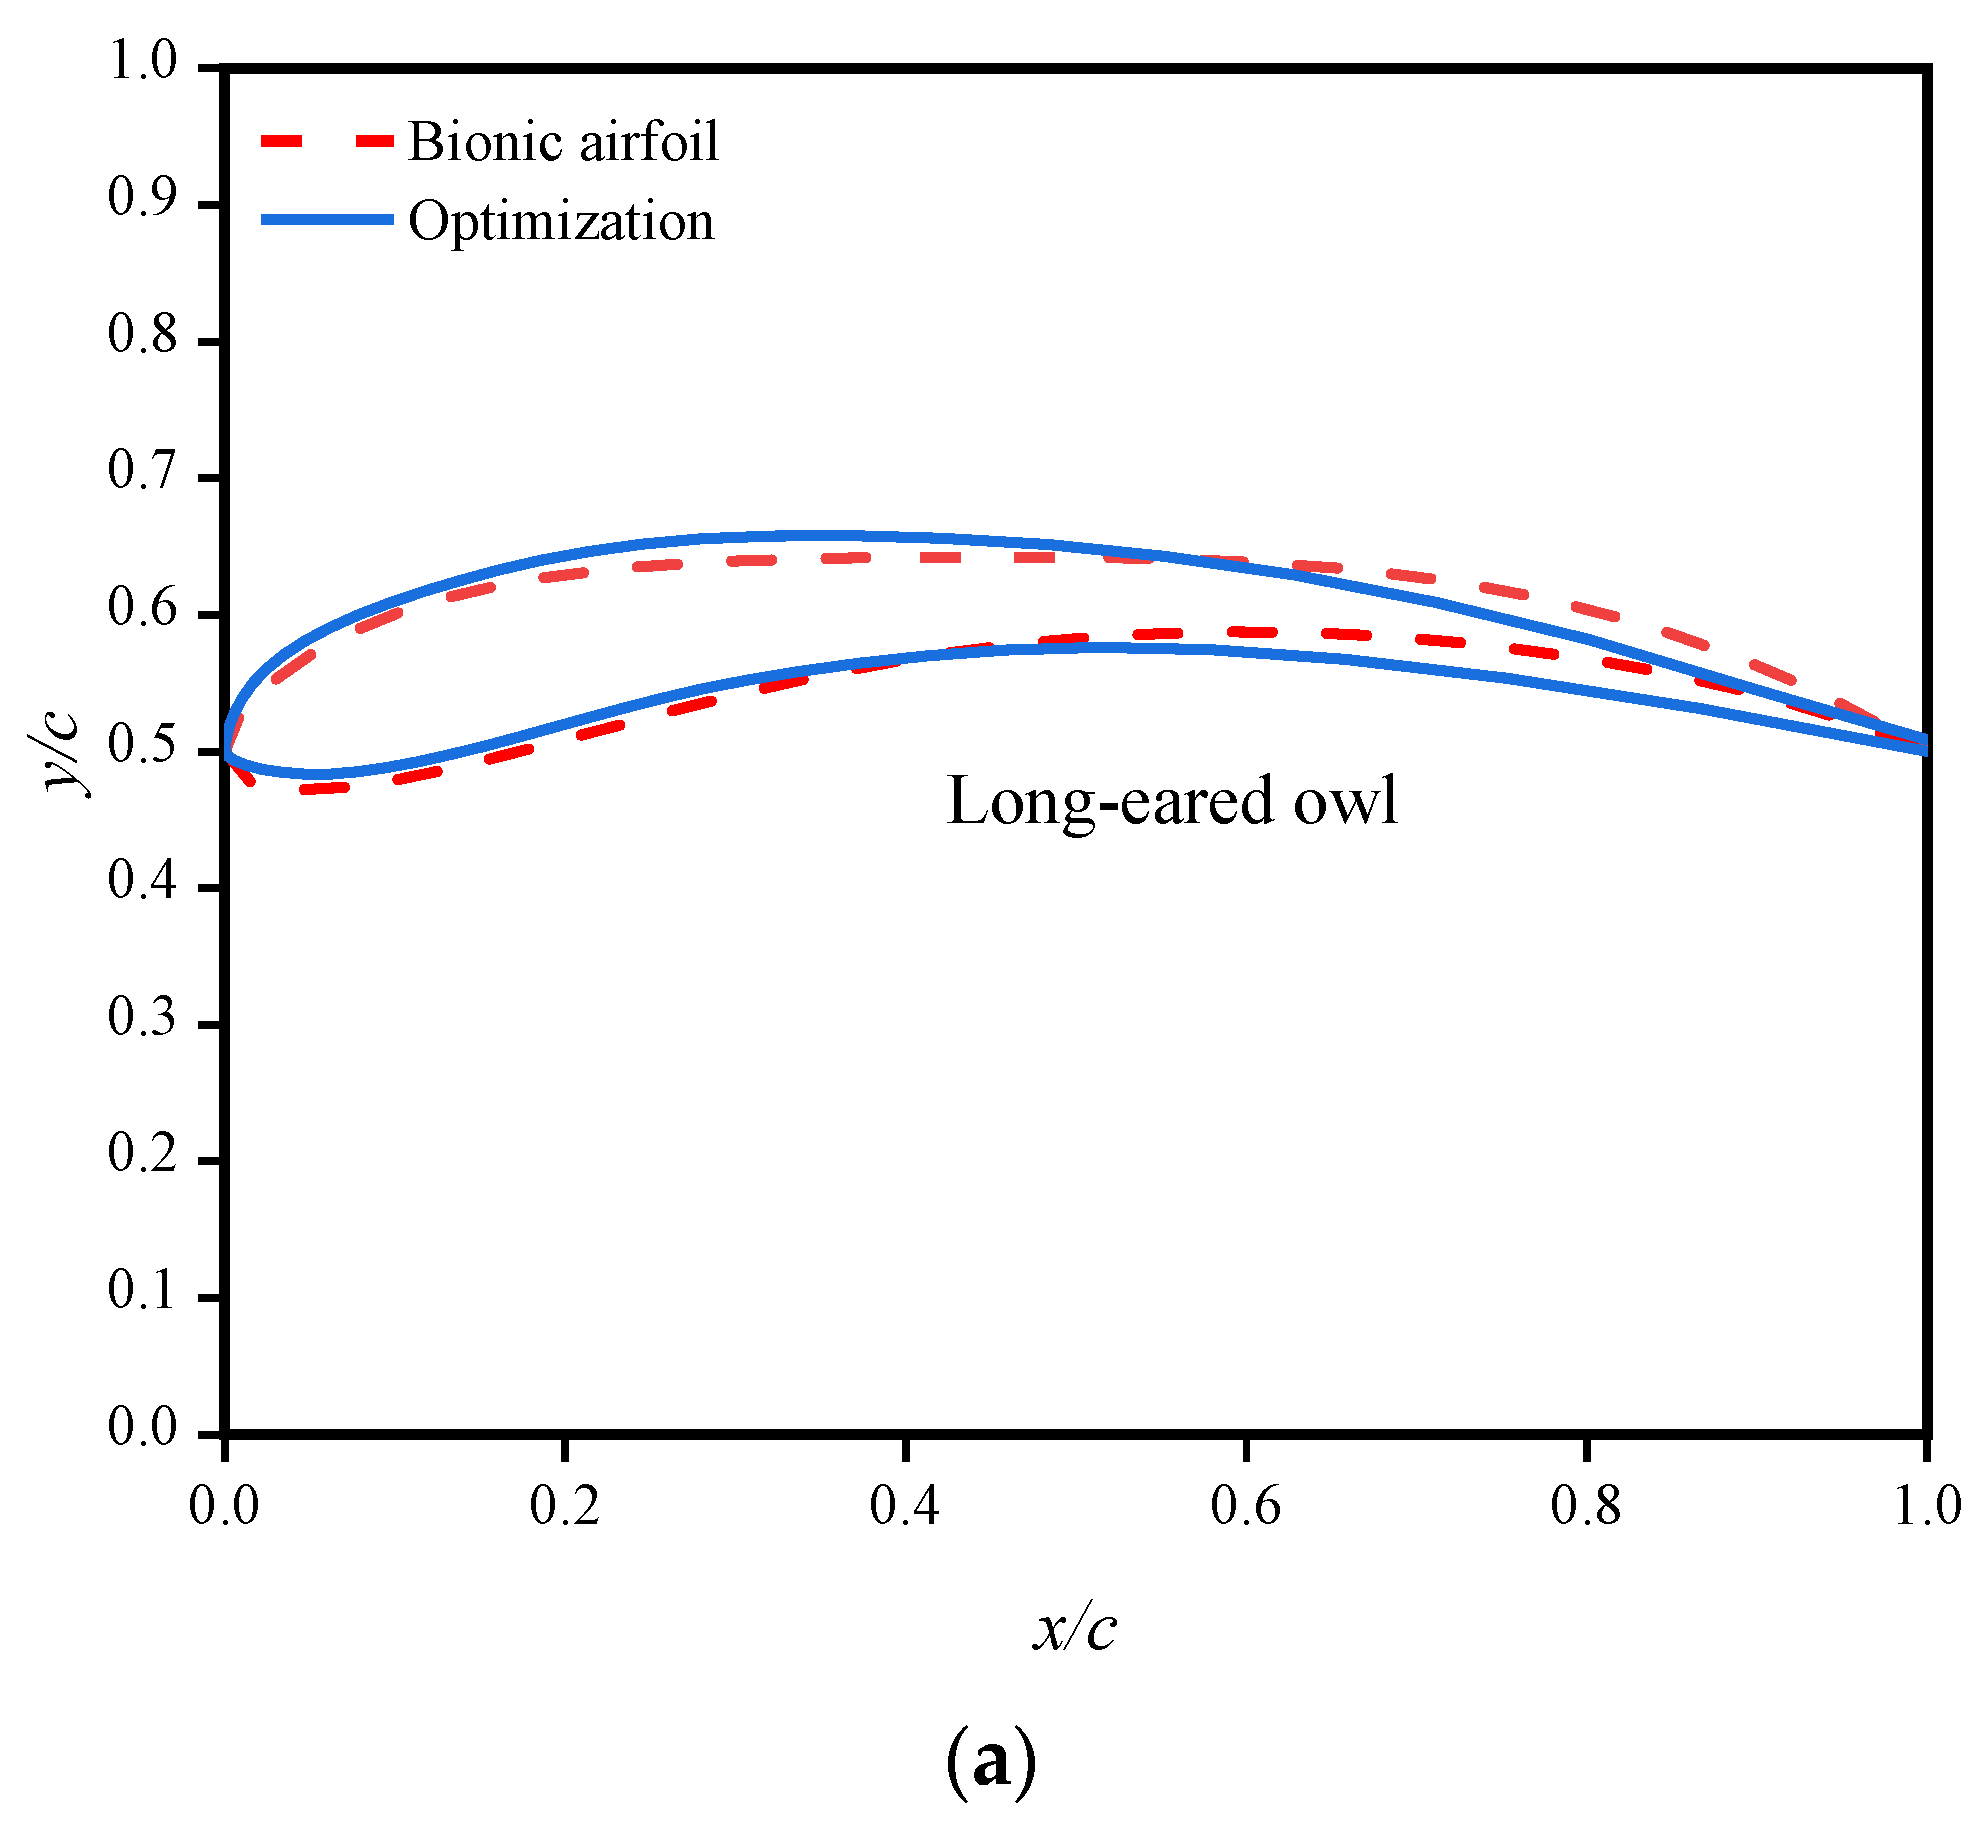
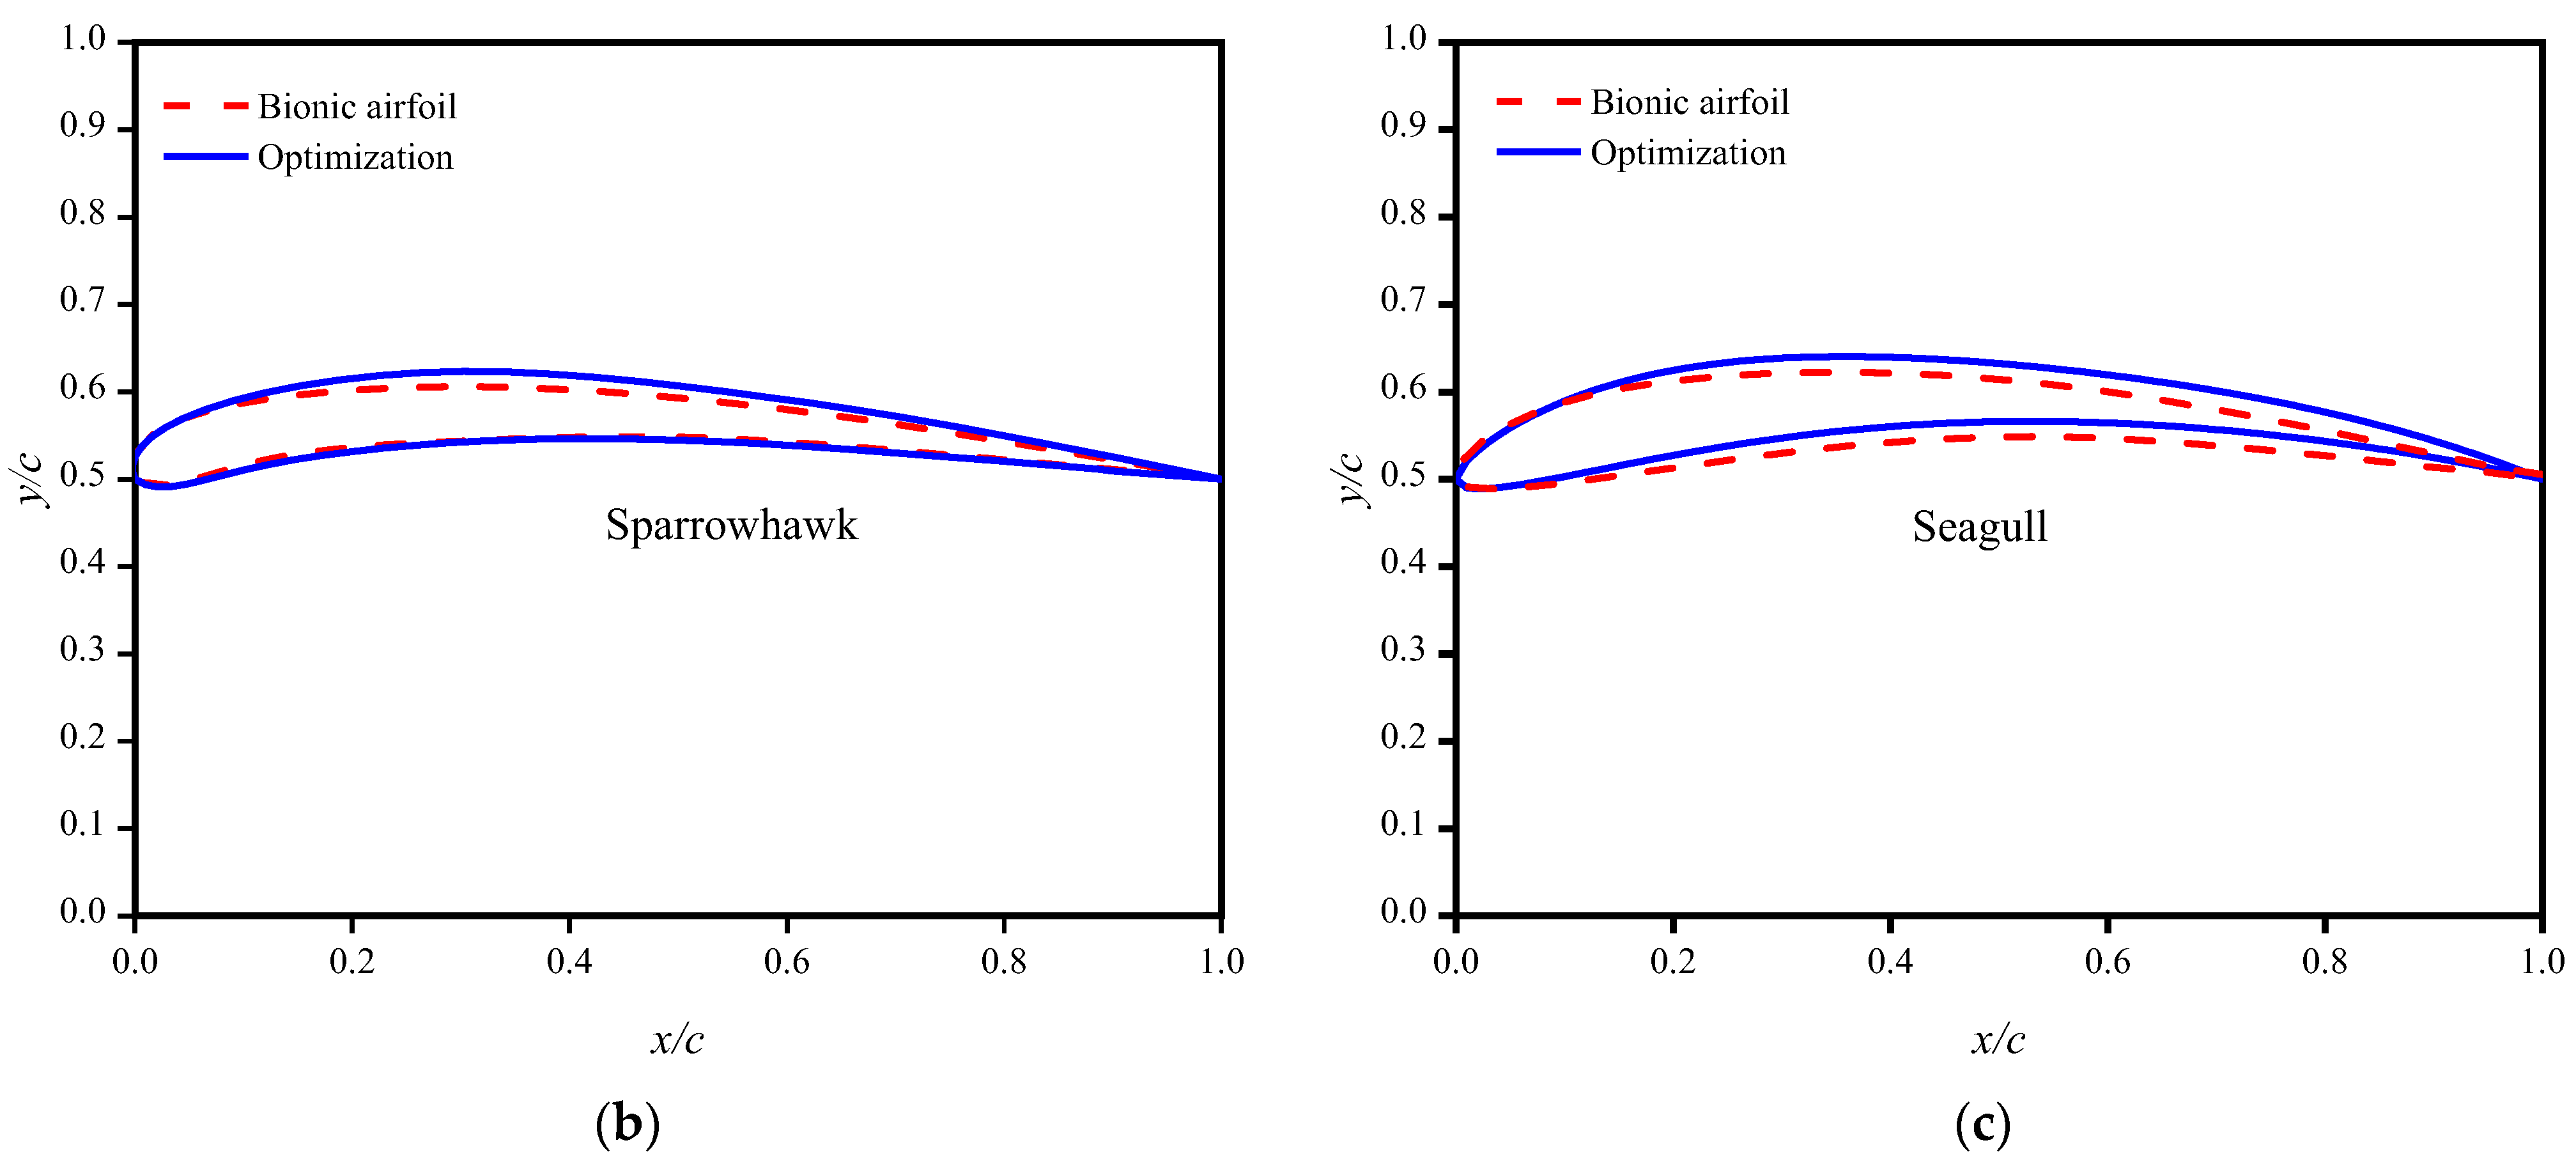
Figure 9 illustrates comparisons of the initial and optimized wing shapes of the three birds, namely long-eared owl, sparrowhawk, and seagull. The shape of the leading edge of the optimized wing shape was approximately the same as the initial wing shape. By contrast, the shape of the trailing edge changed more notably in the long-eared owl and gull. Relative to the initial airfoil, the curve of the upper surface of the optimized airfoil shifted upward, and the overall thickness of the upper airfoil increased. Meanwhile, the thickness of the lower airfoil profile curve decreased, and the overall curvature increased. According to the data in Table 3, the maximum thickness of the optimized three airfoils shifted back from the leading edge of the airfoil. Furthermore, the maximum curvature position also shifted back from the leading edge of the airfoil.

6.2. Comparison of Simulation Results

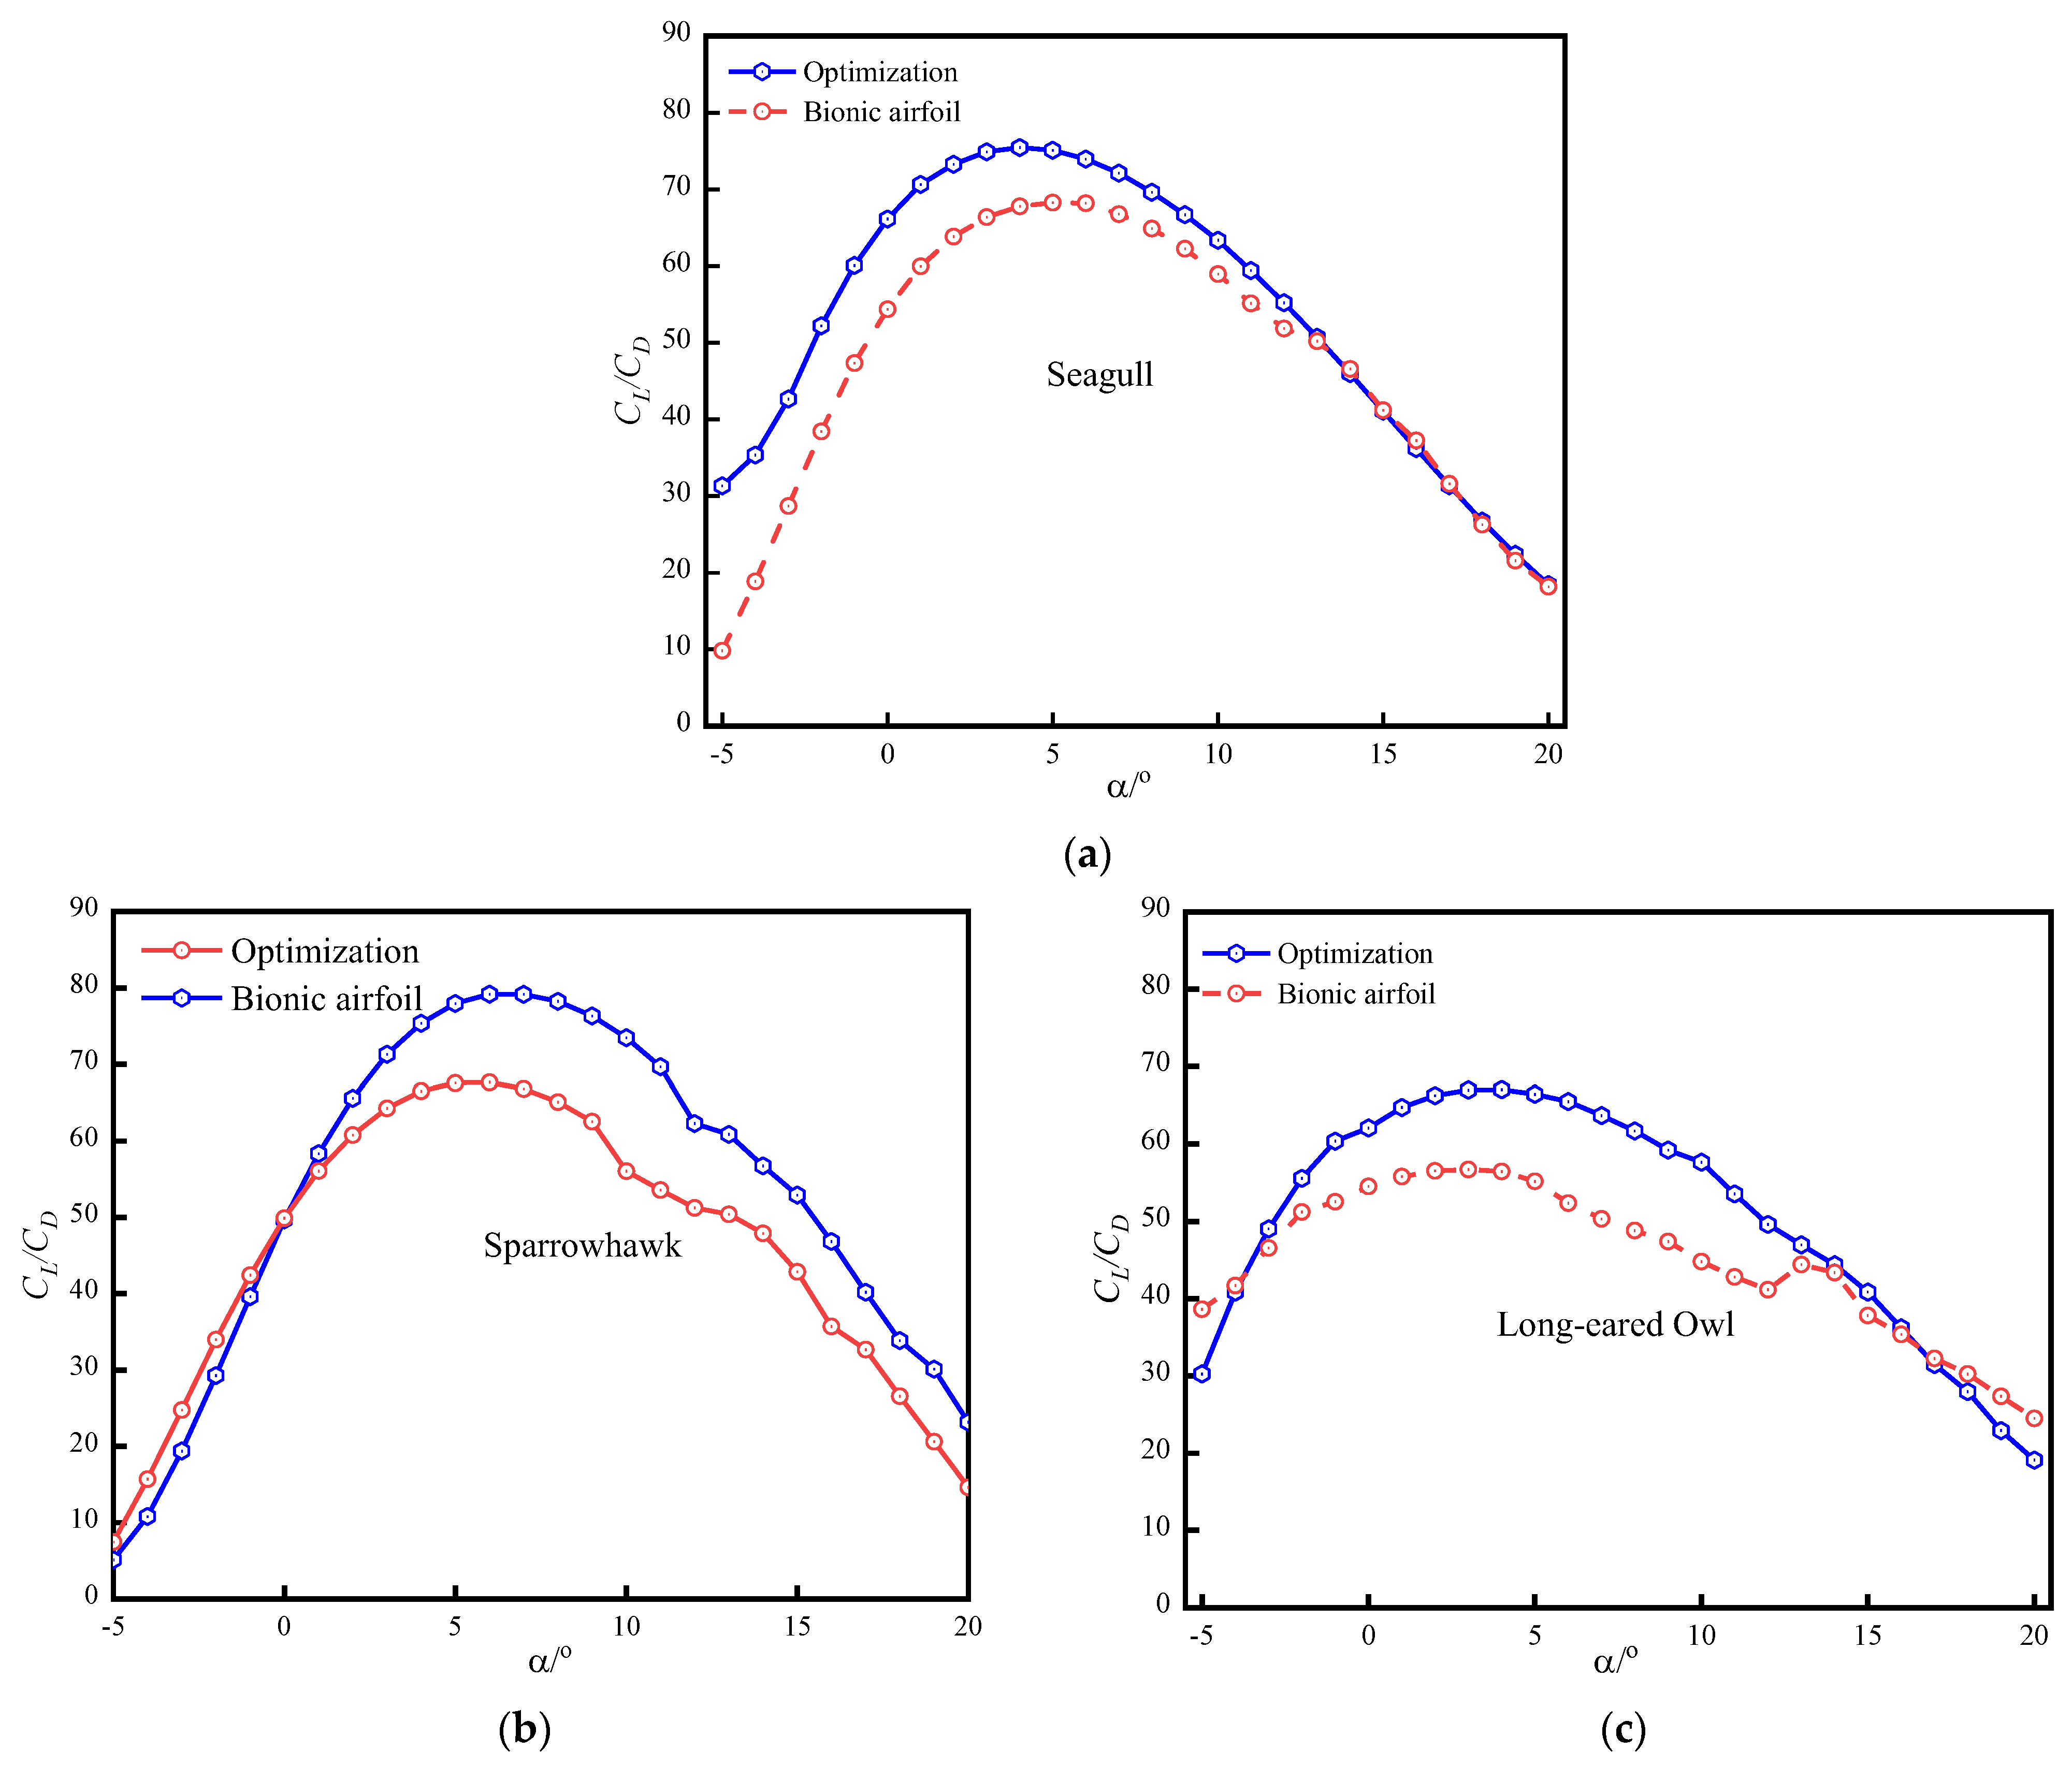
As illustrated in Figure 10, the lift–drag coefficient of the optimized airfoil increased compared with that of the initial airfoil. The three optimized airfoils had the maximum lift–drag ratio at an angle of attack of approximately 5°. The maximum lift-to-drag ratio was 80.87 at an angle of attack of 6° for the sparrowhawk, 76.82 at an angle of attack of 4° for the seagull, and 68.43 at an angle of attack of 5° for the long-eared owl. Therefore, when the optimized airfoil was applied to the tidal turbine, the angle of attack of the turbine blade was controlled within a range of approximately 5° according to the incoming flow direction, and the performance of the turbine blade was better in this state.
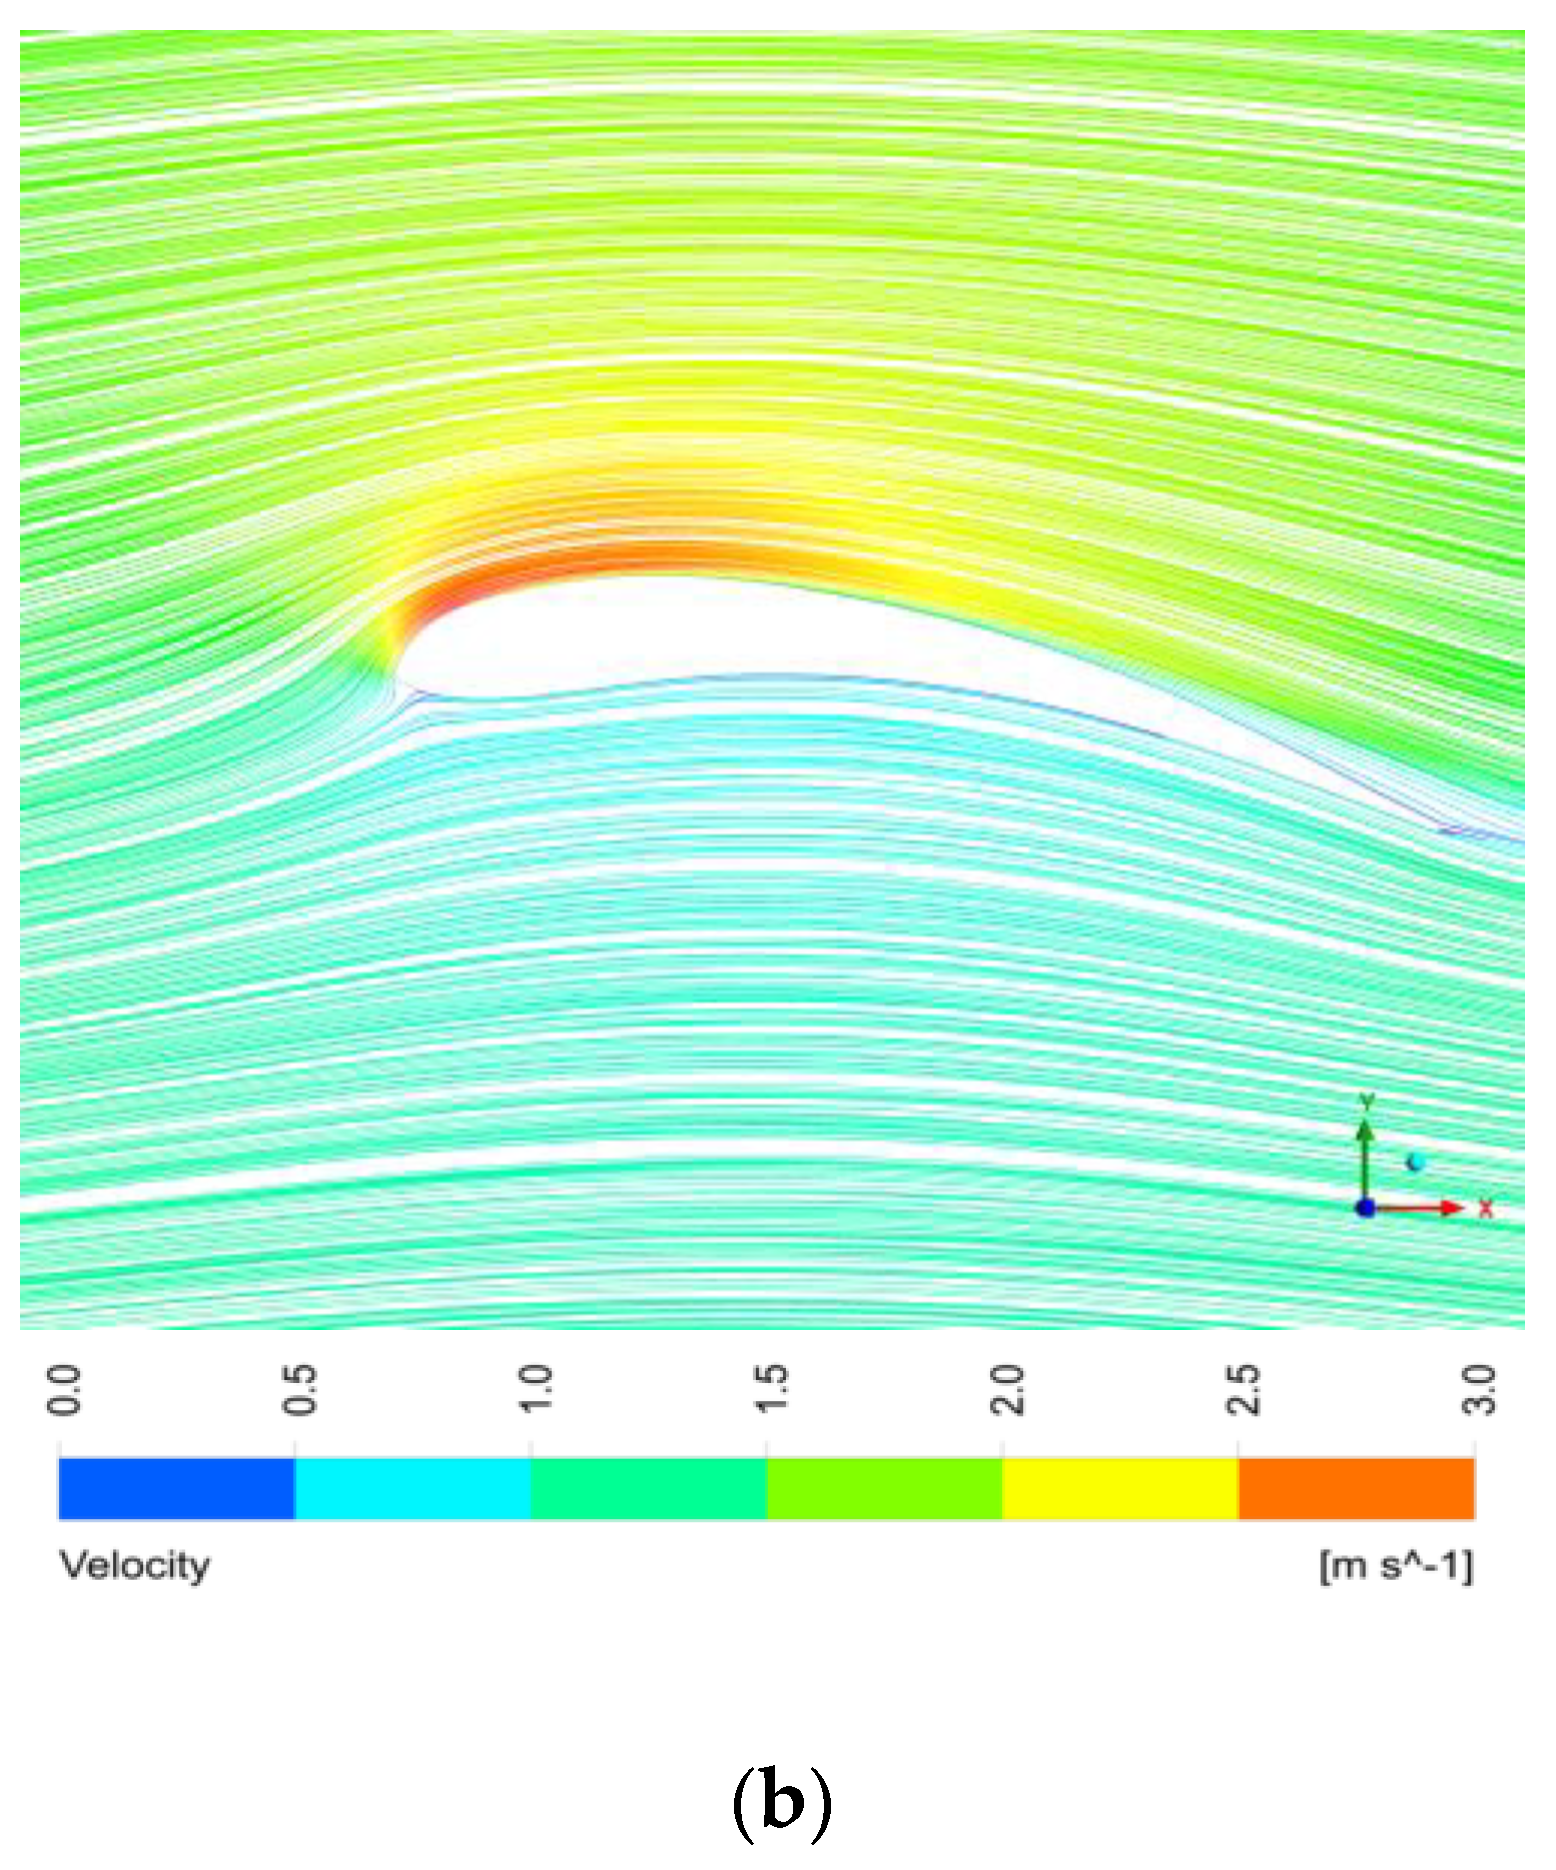
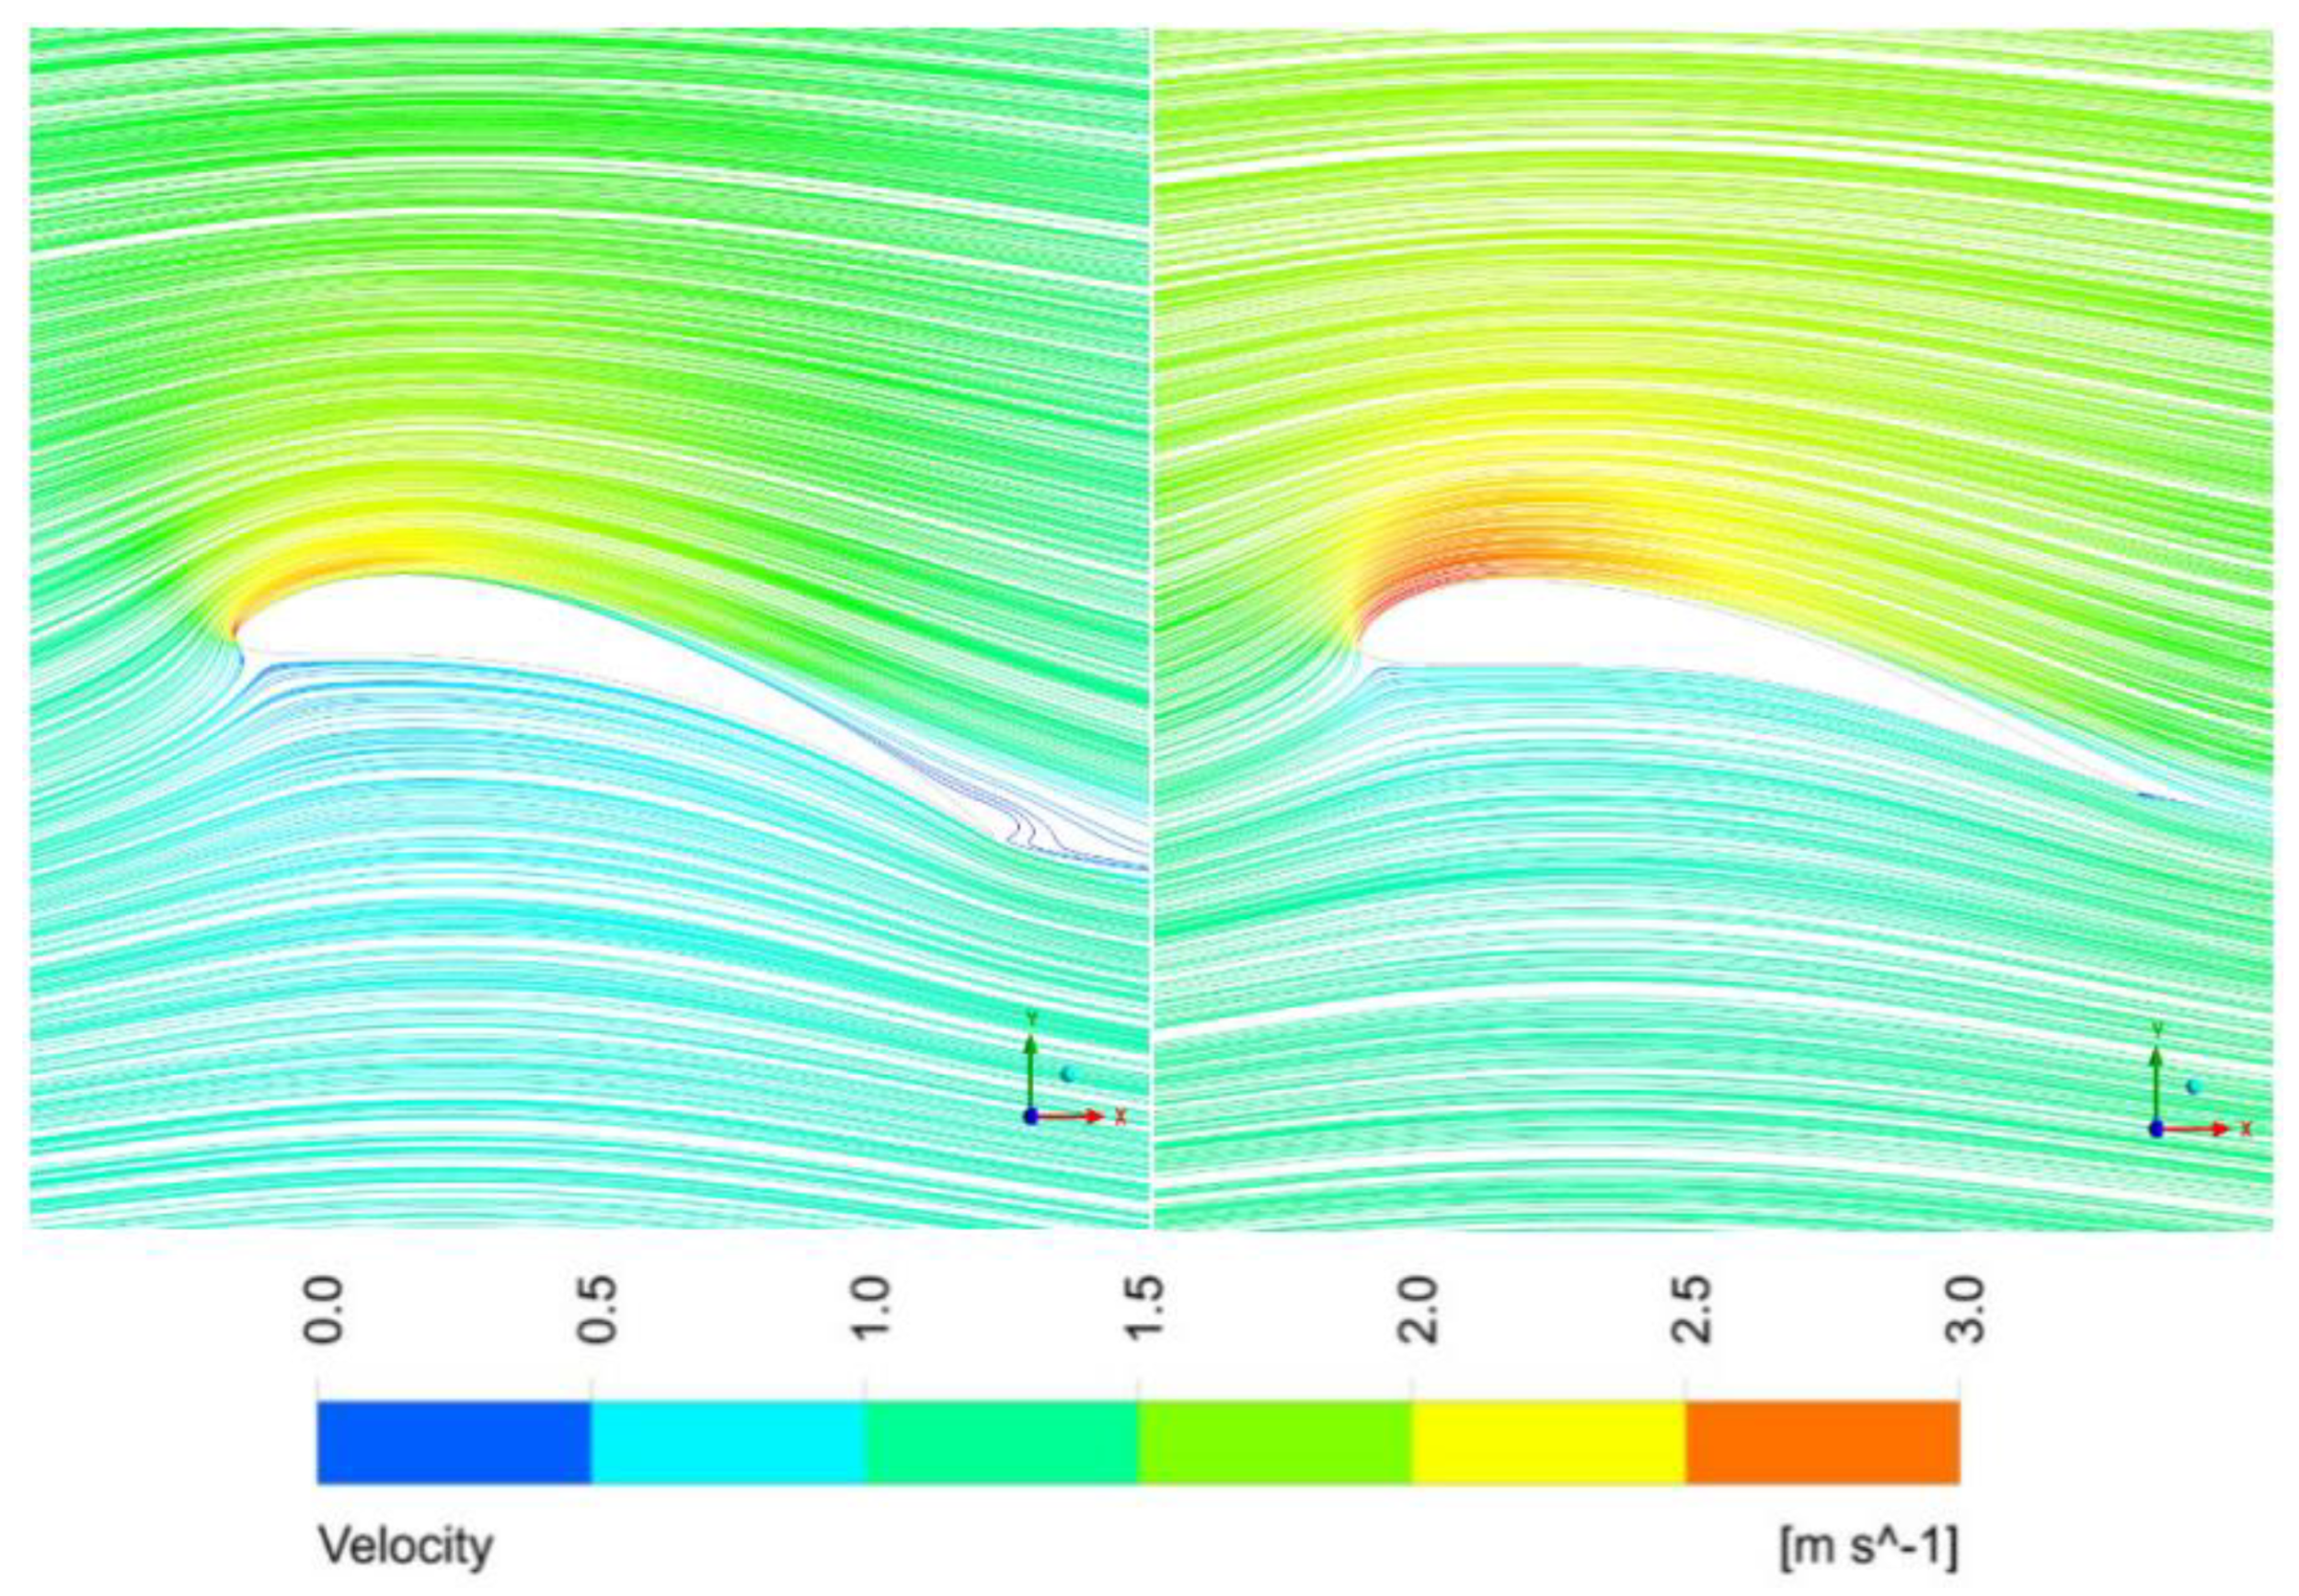
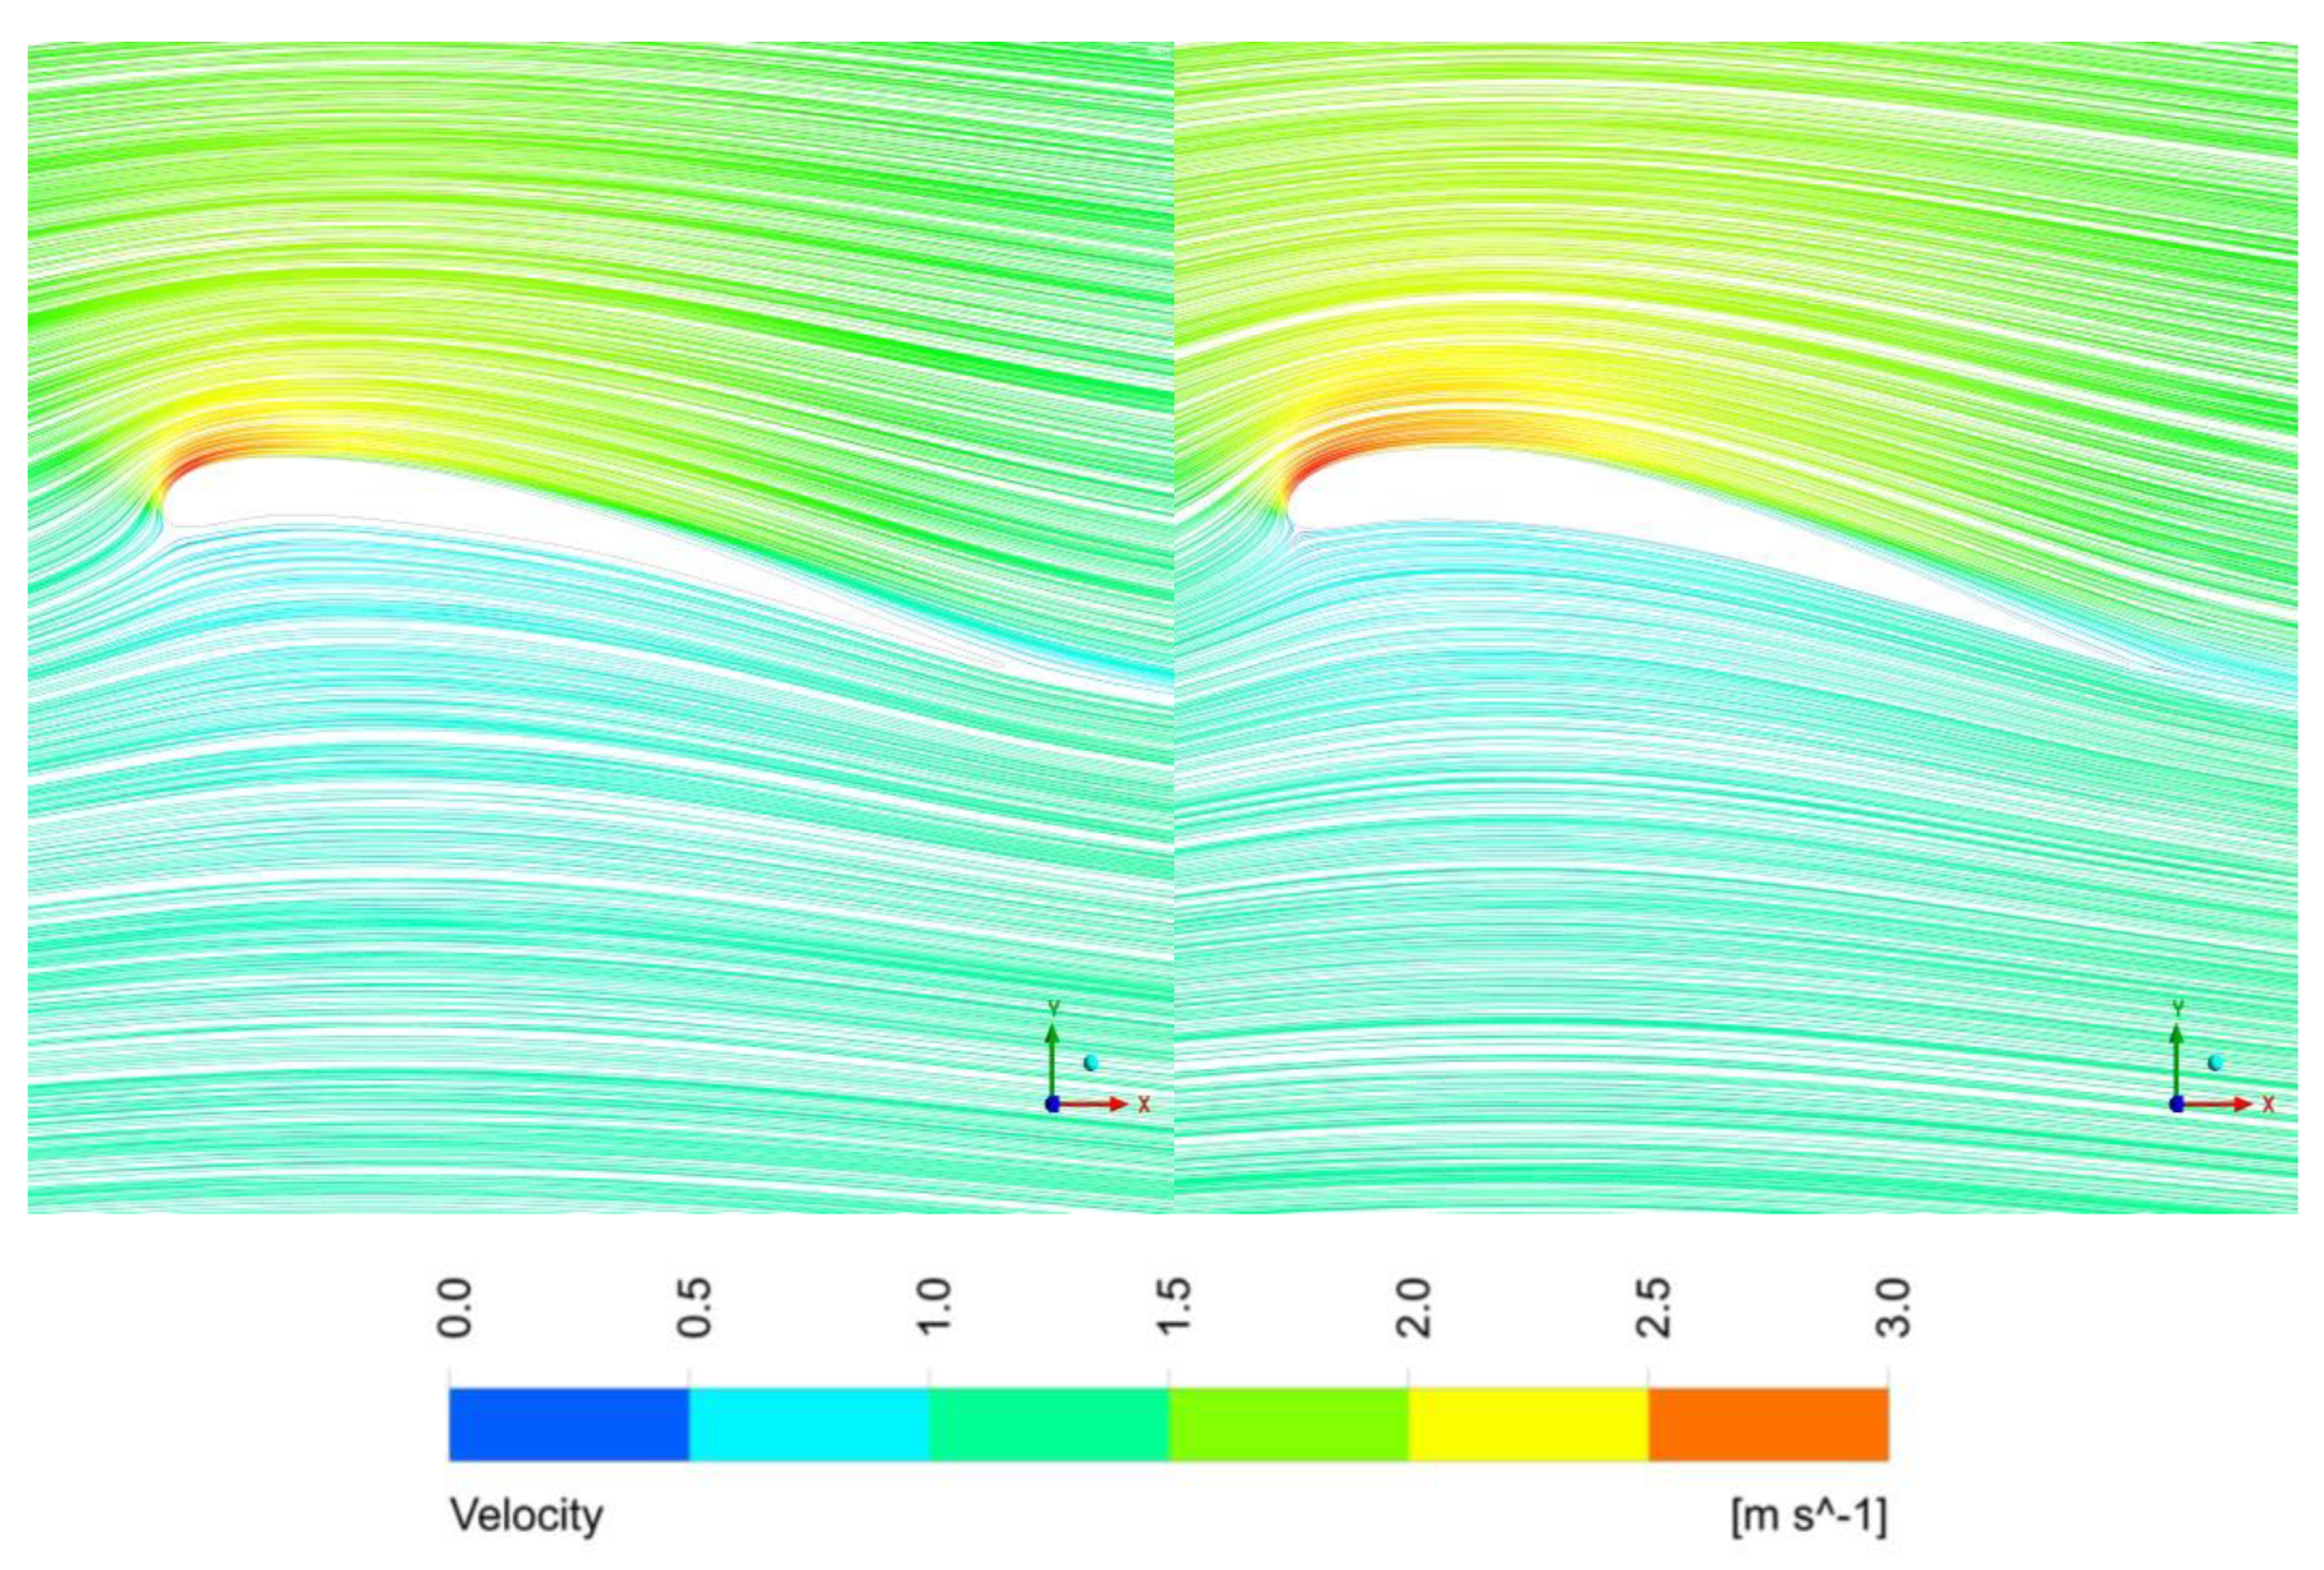
Figure 11, Figure 12, Figure 13 and Figure 14 illustrate the pressure and velocity cloud images of the initial and optimized airfoils of the long-eared owl, seagull, and sparrowhawk at the maximum lift–drag ratio. The optimized pressure clouds of the three bionic airfoils indicated that the top wing surface had a broader and more uniform negative pressure area. The negative pressure area of the initial airfoil was concentrated in the front area of the airfoil. By contrast, the negative pressure area of the optimized airfoil was concentrated in the front middle area of the airfoil. The more uniform distribution of the negative pressure area indicated better stability of the optimized airfoil structure. According to the velocity flow line diagram of optimization, the area of the negative pressure zone of the airfoil increased, thereby increasing the flow velocity of the upper surface, indicating that the actual working process of the turbine blade efficiency increased. Furthermore, the velocity flow diagram of the long-eared owl at the initial wing angle of attack of 5° indicated that the vortex was generated at the trailing edge of its airfoil and became more noticeable at an angle of attack of 10°. The generation of the vortex and increase in its size considerably reduced the lift coefficient of the airfoil. The sparrowhawk’s airfoil exhibited higher stability, and no vortex was generated before and after optimization within the range 0–10°; this is consistent with previous reports [9]. For the seagull airfoil, almost no vortex was generated at the rear edge of the initial wing at an angle of attack of 10°, and after optimization at an angle of attack of about 10°, no vortex was generated at the trailing edge of the airfoil. The optimized pressure cloud diagram and velocity flow line diagram of the long-eared owl and sparrowhawk airfoils indicated that when the camber and thickness of the airfoil increased, the relative maximum camber and maximum thickness shifted backward. In addition, the flow velocity of water on the top surface of the airfoil increased, and the suction force on the lower airfoil surface increased, thereby increasing the lift coefficient and lift–drag ratio coefficient.
Table 4 lists the maximum lift coefficients of the three bionic airfoils at an angle of attack of 15°. The initial airfoil with the smallest lift coefficient at the angle of attack 15° was the sparrowhawk airfoil, and the one with the largest lift coefficient was the long-eared owl airfoil. After optimization, the long-eared owl wing type had the largest lift coefficient. However, based on the comparison of the lifting ratios, the seagull airfoil had the best optimization effect (7.86%) under the same optimization objective and constraints. The long-eared owl airfoil had the worst optimized maximum lift coefficient of 3.4%.
The dynamic lift curves for the three airfoils under operating conditions are displayed in Figure 15. The lift coefficients of all airfoils increased linearly with the increase in the angle of attack at the beginning of the dynamic stall. After a certain angle of attack, the wing lift coefficient increased gradually. When the airfoil angle of attack was greater than the dynamic stall angle, the airfoil lift coefficient gradually decreased. After the airfoil reached the maximum angle of attack, the airfoil starts entered the downward pitching phase, and with the decrease in the angle of attack, the flow on the airfoil surface began to reattach. The peak lift coefficient of the long-eared owl airfoil was 2.2, which was the most significant peak lift coefficient among the three bionic wing types. However, the area of the hysteresis loop of the dynamic lift coefficient was also the largest, indicating poor stability of the dynamic stall. The lift coefficient of the sparrowhawk wing was significantly smaller than that of the seagull wing in the upward elevation phase. The hysteresis loop area of the lift coefficient was more significant than that of the seagull wing airfoil, which indicated lower stability than that of the seagull profile. The seagull wing airfoil had a high peak dynamic lift coefficient (1.94), a smaller dynamic hysteresis loop area, and higher stability than the other two bionic airfoils. Thereafter, the energy gain of the optimized seagull wing type was compared with the initial seagull wing applied to the tidal turbine.

6.3. Application of the Optimized Seagull Wing Profile to a Tidal Turbine

Combined with the turbine design scheme, the optimized seagull airfoil type can be applied to the turbine blade tip (blade spread to 70–100% position). The blade tip is typically designed to be thin, and the maximum relative thickness of the airfoil is no more than 15%. In terms of hydrodynamic characteristics requirements, the blade tip airfoil has a high lift coefficient, high maximum lift–drag ratio, desirable stall characteristics, and low noise characteristics.
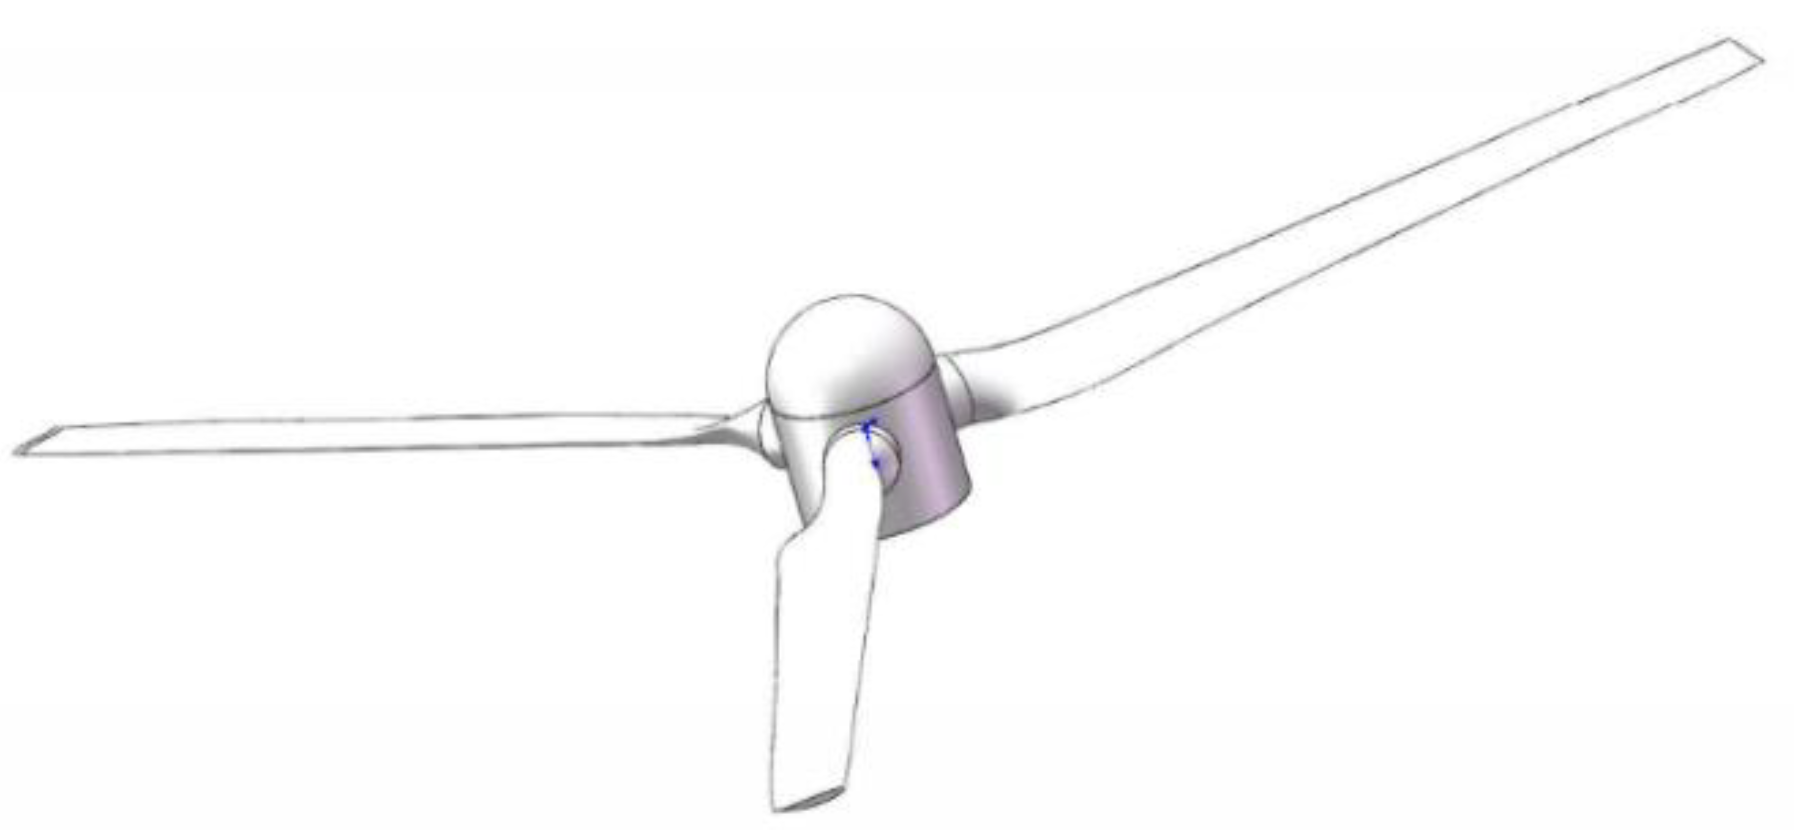
The blade dimensions based on the seagull wing airfoil and the three-dimensional model are displayed in Figure 16. The optimized seagull wing airfoil was used in turbine sections No. 8–10, and the remainder of the airfoil had a NACA-63XX series profile. Table 5 presents a comparison between the airfoil structure before and after optimization. In Table 5, r denotes the local radius, R denotes the overall blade radius (0.6 m), and c denotes the chord length.
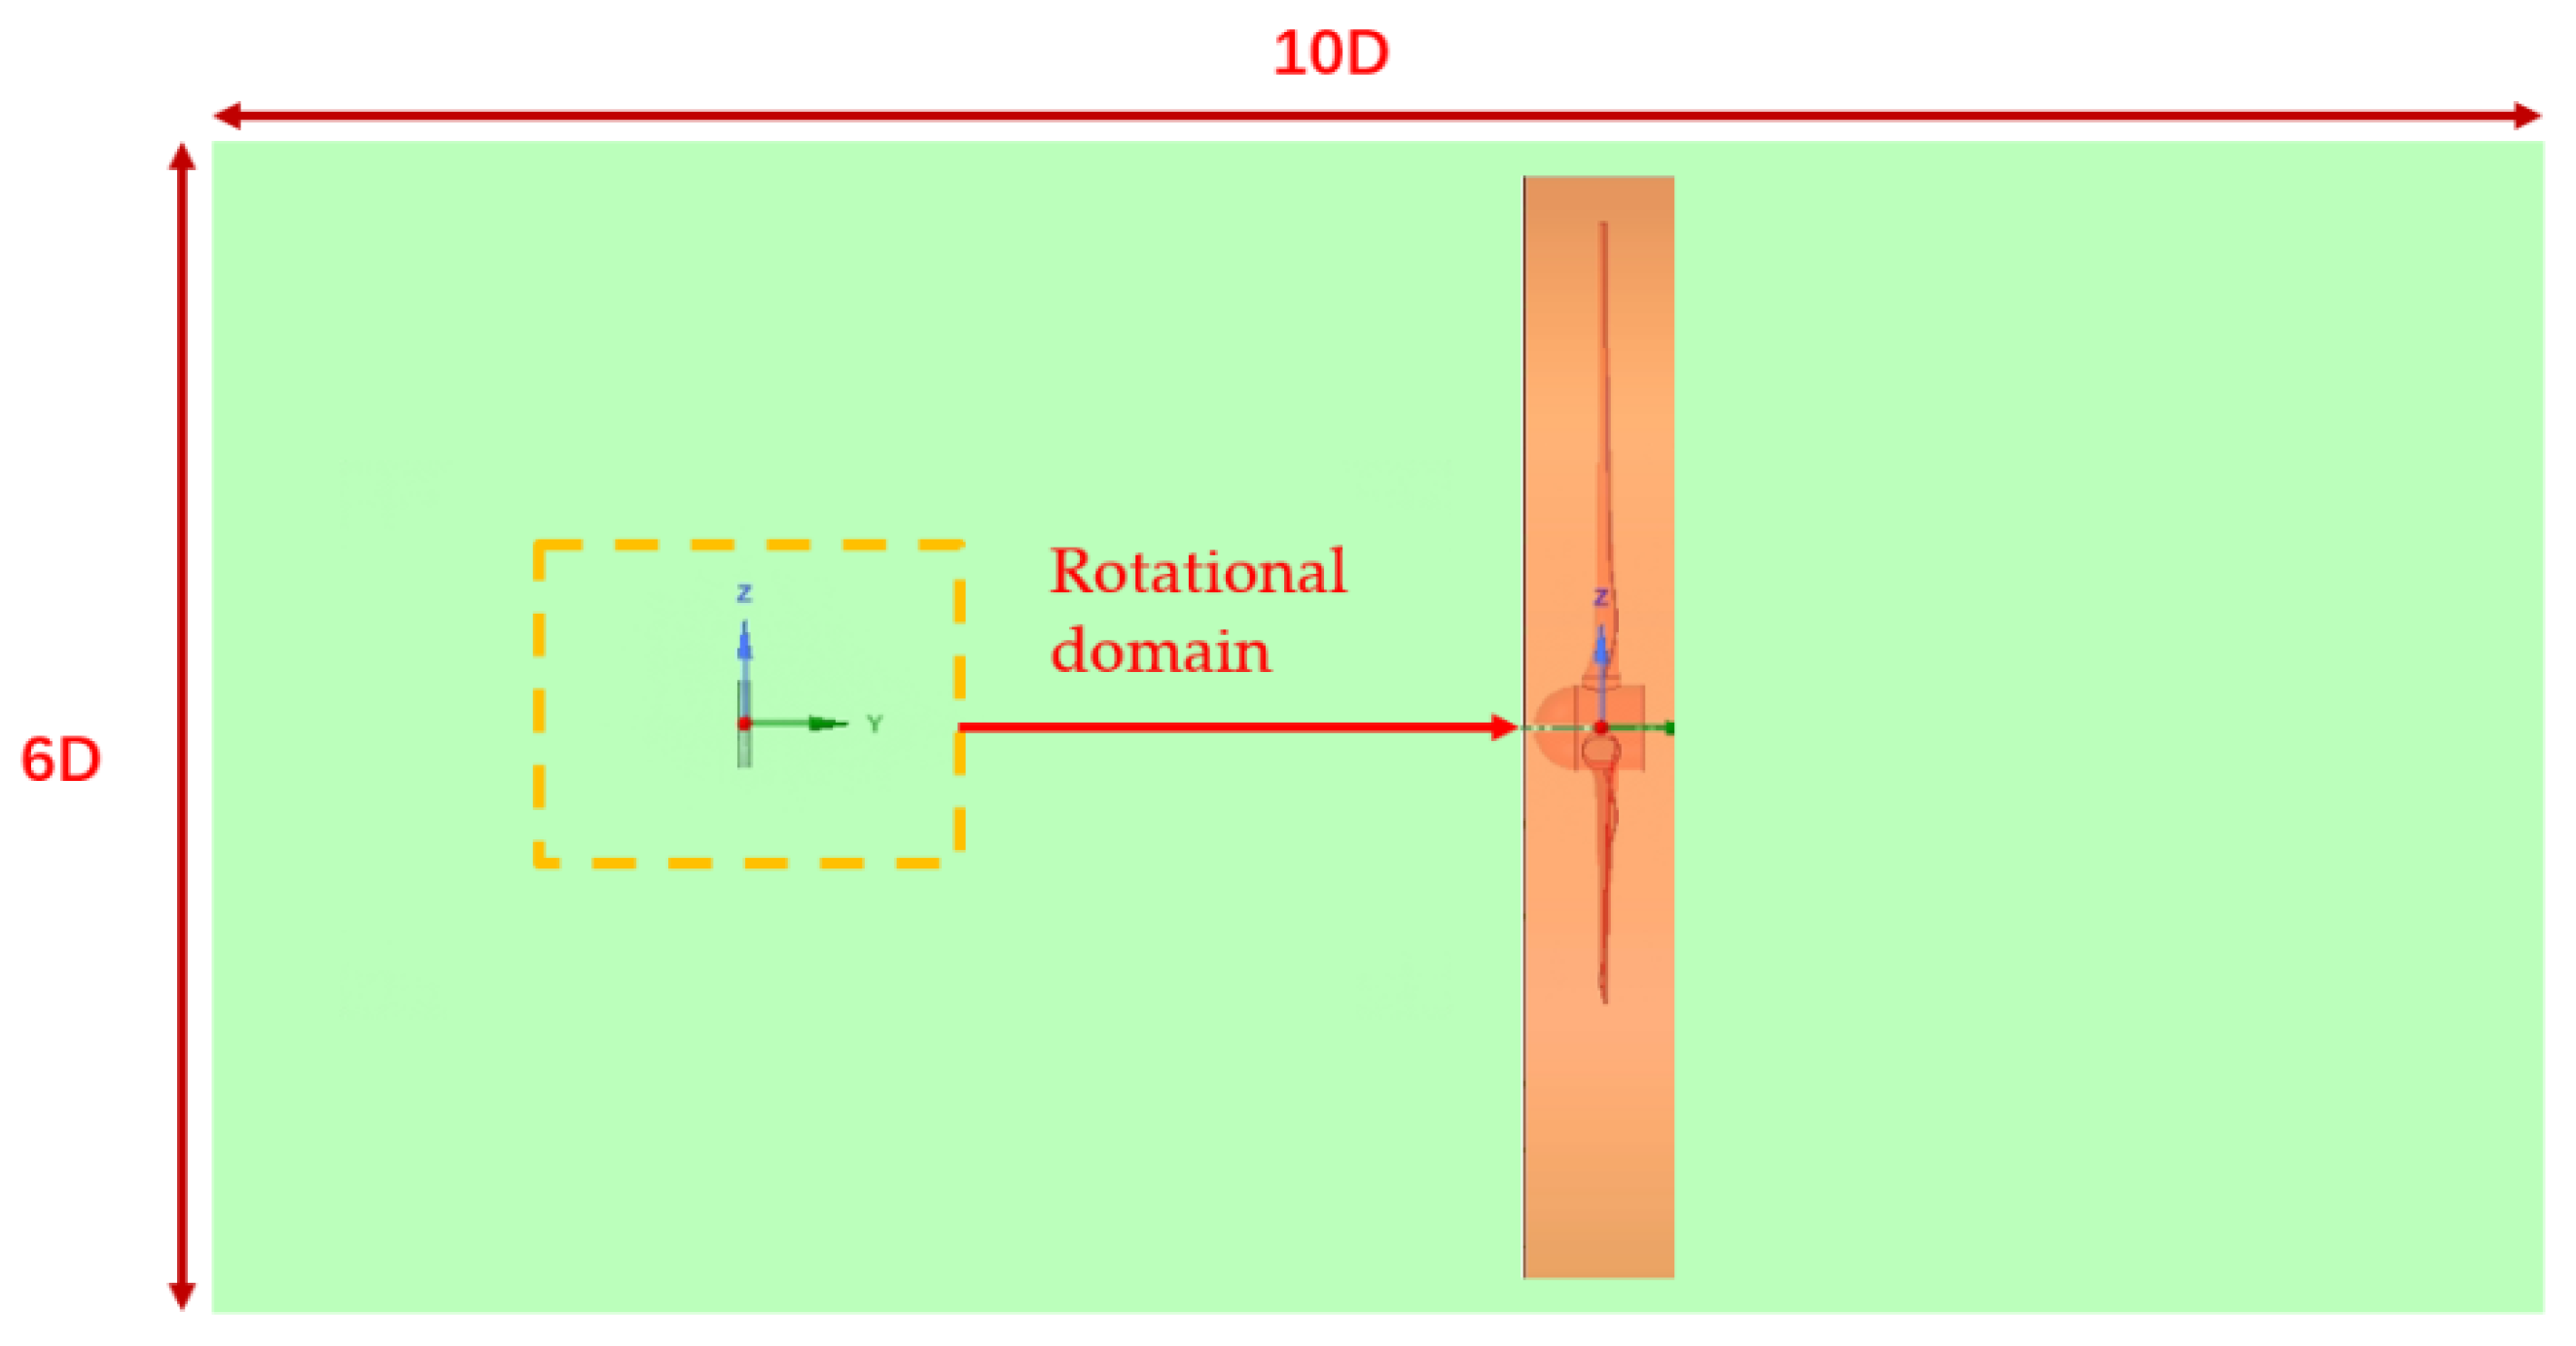
The turbine rotational domain and stationary domain were established using SpaceClaim. The turbine was 3–4 D from the inlet, 3–4 D from both walls (D denotes the turbine diameter), and 8–10 D from the outlet, as illustrated in Figure 17. A cylinder was used for the rotational domain, and a rectangular body was used for the stationary domain. FLUENT meshing was used to divide the mesh. The height of the first boundary layer was 0.0005 m, and the standard k ε two-equation model was used as the turbulence model.
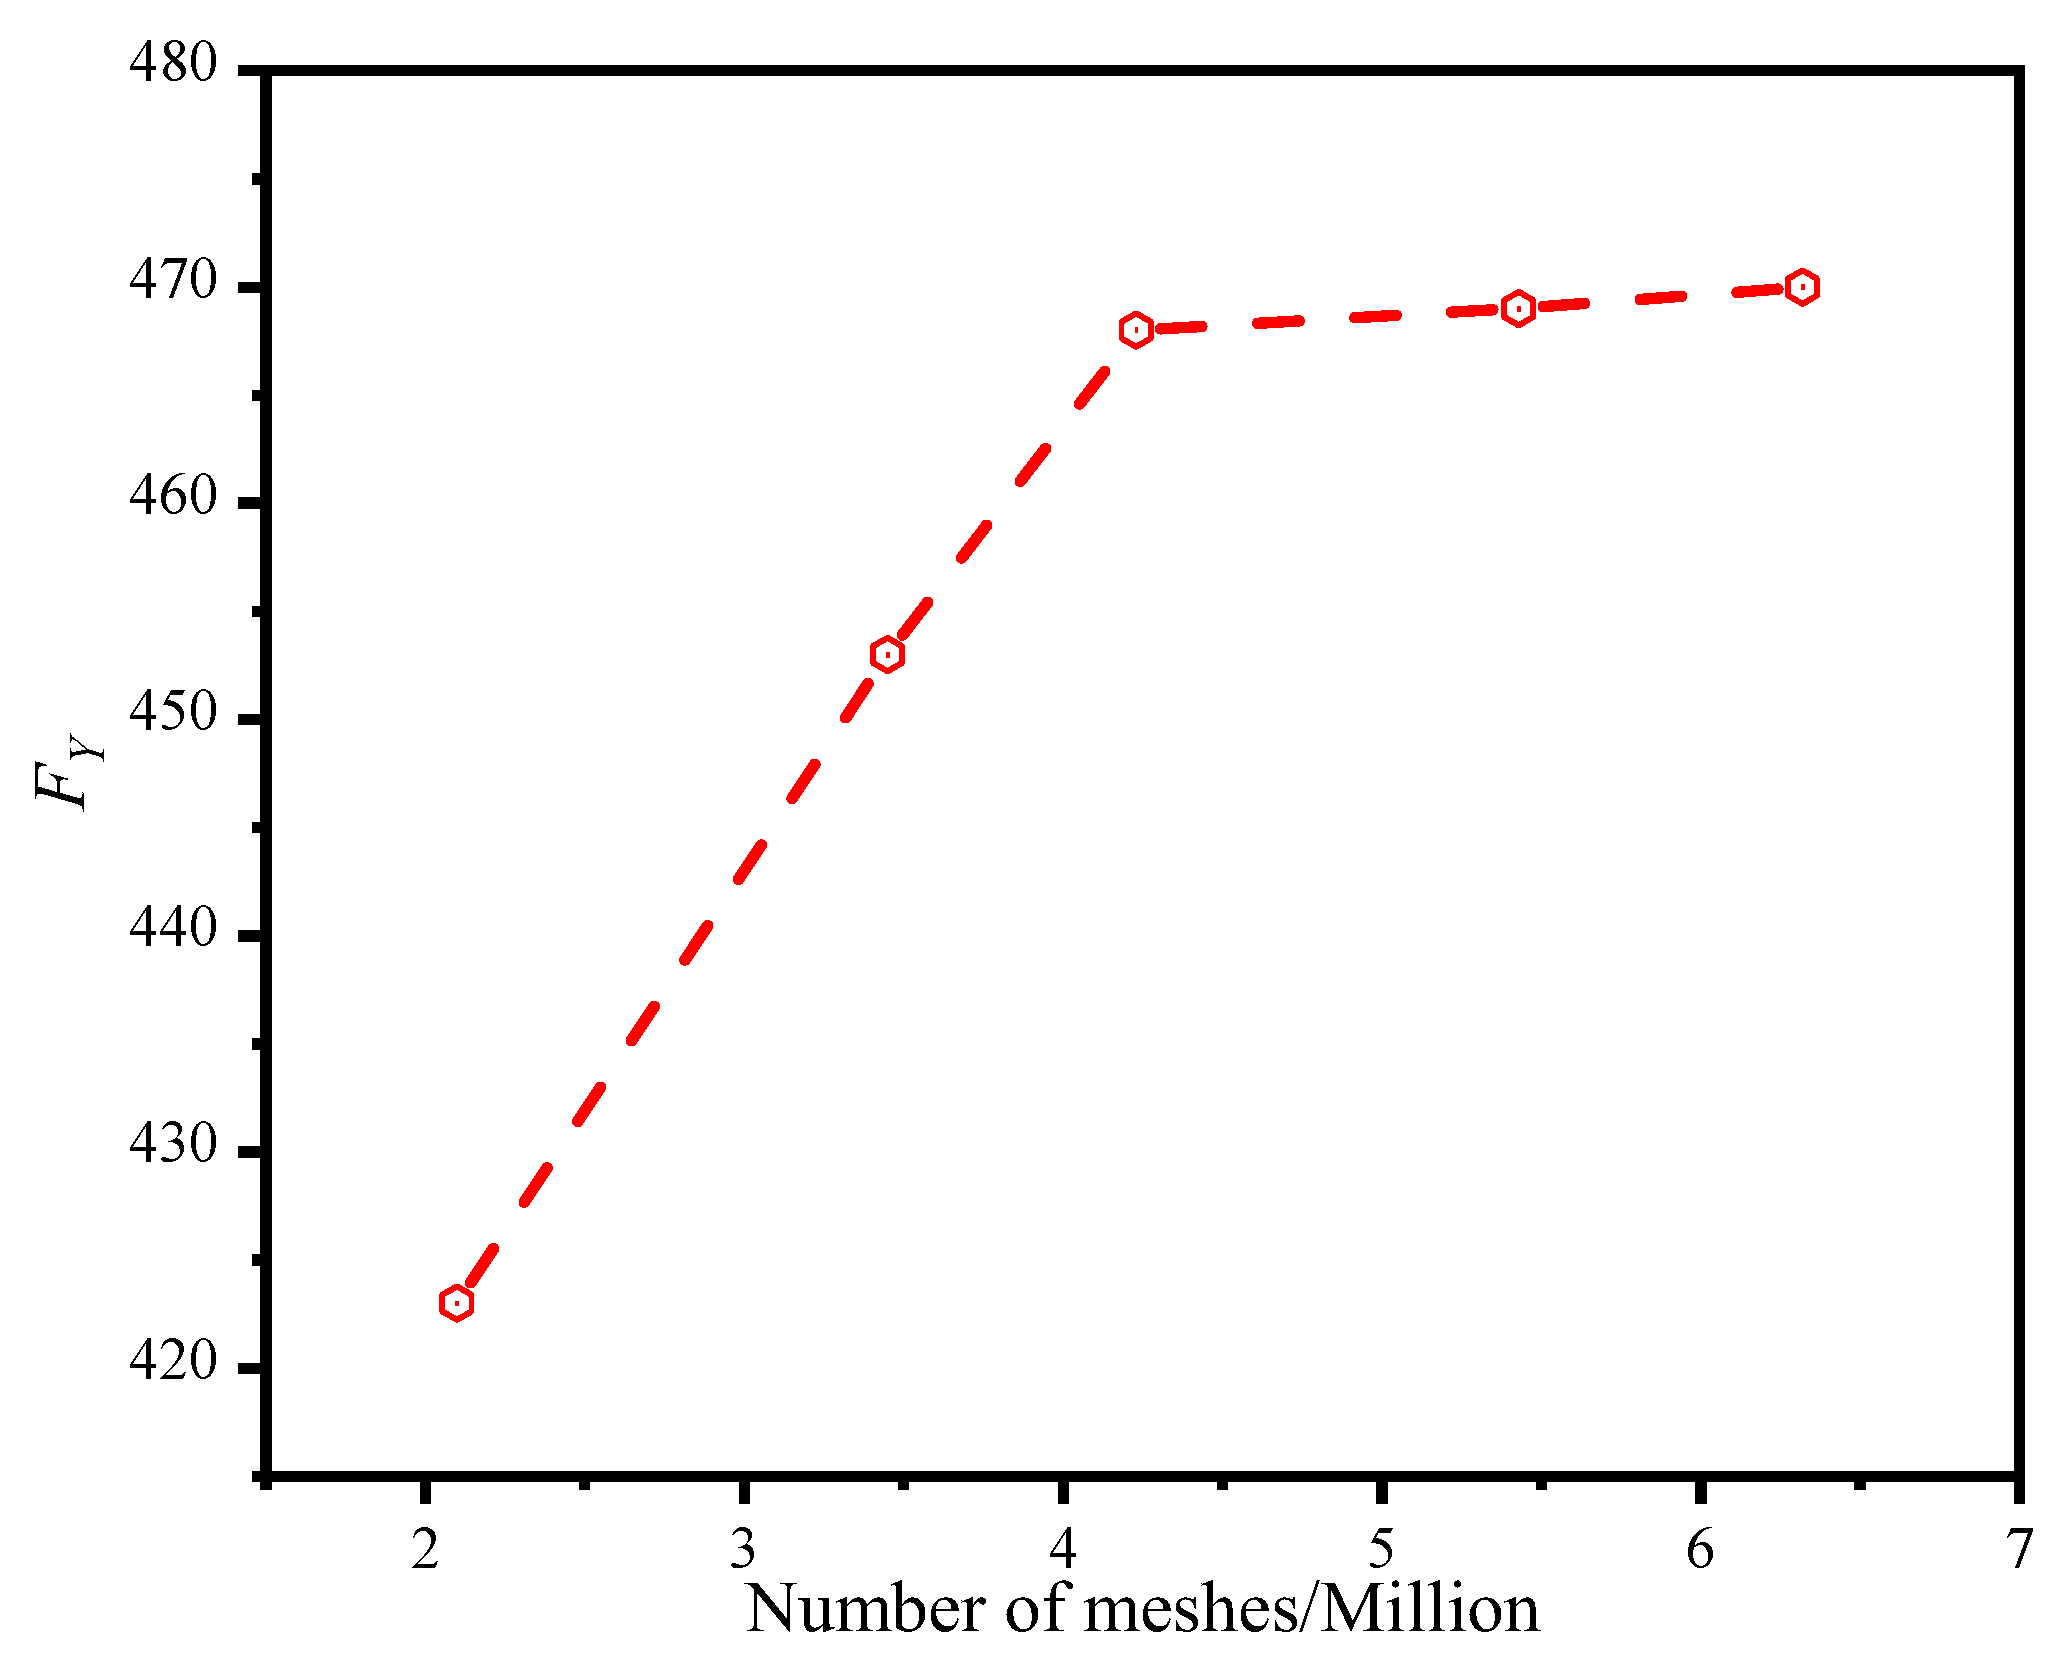
The basic settings of CFD numerical simulation were as follows: the atmospheric pressure was set as the reference pressure; the velocity inlet, having a uniform incoming flow with velocity U (1.5 m/s), was set as the input boundary; the pressure outlet was set as the outlet boundary, and the outlet relative pressure was set to 0; the side of the computational domain was set as the free sliding wall, and the turbine surface was set as the stationary wall. To verify the accuracy of the mesh model, a mesh-independent verification was performed, as illustrated in Figure 18. The third mesh was selected to reduce computational requirements. To compare the performance of the optimized seagull profile applied to the tidal turbine, the expressions of energy utilization C P and axial load factor C Z were calculated as follows:
C P = M Y ω 1 2 ρ U 3 π R 2
C Z = F Y 1 2 ρ U 2 π R 2
λ = ω R U = π n R 30 U
where MY denotes the turbine moment around the rotation axis; ρ denotes the fluid density; FY denotes the load in the direction of the turbine rotation axis; ω denotes the turbine rotation angular speed; R denotes the turbine radius; 𝜆 denotes tip speed ratio.
As illustrated in Figure 19, the optimized turbine coefficients CP and CZ in CFD validation at different tip speed ratios were more significant than those of the pre-optimized turbine. The values of CP and CZ were optimal at λ = 3 and worse at λ = 6. For λ = 2~8, the CP coefficient increased by an average of 8.42%. Thus, the optimized seagull wing type can increase the energy gain of the tidal turbine.

7. Conclusions

In this study, we first reconstructed three bird airfoils at 40% cross-section as initial airfoil profiles. Then, a MIGA was used to optimize the maximum lift–drag ratio at an angle of attack of 5° and the maximum lift coefficient at an angle of attack of 15°. Different operating environments of the turbine were applied as constraints to the tidal turbine. The final optimization results indicated that the seagull-optimized airfoil exhibited reliable stability in a dynamic stall and was more suitable for practical operating environments of tidal turbines. Finally, the optimized seagull wing shape was applied to the blade tip section of the tidal turbine, and numerical simulations were performed.
(1)
The maximum lift–drag ratio was 80.87 at an angle of attack of 6° for the sparrowhawk, 76.82 at an angle of attack of 4° for the seagull, and 68.43 at an angle of attack of 5° for the long-eared owl. The optimized seagull airfoil exhibited a high peak dynamic lift coefficient (1.94), a small dynamic hysteresis loop area, and higher stability than the other two bionic airfoils.
(2)
According to the stress cloud graph and velocity flow line graph obtained after the optimization for the long-eared owl and sparrowhawk airfoil, the flow velocity of water on the upper surface of the airfoil and the suction force on the lower airfoil surface increased when the curvature and thickness of the airfoil increased and the relative maximum curvature and maximum thickness were shifted backward. Consequently, the lift coefficient and the lift–drag coefficient increased.
(3)
The tip speed ratio ranged from 2 to 8. When the optimized seagull wing shape was applied to the blade tip of the tidal turbine, the energy gain efficiency of the turbine increased, and the CP coefficient increased by an average of 8.42%.
This study expands the literature on the application of bionic airfoils to tidal energy turbines and provides a theoretical framework for the application of the airfoils of some marine organisms to hydraulic turbines.

Author Contributions

Conceptualization, Z.Z. and L.L.; methodology, L.L.; software, N.L.; validation, W.L.; formal analysis, L.L.; investigation, Z.Z.; resources, L.W.; data curation, B.W.; writing—original draft preparation, B.W.; writing—review and editing, L.L.; visualization, B.W.; supervision, Z.Z.; project administration, Z.Z.; funding acquisition, Z.Z., W.L. and L.C. All authors have read and agreed to the published version of the manuscript.

Funding

This study was funded by the National Key Research and Development Program of China “Cooperative study on comprehensive evaluation methods of wave and tidal currents energy technology” (No. 2019YFE0102500), National Natural Science Foundation of China (Nos. 52001138 and 52101356), National Natural Science Foundation of Jiangsu Province (No. BK20201029), and Basic Science (Natural Science) Program of Colleges and Universities in Jiangsu Province (Nos. 20KJB416005 and 21KJB580011). We would like to thank KetengEdit (www.ketengedit.com, accessed on 19 December 2022) for its linguistic assistance during the preparation of this manuscript.

Institutional Review Board Statement

Not applicable.

Informed Consent Statement

Not applicable.

Data Availability Statement

Data is not shared due to privacy concerns.

Conflicts of Interest

The authors declare no conflict of interest.

References

  1. Liu, W.X.; Liu, L.; Wu, H.T.; Chen, Y.L.; Zheng, X.B.; Li, N.Y.; Zhang, Z.Y. Performance analysis and offshore applications of the diffuser augmented tidal turbines. Ships Offshore Struct. 2022, 1, 1–10. [Google Scholar] [CrossRef]
  2. Wu, H.T.; Cui, L.; Liu, W.X.; Zhang, Z.Y.; Kang, J.C. Performance changes of an engineering ship with one mooring line failure. Eng. Fail. Anal. 2022, 137, 106233. [Google Scholar] [CrossRef]
  3. Wang, S.Q.; Cui, J.; Ye, R.C.; Chen, Z.F.; Zhang, L. Study of the hydrodynamic performance prediction method for a horizontal axis tidal current turbine with coupled rotation and surging motion. Renew. Energy 2019, 135, 313–325. [Google Scholar] [CrossRef]
  4. Zhang, Y.Q.; Zhao, M.X.; Zheng, Y.; Ji, R.W.; Zhang, Z.; Zang, W. Hydrodynamic analysis of horizontal axis tidal turbine at yawing motion. J. Eng. Thermophys. 2022, 43, 1226–1232. [Google Scholar]
  5. Tangler, J.L.; Somers, D.M. NREL Airfoil Families for HAWTs; National Renewable Energy Laboratory: Golden, CO, USA, 1995. [Google Scholar]
  6. Wang, X.C. Study on the Design Theory and Method of the Horizontal Axis Tidal Turbine Hydrofoil Family; Ocean University of China: Qingdao, China, 2017. [Google Scholar]
  7. Bai, J.Y.; Yang, K.; Li, H.L.; Xu, J.Z. Design of the horizontal axis wind turbine airfoil family. J. Eng. Thermophys. 2010, 31, 589–592. [Google Scholar]
  8. Yuan, P.; Wang, X.C.; Wang, S.J.; Tang, J.Z.; Si, X.C.; Bian, B.B. Study on optimization of hydrofoil of tidal turbine blade based on genetic algorithm. Period. Ocean Univ. China (Nat. Sci. Ed.) 2018, 48, 125–131. [Google Scholar]
  9. Grasso, F. Design and optimization of tidal turbine airfoil. J. Aircr. 2012, 49, 636–643. [Google Scholar] [CrossRef]
  10. Wickramasinghe, U.K.; Carrese, R.; Li, X. Designing Airfoils Using a Reference Point Based Evolutionary Many-Objective Particle Swarm Optimization Algorithm; Evolutionary Computation; IEEE: Barcelona, Spain, 2010. [Google Scholar]
  11. Timnak, N.; Jahangirian, A. Multi-point optimization of transonic airfoils using an enhanced genetic algorithm. Proc. Inst. Mech. Eng. Part G J. Aerosp. Eng. 2018, 232, 1347–1360. [Google Scholar] [CrossRef]
  12. Le-Duc, T.; Nguyen, Q.H. Aerodynamic optimal design for horizontal axis wind turbine airfoil using integrated optimization method. Int. J. Comput. Methods 2019, 16, 1841004. [Google Scholar] [CrossRef]
  13. Tan, J.Z.; Bian, B.B.; Si, X.C.; Wang, S.J.; Yuan, P. Special hydrofoil optimization design of tidal turbine based on multi-objective genetic algorithm. Period. Ocean Univ. China (Nat. Sci. Ed.) 2020, 50, 127–134. [Google Scholar]
  14. Liu, T.S.; Kuykendoll, K.; Rhew, R.; Jones, S. Avian airfoil geometry and kinematics. AIAA J. 2006, 44, 954. [Google Scholar] [CrossRef]
  15. Liao, G.H. Aerodynamic, Acoustic Characteristics of Long-Eared Owl Wing and Its Bionic Application; Jilin University of China: Changchun, China, 2013. [Google Scholar]
  16. Wang, M.H.; Liu, X.M. Numerical investigation of aerodynamic and acoustic characteristics of bionic airfoils inspired by bird airfoil. Proc. Inst. Mech. Eng. Part G J. Aerosp. Eng. 2019, 233, 4004–4016. [Google Scholar] [CrossRef]
  17. Wu, L.M.; Jiang, Y.X.; Liu, X.M.; Qin, W.X.; Xi, G. Numerical analysis of dynamic stall characteristics of several bionic airfoils. J. Xi’Jiaotong Univ. 2022, 9, 1–9. [Google Scholar] [CrossRef]
  18. Liu, X.F.; Wang, J.W.; Zhao, J.; Chen, Z.; Zhang, Z.W. Sparrowhawk Wing Bionic Method for Horizontal Axis Wind Turbine Blades. Ningxia Hui Autonomous Region CN105844034B, 12 July 2019. [Google Scholar]
  19. Liu, Q.Z.; Chen, B.; Wang, L.D.; Su, S.S. Experimental investigation on the hydrodynamics performance of a bionic blade. Renew. Energy Resour. 2018, 36, 611–616. [Google Scholar]
  20. Wang, L.D.; Wang, L.; Chen, B.; Nagata, S.; Haruki, T. Experimental study on hydrodynamic characteristics of straight blade dynamic effect. Renew. Energy Resour. 2021, 39, 137–142. [Google Scholar]
  21. Gao, C.; Liu, Q.K.; Jia, Y.Y.; Chen, A.J. Influence of reynolds number on aerodynamic performance of airfoil with vortex generator. J. Vib. Meas. Diagn. 2022, 42, 103–109, 197–198. [Google Scholar]
  22. Li, D.S.; Li, R.N.; Yang, C.X.; Wang, X.Y.; Yang, R.; Lin, Y.R. Research of the effect on reynolds number on aerodynamic performance of special airfoil for wind turbine. Fluid Mach. 2009, 37, 31–34. [Google Scholar]
  23. Hayes-Roth, F. Review of “Adaptation in Natural and Artificial Systems by John, H. Holland”; The University of Michigan Press: Ann Arbor, MI, USA, 1975; ACM SIGART Bulletin. [Google Scholar]
  24. Goldberg, D.E. Genetic Algorithms in Search, Optimization and Machine Learning; Addis on-Wesley: Boston, MA, USA, 1989; pp. 12–23. [Google Scholar]
  25. Miura, Y.; Kaneko, M.; Hafizur Rahman, M.M.; Watanabe, S. Adaptive routing algorithms and implementation for TESH network. Commun. Netw. 2013, 5, 28236. [Google Scholar] [CrossRef] [Green Version]
  26. Shao, H.M. Research on Airfoil Optimization of Vertical Axis Fan Based on CFD and Genetic Algorithm; East China University of Technology: Shanghai, China, 2021. [Google Scholar]
  27. Yuan, P.; Wang, X.C.; Wang, S.J.; Tan, J.Z.; Si, X.C.; Bian, B.B. Study on influence of geometric parameters of tidal turbine hydrofoil on its hydrodynamic performance. Acta Energ. Sol. Sin. 2018, 39, 2705–2712. [Google Scholar]
  28. Bai, J.Y.; Yang, K.; Xu, J.Z. The experimental analysis and optimal design of thin airfoil family for horizontal-axis wind turbines. J. Eng. Thermophys. 2011, 32, 1131–1136. [Google Scholar]
  29. Zhang, Z.Y.; Wang, X.H.; Liu, W.X.; Ji, R.W.; Guo, G.K. Design and hydrodynamic performance analysis of horizontal axis tidal current turbine. Ship Sci. Technol. 2021, 43, 78–82, 88. [Google Scholar]
  30. Gharali, K.; Johnson, D.A. Dynamic stall simulation of a pitching airfoil under unsteady freestream velocity. J. Fluids Struct. 2013, 42, 228–244. [Google Scholar] [CrossRef]
  31. Li, M. Research on Hydrodynamic Characteristics of Hydrofoil in Cascade Based on CST Parameterization; Jiangsu University: Jiangsu, China, 2021. [Google Scholar]
  32. Chang, L.S.; Zhang, Q.Y.; Guo, X.Y. Airfoil optimization design based on gaussian process regression and genetic algorithm. J. Aerosp. Power 2021, 36, 2306–2316. [Google Scholar]
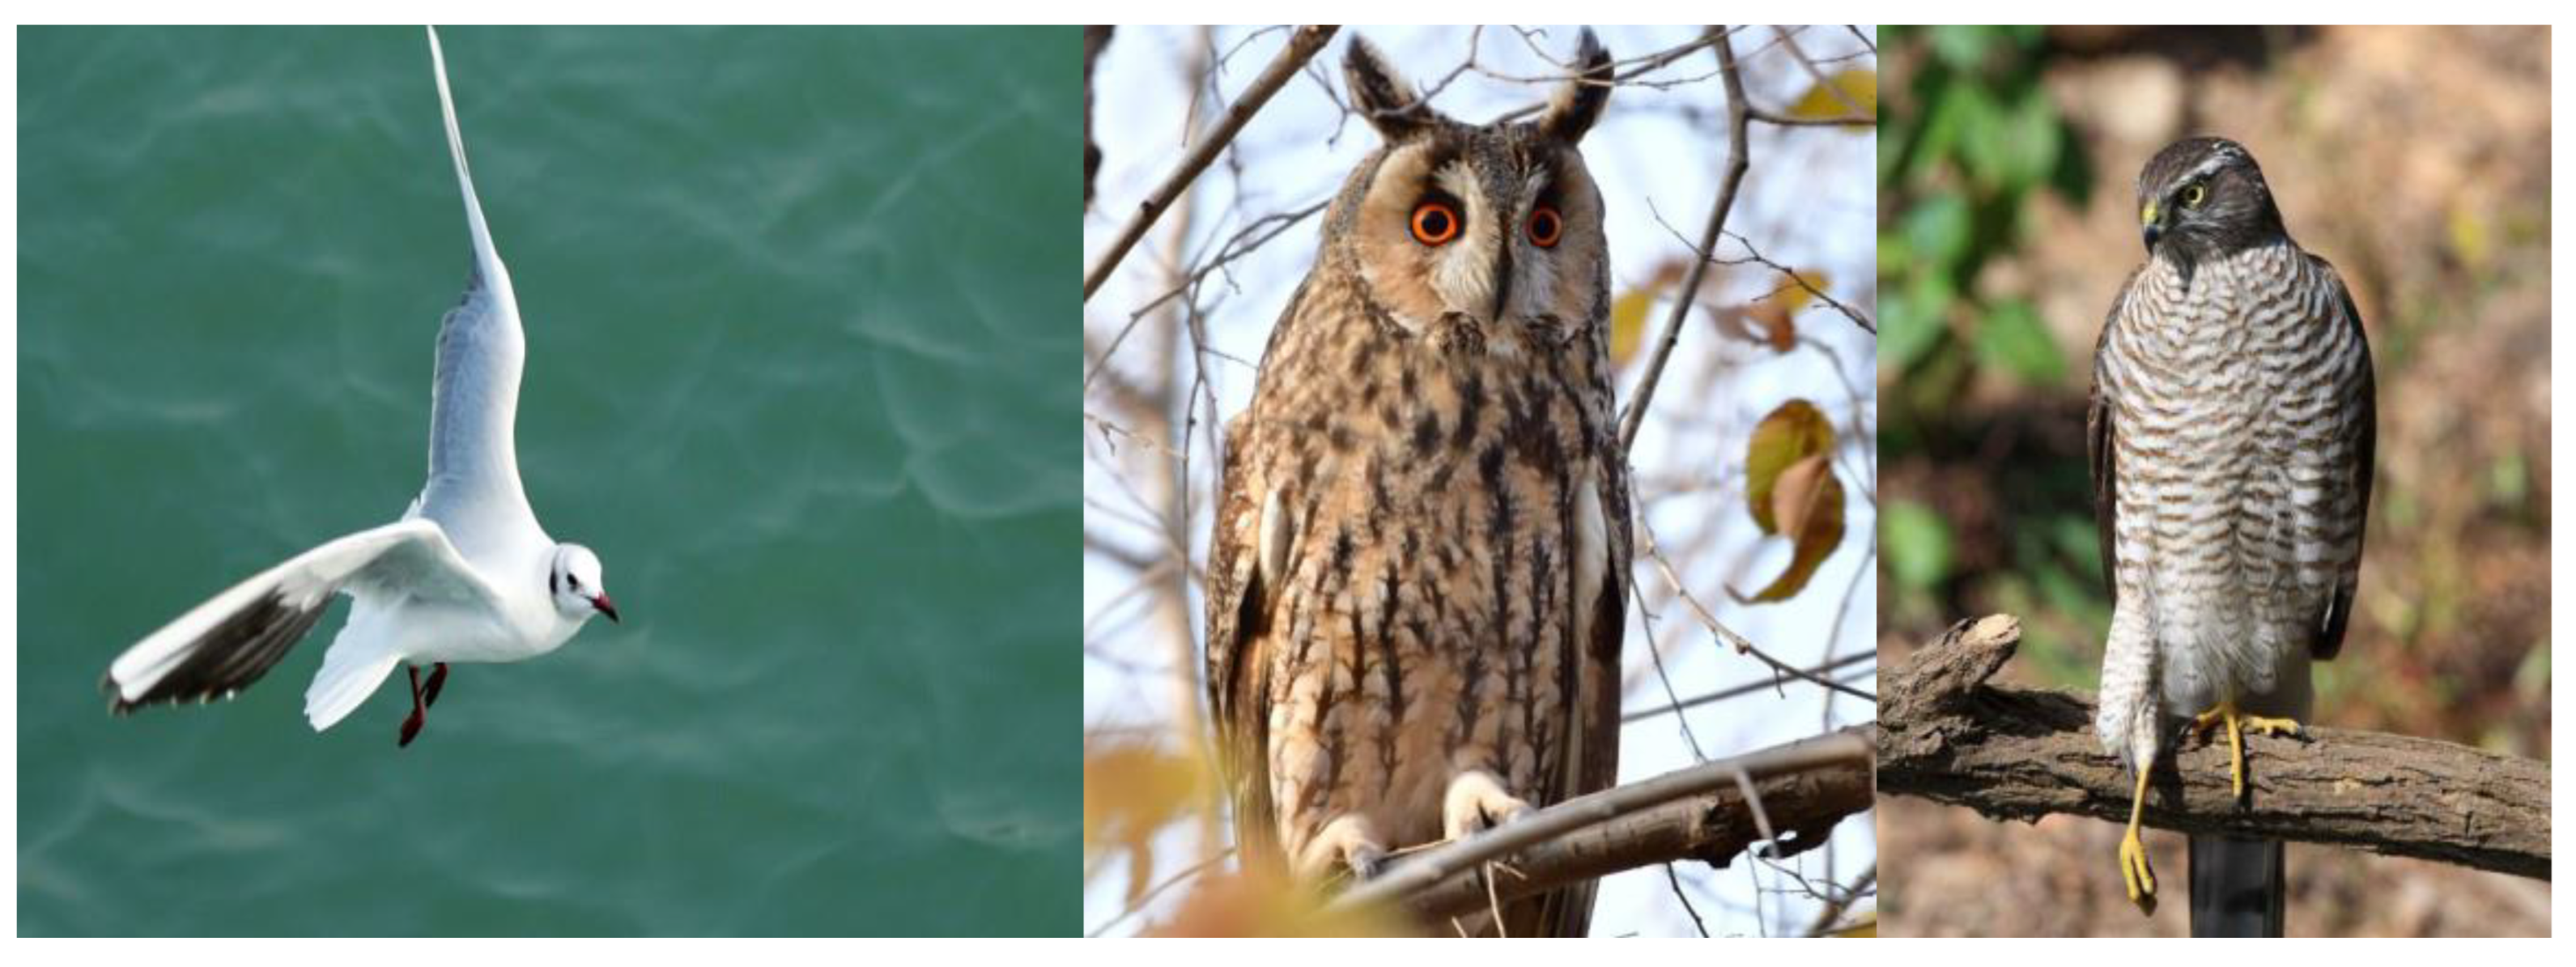
Figure 1. Left to right: seagull, long-eared owl, and sparrowhawk.
Machines 11 00043 g001
Figure 2. Airfoil models of the seagull, sparrowhawk and long-eared owl.
Machines 11 00043 g002
Figure 3. Hydrodynamic and aerodynamic characteristics of seagull airfoil.
Machines 11 00043 g003
Figure 4. Principle of population division.
Machines 11 00043 g004
Figure 5. Flow of MIGA.
Machines 11 00043 g005
Figure 6. Computational domain meshing.
Machines 11 00043 g006
Figure 7. Isight integration.
Machines 11 00043 g007
Figure 8. Calculation process.
Machines 11 00043 g008
Figure 9. Bionic airfoil shapes before and after optimization. (a) Long-eared owl airfoil; (b) Sparrowhawk airfoil; (c) Seagull airfoil.
Machines 11 00043 g009aMachines 11 00043 g009b
Figure 10. Comparison of lift−drag ratio coefficients before and after optimization of the bionic airfoil. (a) Seagull lift−to−drag factor; (b) Sparrowhawk lift−to−drag factor; (c) Long−eared owl lift−to−drag factor.
Machines 11 00043 g010
Figure 11. Three bionic airfoil pressure diagrams. (a) Comparison of pressure contour diagrams before and after optimization of the long−eared owl at an angle of attack of 5°; (b) Comparison of pressure contour diagrams before and after optimization of the seagull at an angle of attack of 4°; (c) Comparison of pressure contour diagrams of the sparrowhawk before and after optimization at an angle of attack of 6°.
Machines 11 00043 g011aMachines 11 00043 g011b
Figure 12. Streamline diagrams of the long−eared owl airfoil. (a) Streamline diagram of the initial airfoil velocity of the long−eared owl airfoil (angle of attack 5° on the left, 10° on the right); (b) Streamline diagram of the optimized airfoil velocity of the long−eared owl airfoil (angle of attack 10°).
Machines 11 00043 g012aMachines 11 00043 g012b
Figure 13. Streamline diagram of the optimized airfoil velocity of the seagull airfoil at an angle of attack of 10°. (Initial airfoil on the left, optimised airfoil on the right).
Machines 11 00043 g013
Figure 14. Streamline diagram of the optimized airfoil velocity of the sparrowhawk at an angle of attack of 10°. (Initial airfoil on the left, optimised airfoil on the right).
Machines 11 00043 g014
Figure 15. Dynamic lift coefficient.
Machines 11 00043 g015
Figure 16. Three-dimensional model.
Machines 11 00043 g016
Figure 17. Rotational domain and stationary domain.
Machines 11 00043 g017
Figure 18. Mesh independence of verification.
Machines 11 00043 g018
Figure 19. Optimization of Cp and Cz.
Machines 11 00043 g019
Table 1. Parameters of long-eared owl and seagull airfoils.
Coefficient
Name
S1S2S3A1A2A3A4
Long-eared owl3.93620.77050.8485−29.486166.4565−59.806019.0439
Seagull3.8735−0.8070.771−15.24626.482−18.9754.6232
Table 2. Parameter configuration settings for MIGA.
NameParameter SettingNameParameter Setting
Subpopulation size5Mutation probability0.01
Number of islands10Inter-island mobility0.01
Evolution algebra40Migration interval algebra5
Crossover probability0.99
Table 3. Comparison of airfoil structures before and after optimization.
NameThickness (%) h t   ( % ) Camber (%) w f   ( % )
Sparrowhawk airfoil7.4112.487.5530.54
Sparrowhawk optimization8.4016.738.3734.36
Seagull airfoil8.4314.306.7538.85
Seagull optimization9.9917.308.2444.30
Long-eared owl airfoil10.9812.8510.0140.21
Long-eared owl optimization12.6116.1011.3745.10
Table 4. Comparison of the initial airfoil and optimized airfoil lift coefficients at an angle of attack of 15°.
Name(CL) MaxLifting Ratio (%)
Sparrowhawk airfoil1.767.4%
Sparrowhawk optimization1.89
Seagull airfoil1.787.86%
Seagull optimization1.92
Long-eared owl airfoil1.963.4%
Long-eared owl optimization2.03
Table 5. Comparison of airfoil structure before and after optimization.
NO.r/Rr (mm)c/Rc (mm)Twist (°)
10.1 *600.04832923
20.21200.11176719
30.31800.110966.5612.35
40.42400.104562.729.96
50.53000.098859.38.91
60.63600.093255.928
70.74200.088352.987.03
80.84800.085751.446.12
90.95400.08349.825.74
100.995940.0733445.5
Disclaimer/Publisher’s Note: The statements, opinions and data contained in all publications are solely those of the individual author(s) and contributor(s) and not of MDPI and/or the editor(s). MDPI and/or the editor(s) disclaim responsibility for any injury to people or property resulting from any ideas, methods, instructions or products referred to in the content.