Article

Investigation of Unsteady Pressure Pulsations of Reactor Coolant Pump Passage under Flow Coast-down

1
School of Energy and Power Engineering, Xihua University, Chengdu 610039, China
2
Key Laboratory of Fluid and Power Machinery, Ministry of Education, Chengdu 610039, China
3
Sichuan Key Laboratory of Fluid Machinery and Engineering, Chengdu 610039, China
*
Author to whom correspondence should be addressed.
Machines 2023, 11(1), 55; https://doi.org/10.3390/machines11010055
Submission received: 26 November 2022 / Revised: 25 December 2022 / Accepted: 27 December 2022 / Published: 3 January 2023
(This article belongs to the Section Electromechanical Energy Conversion Systems)

Abstract

:
In order to obtain the pressure pulsations of a reactor coolant pump during flow coast-down conditions, the time-domain characteristics of the flow passage under different times of flow coast-down were calculated by numerical calculation. Because the unsteady pressure pulsation signals in the RCP under flow coast-down are non-stationary and some phenomena may only occur in a short time, this paper analyzed them with the wavelet transform. The results show that the pressure fluctuation varies dramatically with the flow coast-down process and the variation rate of the pressure fluctuation coefficient can reach more than 60%. With the development of flow coast-down, there is a strong correlation between the pressure pulsation and number of impeller blades. The main frequency of the pressure pulsation gradually changes from high-frequency pulsation to low-frequency pulsation, and the regularity of the pressure pulsation is quickly destroyed, while the change in pressure pulsation regularity of the guide vane passage is more gentle than that of the impeller and pressurized water chamber. The change in wavelet intensity at the impeller outlet, guide vane inlet, and left side of the pressurized water chamber is more intense than at other areas.

1. Introduction

The reactor coolant pump (RCP), as the only high-speed rotating equipment in the primary loop of a nuclear power plant, is known as the heart of the nuclear power plant and plays an important role in their safe operation, with a nuclear safety class of one [1,2]. The RCP plays an important role in the first cooling loop system of a nuclear power plant, and the main loop diagram is as shown in Figure 1 [3]. The RCP ensures the nuclear power plant can transport coolant, cool the reactor core, exhaust the heat, and safely operate [4]. After the external power is lost, the RCP will enter the idle process. When it enters idling, its internal flow is more complicated than when under normal working conditions, and the unsteady change in pressure pulsation is an important reason for the complexity of the internal flow [5]. The internal pressure pulsation of the RCP is an important reason for its unstable operation [6]. The pressure pulsation of the RCP under flow coast-down is more complex and unsteady, which has a great influence on its operation. Therefore, a study on the pressure pulsation characteristics of the RCP under flow coast-down can provide important reference value for the safe and stable operation of nuclear power plants.
Zhu Yue used the separated vortex model to simulate the unsteady flow field at the inlet and outlet of the RCP model under the condition of uniform inflow. It was found that there was obvious periodic pressure pulsation at the inlet of the RCP and the fluctuation frequency was mainly determined by the blade frequency and its frequency multiplication. There was also obvious pressure pulsation at the outlet of the RCP, but the characteristic frequency was complex [7]. The RCP relies on coolant to realize energy transfer. When the RCP works, the blades periodically intersect with the fixed guide vanes along with the rotation of the impeller, resulting in the mutual influence of its speed and the pressure distribution in the impeller and guide vanes [8]. This interaction between the rotating impeller and the stationary guide vane is called dynamic–static interference [9]. The dynamic and static interference between the impeller and the guide vane will make the pressure in the RCP fluctuate continuously in a certain range; this single time duration of pressure is not long, and a certain periodic phenomenon is called a pressure pulsation [10].
Lai [11], Li [12], and Dan N [13] carried out comprehensive studies on the pressure pulsation of an RCP under rated conditions, and it was found that the high-amplitude pressure pulsation of the RCP under rated conditions mainly occurred in the suction surface of the impeller, the throat of the guide vane, and the left area of the pressurized water chamber, and periodic variation in the impeller and guide vane was related to the number of impeller blades. Zhu [14] and Long [15] studied the pressure pulsation characteristics of an RCP at part-load flow conditions. The pressure pulsation of the RCP at part-load flow conditions was significantly greater than that at other conditions, vortex and de-flow were prone to occur at the inlet of the impeller blade back, and the pressure pulsation was more complex than in other areas of the impeller. With the influence of the rotor and stator interference and the spherical pressurized water chamber, the pressure pulsation of the guide vane at part-load flow conditions was greater than that at other conditions. Ni Dan [16] and Wang Peng [17] studied the pressure pulsation characteristics of an RCP at overload flow conditions, and it was found that the pressure pulsation caused by the wake jet at the outlet of the impeller blade increased, the pressure pulsation coefficient at the outlet of the guide vane increased, and the unsteady state of the pressure pulsation on the right side of the pressurized water chamber was stronger than that on the left side. The RCP completely loses external power during operation, resulting in the RCP entering the flow coast-down condition [18]. Therefore, the flow state of the RCP changes, which makes the pressure pulsation characteristics more complex than at design flow conditions [19,20,21]. Wang [22,23] studied the transient characteristics of an RCP under flow coast-down and on this basis obtained the pressure pulsation response law under different flow coast-down conditions. However, there is no systematic study on the pressure pulsation of the RCP under flow coast-down in the above references.
Usually, the Fourier transform is used for pressure pulsation analysis. However, the pressure pulsation signal in the flow coast-down process of the RCP is a non-stationary signal, and the analysis using traditional Fourier transform has great limitations. The wavelet transform has better resolution in time–frequency, which can better analyze the pressure pulsation under flow coast-down. Zhou [24] analyzed the pressure pulsation at the inlet of the guide vane of a centrifugal pump by cross wavelet. The results of the wavelet analysis show that the energy is mainly concentrated to the blade pass frequency and two times the pass frequency under the same flow rate. Wang Kaili [25] analyzed the pressure pulsation characteristics of a high-specific-speed centrifugal pump using wavelet analysis. The analysis results show that the pressure pulsation signal caused by cavitation is amplified and highlighted, and the frequency domain component of the pressure pulsation can be obtained. Pavesi G [26] studied the time–frequency characteristics of the unsteady phenomena in a centrifugal pump using wavelet analysis. Braun O [27] carried out wavelet analysis on the pressure pulsation of a pump-turbine during the rapid transition from pump mode to power generation mode. Lilly J M [28] studied generalized Morse wavelets. The research shows that the generalized Morse wavelet essentially contains all other commonly used analytical wavelets, which provides a framework for the use of wavelets in applications. From the analysis results in the above references, it can be known that wavelet analysis can better display the details of the time–frequency characteristics of pressure pulsation, especially for the analysis of non-stationary pressure pulsation in a short time with good time–frequency resolution.
Therefore, in this paper, the pressure pulsation information in each flow passage of the RCP is obtained by numerical simulation, and the variation law of the pressure pulsation of the RCP in the whole flow coast-down process is studied by combining wavelet analysis. It provides certain data support for the reliable design of RCPs.

2. Research Methods

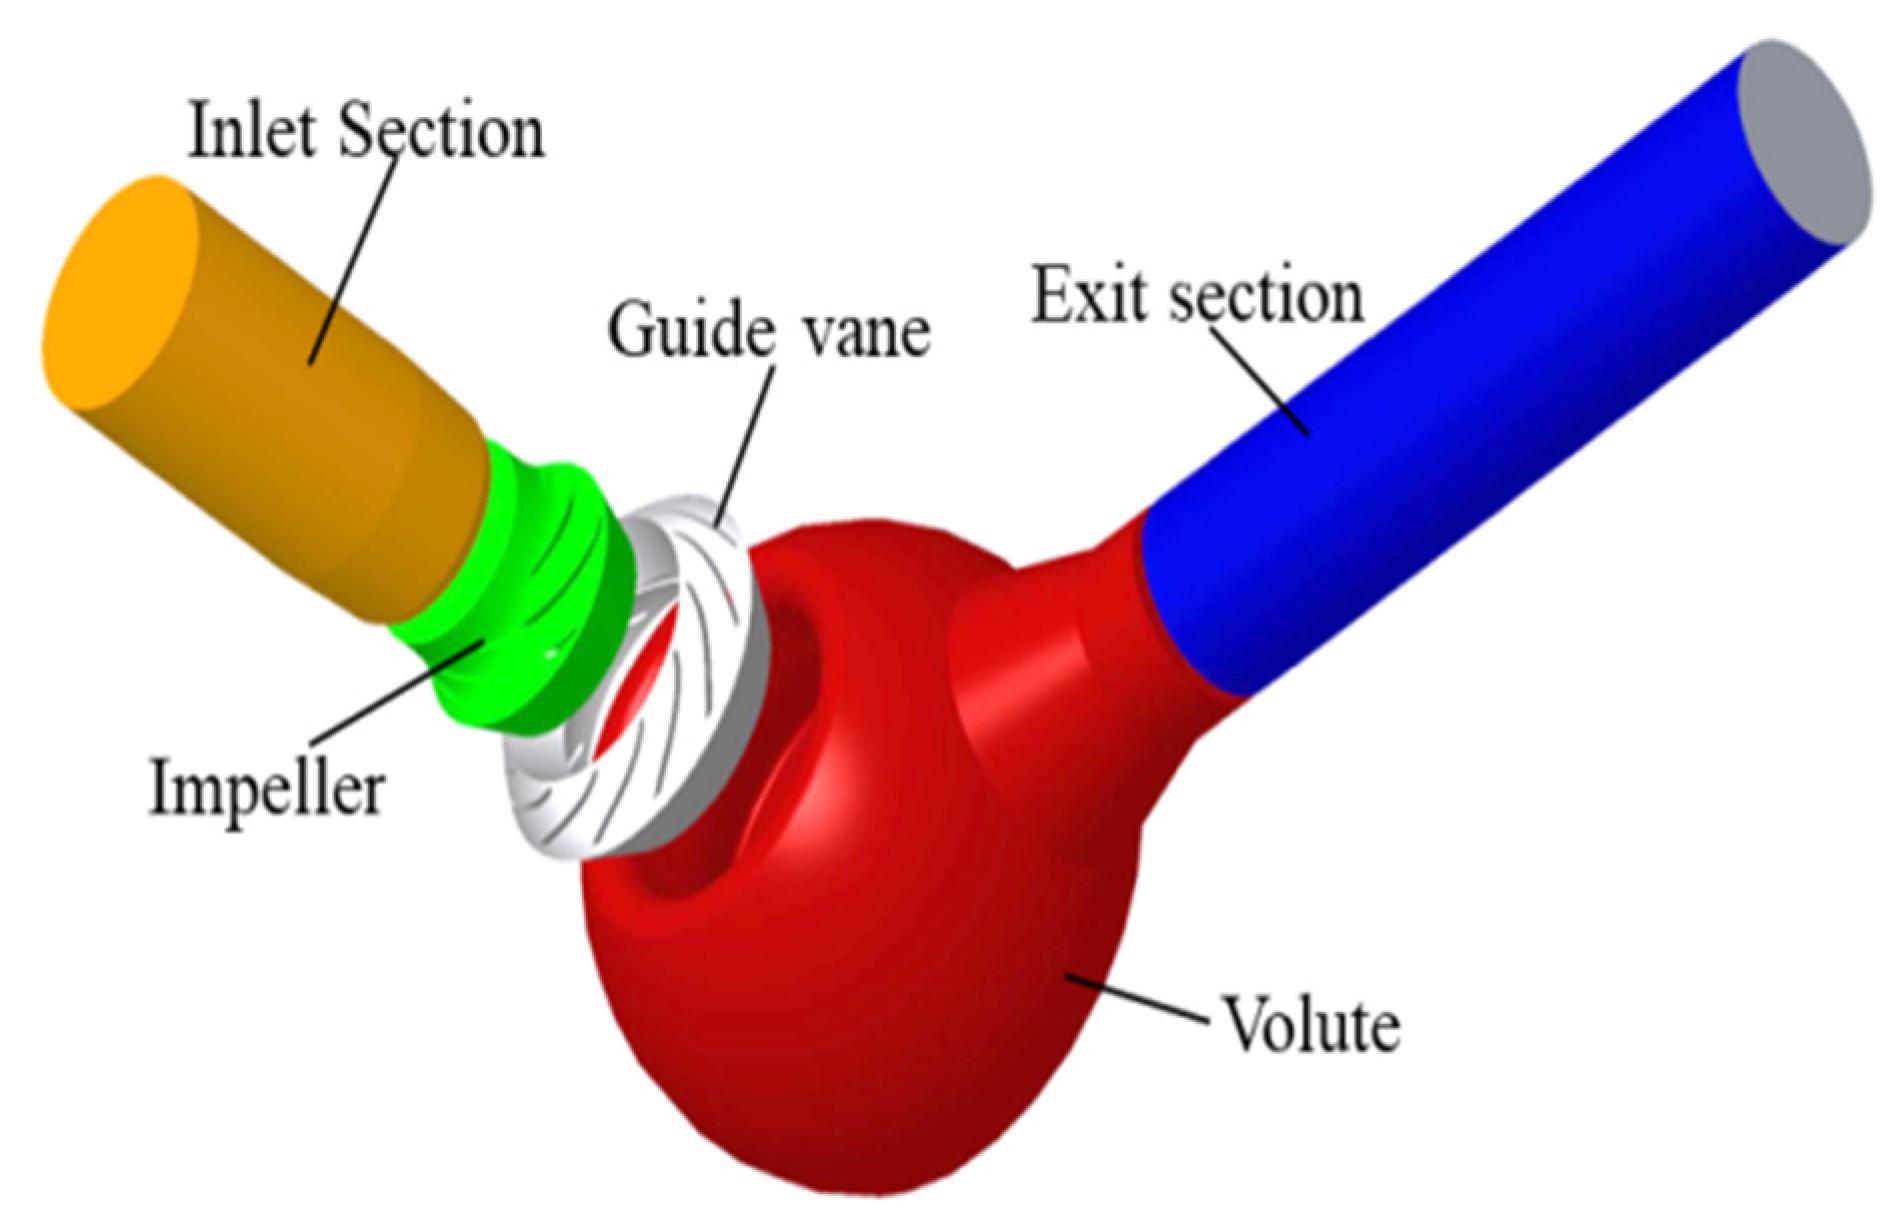
2.1. Research Objects

In order to obtain stable calculation results, the inlet and outlet were extended, and the extension length was greater than three times the inlet and outlet diameter. Considering the pressure-bearing capacity of the RCP, the pressurized water chamber was designed with a spherical shape. The computational fluid domain three-dimensional model is shown in Figure 2. The fluid domain model includes the inlet section, impeller, guide vane, pressurized water chamber, and outlet section. Basic parameters of the RCP are shown in Table 1. Refer to Ye [20] for specific parameters studied using the RCP model.

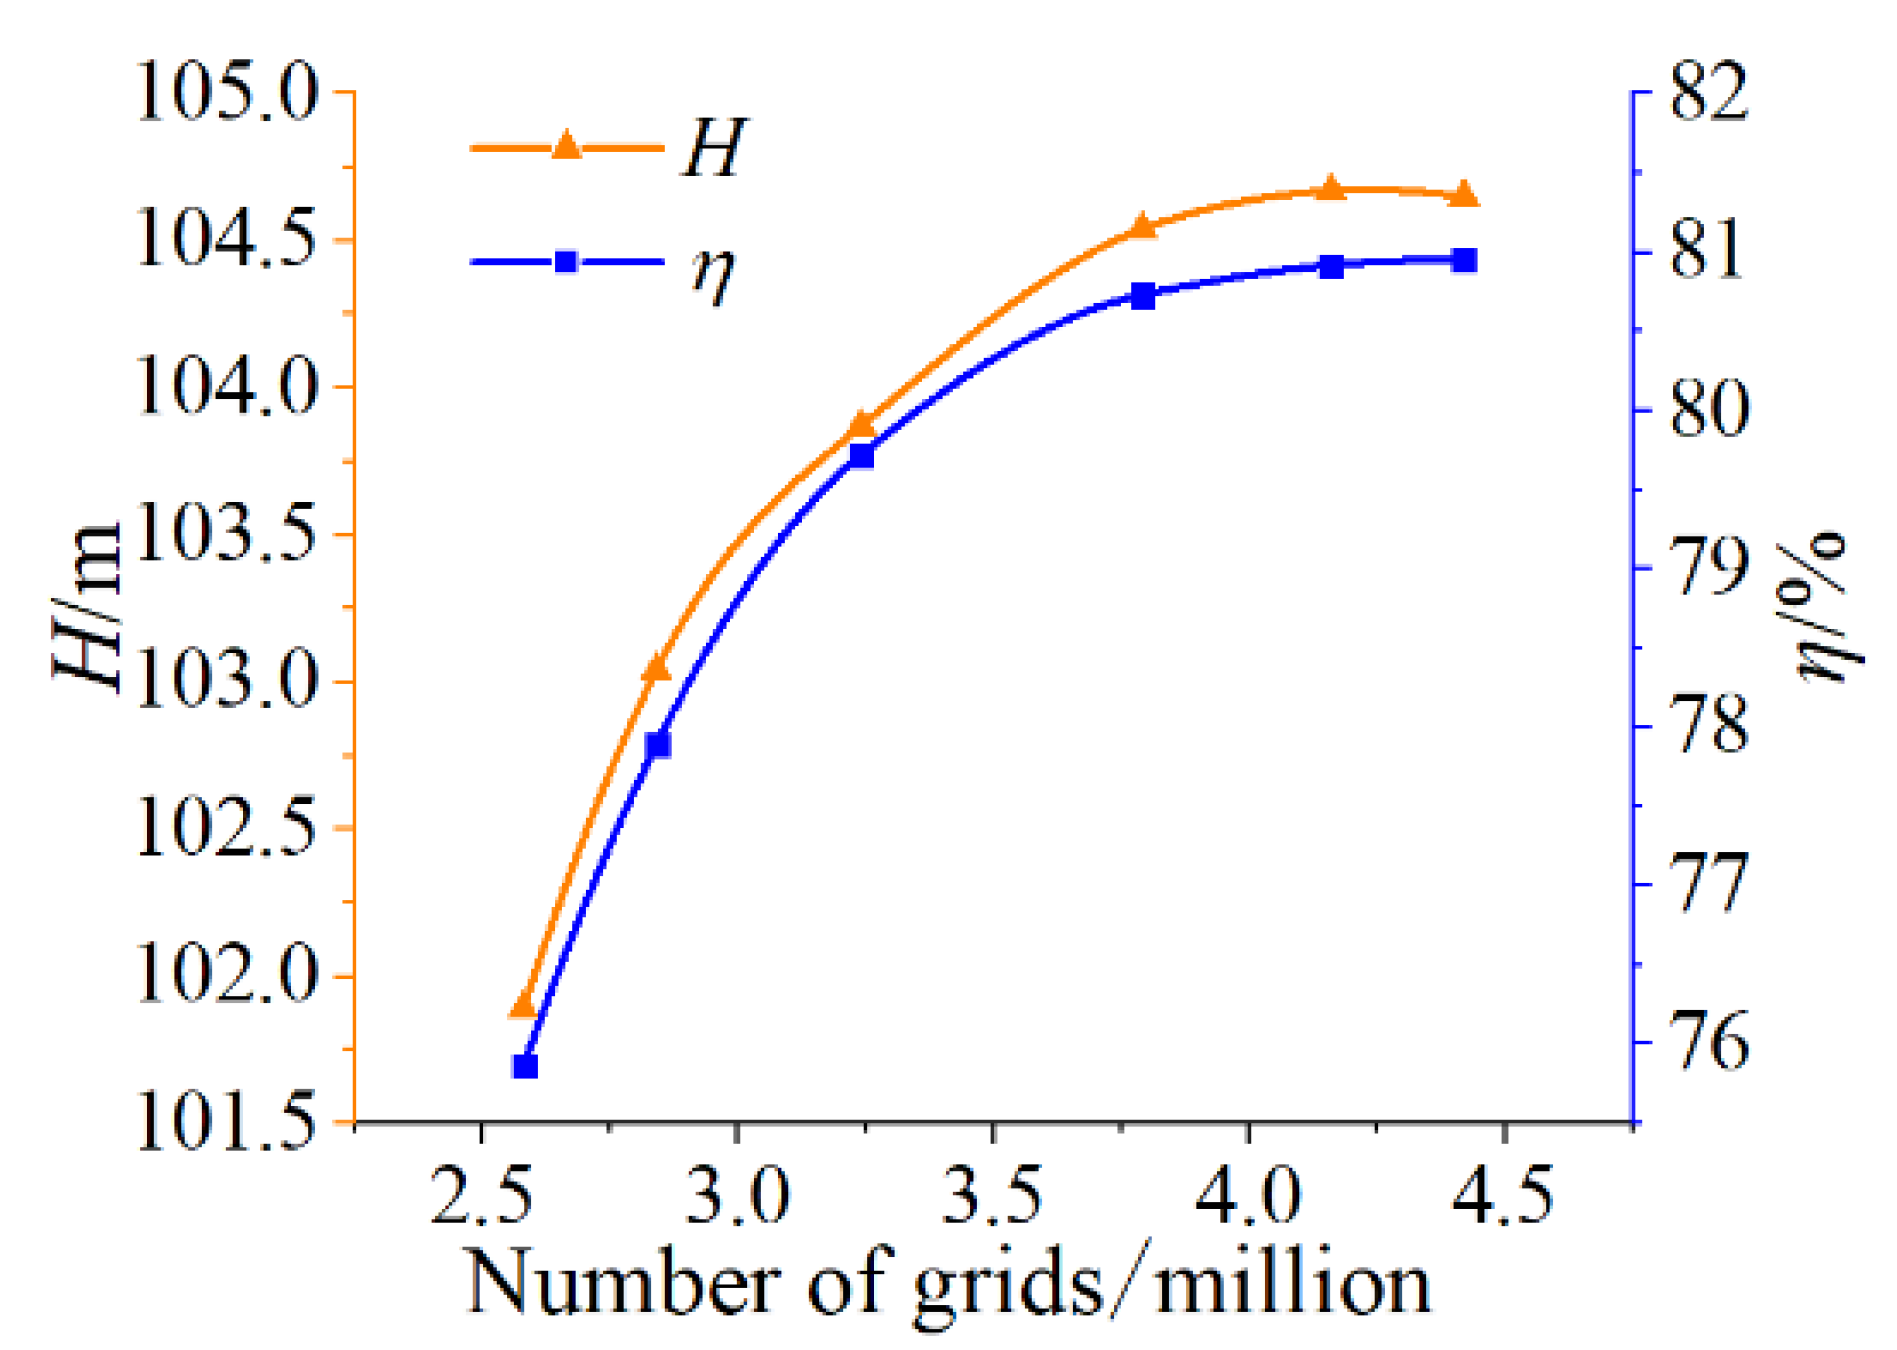
2.2. Meshing of Reactor Coolant Pump

ANASYS-ICEM was used to generate hexahedral structured grids of flow passage of the RCP. The near wall, blade inlet–outlet, and pressurized water chamber tongue of the flow domain were encrypted, and details are shown as Figure 3. The grid density has a great influence on the calculation results, and the grid independence verification is necessary. Figure 4 shows the variation law of the head (H) and efficiency (η), after comparison between numerical simulation and experimental data; when the number of grids reaches 4.1 million, the influence of grid increase on the head and efficiency becomes smaller. Considering the calculation resources comprehensively, the number of grids is finally determined to be 4.17 million, of which the grid numbers of the impeller, guide vane, and pressurized water chamber were 1.28 million, 1.16 million, and 920 thousand, respectively.

2.3. Boundary Conditions
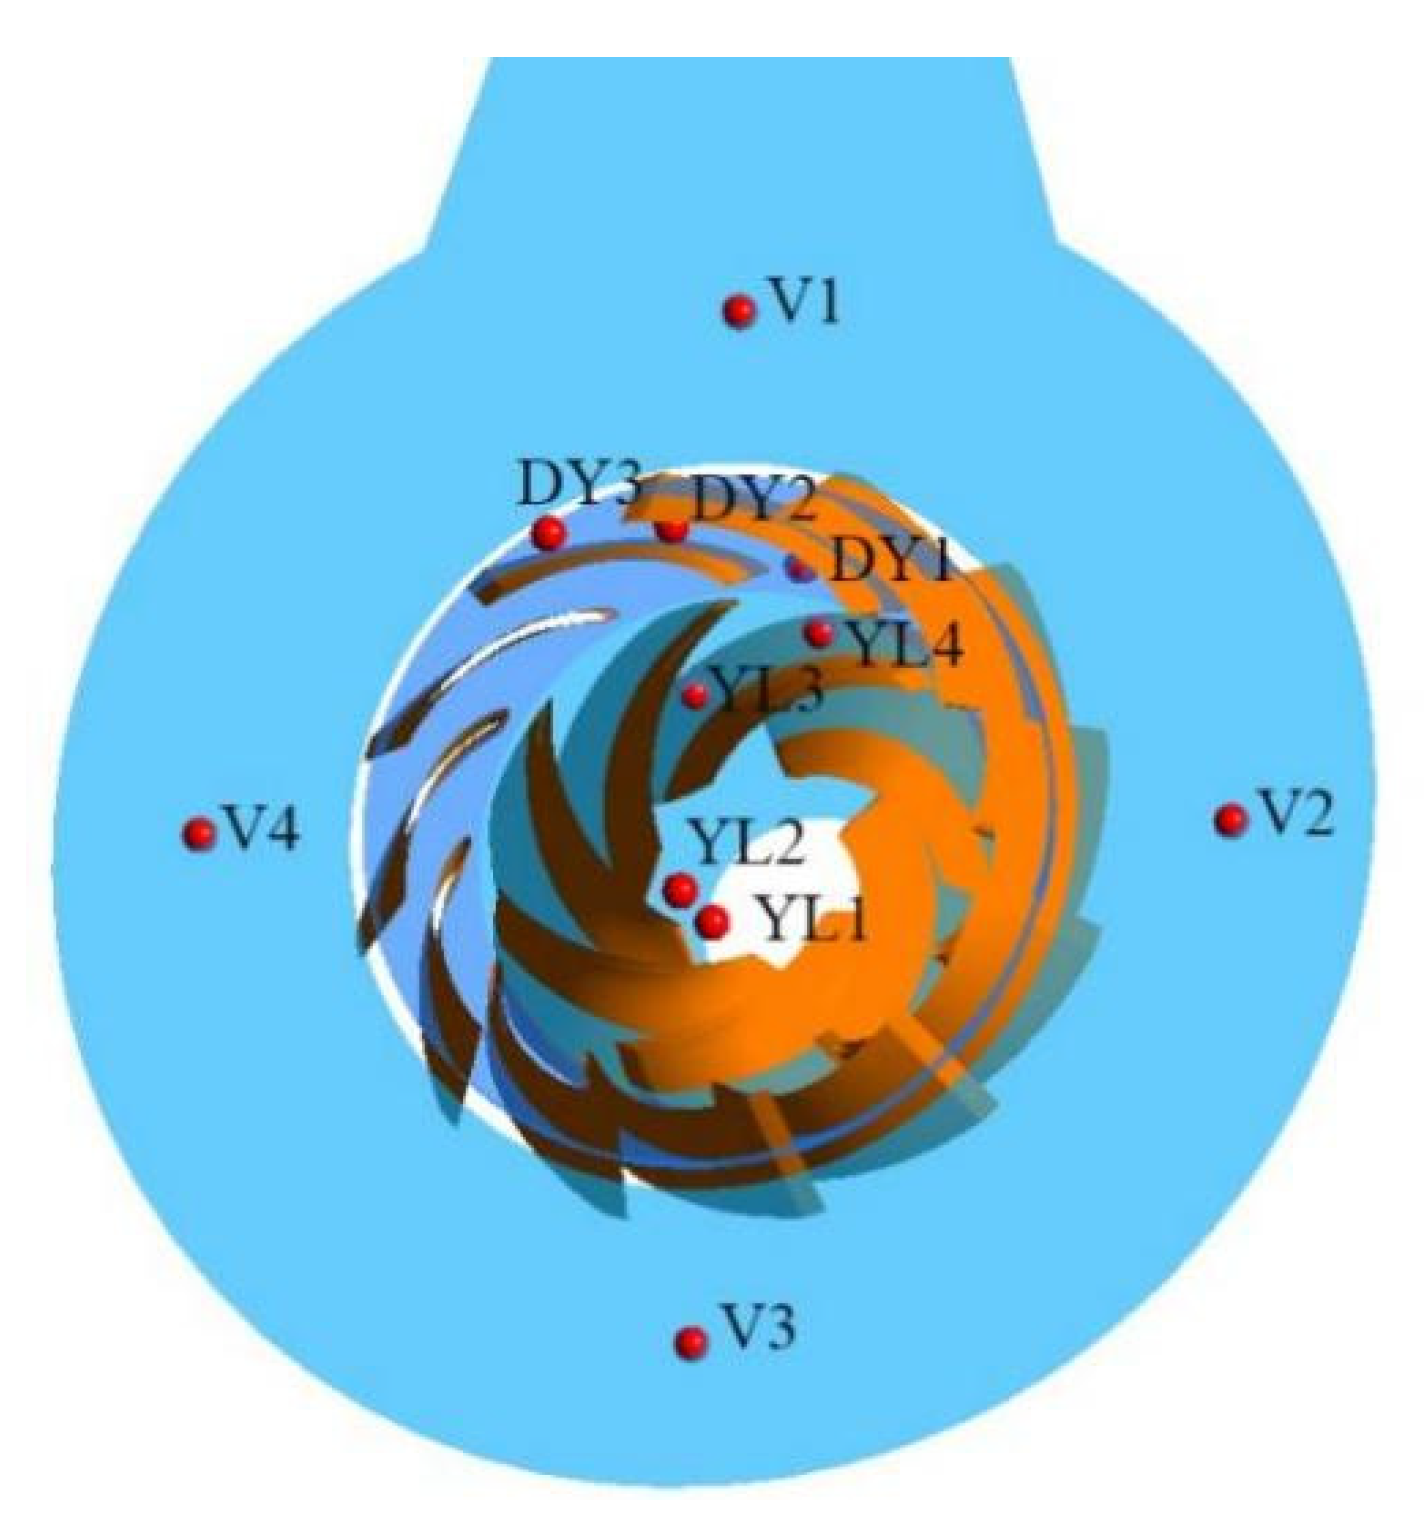
ANSYS-CFX commercial software code was used for numerical simulation, and the inlet section, guide vane, pressurized water chamber, and outlet section were set as the static system. The impeller was set to a rotating coordinate system. The static and dynamic basin boundary grid were set as the static and dynamic interface. The RCP started the flow coast-down condition from the normal operating condition at 90 s, and the total calculation time was 220 s. The inlet was set as the mass flow inlet condition, and the outlet was set as the pressure outlet at 16 MPa. The flow rate used the mathematical model of Formula (1) [20].
Q = 2604.76 75.74 × t + 0.92 × t 2 0.00584 × t 3 + 2.06 × 10 5 × t 4 3.79 × 10 8 × t 5 + 2.86 × 10 11 × t 6
Rotational speed condition using Formula (2):
n = 58386 1762.53 × t + 21.34 × t 2 0.13 × t 3 + 3.82 × 10 4 × t 4 4.51 × 10 7 × t 5
where Q is the ratio of transient flow to design flow, %; n is rotational speed, r/min; and t is time, s.
Through Formulas (1) and (2), it can be concluded that when the time point of half flow (flow reduced to 50% of rated flow) was 105.93 s, the pressure pulsation of the RCP under flow coast-down condition was analyzed by comprehensively considering the four working conditions selected at 90.00 s, 95.90 s, 105.93 s, and 127.73 s (flow rate was reduced to Q0,0.75, Q0,0.5, Q0,0.25, and Q0, respectively. The rotational speeds were 1485.0 r/min, 1078.6 r/min, 680.5 r/min, and 361.1 r/min, respectively). For the convenience of description, the concept of the time of flow coast-down TQi was introduced here, that is, the time when the percentage flow decreases to a certain value in the flow coast-down process. For example, 0.75 TQi was the time when the flow of the RCP decreased to 75% of the design flow, i.e., 95.90 s. Then, the four working conditions were 1.0 TQi, 0.75 TQi, 0.5 TQi, and 0.25 TQi, respectively. An adiabatic non-slip wall condition was used, and wall roughness was 0.025 mm.
The turbulence model was the RNG k-ε model as the optimization form of the k-ε model. Initial flow rate and initial speed of each operating condition were used as conditions for steady calculation, and then steady calculation results were used as initial conditions for transient calculation. Comparing the lift and efficiency of three turbulence models with the test data under idling condition, it is concluded that RNG k-ε model is the most consistent with the test data shown in Figure 5. The RNG k-ε model has good reliability for dealing with unsteady flow in the RCP. Five cycles were calculated, and the last cycle was taken for analysis with a total of 120 time steps. Residual converged to 1 × 10⁻⁶. Fluid density was 742 kg/m3. Convergence control was set as a single time step minimum iteration of 20 times and maximum iteration of 40 times.

2.4. Monitor Points

In order to monitor the pressure pulsation of different passages under different conditions, monitoring points YL1, YL2, YL3, YL4 and DY1, DY2, DY3 were set. A monitoring point was set every 90 degrees from the middle of the flow channel of the pressurized water chamber to the outlet, labeled V1, V2, V3, and V4. These monitoring points were located in the middle of the passage. The location of monitoring points is shown in Figure 6.

2.5. Pressure Pulsation Analysis Methods

To better analyze the pressure pulsation, a pressure coefficient Cp was introduced, which can be expressed following Long [29]:
C p = Δ P 1 2 ρ u 2 2 u 2 = n π D 2 60
where ΔP is the difference between static pressure and average pressure, Pa; u2 is the circumferential speed of impeller outlet, m/s; and D2 is impeller outlet diameter, m.
The instantaneous pressure signal obtained by post-processing was converted into the pressure pulsation coefficient, and then the converted pressure pulsation signal was processed through one-dimensional continuous wavelet transform to obtain the time–frequency characteristics of pressure pulsation.
The basic principle of one-dimensional continuous wavelet transform was defined as follows [25]:
F ( a , b ) = + f ( t ) ψ ( t ; a , b ) d t
The wavelet basis function ψ is obtained by the translation and expansion of the standard wavelet basis function, and its expression was defined as follows:
ψ ( t ; a , b ) = 1 a ψ ( t b a )
where a is the expansion factor and b is the translation factor. The Morlet wavelet was selected in this study, and the wavelet order was 6. Morlet wavelet expression was defined as follows:
ψ ( t ) = 1 π 4 cos ( k t ) e t 2 2

3. Results and Discussion

3.1. Pressure Pulsations in Impeller

Figure 7 shows the pressure pulsation time-domain characteristics of monitoring points YL1~YL4 of the impeller at different operating conditions in the flow coast-down process. As shown in Figure 7, at the beginning of flow coast-down, there is obvious pulsation in the pressure coefficient of the impeller. The pressure pulsates violently. At the 1.0 TQi of flow coast-down, the pressure coefficients of YL3 and YL4 are similar, and the values of the pressure coefficients are similar at each time point. The pressure coefficient of YL1 fluctuates more violently than other monitoring points in the impeller, which may be caused by the influence of the impeller inflow. Compared with YL1 and YL3, the pressure coefficients of YL2 and YL4 are significantly higher at 1.0 TQi and 0.75 TQi. The pressure coefficient of YL1 at the impeller inlet decreases fastest from 0.75 TQi to 0.5 TQi, and the average change in the pressure coefficient in each stage is 32.72%, 14.9%, and 21.16%. The pressure coefficient of YL2 at the inlet of the impeller blade passage lowered the fastest from 0.75 TQi to 0.5 TQi, and the average change in the pressure coefficient in each stage is 19.59%, 44.51%, and 29.32%. The average pressure coefficients of YL3 in the middle of the impeller blade passage change by 42.2%, 40.66%, and 16.96%. The pressure coefficient of YL4 at the impeller outlet decreases fastest from 0.75 TQi to 0.5 TQi, and the average change in the pressure coefficient in each stage is 35.29%, 64.52%, and 13.23%. The pressure coefficient at each monitoring point of the impeller passage decreases gradually, and the closer to the outlet pressure coefficient of the impeller, the faster it decreases. When flow coast-down runs to 0.5 TQi, the values of the transient pressure coefficients at each monitoring point of the impeller gradually close.
Figure 8 shows the pressure pulsation wavelet spectrum of monitoring points YL1~YL4 of the impeller at different operating conditions during flow coast-down. Legends on the right side of each subgraph are wavelet intensities. Obvious time–frequency characteristics can be observed from each wavelet spectrum. Since the impeller speed gradually decreases with the progress of flow coast-down, the pass frequency fDPF (fDPF = nZd/60, n is impeller speed, Zd is the number of guide vane blades) in the impeller will decrease with the decrease in the speed. The initial pass frequency of the impeller at the four working conditions is 297 Hz, 215.7 Hz, 136.1 Hz, and 72.2 Hz. Figure 7 shows that the variation trend of the wavelet intensity from YL1 to YL3 decreases linearly with the time of the flow coast-down, while YL4 has a slight increase at the 0.25 TQi condition. At the 1.0 TQi condition, the pressure pulsation intensity of YL2~YL4 is significantly stronger than that of YL1 at the impeller inlet, and the pressure pulsation increases first and then decreases along the impeller passage. In the 42~120 Hz band of YL2 and 42~100 Hz band of YL3, there are two signals, one high and one low, which are indicated by the arrows in the second and third rows of Figure 8. At this time, the area is around 1/3 fDPF-1.0. This may be due to the occurrence of flow coast-down, which makes the passage similar to a water hammer and then destroys the axial vortices in the impeller passage [22]. This results in a low-frequency response to pressure pulsations in the impeller blade passage. At this time, there are seven obvious wavelet peaks and troughs in the response of the impeller blade passage YL2~YL4 at 960~1440 Hz (greater than 3 fDPF-1.0). At the 0.75 TQi condition, the pressure pulsation value approximates the high-frequency wavelet response frequency band of YL3 and YL1, and the main frequency band is 215~860 Hz (fDPF-0.75~4 fDPF-0.75), which is significantly smaller than YL2 and YL4. At this time, the wavelet response of the impeller passage in the low-frequency band is mainly low intensity, only there is more than 0.006 wavelet response at 70~100 Hz of YL2, and the wavelet response in this frequency band gradually decreases with the direction of passage, which indicates that a similar water hammer phenomenon in the impeller passage gradually disappears after 0.75 TQi. At the 0.5 TQi condition, the wavelet intensity response of YL1 and YL2 at the impeller inlet is more obvious than that of YL3 and YL4 at the impeller outlet, in which the wavelet response of the YL2 high-frequency pulsation is the strongest, and the pressure pulsation value weakens approaching the impeller outlet. The wavelet intensity response of the pressure pulsation in the low-frequency band of the impeller shows a change rule that first decreases, then increases, and then decreases along the passage. These two phenomena show that the inflow impact has a significant effect on the pressure pulsation in the impeller passage at this time, which enhances the high-frequency pressure pulsation at the impeller blade inlet and reduces the low-frequency pressure pulsation at the impeller blade inlet. At the 0.5 TQi condition, the main frequency band of the low wavelet intensity response is 56~113 Hz, which is significantly less than the initial impeller pass frequency at 0.5 TQi, between two times the rotating frequency and five times the rotating frequency. At 0.25 TQi, the pressure pulsation intensity in the impeller tends to be basically stable, but the high-frequency response area of YL1 at the impeller inlet is obviously larger than other monitoring points, which means that the pressure pulsation intensity at YL1 is stronger. At this time, the wavelet response frequency band is 216~360 Hz, which is greater than 3 fDPF-0.25. Figure 8 shows that at different times of flow coast-down in the same position, the proportion of the high-frequency high-wavelet intensity region gradually decreases and that of the low-frequency region gradually increases. According to the analysis of the vortex intensity distribution in the impeller under various times of flow coast-down shown in Figure 9, this may be because with the decrease in flow, the phenomena such as backflow and flow separation in the channel decrease, resulting in the increase in low-frequency pulsation. The overall wavelet strength of the impeller decreases gradually with the development of flow coast-down.

3.2. Pressure Pulsations in Guide Vane

Figure 10 shows the pressure pulsation time-domain characteristics of monitoring points DY1~DY3 of the guide vane at various operating conditions in the flow coast-down process. At 1.0 TQi, the pressure coefficient in the guide vane is at a high value. With the progress of flow coast-down, the pressure coefficient decreases gradually. The pressure coefficient of DY1 at the guide vane inlet decreases fastest from 0.75 TQi to 0.5 TQi, which indicates that the pressure pulsation in this period is strong, and the pressure coefficient decreases on average by 45.75%, 69.06%, and 7.94% in each stage. The pressure coefficient of DY2 in the middle of the guide vane decreases fastest from 0.5 TQi to 0.25 TQi, and the pressure coefficient decreases on average by 50.37%, 16.34%, and 68.69% in each period. The pressure coefficient of DY3 at the guide vane outlet decreases smoothly, with an average decrease of 48.29%, 44.91%, and 41.11% in each period. This may be due to the influence of the pressurized water chamber watershed on the guide vane outlet area, which results in strong pressure pulsation during flow coast-down. From this analysis, the work area in the guide vane may transfer from the guide vane outlet to the guide vane inlet with flow coast-down, and the diffuser capacity gradually decreases; finally, the pressure pulsation in the guide vane tends to a relatively stable state. During the entire flow coast-down process, the pressure pulsation in the guide vane changes more closely with the pressure pulsation at the guide vane outlet, which may be caused by the influence of the pressurized water chamber at the guide vane outlet.
Figure 11 shows the pressure pulsation wavelet spectrum of monitoring points DY1~DY3 of the guide vane at different operating conditions during flow coast-down. The pass frequency fBPF (fBPF = nZi/60, Zi is the number of impeller blades) in the guide vane is similar to that in the impeller and decreases with the speed. The initial pass frequencies of the guide vanes at four working conditions are 173.3 Hz, 125.8 Hz, 79.4 Hz, and 42.1 Hz. The following analysis results can be obtained from Figure 11. The variation trend of the wavelet intensity at the guide vane inlet, middle, and outlet is similar to that at the impeller and decreases linearly with the time of the flow coast-down, but the wavelet intensity in the guide vane is significantly higher than that in the impeller at different conditions, which is related to the function of the guide vane. At 1.0 TQi, there are seven obvious wavelet peaks and troughs at each monitoring point in the high-frequency band, showing obvious regularity. Compared with other monitoring points in the pressurized water chamber, the wavelet regularity of DY1 is stronger and the pressure pulsation is more obvious. This may be due to the severe influence of rotor–stator interaction at DY1. The wavelet intensity at DY2 is the strongest, but its pulsation intensity is significantly lower than that at the guide vane inlet DY1 and guide vane outlet DY3. The pressure pulsation decreases first and then increases along the guide vane passage. At this time, DY1~DY3 of each monitoring point in the guide vane flow channel shows the wavelet response indicated by the arrow in the first column of Figure 10 in the 24~120 Hz band, 48~96 Hz band, and 24~120 Hz band of the wavelet spectrum respectively, and the low-frequency band of DY2 has the most obvious wavelet response. This may be due to DY2 being at the edge of the vortex at the guide vane inlet, which causes the low-frequency pulsation to become stronger. Compared with DY1 and DY2, the low-frequency wavelet response of DY3 includes not only the main response indicated by the arrows but also the weak low-frequency wavelet response on the left side. This is due to the effect of the pressurized water chamber housing at the guide vane outlet. At 0.75 TQi, the seven wavelet peaks and troughs at each monitoring point of the guide vane in the high-frequency band are no longer obvious when they are compared with 1.0 TQi, and the high-frequency band wavelet peaks and troughs of DY1 have been destroyed. Compared with 1.0 TQi, DY1 has a lower intensity wavelet response in the low-frequency band less than 125.8 Hz (less than the initial pass frequency fBPF-0.75 at this time). In the low-frequency band of DY2, seven more obvious wavelet intensity responses, which are equal to the number of impeller blades, appear as indicated in the second row of the subgraph of the second column in Figure 11. The frequency band is around 35 Hz, showing strong regularity, and the high-intensity wavelet response of DY2 at frequencies higher than 125.8 Hz is more obvious than that of the guide vane inlet DY1 and guide vane outlet DY3. This indicates that at this condition the area of the guide vane inlet vortex enlarges and the center of the vortex approaches DY2, which causes the pressure pulsation at DY2 to be affected by the impeller–guide vane dynamic and static interference. The high-frequency pulsation increases and the low-frequency pulsation changes regularly. At this time, the low-intensity wavelet response area of DY3 at 53~215 Hz increases, which indicates that the phenomenon of de-flow or reflux is more obvious in this area. At 0.5 TQi, the wavelet intensity in the guide vane is further reduced; compared with DY2 and DY3, the wavelet intensity at DY1 is the smallest, and the wavelet response is weaker throughout the period. The high-frequency wavelet response of DY2 and DY3 still has obvious regularity. Compared with 0.75 TQi, the regularity of the DY2 wavelet response in the low-frequency band from 0 Hz to124 Hz is destroyed. In Figure 10, in the box selected area of the second row of the subgraph of the third column, seven low-frequency wavelet responses are in two different bands, in which the wavelet response frequency, shown by arrows, is 67 Hz to 124 Hz, between the initial pass frequency of the guide vane under this condition. There are seven obvious low-frequency wavelet responses near 33 Hz of DY3, showing obvious regularity, as shown in the third row of the subgraph selection of the third column of Figure 11. In conjunction with Figure 12, presenting guide vane vortex core development diagrams based on the Q criterion, this indicates that the work area of the guide vane may be in the rear half of the guide vane passage under 0.5 TQi. At 0.25 TQi, the wavelet intensity in the guide vane passage basically tends to be stable, and the high-frequency wavelet response in the guide vane passage has no obvious regularity. At this time, there is a low-frequency wavelet response in the 67~124 Hz frequency band of DY3, and it shows obvious regularity, as indicated by the arrows in the third row of the fourth column of Figure 11. Based on the analysis in Figure 12, this may be because the return flow in this area decreases as the flow rate becomes smaller, while the work area of the guide vane shifts to the vicinity of DY3.

3.3. Pressure Pulsations in Volute

Figure 13 shows the pressure pulsation time-domain characteristics of monitoring points V1~V4 of the pressurized water chamber passage at various points in the flow coast-down process, and the pressure coefficient of V2 and V4 has a similar trend at the 1.0 TQi operating condition. As the flow coast-down progresses, the pressure pulsation of the pressurized water chamber passage tends to be stable, and the pressure pulsation of the pressurized water chamber outlet V1 is always stable. The pressure pulsation of V4 on the left side of the pressurized water chamber shell is always strong, which may be due to the large change in turbulent energy in the left area of the spherical-like pressurized water chamber with the decrease in flow rate, so that the pressure pulsation in the area near V4 is significantly larger than that in other areas [30]. The pressure coefficient of the pressurized water chamber outlet V1 increases first and then decreases with the flow coast-down process. The pressure pulsation decreases most rapidly from 0.75 TQi to 0.5 TQi, which indicates that the pressure pulsation in this period is more obvious than that in other periods. The pressure coefficient decreased by 8.79%, 27.54%, and 5.52% in each period. The pressure coefficient of V2 on the right side of the pressurized water chamber decreases fastest from 1.0 TQi to 0.75 TQi, and the pressure coefficient decreases on average by 41.15%, 27.58%, and 17.29% in each period. The pressure coefficient of V3 far from the outlet area of the pressurized water chamber first decreases and then increases. It decreases fastest from 1.0 TQi to 0.75 TQi, and the pressure coefficient decreases on average by 52.31%, 14.8%, and 40.91% in each period. The pressure coefficient of V4 on the left side of the pressurized water chamber decreases rapidly during the whole flow coast-down process, with an average decrease of 47.83%, 49.93%, and 32.52% in each period. The following conclusions can be drawn from the above data. The pressure pulsation of V4 on the left side of the pressurized water chamber is in a strong state throughout the flow coast-down process, and the pressure pulsation intensity changes dramatically. The pressure pulsation intensity of V1 and V3 changes smoothly.
Figure 14 shows the pressure pulsation wavelet spectrum of monitoring points V1~V4 of the pressurized water chamber at different operating conditions during flow coast-down. At 1.0 TQi, seven obvious wavelet peaks and troughs appear at monitoring points V2, V3, and V4 in the high-frequency band and obvious response rules of wavelet intensity change in the low-frequency band, as indicated by the arrows in the first column of Figure 14. At this time, the regularity of the wavelet response of the three monitoring points is strong. The regularity of the wavelet at V4 is clearer than at other monitoring points; the intensity of the wavelet in each frequency band is the highest, and the pressure pulsation is more obvious. The wavelet intensity of V1 is obviously lower than other monitoring points, and the regularity is extremely different. The pressure pulsation increases first, then decreases, and finally increases along V1~V4. At this time, the pressurized water chamber passage V1~V4 has a wavelet response in the 42~120 Hz band of the wavelet spectrum, as indicated by the arrow in the first column of Figure 14. The low-frequency wavelet response of V2 and V4 is the most obvious. At the 0.75 TQi operating condition, the seven wavelet peaks and troughs of each monitoring point of the guide vane in the high-frequency area are not obvious; only V4 has obvious regularity. Compared with 1.0 TQi, the low-intensity wavelet response of the low-frequency band 42~120 Hz is clearer, in which the regularity of the low-frequency wavelet response of V2 is destroyed. There are obvious wavelet response laws in the frequency band 42~120 Hz far from the inlet end of the pressurized water chamber and the left side of the pressurized water chamber, as shown in the third and fourth rows of the subgraphs of the second column of Figure 14. The frequency band at this location is less than the maximum initial frequency of the guide vane under the four operating conditions and greater than the minimum initial frequency of the guide vane under the four operating conditions. At 0.5 TQi, the intensity of the wavelet in the pressurized water chamber passage is further reduced, and the regularity of the high-frequency wavelet response of the monitoring points in the passage is completely destroyed. The 42 Hz to 120 Hz frequency bands far from the outlet of the pressurized water chamber (V3) and the left side of the pressurized water chamber (V4) still have obvious wavelet response laws as shown in the third and fourth rows of the subgraphs of the third column in Figure 14. At 0.25 TQi, the pressure pulsation intensity in the pressurized water chamber basically tends to stabilize, and the wavelet intensity distribution of each monitoring point is similar to that of the impeller. The proportion of low-frequency wavelet response of V1~V4 is close. It is found that the low-frequency pulsation is the main part in the passage of the pressurized water chamber case at this time. As shown in Figure 14, at the times of the different flow coast-down conditions at the same position, the variation regularities of the wavelet intensity at the outlet of the pressurized water chamber (V1), the right side of the pressurized water chamber (V2), and the left side of the pressurized water chamber (V4) gradually decrease, while the variation regularities of the wavelet intensity at V3 show a trend of decreasing first, then increasing, and finally decreasing. The wavelet intensity transformation of V1 is smooth. The velocity distribution at the outlet of the pressurized water chamber in Figure 15 is analyzed in conjunction with Figure 14. This is because the outlet of the pressurized water chamber is the main area of the return flow in the pressurized water chamber passage, which makes the pressure pulsation here stable. However, compared with the wavelet intensity in the impeller and guide vane, the wavelet intensity in the pressurized water chamber is smaller.

4. Conclusions

In this paper, the pressure pulsation characteristics of an RCP during flow coast-down were analyzed and studied by means of numerical calculation based on wavelet analysis.
(1)
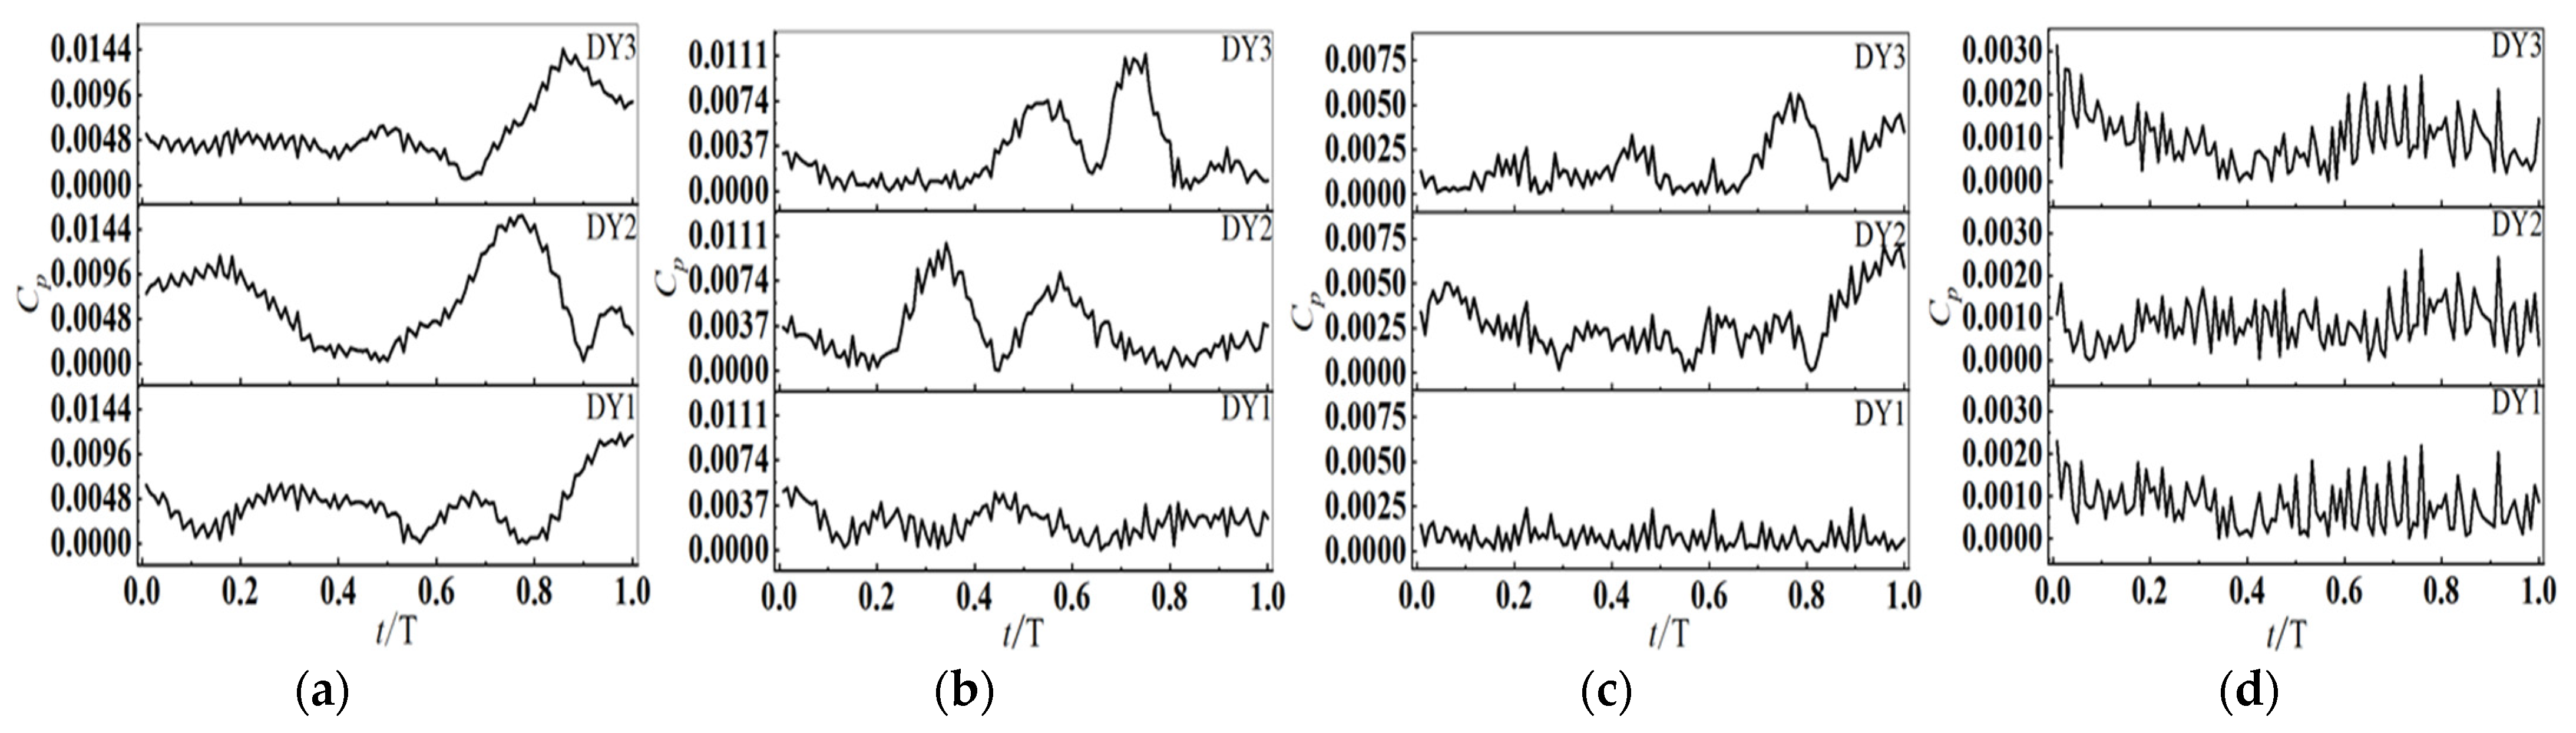
During flow coast-down from 1.0 TQi to 0.75 TQi, the change rate of the pressure ripple coefficient in the middle of the guide vane (DY2) and far from the outlet end of the pressure chamber (V3) is the largest, with the change rate greater than 50%. During the period from 0.75 TQi to 0.5 TQi, the change rate of the pressure fluctuation coefficient at the dynamic–static interface area is the largest (YL4, DY1), which is more than 60%. During the period from 0.5 TQi to 0.25 TQi, the change rate of the pressure fluctuation coefficient in the middle of the guide vane (DY2) is the largest, which reaches 68.69%. As the development of flow coast-down proceeds, the high-frequency pulsation decreases, the low-frequency pulsation increases, and finally the pressure pulsation tends to a smaller stable value.
(2)
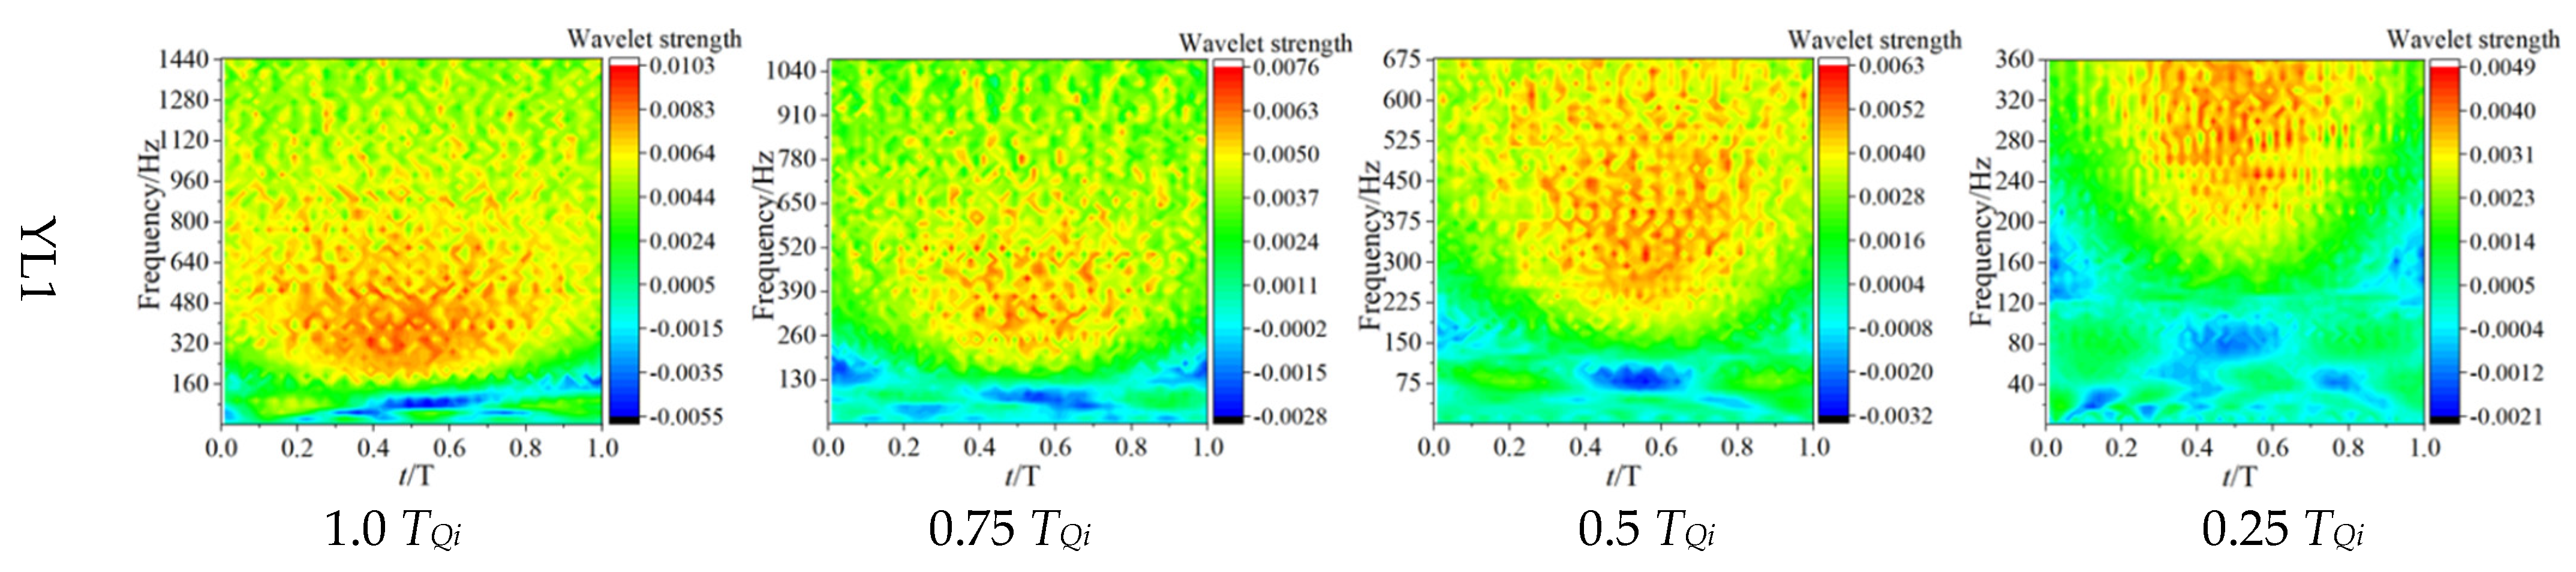
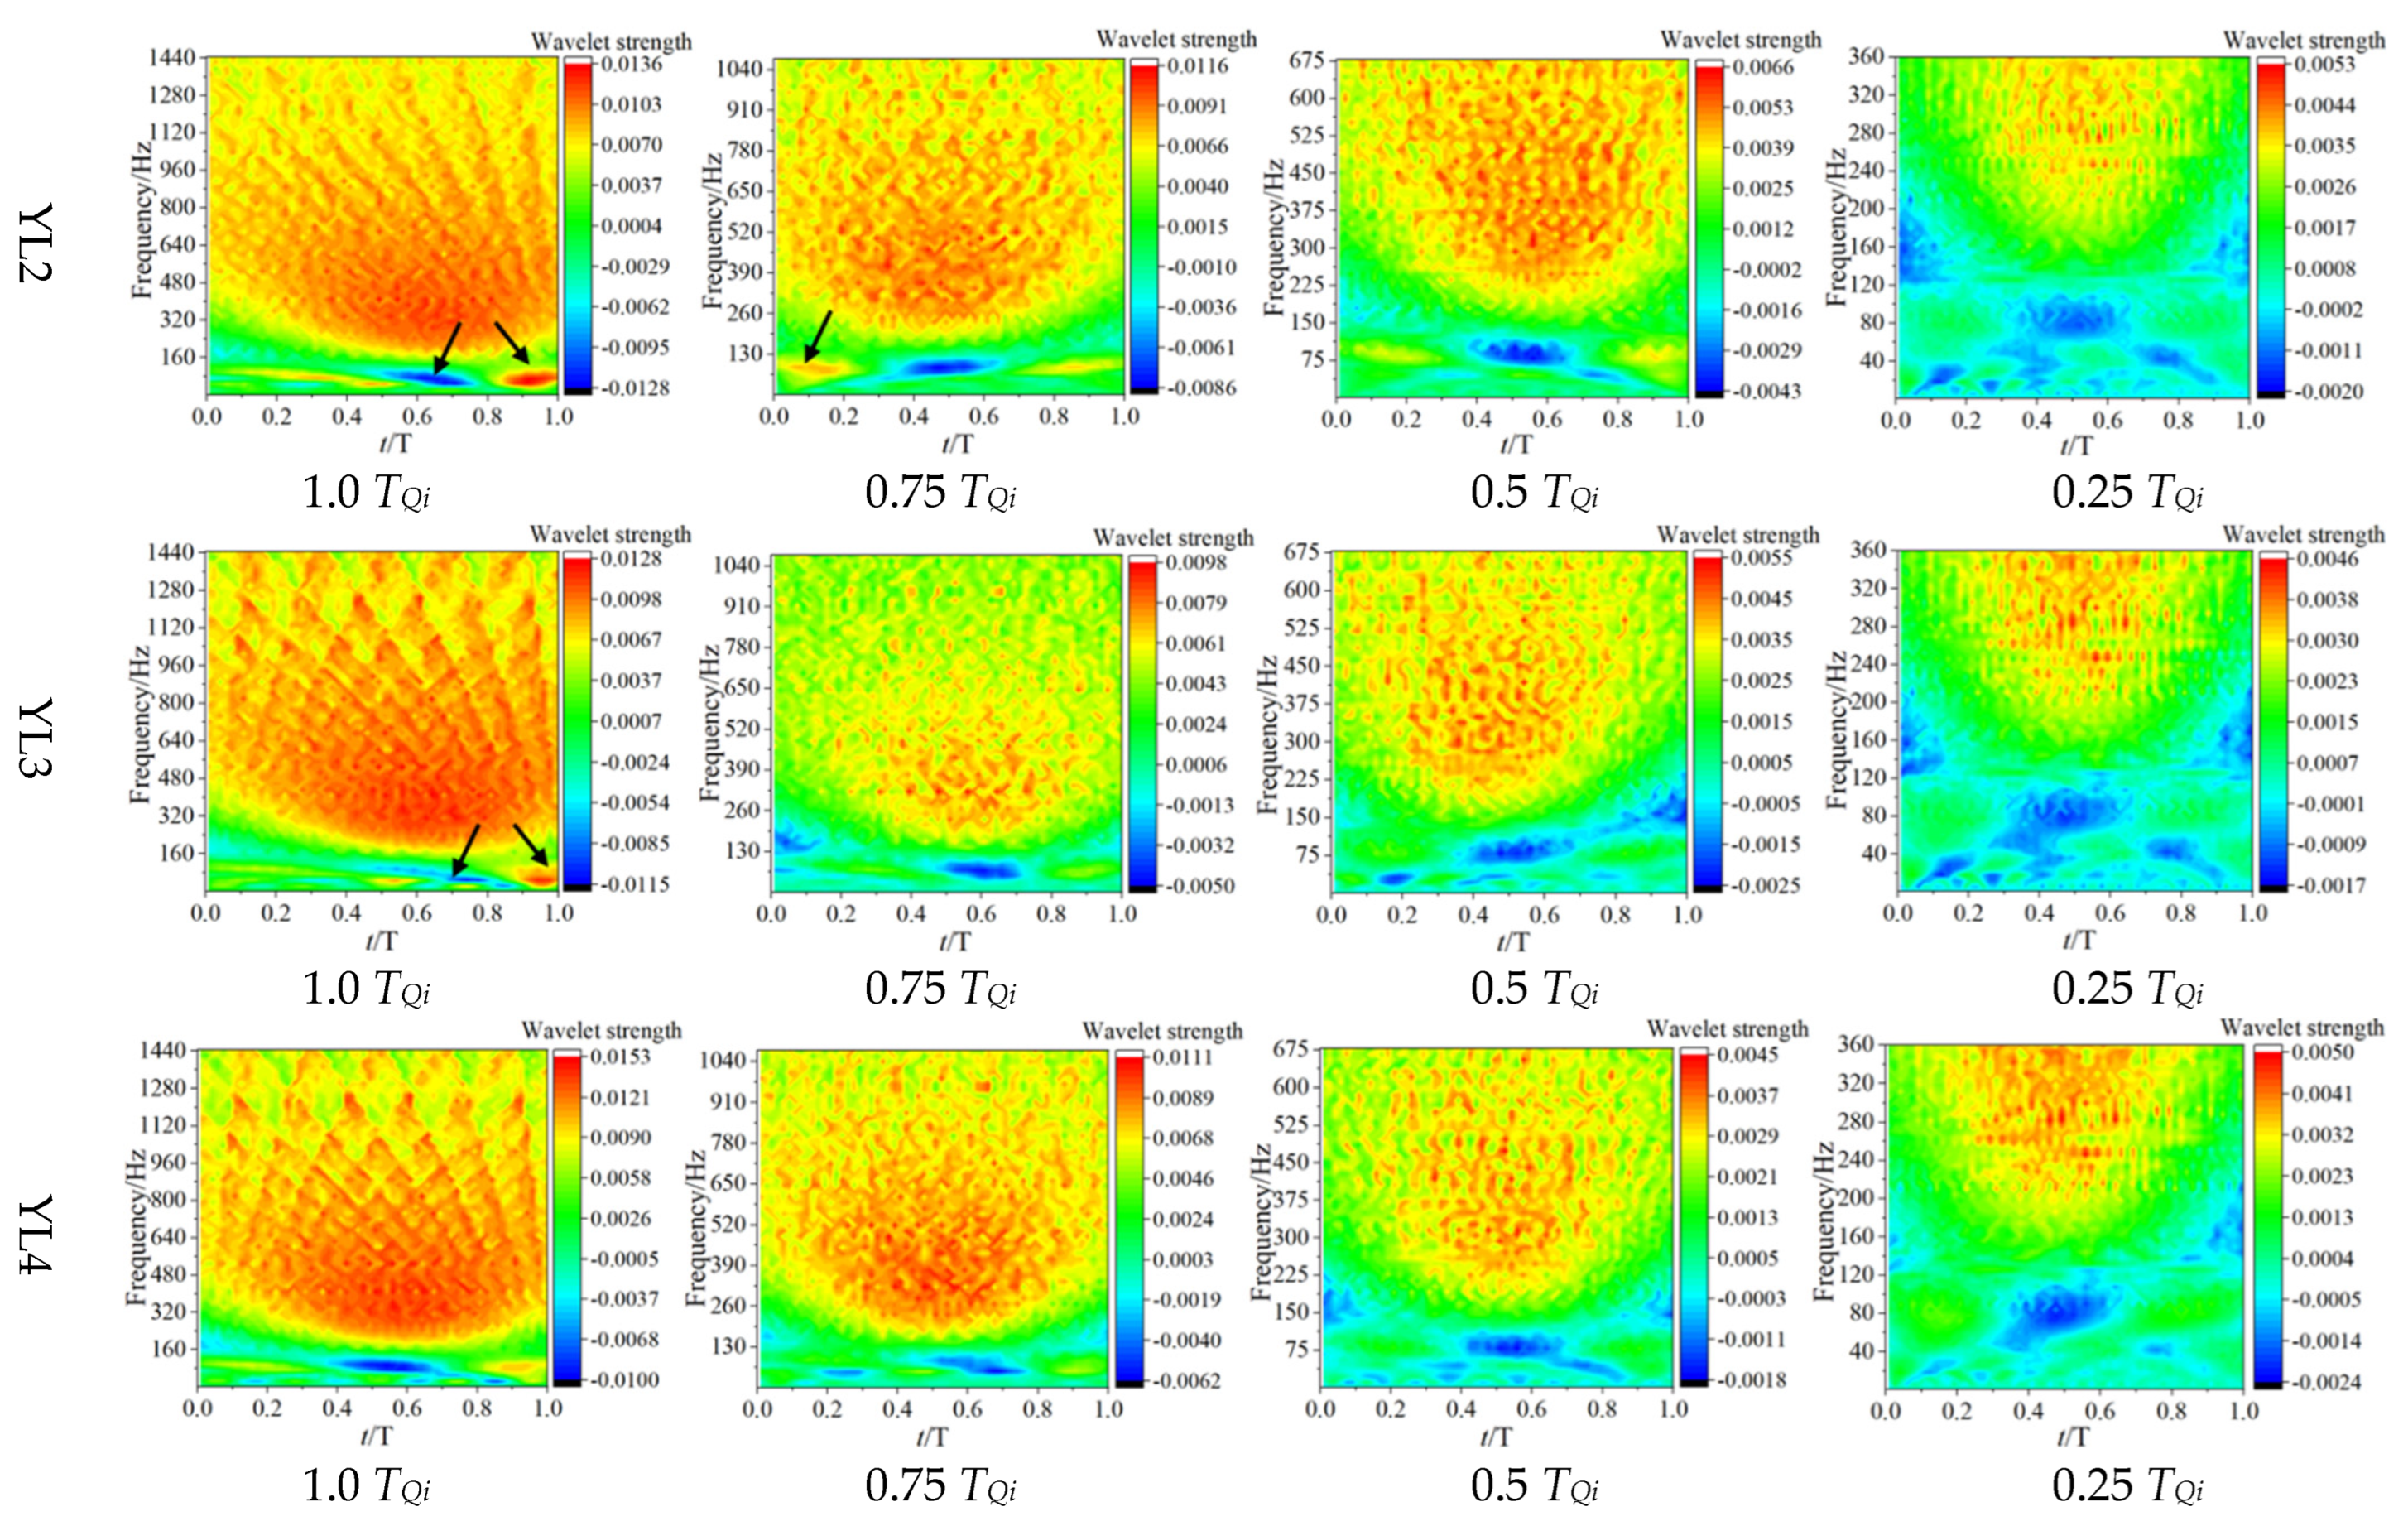
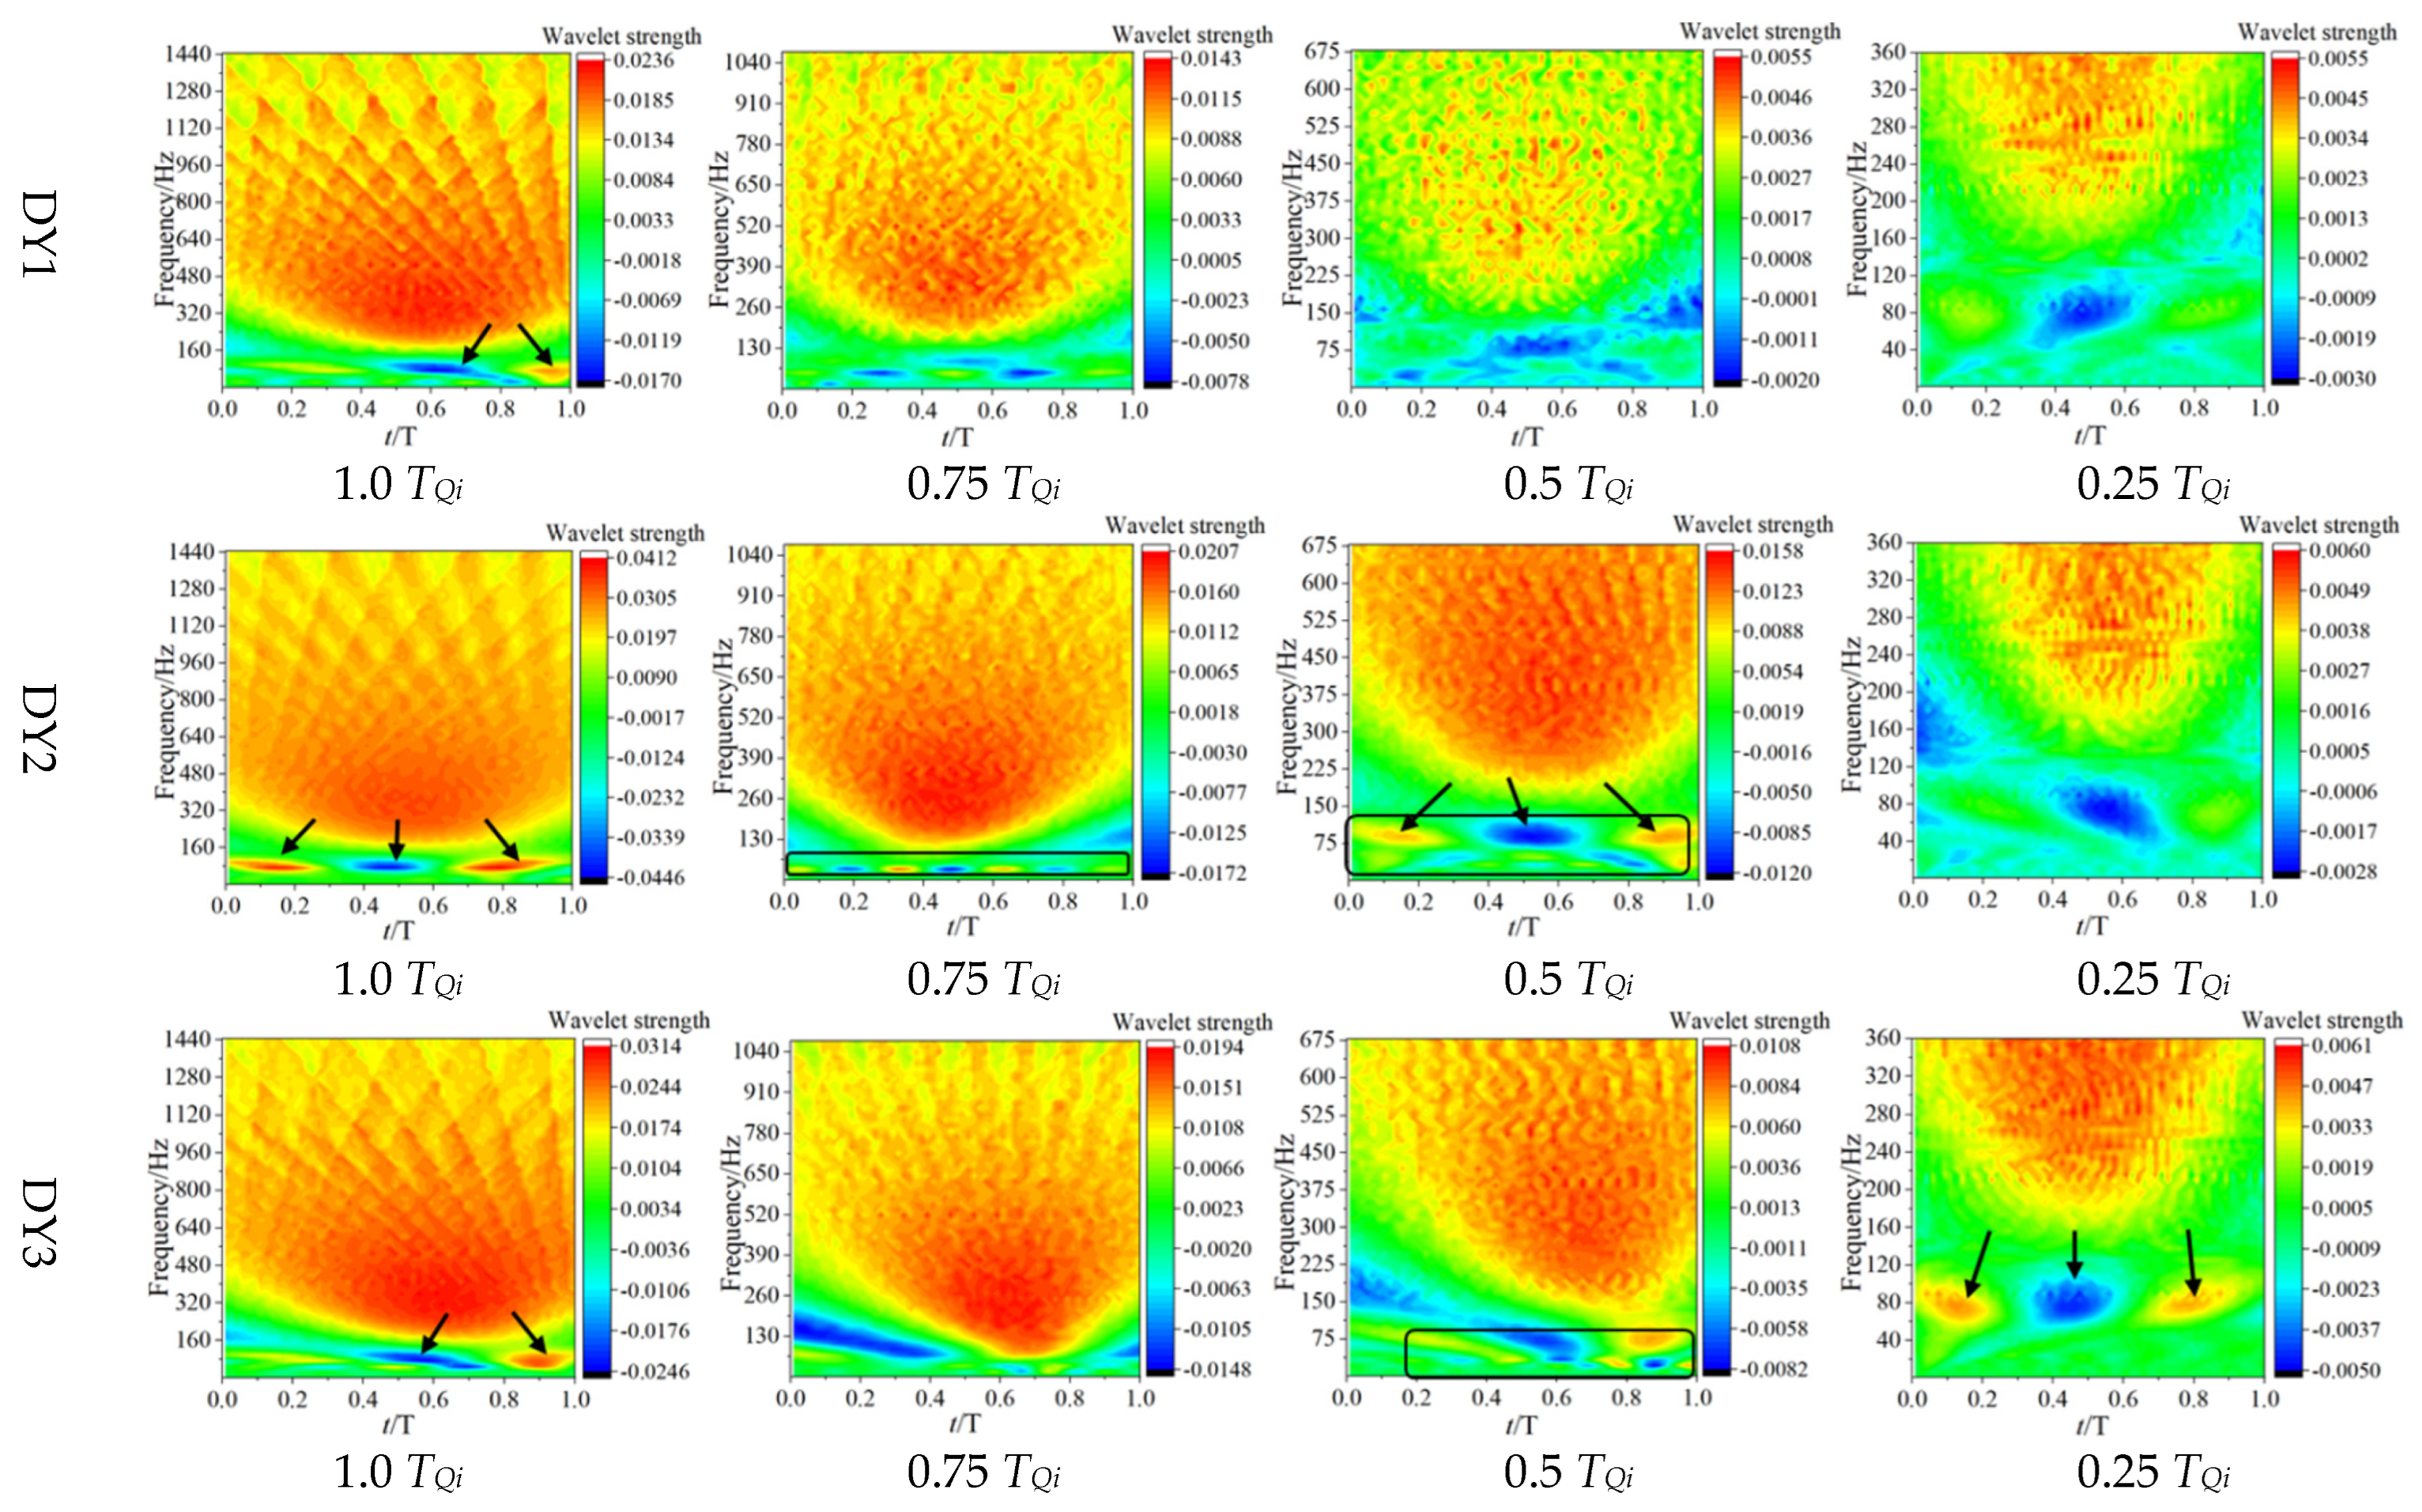
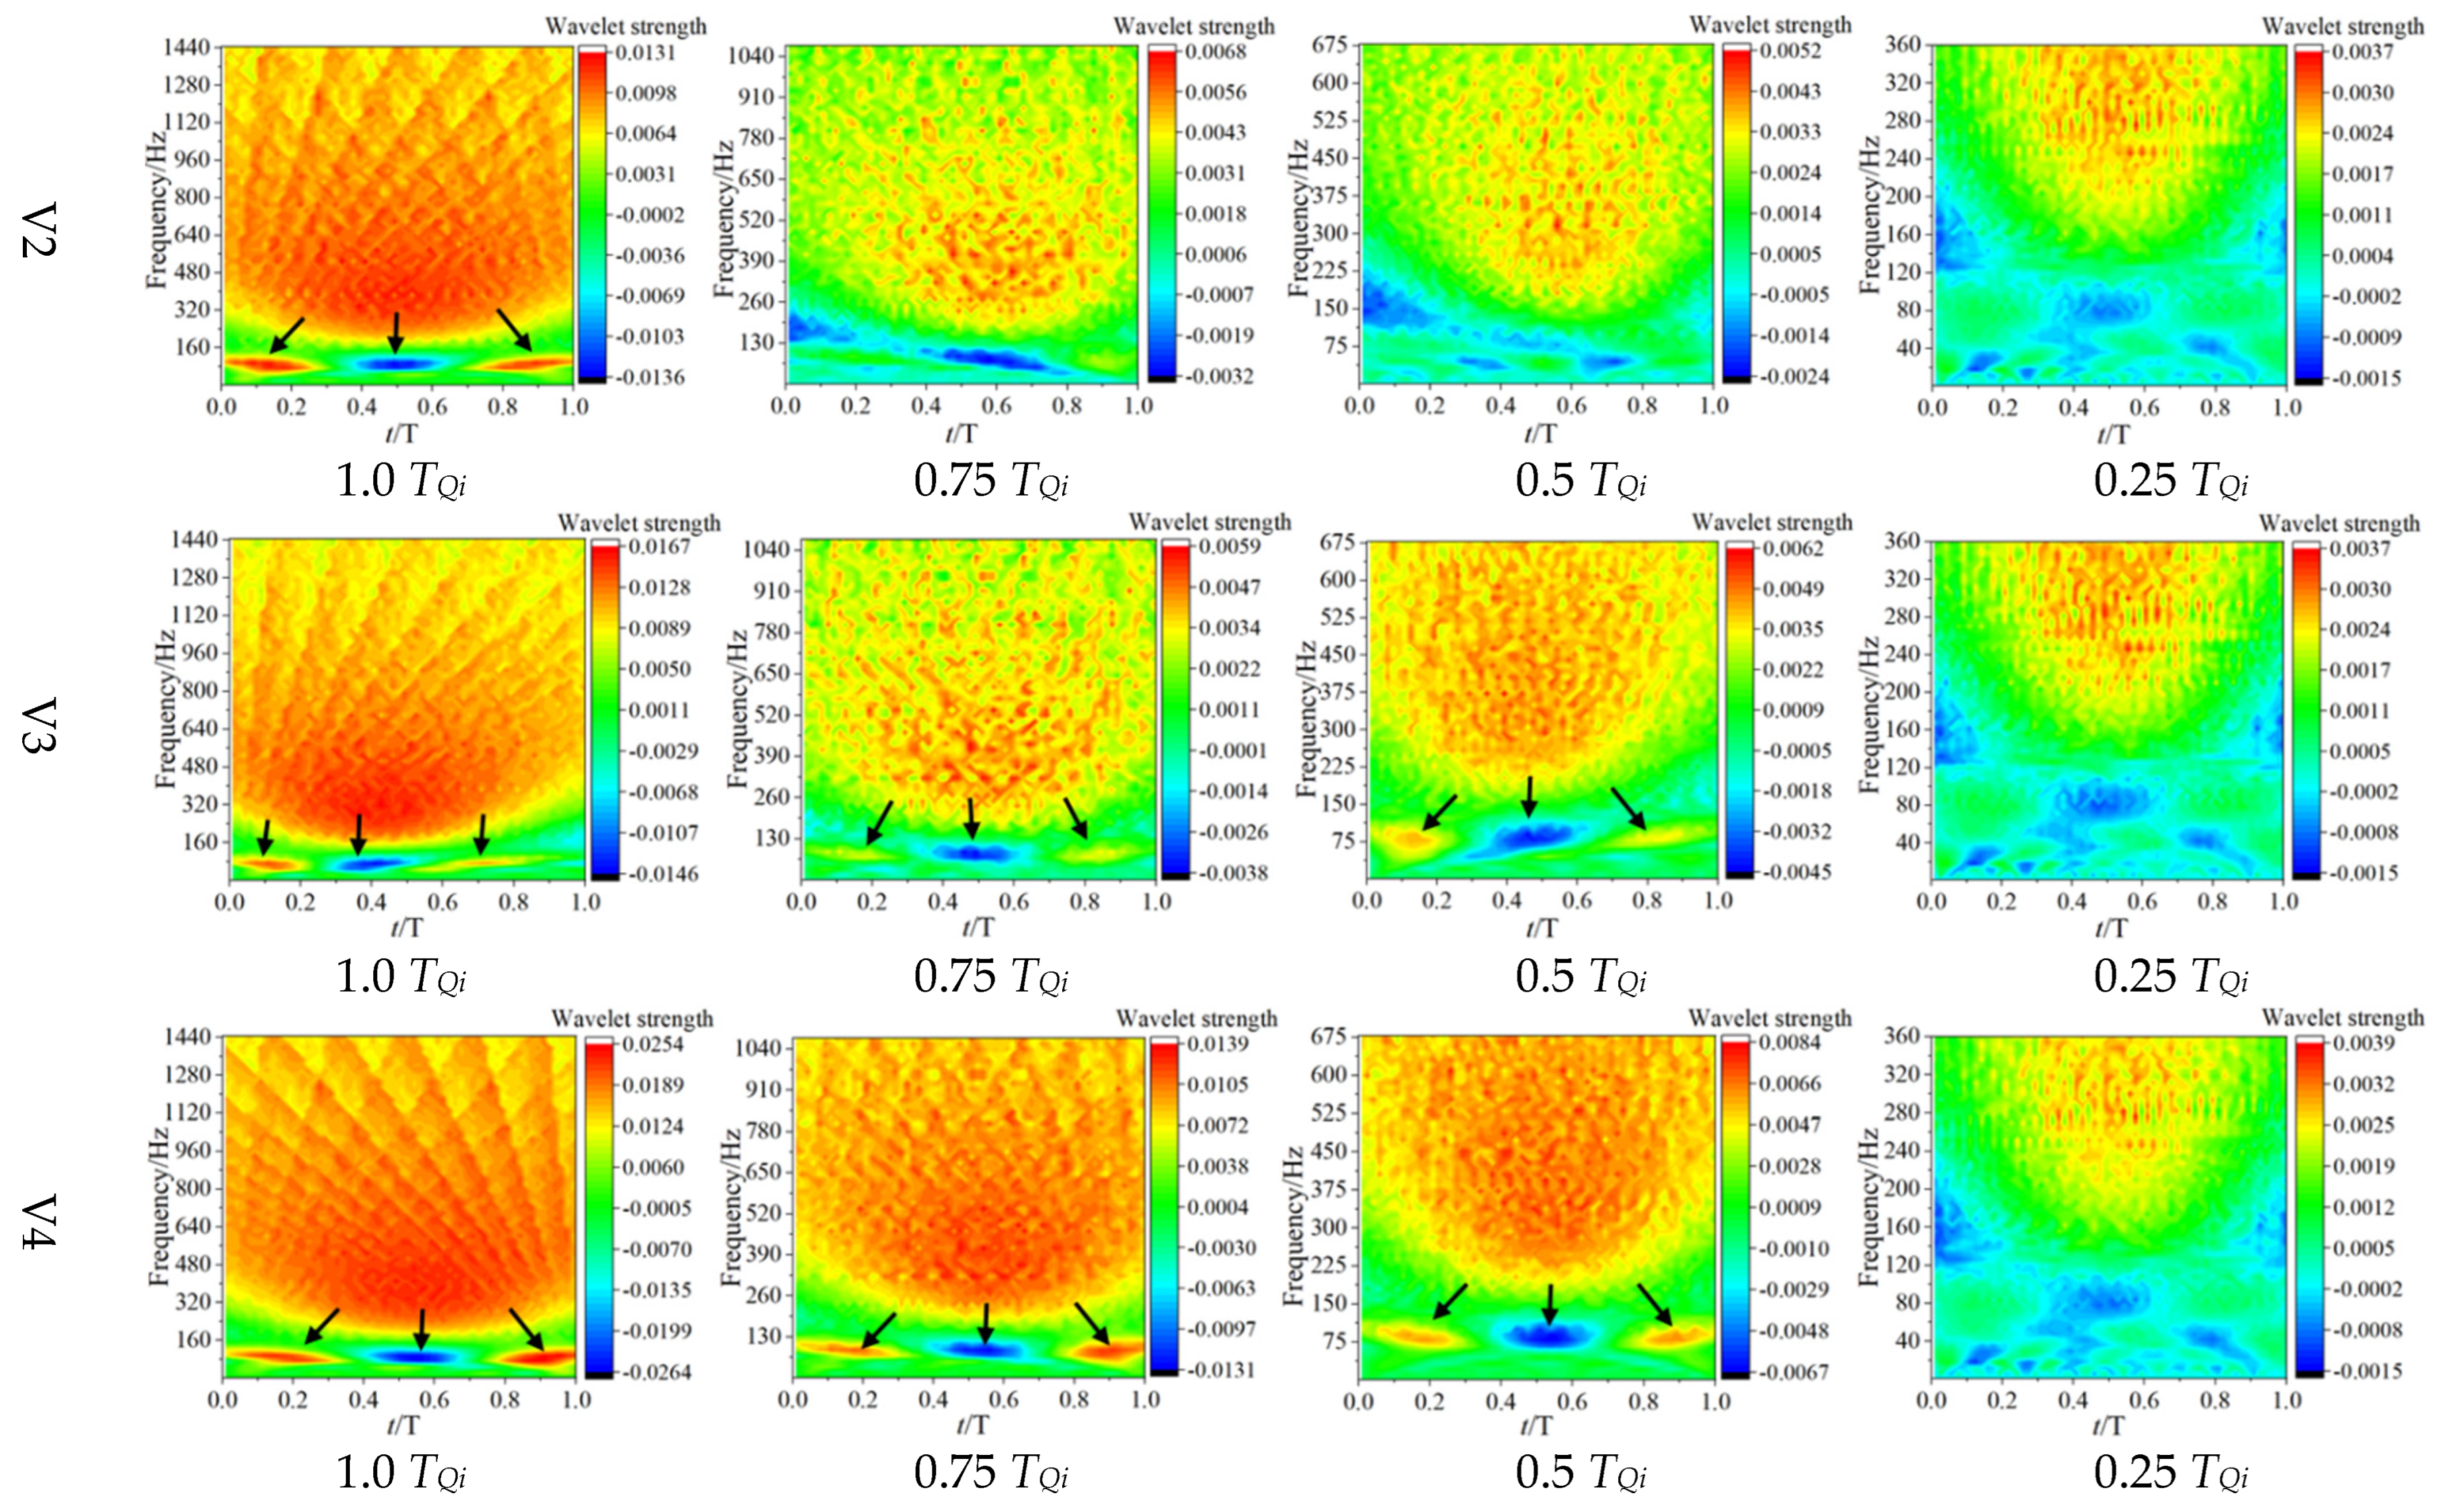
In each flow passage, the wavelet intensity of YL4 at the impeller outlet, at the inlet of the guide vane (DY1), and at the left side of the pressurized water chamber (V4) changes strongly, while that at the impeller inlet (YL1), at the guide vane outlet (DY3), and at the tongue-separating area of the pressurized water chamber outlet (V1) changes smoothly. The occurrence of flow coast-down proceeding will cause a dramatic change in the pressure pulsation in the inner flow channel of the RCP and enhance the transient pressure pulsation.
(3)
The initial stage of flow coast-down, the high-frequency pressure pulsation in most areas of the inner passage of the RCP, still has obvious regularity, in which the regularity of the wavelet response of the guide vane passage is the strongest. There is a strong correlation between the pressure pulsation regularity in the passage and the number of impeller blades.

Author Contributions

Conceptualization, D.Y. and J.W.; methodology, D.Y. and J.W.; software, D.Y.; validation, D.Y.; formal analysis, D.Y. and X.L.; investigation, D.Y.; resources, D.Y.; data curation, A.L.; writing—original draft preparation, D.Y.; writing—review and editing, D.Y. and J.W.; visualization, D.Y.; supervision, J.C. and F.Z.; project administration, D.Y. and A.L.; funding acquisition, J.W. All authors have read and agreed to the published version of the manuscript.

Funding

The support of Sichuan Science and Technology Department Plant Project (Grant No. 2022YFN0026), Sichuan “double first class” discipline construction project (RC1900009750), and Deyang Cooperation Technology Research and Development Fund Project (2018CKJ020) is gratefully acknowledged. Thanks to our group for providing a lot of help.

Data Availability Statement

Not applicable.

Conflicts of Interest

The authors declare no conflict of interest.

References

  1. Lei, M.K.; Li, M.Q. Research progress on basic theoretical issues of reactor coolant pump manufacturing. China Nucl. Power 2018, 11, 51–58. [Google Scholar]
  2. Ye, D.X.; Liu, A.L.; Luo, Y.M. Progress in research on pressure pulsation of reactor coolant pump and its improvement methods. J. Drain. Irrig. Mech. Eng. 2021, 39, 770–776. [Google Scholar]
  3. Ji, X.; Dai, Y.S.; Wu, Y.X. HPR1000: Advanced Pressurized Water Reactor with Active and Passive Safety. Engineering 2016, 2, 79–87. [Google Scholar]
  4. Wang, X.L. Study on Transient Hydraulic Characteristics of Multiphase Flow in Nuclear Main Pump. Ph.D. Thesis, Jiangsu University, Jiangsu, China, 2013. [Google Scholar]
  5. Zheng, C. Optimization of Nonlinear Idling Model Characteristics of Reactor Coolant Pump under Accident Conditions. Master’s Thesis, Jiangsu University, Jiangsu, China, 2018. [Google Scholar]
  6. Song, Y.; Gu, X.Y.; Liu, Y.Y. Numerical simulation of pressure pulsation performance of reactor coolant pump under different boundary conditions. J. Drain. Irrig. Mach. Eng. 2019, 37, 645–649. [Google Scholar]
  7. Zhu, Y.; Yin, J.L.; Zhang, J.G.; Wang, D.Z.; Cheng, H. Characteristics of pressure pulsation at inlet and outlet of shielded reactor coolant pump. Nucl. Technol. 2013, 36, 61–67. [Google Scholar]
  8. Yuan, S.Q. Discussion on design method of pump with large discharge. J. Irrig. Drain. Mach. Eng. 1988, 1, 7–11. [Google Scholar]
  9. Si, Q.R. Low Noise Hydraulic Design of Centrifugal Pump and Research on Dynamic-Static Interference Mechanism. Ph.D. Thesis, Jiangsu University, Jiangsu, China, 2014. [Google Scholar]
  10. Peter, D.; Milham, S.; Andre, K. Flow-Induced Pulsation and Vibration in Hydraulic Machinery; Jiangsu University Press: Zhenjiang, China, 2015. [Google Scholar]
  11. Lai, X.D.; Ye, D.X.; Chen, X.M. Pressure pulsation characteristics of mixed-flow reactor coolant pump in a spherical pressure chamber. Chin. J. Power Eng. 2020, 40, 169–176. [Google Scholar]
  12. Li, J.Y.; Lai, X.D.; Zhang, X. Analysis of pressure pulsation characteristics in mixed flow reactor coolant pump. Therm. Energy Power Eng. 2016, 31, 92–97. [Google Scholar]
  13. Dan, N.; Yang, M.; Bo, G. Experimental and numerical investigation on the pressure pulsation and instantaneous flow structure in a nuclear reactor coolant pump. Nucl. Eng. Des. 2018, 337, 261–270. [Google Scholar]
  14. Zhu, R.S.; Long, Y.; Fu, Q. Pressure pulsation characteristics of reactor coolant pump under low flow conditions. Vib. Shock 2014, 33, 143–149. [Google Scholar]
  15. Long, Y.; Wang, D.; Yin, J. Experimental investigation on the unsteady pressure pulsation of reactor coolant pumps with non-uniform inflow. Ann. Nucl. Energy 2017, 110, 501–510. [Google Scholar] [CrossRef]
  16. Ni, D.; Yang, M.G.; Gao, B. Correlation analysis of flow structure and pressure pulsation characteristics in mixed flow reactor coolant pump. J. Eng. Thermophys. 2017, 38, 1676–1682. [Google Scholar]
  17. Wang, P.; Yuan, S.Q.; Wang, X.L. Analysis of internal instability of reactor coolant pump under high flow condition. Vib. Shock 2015, 34, 196–201. [Google Scholar]
  18. Xu, Y.M.; Xu, S.M. Comparison of calculation models for flow coastdown speed of reactor coolant pump. Power Gener. Equip. 2011, 25, 236–238. [Google Scholar]
  19. Qiu, W.F.; Zhu, R.S.; Wang, X.L. Influence of optimization of impeller geometric parameters on flow coastdown characteristics of reactor coolant pump. J. Drain. Irrig. Mach. Engin. 2019, 37, 1019–1024. [Google Scholar]
  20. Ye, D.X.; Lai, X.D.; Wen, H.G. Research on performance characteristics of reactor coolant pump during power-off and flow coastdown shutdown transition process. Chin. J. Power Eng. 2020, 40, 593–599. [Google Scholar]
  21. Hu, X.D.; Wang, X.Y.; Liu, Z.L. Research on the accuracy of numerical simulation based on the performance prediction of Reactor coolant pump. Nucl. Power Eng. 2019, 40, 127–133. [Google Scholar]
  22. Wang, X.L.; Lu, Y.G.; Zhu, R.S. Study on the transient evolution law of internal flow field and dynamic stress of reactor coolant pump under rotor seizure accident. Ann. Nucl. Energy 2019, 133, 35–45. [Google Scholar] [CrossRef]
  23. Wang, X.L.; Lu, Y.G.; Zhu, R.S. Experimental study on transient characteristics of reactor coolant pump under rotor seizure accident. Ann. Nucl. Energy 2020, 136, 107039. [Google Scholar] [CrossRef]
  24. Zhou, Q.; Li, H.K. Study on pressure pulsation at the inlet of guide vane of centrifugal pump. J. Eng. Thermophys. 2020, 41, 1679–1684. [Google Scholar]
  25. Wang, K.L. Research on Cavitation and Pressure Pulsation Characteristics of High Specific Speed Centrifugal Pump. Master’s Thesis, Jiangsu University, Jiangsu, China, 2020. [Google Scholar]
  26. Pavesi, G.; Cavazzini, G.; Ardizzon, G. Time–frequency characterization of the unsteady phenomena in a centrifugal pump. Int. J. Heat Fluid Flow 2008, 29, 1527–1540. [Google Scholar] [CrossRef]
  27. Braun, O.; Ruchonnet, N. Analysis of pressure pulsation during the fast transition of a pump turbine from pumping to generating mode. J. Phys. Conf. Ser. 2017, 813, 012017. [Google Scholar] [CrossRef] [Green Version]
  28. Lilly, J.M.; Olhede, S.C. Generalized Morse Wavelets as a Superfamily of Analytic Wavelets. IEEE Trans. Signal Process. 2012, 60, 6036–6041. [Google Scholar] [CrossRef]
  29. Long, Y.; Wang, D.Z.; Yin, J.L. Numerical investigation on the unsteady characteristics of reactor coolant pumps with non-uniform inflow. Nucl. Eng. Des. 2017, 320, 65–76. [Google Scholar]
  30. Cheng, X.R.; Bao, W.R.; Fu, L. Steady state characteristics of internal flow in the annular pressurized water chamber of the nuclear coolant pump. J. Lanzhou Univ. Technol. 2019, 45, 49–56. [Google Scholar]
Figure 1. Schematic diagram of the first circuit of a nuclear power plant [3].
Machines 11 00055 g001
Figure 2. Three-dimensional model of reactor coolant pump.
Machines 11 00055 g002
Figure 3. Grid details of water model.
Machines 11 00055 g003
Figure 4. Grid independence test.
Machines 11 00055 g004
Figure 5. Calculation Results of Head (a) and Efficiency (b) with Different Conditions.
Machines 11 00055 g005
Figure 6. Monitoring point settings.
Machines 11 00055 g006
Figure 7. Time-domain characteristics diagram of pressure pulsation at each time point of impeller monitoring point. (a) 1.0 TQi, (b) 0.75 TQi, (c) 0.5 TQi, (d) 0.25 TQi.
Machines 11 00055 g007
Figure 8. Pressure pulsation continuous wavelet transform at monitoring point of impeller.
Machines 11 00055 g008aMachines 11 00055 g008b
Figure 9. Vorticity intensity distribution in impeller. (a) 1.0 TQi, (b) 0.75 TQi, (c) 0.5 TQi, (d) 0.25 TQi.
Machines 11 00055 g009
Figure 10. Time-domain characteristics diagram of pressure pulsation at each time point of the guide vane monitoring point. (a) 1.0 TQi, (b) 0.75 TQi, (c) 0.5 TQi, (d) 0.25 TQi.
Machines 11 00055 g010
Figure 11. Pressure pulsation continuous wavelet transform at monitoring point of guide vane.
Machines 11 00055 g011
Figure 12. Vortex core development diagrams inside guide vane. (a) 1.0 TQi, (b) 0.75 TQi, (c) 0.5 TQi, (d) 0.25 TQi.
Machines 11 00055 g012
Figure 13. Time-domain characteristics diagram of pressure pulsation at each time point. (a) 1.0 TQi, (b) 0.75 TQi, (c) 0.5 TQi, (d) 0.25 TQi.
Machines 11 00055 g013
Figure 14. Pressure pulsation continuous wavelet transform at monitoring point.
Machines 11 00055 g014aMachines 11 00055 g014b
Figure 15. Outlet velocity distribution.
Machines 11 00055 g015
Table 1. Parameters of reactor coolant pump.
Main ParametersSpecific Value
Number of impeller blades7
Number of guide vanes12
Design flow rate, Q023,790 m3/h
Design head, H98 m
Speed, n1485 rpm
Operation temperature, T293 °C
Kinematic viscosity8.93 × 10−7 m2/s
Thermal kinematic viscosity9.42 × 10−8 m2/s
Disclaimer/Publisher’s Note: The statements, opinions and data contained in all publications are solely those of the individual author(s) and contributor(s) and not of MDPI and/or the editor(s). MDPI and/or the editor(s) disclaim responsibility for any injury to people or property resulting from any ideas, methods, instructions or products referred to in the content.

