
Holistic Approach Promotes Failure Prevention of Smart Mining Machines Based on Bayesian Networks


Abstract
:1. Introduction
1.1. Background
1.2. Fires
1.3. Aims and Objectives
2. Methodology
2.1. Degradation of Materials and Measurements
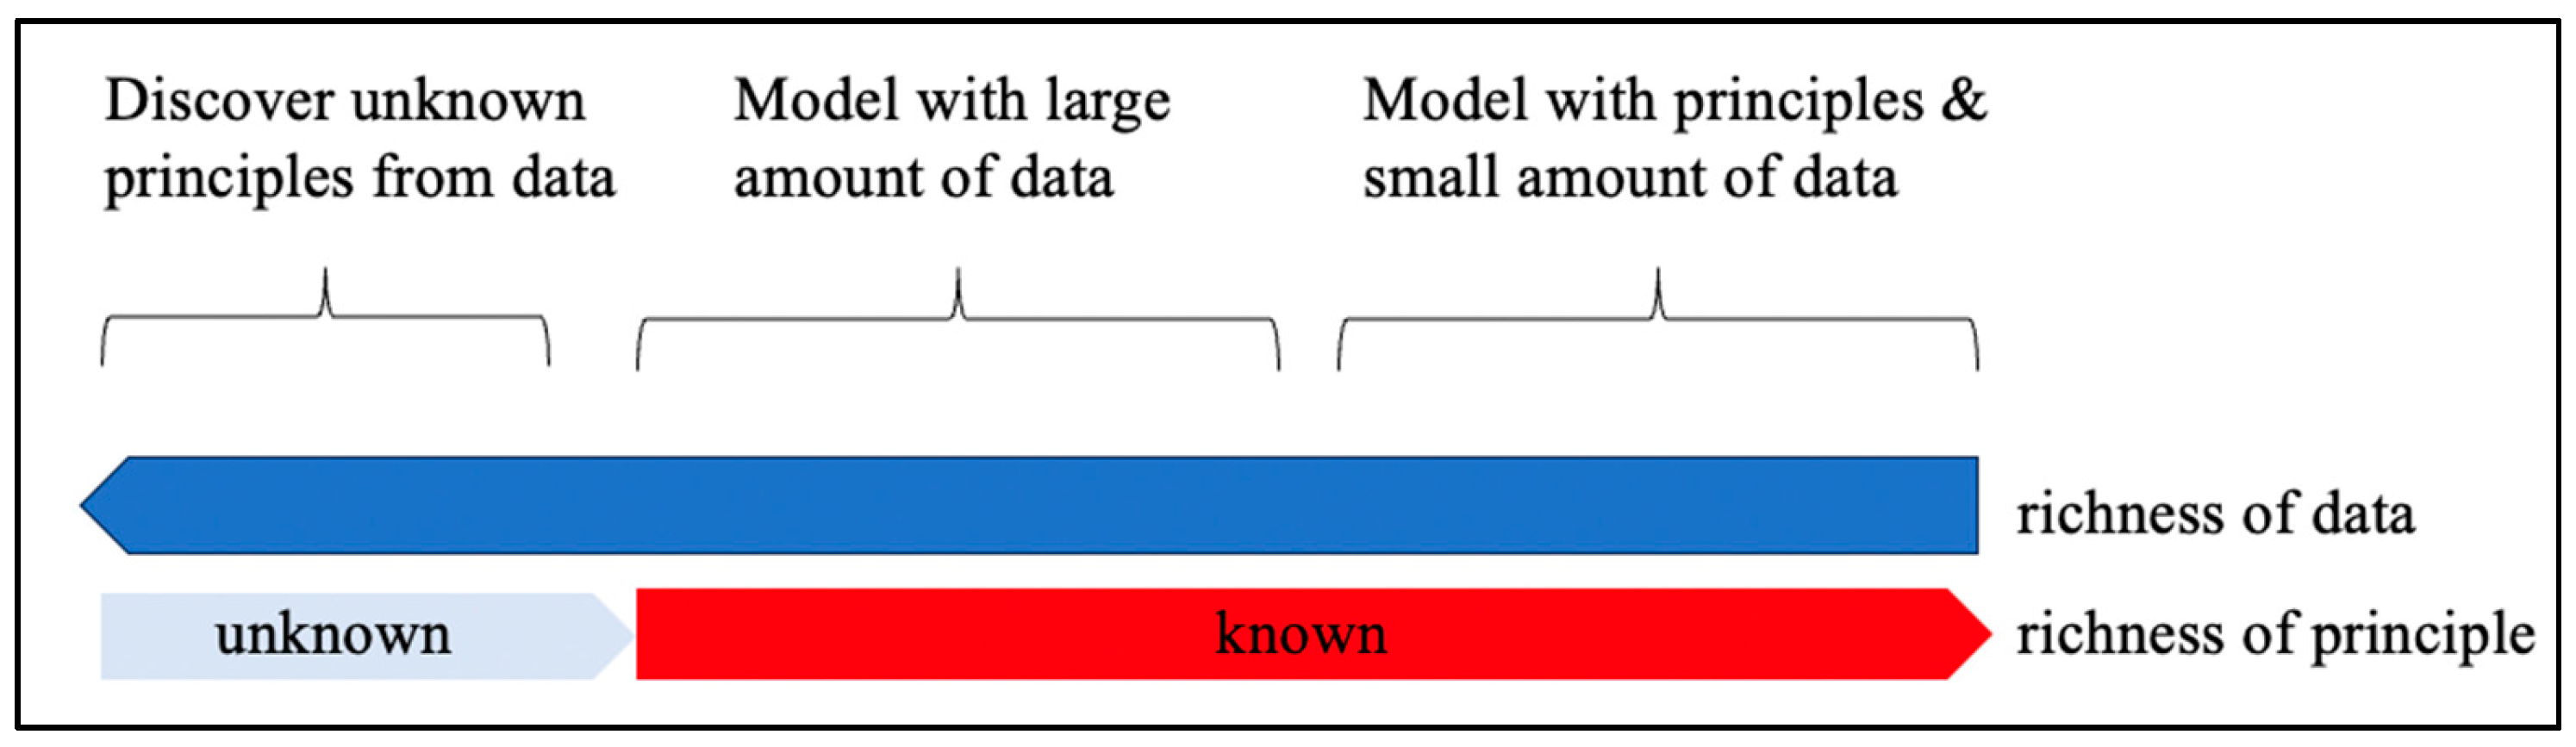
2.2. Smart Failure Prevention
2.3. Bayes’ Theorem
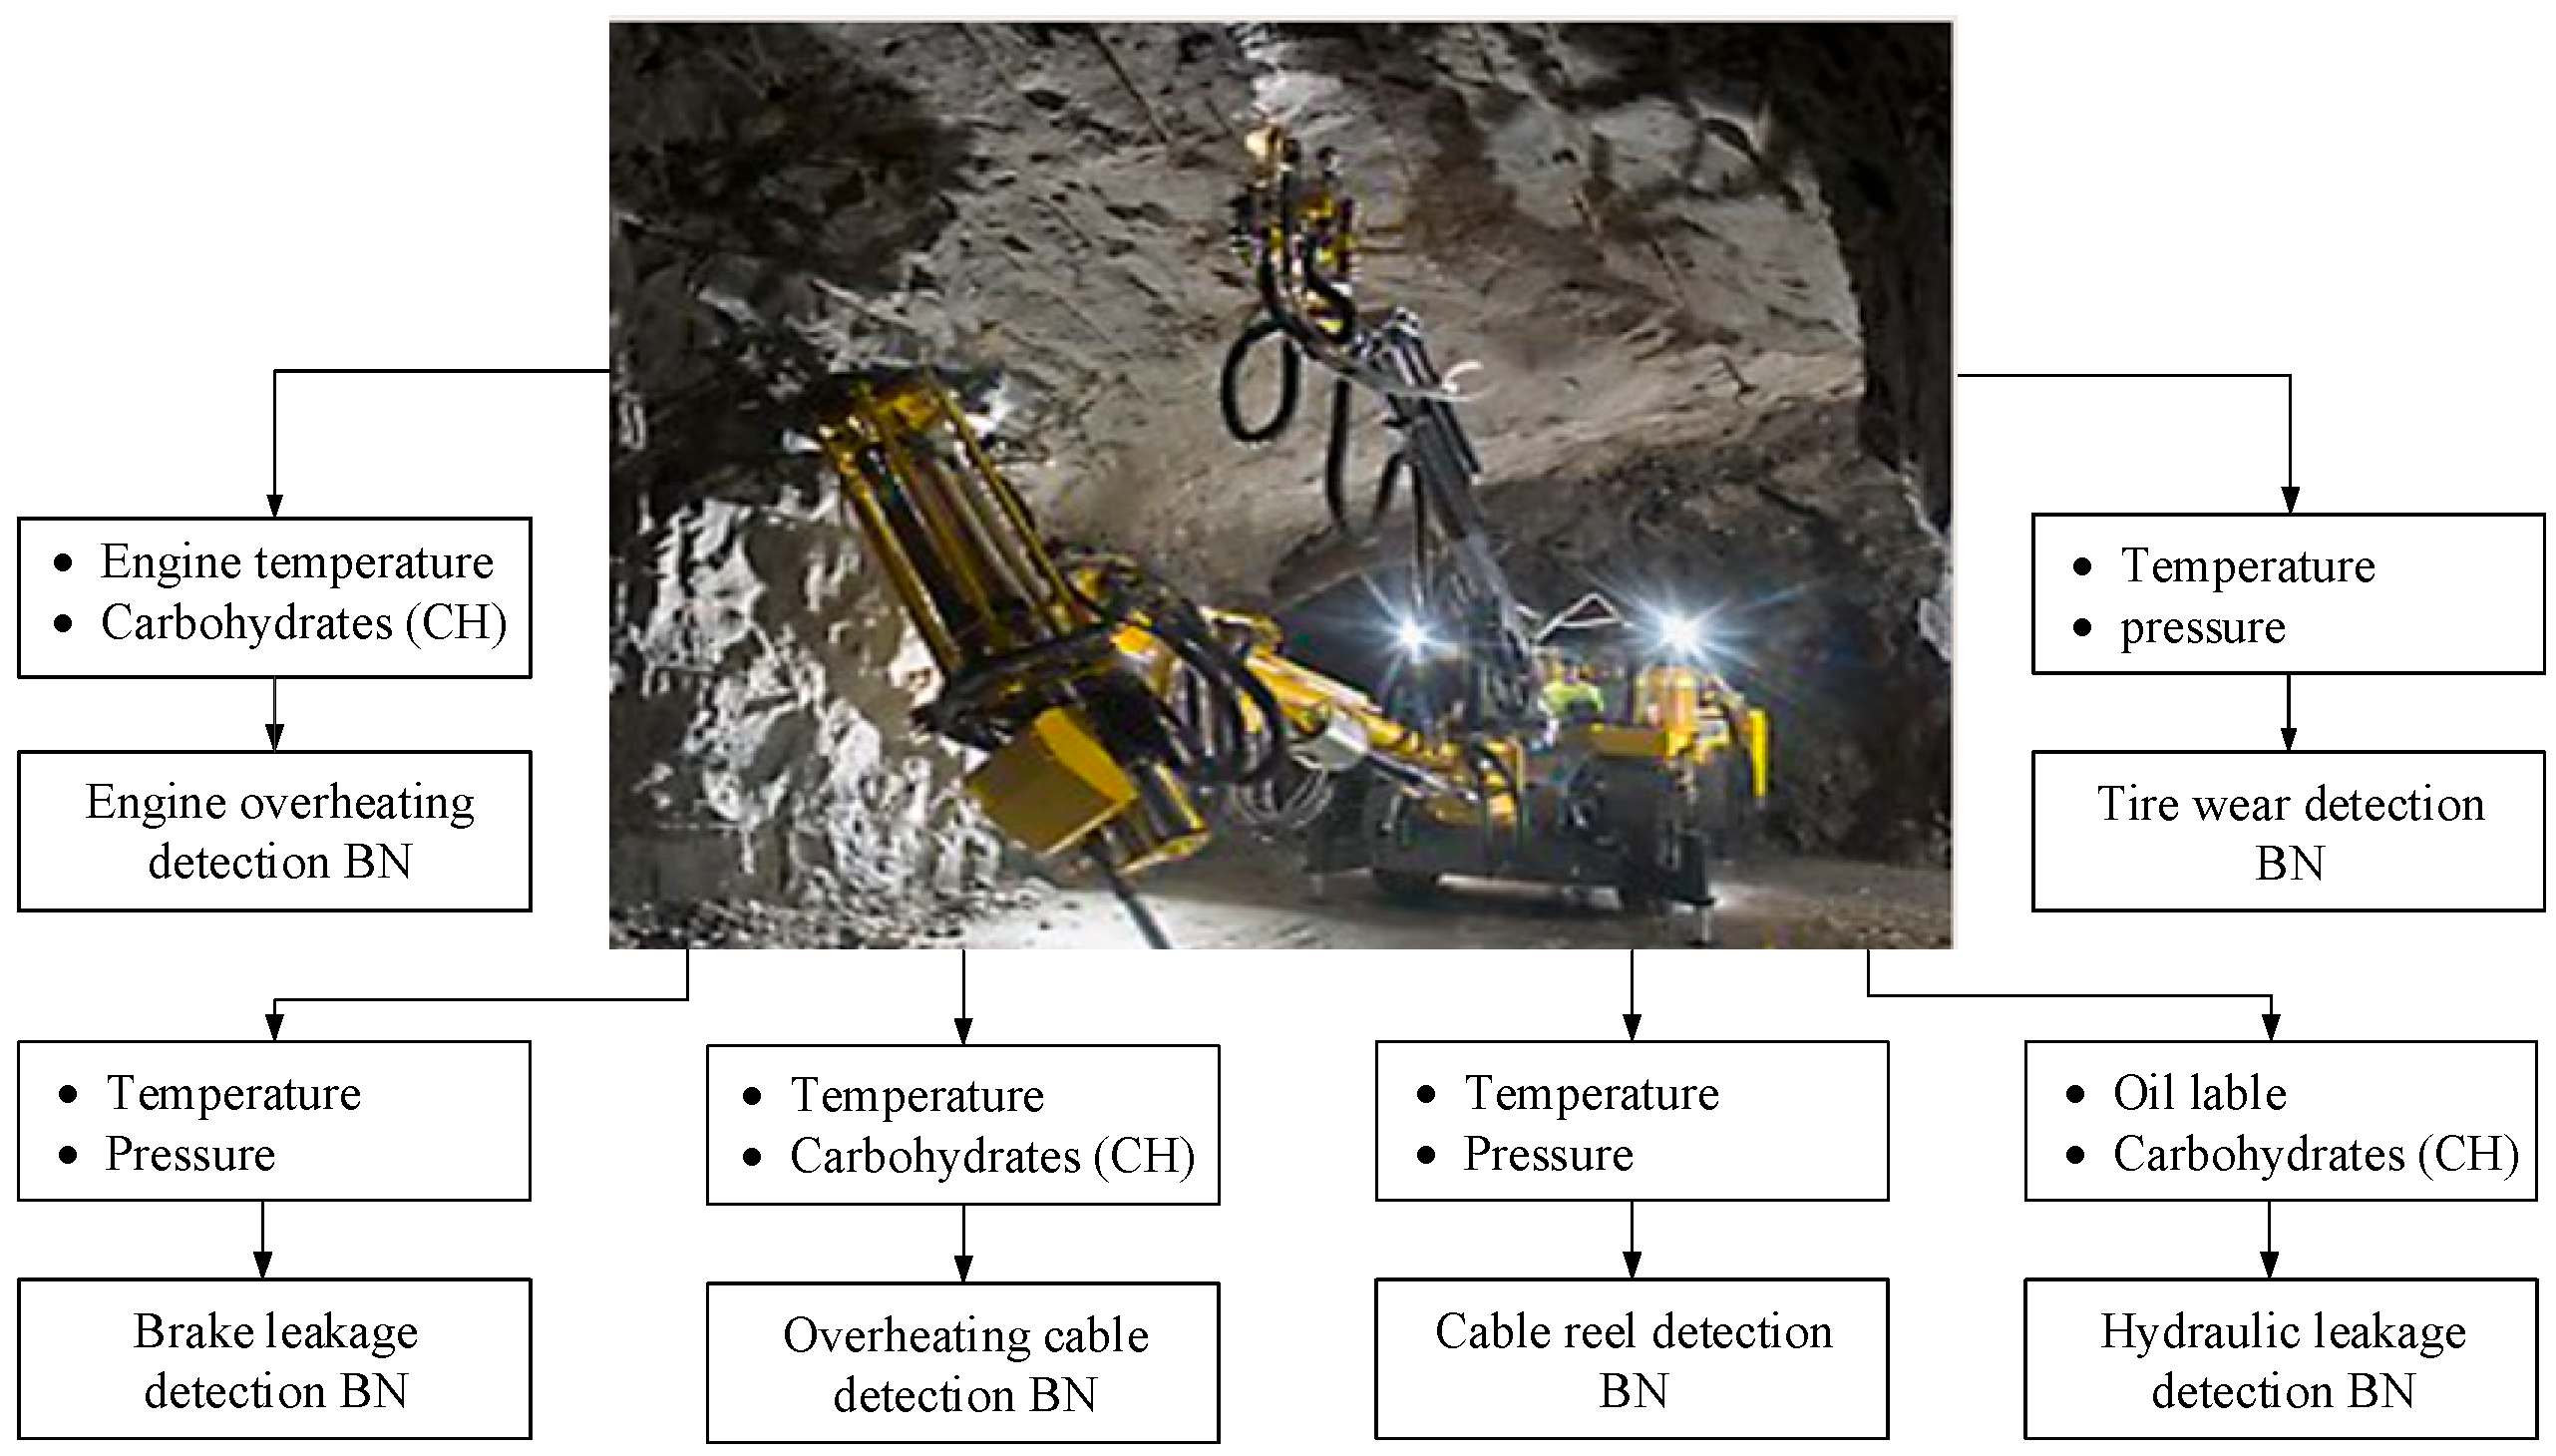
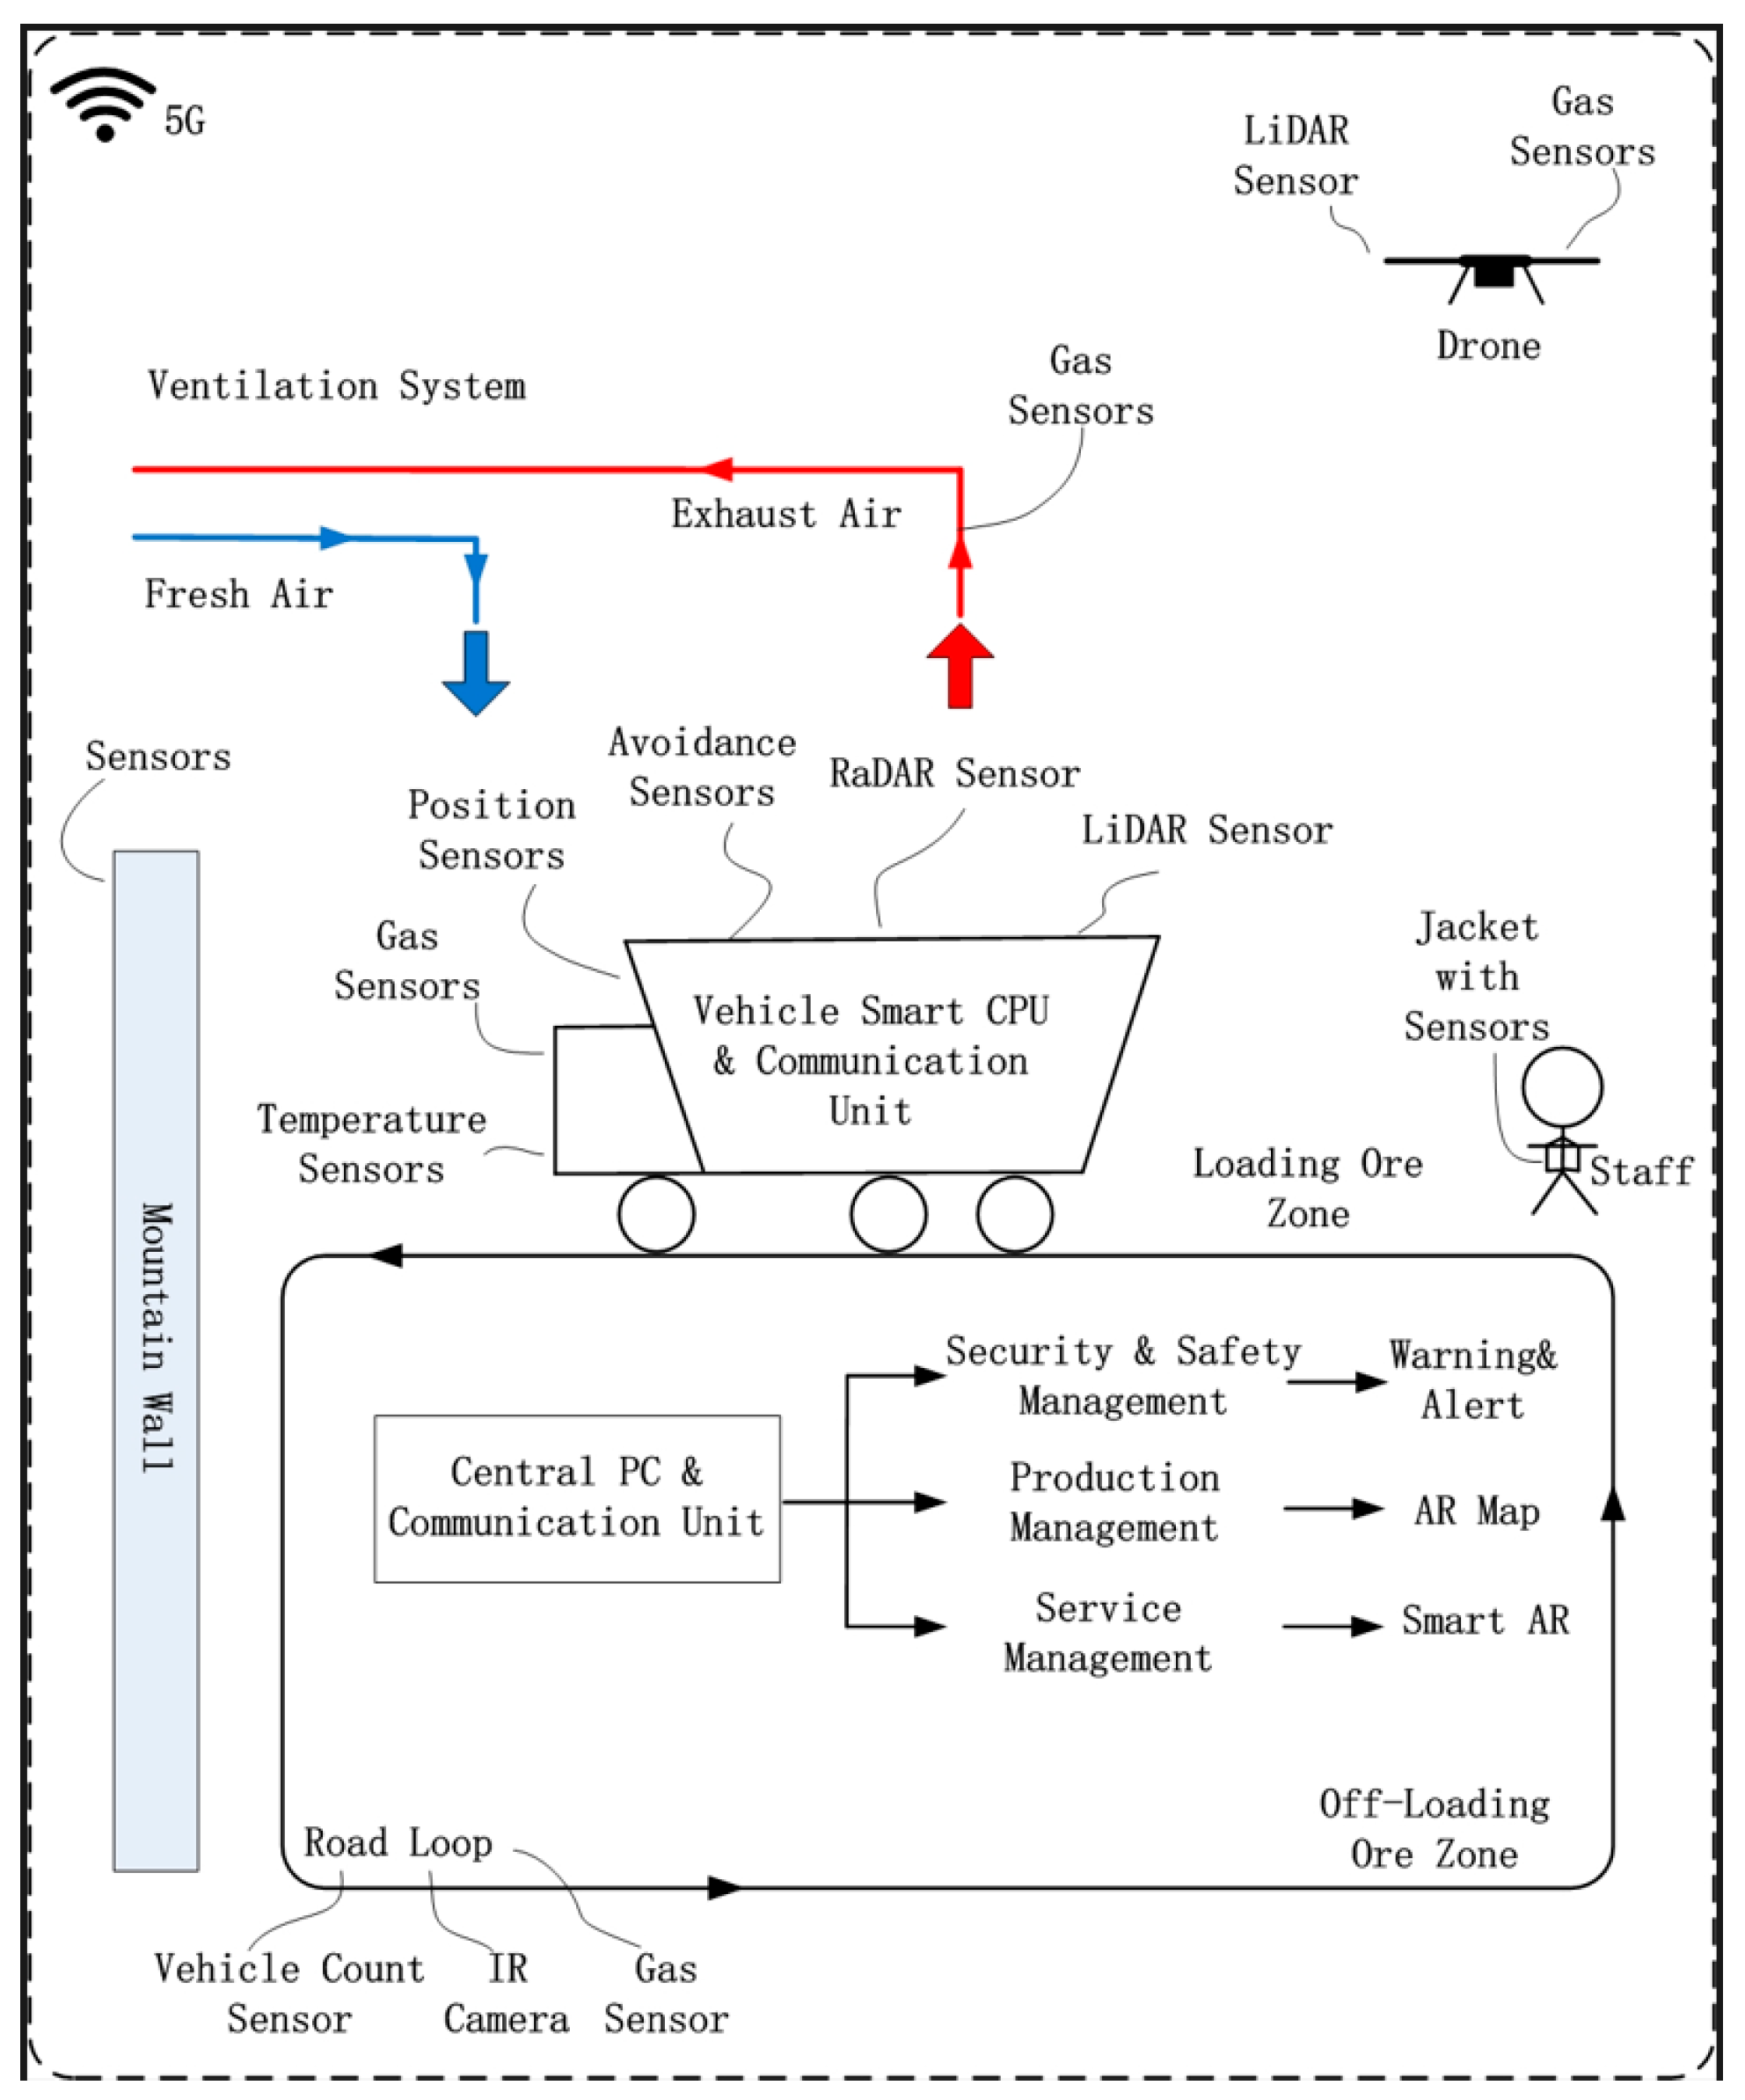
2.4. Hazard Detection Framework
- Identify the variables and define their states.
- Construct the BN.
- Determine prior probabilities.
- Compute conditional probability tables (CPTs).
- Infer the state of the system.
- Implementation of the BN model.
- -
- Why and how the variables were selected;
- -
- Why and how the states of each variable were determined;
- -
- How the relevant probabilities were determined and verified;
- -
- How the model was verified.
3. Results and Discussion
3.1. Measured Data from Sensor
3.2. Simulated Data
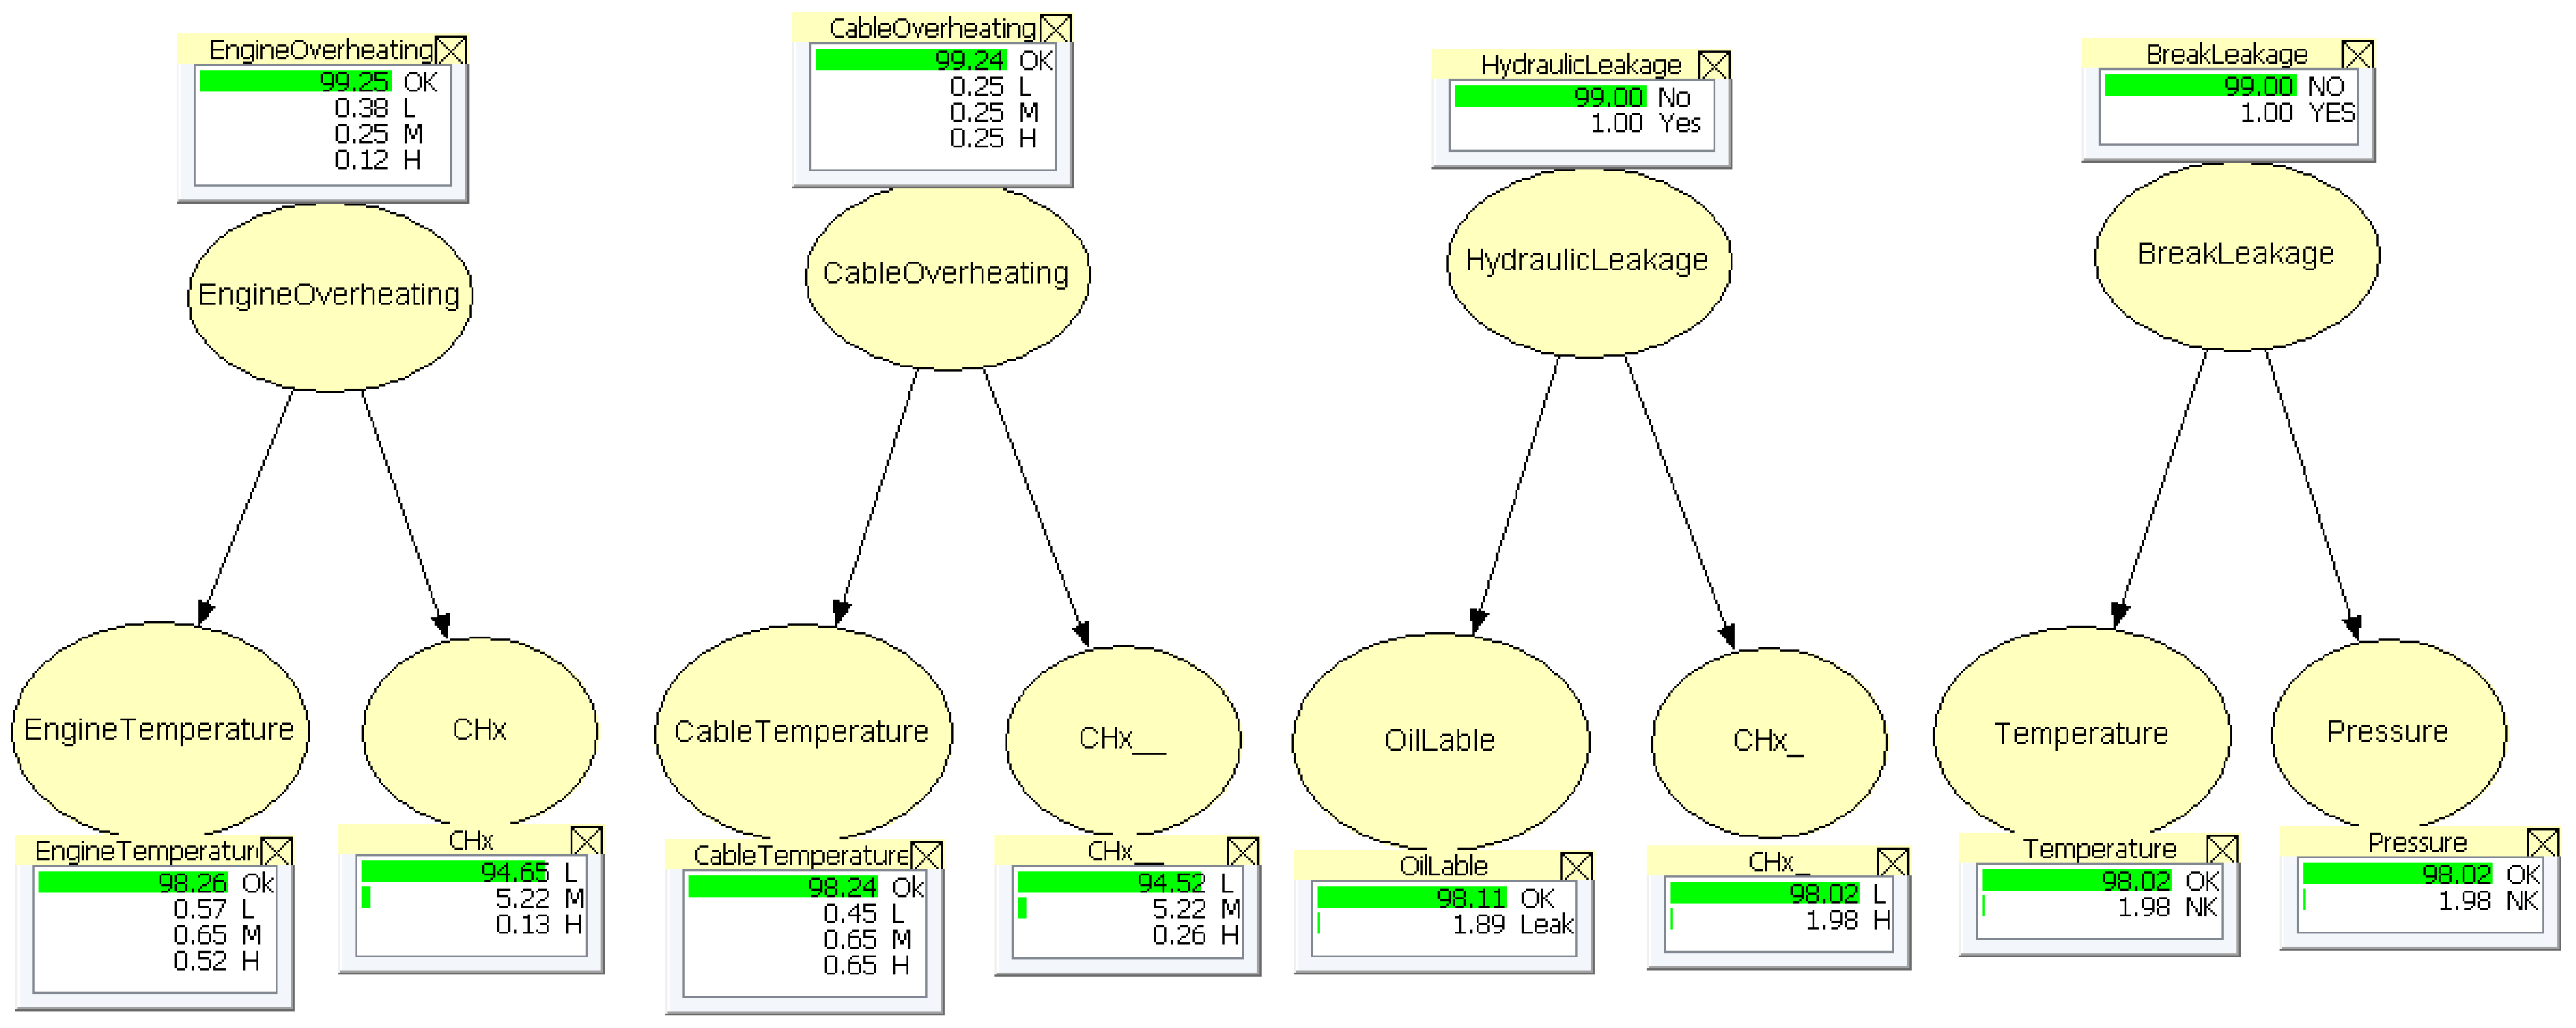
3.3. BN Results
4. Conclusions
Author Contributions
Funding
Data Availability Statement
Acknowledgments
Conflicts of Interest
Appendix A
Appendix B
Appendix C
- Example: Engine overheating detection module
- Step 1: Identify the Variables and Define Their States
- Engine temperature (absolute value) and CHx deviation (from normal values)
- States;
- Engine temperature: OK (Below 90 °C), low (90 °C–105 °C), medium (105 °C–120 °C), and high (Above 120 °C);
- CHx deviation: OK (Below 0.1 ppm), low (0.1 ppm–0.7 ppm), medium (0.7 ppm–1.2 ppm), and high (Above 1.2 ppm).
- Step 2: Construct the Bayesian Network (BN)
- Engine temperature (states: OK, low, medium, high)
- CHx deviation (states: OK, low, medium, high)
- Step 3: Determine Prior Probabilities
- P(Engine Overheating = OK) = 0.99
- P(Engine Overheating = low) = 0.025
- P(Engine Overheating = medium) = 0.03
- P(Engine Overheating = high = 0.001
- Step 4: Compute Conditional Probability Tables (CPTs)
- Step 5: Infer the State of the System
- Engine temperature: 110 °C = “M” state
- CHx deviation: 0.8 ppm = “M” state
- P(Engine Overheating = OK|Engine Temperature = M, CHx Deviation = M)
- P(Engine Overheating = L|Engine Temperature = M, CHx Deviation = M)
- P(Engine Overheating = M|Engine Temperature = M, CHx Deviation = M)
- P(Engine Overheating = H|Engine Temperature = M, CHx Deviation = M)
- P(Engine Overheating = OK|M, M) ∝ P(Engine Overheating = OK) × P(Engine Temperature = M|OK) × P(CHx Deviation = M|OK) ∝ 0.99 × 0.004 × 0.05 = 0.000198
- P(Engine Overheating = L|M, M) ∝ P(Engine Overheating = L) × P(Engine Temperature = M|L) × P(CHx Deviation = M|L) ∝ 0.005 × 0.02 × 0.95 = 0.0000475
- P(Engine Overheating = M|M, M) ∝ P(Engine Overheating = M) × P(Engine Temperature = M|M) × P(CHx Deviation = M|M) ∝ 0.004 × 0.97 × 0.95 = 0.01846
- P(Engine Overheating = H|M, M) ∝ P(Engine Overheating = H) × P(Engine Temperature = M|H) × P(CHx Deviation = M|H) ∝ 0.001 × 0.01 × 0.99 = 0.000000099
- Normalization constant (Z) = sum of all unnormalized probabilities
- Z = 0.000198 + 0.0000475 + 0.01846 + 0.000000099 ≈ 0.018705599
- P(Engine Overheating = OK|M, M) ≈ 0.000198/0.018705599 ≈ 0.010597
- P(Engine Overheating = L|M, M) ≈ 0.0000475/0.018705599 ≈ 0.002540
- P(Engine Overheating = M|M, M) ≈ 0.01846/0.018705599 ≈ 0.986062
- P(Engine Overheating = H|M, M) ≈ 0.000000099/0.018705599 ≈ 0.000005
- Case 1:
- P(Engine Overheating = OK) = 0.98
- P(Engine Overheating = L) = 0.01
- P(Engine Overheating = M) = 0.008
- P(Engine Overheating = H) = 0.002
- Case 2:
- P(Engine Overheating = OK) = 0.97
- P(Engine Overheating = L) = 0.015
- P(Engine Overheating = M) = 0.012
- P(Engine Overheating = H) = 0.003
- Case 3:
- P(Engine Overheating = OK) = 0.95
- P(Engine Overheating = L) = 0.025
- P(Engine Overheating = M) = 0.02
- P(Engine Overheating = H) = 0.005
References
- Legge, H.; Müller-Falcke, C.; Nauclér, T.; Östgren, E. Creating the Zerocarbon Mine; McKinsey & Company: Singapore, 2021. [Google Scholar]
- Natural Resources Canada. Benchmarking the Energy Consumption of Canadian Underground Bulk Mines; Natural Resources: Ottawa, Canada, 2005. [Google Scholar]
- Martinsen, M.; Zhou, Y.; Dahlquist, E.; Yan, J.; Kyprianidis, K. Smart augmented reality with AI service expert for world’s industries. In Proceedings of the Energy Proceeding International Conference on Applied Energy 2021, Virtual, 29 November–5 December 2021; p. 598. [Google Scholar]
- Saeter, A.; Bøe, N.K. Reitan, Full scale fire test of electrical vehicle. In Proceedings of the 5th International Conference on Fire in Vehicles—FIVE 2018, Borås, Sweden, 3–4 October 2018; RISE Fire Research: Trondheim, Norway, 2018. [Google Scholar]
- Ingasson, H.; Li, Y.Z.; Lönnermark, A. Tunnel Fire Dynamis; Springer: Berlin/Heidelberg, Germany, 2015. [Google Scholar]
- Ahlberg Tidblad, A. Regulatory outlook on electric vehicle safety. In Proceedings of the 5th International Conference on Fire in Vehicles—FIVE 2018, Borås, Sweden, 3–4 October 2018; Vovlvo Car Group: Gothenburg, Sweden, 2018. [Google Scholar]
- Larsson, F.; Andersson, P.; Mellander, B.-E. Gas and fire risks with Li-Ion batteries in electrified vehicles. In Proceedings of the 5th International Conference on Fire in Vehicles—FIVE 2018, Borås, Sweden, 3–4 October 2018. [Google Scholar]
- Hynynen, J.; Quant, M.; Pramanik, R.; Olofsson, A.; Li, Y.; Arvidson, M.; Andersson, P. Electric Vehicle Fire Safety in Enclosed Spaces; RISE Report 2023; Research Institutes of Sweden AB: Gothenburg, Sweden, 2023; Volume 42, ISBN 978-91-89757-90-5. [Google Scholar]
- Hansen, R. Fire behavior of mining vehicles in underground hard rock mines. Int. J. Min. Sci. Technol. 2017, 27, 627–634. [Google Scholar] [CrossRef]
- De Rosa, M.I. Analysis of Mine Fires for All US Metal/Non-Metal Mining Categories, 1990–2001; NIOSH: Washington, DC, USA, 2004. [Google Scholar]
- GRAMKO Annual Report 2005; SveMin: Stockholm, Sweden, 2005.
- De Rosa, M.I. Analyses of Mobile Equipment Fires for All US Surface and Underground Coal and Metal/Non-Metal Mining Categories, 1990–1999; NIOSH: Washington, DC, USA, 2004. [Google Scholar]
- Orošnjak, M.; Delić, M.; Ramos, S. Influence of Maintenance Practice on MTBF of Industrial and Mobile Hydraulic Failures: A West Balkan Study. In Machine and Industrial Design in Mechanical Engineering. KOD 2021. Mechanisms and Machine Science; Rackov, M., Mitrović, R., Čavić, M., Eds.; Springer: Cham, Switzerland, 2022; Volume 109. [Google Scholar] [CrossRef]
- Hansen, R. Study of Heat Release Rates of Mining Vehicles in Underground Hard Rock Mines. Ph.D. Thesis, Mälardalens University, Västerås, Sweden, 2015. [Google Scholar]
- GRAMKO Annual Reports on Fires; SveMin: Stockholm, Sweden, 2006–2017.
- Martinsen, M.; Dahlqvist, E.; Lönnermark, A.; Säker, Ö. Gas sensors for early detection of fire hazards caused by vehicles in underground mines. In Proceedings of the International Conference on Scandinavia Society, SIMS 2019, Västerås, Sweden, 13–16 August 2019. [Google Scholar] [CrossRef]
- Bitz Magasin. What will mining look like in 20 years? So answers the strategy professor. In Internal News and Articles from Epiroc in Sweden; Bitz Magasin: Stockholm, Sweden, 2022. [Google Scholar]
- Dhillon, B.S. Engineering Maintenance: A Modern Approach; CRC Press: Boca Raton, FL, USA, 2002. [Google Scholar]
- Xiqiang, W.; Younggi, P.; Ao, L.; Xinyan, H.; Fu, X.; Asif, U. Smart Detection of Fire Source in Tunnel Based on the Numerical Database and Artificial Intelligence. Fire Technol. 2021, 57, 657–682. [Google Scholar] [CrossRef]
- Zubieta, I.; Brown, G.; Cohen, R.; Medina, E. Cananea Copper Mine An International Effort to Improve Hazardous Working Conditions in Mexico. Int. J. Occup. Environ. Health 2020, 15, 14–20. [Google Scholar] [CrossRef]
- Jocelyn, S.; Chinniah, Y.; Ouali, M.S. Contribution of dynamic experience feedback to the quantitative estimation of risks for preventing accidents: A proposed methodology for machinery safety. Saf. Sci. 2016, 88, 64–75. [Google Scholar] [CrossRef]
- McNinch, M.; Parks, D.; Jacksha, R.; Miller, A. Leveraging IIoT to Improve Machine Safety in the Mining Industry. Min. Metall. Explor. 2019, 36, 675–681. [Google Scholar] [CrossRef] [PubMed]
- Raden, N. Can Bayesian Network provide answers when Machine Learning comes up short? It´s a question of probabilities. Diginomica, 31 March 2021. [Google Scholar]
- Zhang, H.; Marsh, W. Generic Bayesian Network Models for Making Maintenance Decisions from Available Data and Expert Knowledge; School of Electronic Engineering and Computer Science, Queen Mary University of London: London, UK, 2018. [Google Scholar]
- Martinsen, M.; Dahlquist, E.; Lönnermark, A.; Säker, Ö. Decision tree for enhancing maintenance activities with drones in the mining business. In Proceedings of the SIMS 2020, Virtual, 22–24 September 2020. [Google Scholar] [CrossRef]
- Martinsen, M.; Dahlquist, E.; Lönnermark, A.; Säker, Ö. Energy and Safety Diagnostic in Underground Facilities. In Proceedings of the Ninth International Symposium on Tunnel Safety and Security, ISTSS 2020, Virtual, 5–7 May 2021; p. 554, ISBN 978-91-89049-89-5. Available online: http://ri.diva-portal.org/smash/get/diva2:1548288/FULLTEXT01.pdf (accessed on 29 April 2021).
- Ray, S.; Cooney, R.P. Thermal Degradation of Polymer and Polymer Composites. In Handbook of Environmental Degradation of Materials, 2nd ed.; William Andrew: Norwich, NY, USA, 2012; pp. 213–242. [Google Scholar] [CrossRef]
- Krzysztof Pielichowski, A.; Njuguna, J.; Majka, T.-M. Thermal Degradation of Polymeric Materials; Elsevier: Amsterdam, The Netherlands, 2023; ISBN 978-0-12-823023-7. [Google Scholar]
- AFS 2018:1; Hygieniska Gränsvärden (Hygienic Limit Values) Arbetsmiljöverkets Föreskrifter och Allmänna Råd om Hygieniska Gränsvärden (Ändringar Införda till och med den 22 September 2021). The Swedish Work Environment Authority: Solna, Sweden, 2018.
- Zaccaria, V.; Fentaye, A.D.; Kyprianidis, K. Assessment of dynamic Bayesian models for gas turbine diagnostics, Part 1: Prior probability ananlysis. Machines 2021, 9, 298. [Google Scholar] [CrossRef]
- Sun, S.; Zhang, C.; Yu, G. A Bayesian network approach to traffic flow forecasting. IEEE Trans. Intell. Transp. Syst. 2006, 7, 124–132. [Google Scholar] [CrossRef]
- Li, B.; Han, T.; Kang, F. Fault diagnosis expert system of semiconductor manufacturing equipment using a Bayesian network. Int. J. Comput. Integr. Manuf. 2013, 26, 1161–1171. [Google Scholar] [CrossRef]
- Brunton, S.L.; Proctor, J.L.; Kutz, J.N. Discovering governing equations from data by sparse identification of nonlinear dynamical systems. Proc. Natl. Acad. Sci. USA 2016, 113, 3932–3937. [Google Scholar] [CrossRef] [PubMed]
- Lore, J.D.; De Pascuale, S.; Laiu, P.; Russo, B.; Park, J.S.; Park, J.M.; Brunton, S.L.; Kutz, J.N.; Kaptanoglu, A.A. Time-dependent SOLPS-ITER simulations of the tokamak plasma boundary for model predictive control using SINDy. Nucl. Fusion 2023, 63, 046015. [Google Scholar] [CrossRef]
- Raissi, M.; Perdikaris, P.; Karniadakis, G.E. Physics-informed neural networks: A deep learning framework for solving forward and inverse problems involving nonlinear partial differential equations. J. Comput. Phys. 2019, 378, 686–707. [Google Scholar] [CrossRef]
- Wang, H.; Liu, Y.; Wang, S. Dense velocity reconstruction from particle image velocimetry/particle tracking velocimetry using a physics-informed neural network. Phys. Fluids 2022, 34, 017116. [Google Scholar] [CrossRef]
- Du, Y.; Wang, M.; Zaki, T.A. State estimation in minimal turbulent channel flow: A comparative study of 4DVar and PINN. Int. J. Heat Fluid Flow 2023, 99, 109073. [Google Scholar] [CrossRef]
- Mehta, P.P.; Pang, G.; Song, F.; Karniadakis, G.E. Discovering a universal variable-order fractional model for turbulent Couette flow using a physics-informed neural network. Fract. Calc. Appl. Anal. 2019, 22, 1675–1688. [Google Scholar] [CrossRef]
- Vaswani, A.; Noam, S.; Niki, P.; Jakob, U.; Llion, J.; Aidan, G.; Łukasz, K.; Illia, P. Attention is all you need. In Proceedings of the 31st International Conference on Neural Information Processing Systems (NIPS’17), Long Beach, CA, USA, 4–9 December 2017; Curran Associates Inc.: Red Hook, NY, USA, 2017; pp. 6000–6010. [Google Scholar]
- Zhou, J.; Cui, G.; Hu, S.; Zhang, Z.; Yang, C.; Liu, Z.; Wang, L.; Li, C.; Sun, M. Graph neural networks: A review of methods and applications. AI Open 2020, 1, 57–81. [Google Scholar] [CrossRef]
- Gu, J.; Wang, Z.; Kuen, J.; Ma, L.; Shahroudy, A.; Shuai, B.; Liu, T.; Wang, X.; Wang, G.; Cai, J.; et al. Recent advances in convolutional neural networks. Pattern Recognit. 2018, 77, 354–377. [Google Scholar] [CrossRef]
- Cervantes, J.; Garcia-Lamont, F.; Rodríguez-Mazahua, L.; Lopez, A. A comprehensive survey on support vector machine classification: Applications, challenges and trends. Neurocomputing 2020, 408, 189–215. [Google Scholar] [CrossRef]
- Scanagatta, M.; Salmerón, A.; Stella, F. A survey on Bayesian network structure learning from data. Prog. Artif. Intell. 2019, 8, 425–439. [Google Scholar] [CrossRef]
- Charbuty, B.; Abdulazeez, A. Classification based on decision tree algorithm for machine learning. J. Appl. Sci. Technol. Trends 2021, 2, 20–28. [Google Scholar] [CrossRef]
- Qi, X.; Chen, G.; Li, Y.; Cheng, X.; Li, C. Applying neural-network-based machine learning to additive manufacturing: Current applications, challenges, and future perspectives. Engineering 2019, 5, 721–729. [Google Scholar] [CrossRef]
- Das, A.; Rad, P. Opportunities and challenges in explainable artificial intelligence (xai): A survey. arXiv 2020, arXiv:2006.113. [Google Scholar]
- Heckerman, D. A tutorial on learning with Bayesian networks. In Innovations in Bayesian Networks; Springer: Berlin/Heidelberg, Germany, 2008; pp. 33–82. [Google Scholar]
- McLachlan, S.; Dube, K.; Hitman, G.A.; Fenton, N.E.; Kyrimi, E. Bayesian networks in healthcare: Distribution by medical condition. Artif. Intell. Med. 2020, 107, 101912. [Google Scholar] [CrossRef] [PubMed]
- Kabir, S.; Papadopoulos, Y. Applications of Bayesian networks and Petri nets in safety, reliability, and risk assessments: A review. Saf. Sci. 2019, 115, 154–175. [Google Scholar] [CrossRef]
- Kammouh, O.; Gardoni, P.; Cimellaro, G.P. Probabilistic framework to evaluate the resilience of engineering systems using Bayesian and dynamic Bayesian networks. Reliab. Eng. Syst. Saf. 2020, 198, 106813. [Google Scholar] [CrossRef]
- Zhou, J.; Asteris, P.G.; Armaghani, D.J.; Pham, B.T. Prediction of ground vibration induced by blasting operations through the use of the Bayesian Network and random forest models. Soil Dyn. Earthq. Eng. 2020, 139, 106390. [Google Scholar] [CrossRef]
- Sevinc, V.; Kucuk, O.; Goltas, M. A Bayesian network model for prediction and analysis of possible forest fire causes. For. Ecol. Manag. 2020, 457, 117723. [Google Scholar] [CrossRef]
- Li, L.; Fang, Z. Cause Analysis of Coal Mine Gas Explosion Based on Bayesian Network. Shock. Vib. 2022, 2022, 1923734. [Google Scholar] [CrossRef]
- Li, M.; Wang, H.; Wang, D.; Shao, Z.; He, S. Risk assessment of gas explosion in coal mines based on fuzzy AHP and bayesian network. Process Saf. Environ. Prot. 2022, 135, 207–218. [Google Scholar] [CrossRef]
- The Fire Safety Committee of the Swedish Mining Industry’s Health and Safety Committee. Fire Safety in Mines and Underground Constructions; SveMin: Stockholm, Sweden, 2010. [Google Scholar]
- Department of Mineral Resources. Guideline for the Compilation of a Mandatory Code of Practice for Prevention of Fires at Mines; Department of Mineral Resources: Pretoria, South Africa, 2017.
- Hansen, R. Pre-ignition detection and early fire detection in mining vehicles. Min. Technol. 2021, 130, 22–35. [Google Scholar] [CrossRef]


| Conditional Events (P) | Probability |
|---|---|
| CHx: High | 0.0198 |
| CHx: Low | 0.9802 |
| HydraulicLeakage: Yes | 0.01 |
| HydraulicLeakage: No | 0.99 |
| CHx: High|HydraulicLeakage: Yes | 0.9 |
| CHx: Low|HydraulicLeakage: Yes | 0.1 |
| CHx: High|HydraulicLeakage: No | 0.01 |
| CHx Low|HydraulicLeakage: No | 0.99 |
| Parent States | Engine Temperature | CHx Measurement | |||||
|---|---|---|---|---|---|---|---|
| OK | L | M | H | L | M | H | |
| OK | 0.99 | 0.002 | 0.004 | 0.004 | 0.95 | 0.05 | 0 |
| L | 0 | 0.98 | 0.02 | 00 | 0.95 | 0.05 | 0 |
| M | 0 | 0.015 | 0.97 | 0.015 | 0 | 0.95 | 0.05 |
| H | 0 | 0 | 0.01 | 0.99 | 0 | 0.01 | 0.99 |
| Engine Overheating | Cable Overheating | Hydraulic Leakage | Brake Leakage | |||||||||||||||||||
|---|---|---|---|---|---|---|---|---|---|---|---|---|---|---|---|---|---|---|---|---|---|---|
| 1 Temp. | CHx | Temp. | CHx | Oil Level | CHx | Pressure | 1 Temp. | |||||||||||||||
| Case | OK | L | M | H | L | M | H | OK | L | M | H | L | M | H | OK | Leak | L | H | OK | 2 NK | OK | 2 NK |
| 1 | x | x | ||||||||||||||||||||
| 2 | x | x | ||||||||||||||||||||
| 3 | x | x | ||||||||||||||||||||
| 4 | x | x | ||||||||||||||||||||
| 5 | x | x | ||||||||||||||||||||
| 6 | x | x | ||||||||||||||||||||
| 7 | x | x | ||||||||||||||||||||
| 8 | x | x | ||||||||||||||||||||
| 9 | x | x | ||||||||||||||||||||
| 10 | x | x | ||||||||||||||||||||
| 11 | x | x | ||||||||||||||||||||
| 12 | x | x | ||||||||||||||||||||
| Engine Overheating | Cable Overheating | Hydraulic Leakage | Brake Leakage | |||||||||
|---|---|---|---|---|---|---|---|---|---|---|---|---|
| Case | OK | L | M | H | OK | L | M | H | NO | YES | NO | YES |
| 1 | 100 | 0 | 0 | 0 | ||||||||
| 2 | 34.95 | 65.05 | 0 | 0 | ||||||||
| 3 | 7.88 | 0.16 | 91.96 | 0 | ||||||||
| 4 | 0 | 0 | 0.16 | 99.84 | ||||||||
| 5 | 100 | 0 | 0 | 0 | ||||||||
| 6 | 44.32 | 55.68 | 0 | 0 | ||||||||
| 7 | 7.8 | 0.11 | 92.09 | 0 | ||||||||
| 8 | 0.08 | 99.92 | ||||||||||
| 9 | 100 | 0 | ||||||||||
| 10 | 1.1 | 98.9 | ||||||||||
| 11 | 100 | 0 | ||||||||||
| 12 | 1 | 99 | ||||||||||
Disclaimer/Publisher’s Note: The statements, opinions and data contained in all publications are solely those of the individual author(s) and contributor(s) and not of MDPI and/or the editor(s). MDPI and/or the editor(s) disclaim responsibility for any injury to people or property resulting from any ideas, methods, instructions or products referred to in the content. |
© 2023 by the authors. Licensee MDPI, Basel, Switzerland. This article is an open access article distributed under the terms and conditions of the Creative Commons Attribution (CC BY) license (https://creativecommons.org/licenses/by/4.0/).
Share and Cite
Martinsen, M.; Fentaye, A.D.; Dahlquist, E.; Zhou, Y. Holistic Approach Promotes Failure Prevention of Smart Mining Machines Based on Bayesian Networks. Machines 2023, 11, 940. https://doi.org/10.3390/machines11100940
Martinsen M, Fentaye AD, Dahlquist E, Zhou Y. Holistic Approach Promotes Failure Prevention of Smart Mining Machines Based on Bayesian Networks. Machines. 2023; 11(10):940. https://doi.org/10.3390/machines11100940
Chicago/Turabian StyleMartinsen, Madeleine, Amare Desalegn Fentaye, Erik Dahlquist, and Yuanye Zhou. 2023. "Holistic Approach Promotes Failure Prevention of Smart Mining Machines Based on Bayesian Networks" Machines 11, no. 10: 940. https://doi.org/10.3390/machines11100940
APA StyleMartinsen, M., Fentaye, A. D., Dahlquist, E., & Zhou, Y. (2023). Holistic Approach Promotes Failure Prevention of Smart Mining Machines Based on Bayesian Networks. Machines, 11(10), 940. https://doi.org/10.3390/machines11100940