Article

Study of Parallel Compressor System and Real-Time Simulation Based on Modular Dynamic System Greitzer Modeling

1
School of Energy and Power Engineering, Xi’an Jiaotong University, Xi’an 710049, China
2
State Key Laboratory of Compressor Technology (Compressor Technology Laboratory of Anhui Province), Hefei 230031, China
3
AECC Sichuan Gas Turbine Establishment, Mianyang 621703, China
*
Author to whom correspondence should be addressed.
Machines 2023, 11(2), 213; https://doi.org/10.3390/machines11020213
Submission received: 10 November 2022 / Revised: 20 January 2023 / Accepted: 31 January 2023 / Published: 2 February 2023
(This article belongs to the Special Issue Selected Papers from CITC2022)

Abstract

:
The compressor system is widely used in aerospace, chemical industry, and other industrial fields. Modeling a compressor system is of great significance to the study of hydrodynamics and surge characteristics. Modular Dynamic System Greitzer (MDSG) modeling is a real-time model to simulate the dynamic response of complex compressor systems. An industrial air suction parallel compressor system with three compressors is modeled and simulated by the MDSG model, and the results are compared with the experimental results; the average error is less than 3%, which demonstrates that the MDSG model for the parallel compressor systems is reliable and accurate. Finally, a compression system with one valve and two valves is developed by the MDSG model, and the typical surge phenomena of two compression systems are dynamically simulated and discussed. The dynamic performance of the single compressor and parallel compressor systems can be described by the MDSG model.

1. Introduction

As an important piece of equipment, the compression system is widely used in metallurgy, the chemical industry, natural gas transportation, engine propulsion, and other industrial fields [1]. A compression system is a complex thermodynamic system composed of pipelines and valves with a compressor as the core. The compressor map of the compression system in the operable area shows that the pressure ratio decreases with the increase in compressor flow [2]. High pressure is usually required in industrial equipment, so it is necessary to keep the compressor’s designed condition in a safe range under “high pressure” conditions. In fact, the condition point where the SL (surge line) intersects the performance curve is usually the maximum pressure ratio of the compressor at a given speed. When operating safely, the operating point is located on the right side of the surge line. The operating point should be as close to the SL as possible to obtain a higher-pressure ratio without changing the speed. If the state operation condition is located on the left side of the SL, it will lead to the compressor surge, which is accompanied by the axisymmetric oscillation of airflow and severe vibration of pressure [3]. Under surge conditions, the low mass flow rate and the poor ability of the compressor to work on the air are insufficient to provide sufficient pressure rise for the air. In a compressor and pipeline system, the gas pressure in the downstream chamber of the compressor impeller, including the diffuser and the downstream section of the pipe, is greater than the outlet pressure of the compressor impeller. Driven by reverse pressure, the flow of the compressor decreases, and countercurrent occurs. The release effect of countercurrent on the downstream high pressure makes the compressor flow periodically change along the axial direction during the surge, resulting in huge pressure vibration. The surge will destroy the impeller and bearing of the compressor, which results in ruinous damage to the compression system and causes serious economic losses and security threats [4,5]. To improve compressor efficiency and avoid the surge in industry, modeling and simulation study is of great significance for the control and design of compression systems.
In recent decades, the research on modeling and simulation of centrifugal compressor has attracted extensive attention and made a lot of progress. The famous Greitzer model was introduced by Greitzer [6] in 1976 to predict the transient response of surge. Based on the Greitzer model, many dynamic modeling and experimental verification studies on compressors have been published. There are two research directions for the current literature. One is the mechanistic research of surge, while the other is the applied research of compression systems in practical industrial engineering.
For mechanism research, scholars focus on the establishment of mathematical models and conduct in-depth explorations. Moore and Greitzer [7,8] improved the Greitzer model, especially by describing the algorithm of compressor maps in detail. Gravdahl [9] supplemented the modeling method with approximate calculations for varying compressor speeds. With the deep understanding of compressor surge by researchers, some nonlinear modeling, surge control modeling, and reversed flow regimes have become research hotspots. A nonlinear Greitzer compressor model and parameter identification method are introduced by Backi [10,11]. For Gravdahl [2,12,13], Cortinovis [14], Ziabari [15], and Shafieian [16], some simulation and modeling studies on the surge and surge control methods were carried out, including close-coupled valve, throttle control valve, torque control, and model predictive control (MPC). A compressor model was considered and developed to simulate reversed flow regimes in the surge by Powers [17]. Two types of surge were discussed and studied on the parameter Lc by Grapow [18]. And the relationship between compressor physical parameters and the Greitzer model was discussed by Jaeschke [19]. Tournes and Landrum [20] described a velocity triangle model that can simulate the phenomenon of isentropic losses to replace the Moore–Greitzer cubic model. Venturini [21] developed a compressor mathematical model based on physical properties and carried out a sensitivity analysis to evaluate the influence of model parameters on the model response. Yoon et al. [22] derived a mathematical model based on the Greitzer compressor model and a transmission line model, where a centrifugal compressor with an exhaust pipeline was simulated. Series and parallel compressor models based on the Greitzer model and bond graph model were developed by Uddin and Gravdahl [3] to analyze the parallel and series characteristics of compressors. In these studies, researchers usually followed the assumptions of the Greitzer model, and the research object was a single Greitzer compressor model. There are few studies on the real-time model of a complex compression system.
For application research, combining the Greitzer model with control and simulation methods, several compressor models were established to describe corresponding industrial compressor systems [23,24,25,26]. In the qualitative analysis, a compressor system model was established for the fault diagnosis of a gas-steam combined-cycle power plant (CCPP) in the field of power generation by Song [27]. In the petrochemical industry, Liu [28] studied a modeling method of a compressor and air cooler for natural gas transportation equipment. Dynamic modeling of a coupled vane compressor was developed, and dynamic forces acting on its components were studied and analyzed by Shakya and Ooi [29]. In these studies, the compression system model is a “black box” model which has high precision. This model has obstacles in the physical mechanism without universality.
The existing research on compressor modeling is optimized based on the Greitzer model to adapt to different application scenarios. There are few studies on parallel and surge dynamic response simulation of the compression system. Due to complexity, nonlinearity, and the high cost of experimental verification, it is a challenge to derive a model of the surge phenomenon and compressor parallel in the dynamic modeling of complex compression systems considering friction loss and heat transfer. Hence, to improve the defect of the above models, real-time dynamic modeling to simulate the surge phenomenon and parallel characteristics of complex compressor systems needs to be presented.
In this paper, real-time Modular Dynamic System Greitzer (MDSG) modeling is proposed. For validation, an industrial air suction parallel compression system is established. The simulation results are compared with the experimental results. The surge test is dangerous, so we use MDSG modeling to simulate and discuss the dynamic phenomenon of compressor surge. To obtain the dynamic characteristics of compressor surge, the compression system with one valve and two valves, the common compressor function test equipment consisting of a compressor with an outlet valve or a compressor with an inlet valve and an outlet valve, is simulated by MDSG modeling. The dynamic phenomenon of the surge in the compression system is simulated and analyzed.

2. Mathematical Model Development of the MDSG Model

The mathematical model of the compressor is derived from the laws of conservation (mass, momentum, and energy) and the Greitzer model [6]. All the pressure and temperature in the text are absolute values.
ρ t + ( ρ u i ) x i = 0
ρ D u j D t = p x j + μ 2 u j x i 2 + ρ f j
( ρ h ) t + ( ρ U x h ) x + ( ρ U y h ) y + ( ρ U z h ) z = p d i v U + d i v ( α g r a d T ) + Φ + S h
where Equations (1) and (2) are tensor forms, and ui, xi, and fi are the tensor forms of velocity, distance, and force, respectively. Ux, Uy, Uz in Equation (3) are the velocity in the direction of x, y, and z.
A Greitzer model usually consists of the compressor, rear cavity, and downstream valve. The three parts are regarded as a system to describe the principle of surge. In the MDSG model, the compressor, pipe network, and valves are taken as independent dynamic simulation modules, which can not only set the characteristic parameters of target components specifically, improving the simulation accuracy, but also conform to the actual structure of the actual complex system. The component modules are divided into two categories. One includes compressors and valves with input parameters of upstream and downstream pressure and output parameters of mass flow rate. The other includes the pipe network, whose input parameter is the mass flow of each pipe network interface, and the output value is the pressure of each interface. The two modules appear alternately to realize the system simulation. The mathematical equations for each component are given in turn below.
The dimensionless performance map of the compressor and isentropic thermodynamics model is developed. Based on the Greitzer model [6,21], the optimized equations are as follows.
d p c d t = a 01 2 V c ( w in w out )
d w d t = A c L c ( Ψ ( N T in , w T in p in ) p in p c ) λ R g D h A c w out 2 T out p c + p out R g A c L c ( w out 2 T out p out w in 2 T in p in )
where w is the mass flow rate, and its subscripts “out” and “in” define the outlet and inlet of the compressor, respectively. Ac and Lc are the cross-sectional areas and effective length of the equivalent compressor duct, respectively. 
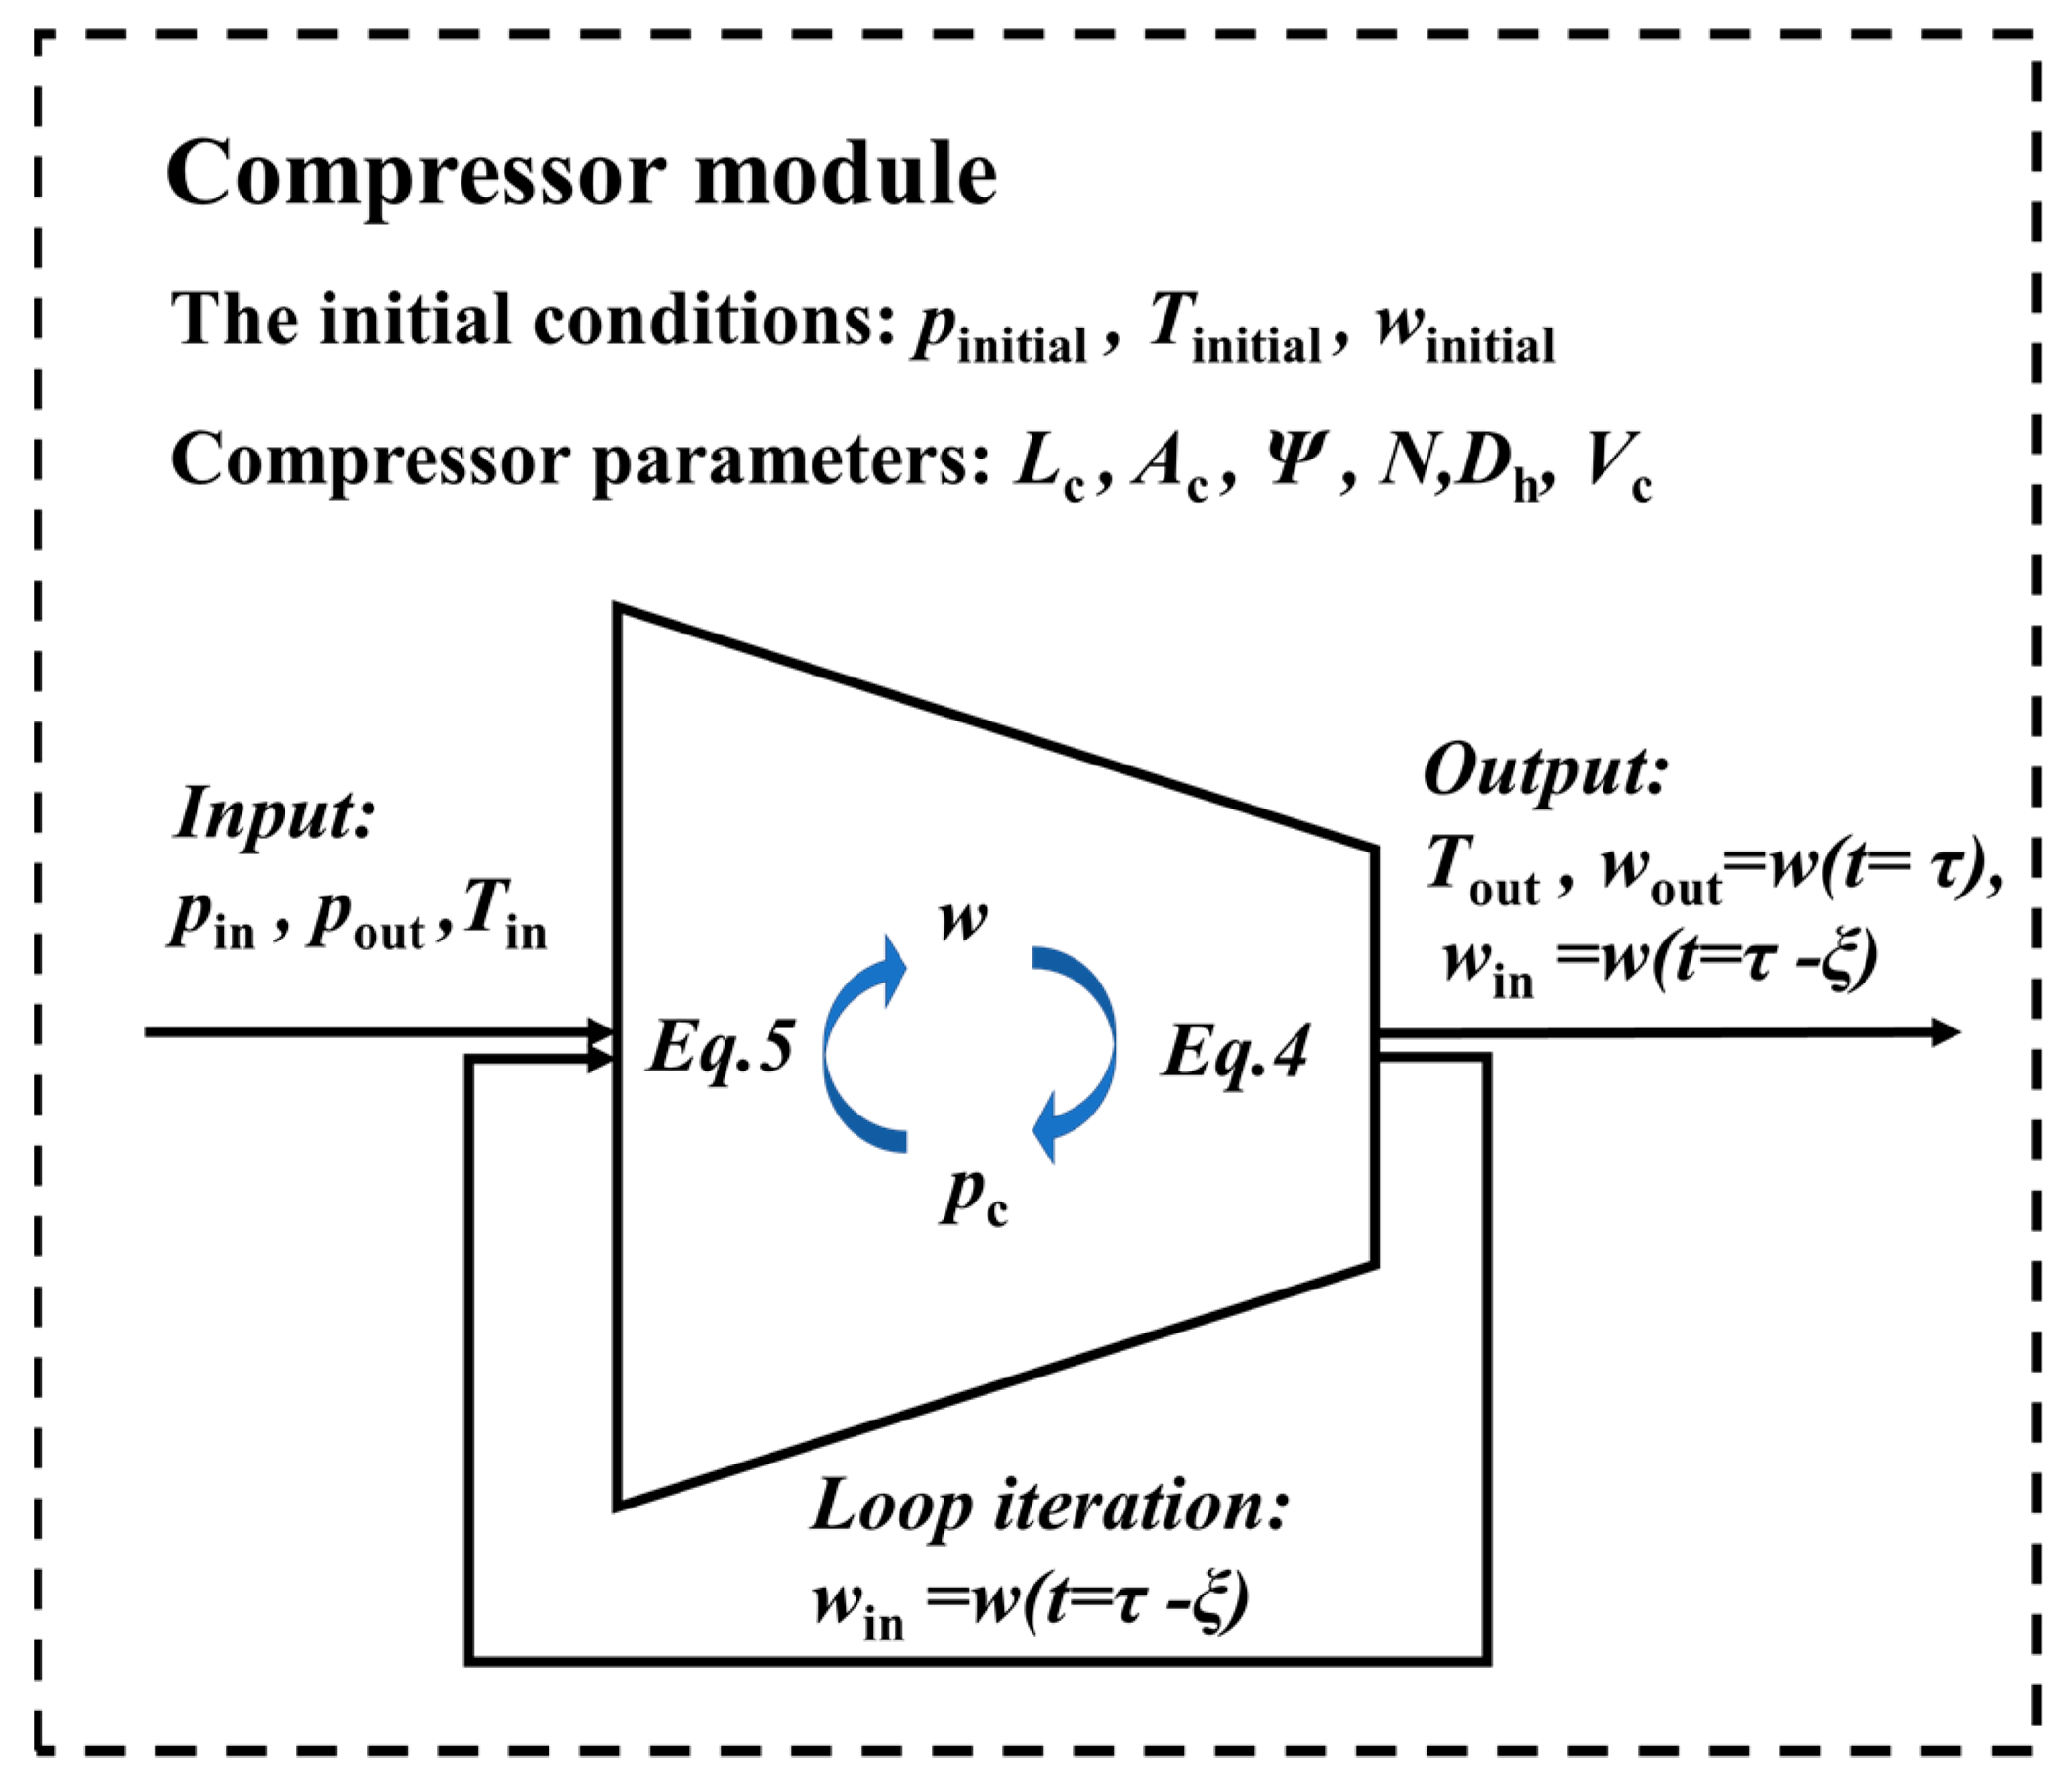
Vc is the volume of the internal flow passage of a single compressor, which mainly includes the space of flow passage between blades and the space inside the diffuser. pc is the lumped pressure of the internal flow passage volume Vc, which is calculated by the difference of the mass flow rate in and out of the compressor at a certain time in Equation (4). pc is an internal iterative value because the input variable of the compressor module is the pressure upstream and downstream, and the output variable is the mass flow rate.
Figure 1 shows the specific calculation and iteration process of the compressor module. In the simulation, the mass flow rate of the compressor is calculated due to the upstream and downstream pressure. It is considered that the mass flow at this moment is the inlet flow, and the flow after a time step is the outlet flow. The mass flow w and internal lumped pc iterate over each other in each time step.
The throttle valve module takes upstream and downstream pressure as input and the mass as output. The throttle equation is given by:
w = A T C f ρ ( p in p out ) = k T π D T 2 1 cos ( π 2 u T ) 4 C f ρ ( p in p out )
According to the thermodynamic equation, the uniform parameter model of a pipe network with m entrances and n exits is as follows.
d p d t = R g V p ( C p ( p , T ) R ) [ i = 1 m ( h in _ i ( p in _ i , T in _ i ) + v in _ i 2 2 ) w in _ i j = 1 n ( h out _ j ( p out _ j , T out _ j ) + v j 2 2 ) w j + Q s ] + R g T [ ( T h ( p , T ) R g T C p ( p , T ) R ) ( i = 1 m w in _ i j = 1 n w out _ j ) ]
d T d t = R g T p V p ( ( C p ( p , T ) R ) ) [ ( i = 1 m w in _ i j = 1 n w out _ j ) ( h ( p , T ) R g T ) + i = 1 m ( h in _ i ( p in _ i , T in _ i ) + v in _ i 2 2 ) w in _ i j = 1 n ( h out _ j ( p out _ j , T out _ j ) + v out _ j 2 2 ) w out _ j + Q s
where subscript “in_i” and “out_j” represent the serial number of the inlet and outlet sections of the pipeline, respectively.
Flow losses usually include friction losses, local pressure losses at bends, and flow separation losses at fork crossings. The pressure loss Δpij from inlet i to outlet j is obtained as follows:
p in _ i p out _ j = ( l f λ v 2 ρ 2 D i ) + ( ζ t l t v 2 ρ D i ) + ( ζ m v m 2 ρ 2 + ζ d v d 2 ρ 2 )
where vm and vd are the velocity of the main flow and tributary flow, respectively. Di is the diameter of the pipe i. lf is the length of a straight pipe. lt is the equivalent length of the bent pipe, which is defined as the length at which the fluid completes the change in velocity direction. ζt is the pressure loss coefficient of the bend, which is a constant value related to pipe diameter and turning radius. ζm and ζd are the pressure loss coefficients of the main and tributary flow at fork crossings, respectively.
The MDSG simulation system was established, and the MATLAB/Simulink platform was used for modeling, simulation, and programming. The ideas of MDSG modeling are as follows:
  • Modular modeling. The compressor simulation module is obtained according to Equations (4) and (5), the input parameter is the pressure upstream and downstream, and the output parameter is mass flow. The valve simulation module is obtained according to Equation (6), the input parameter is the pressure upstream and downstream, and the output parameter is mass flow. The pipe network simulation module is obtained according to Equations (7)–(9), the input parameter is the mass flow of each interface, and the output parameter is the pressure of each interface. Key parameters are set according to the actual parameters of the simulated object.
  • Systematic modeling. According to the structure of the target compression system, the simulation module is divided into two categories: one is the pressure output type, mainly for the pipe network, and the other is the flow output type, mainly for the compressor and valve. The two types of modules appear in turn according to the actual situation. During the simulation, pressure and mass flow iterate with each other to achieve dynamic simulation.

3. Experimental Validation of the Parallel Compression System

To verify the reliability of the MDSG model, an industrial air suction parallel compression simulation system is developed. Figure 2 shows the structure of the air suction compression system in detail. The system is connected to the upstream equipment for venting, which consists of three compressor subsystems, a suction pipeline, and valves. The green arrow in the figure represents the flow direction of air in the system during normal operation, where the exhaust gas is discharged into the atmosphere from the upstream equipment under the work of the parallel compression system. The compression subsystem has the same structure and operates in parallel as required. Valve 0 connects with the atmosphere to control the pressure in the suction pipeline. Moreover, detectors for pressure and temperature are installed at the inlet and outlet of each compressor.
Figure 3 shows the definition and transmission of each parameter in the MDSG model of the air suction parallel compression system. The equivalent geometric parameters (Ac, Lc, Dh, and Vc) of the compressors are provided by the manufacturer. The speed of the compressor is a constant 27,500 r/min, and the performance maps of the compressors are obtained from the test results of each compressor. It is worth noting that although the compressor models of the three subsystems are the same, there are slight differences in industrial construction, resulting in their pressure in the same mass flow not being the same. The geometric parameters of the pipe network (Vp) of the three subsystems are derived from the diameter and length provided in the actual construction drawings. The geometric parameters of valves (DT, kT) depend on valve type and geometry, and the flow characteristic function of each valve (Cf) is obtained from CFD numerical results. The boundary conditions include atmosphere pressure p0, environment temperature T0, and the pressure and temperature of upstream equipment pM, TM. Input parameters of the simulation system are the opening of each valve. An actual gas suction process lasting 700 s is simulated. The atmospheric pressure and temperature of the simulation are equal to the experiment, where p0 = 97,000 Pa and T0 = 300 K.
The pressure and temperature measured in the experiment of upstream equipment are used as the dynamic boundary condition for valve M. The valve opening recorded in the actual process is used as the input instruction of each valve in the simulation. The opening of valves 11, 21, 31, 13, 23, and 33 is 100%, and the opening of the recirculation valve 12, 22, and 32 is constantly 0% during the 700 s of the working condition, which results in a compressor recirculation mass flow rate of 0 for the three subsystems. The opening of valve 0 and valve M is shown in Figure 4.
The dynamic parameter of air in all interfaces is obtained by the MDSG model. Figure 5 shows the simulated pressure and experimental pressure of each compression subsystem in the air suction system. The simulation and experimental results of the inlet temperature (T13, T23, T33,) and outlet pressure (T14, T24, T34) of the compressor are compared and analyzed in Figure 6. The working condition of the three compression subsystems is the same because the valves in each subsystem do not change during the operation. The parallel system is continuously in a state of exhaust. The pressure variation of the compressor inlet in the three compression subsystems shows a consistent trend. The pressure increases at about 150 s and decreases at 500 s, which is caused by the change in the pressure of the upstream suction pipeline (pz). The temperature of the inlet and outlet of the compressor is in a steady state, and the simulation and experimental results remain constant. According to the simulation results, the difference between each subsystem is very small when the compression system is in parallel suction operation, which is consistent with the text. The maximum error of the simulation and experiment results of temperature is less than 10 K, and the pressure is less than 1000 Pa in the parallel compression system. It can be found that the simulation values of pressure and temperature have the same changing trend as the experimental values, and the error is small in the whole process.
From Figure 5 and Figure 6, the behaviors of the three subsystems have consistent trends, with subtle differences in response speed and fluctuations. The pressure of the three subsystems is the same, but the temperature is slightly different. The reason is that although the structure of the three subsystems is consistent, the performance maps (Ψ) of their compressors are slightly different, and the pressure under the same mass flow rate is not completely consistent. The differences in the performance map come from the actual test data of the compressors in three subsystems, which can explain the imparity in the simulation results of the subsystems. Moreover, the difference in temperature is mainly caused by the slight difference in the heat transfer process. In the actual compression system, the location of the outlet-temperature-measuring equipment of the three compressor subsystems is slightly different, which is reflected in the distance of the outlet and the number of pipe bends. To obtain more accurate simulation results, heat exchange terms Qs are calculated, respectively, according to the flow process from the compressor outlet to the thermometer, which introduces deviation into the simulation.
Figure 7 shows the simulation results of the pressure and temperature of the suction pipeline. In this working condition, the parallel compression system downstream of the suction pipeline keeps a constant working state. The pressure and temperature change with the opening of valve 0 and valve M. The exhaust gas of the upstream equipment of valve M has a great influence on the suction pipe pressure. Valve 0 is connected with the atmosphere as a regulating valve, and its influence is relatively weak. Valve M gradually opens from 0.5 to 0.7 between 146 and 209 s as suction pipeline pressure pz gradually increases, where the stage of pressure rise corresponds to the step change of the opening of valve M during this period. At 487 s, valve M closed from 0.7 to 0.5, resulting in a decrease in pz. The pressure fluctuation of pz in each stage is mainly caused by the change of opening of valve 0. The temperature of the suction valve varies within 6 K and is affected by the exhaust gas temperature of the upstream equipment. Qualitatively, the simulation results of the suction pipeline are consistent with the actual situation.
The relative error of pressure and temperature of the inlet and outlet of the compressor in the compression system is shown in Figure 8. The average relative error of pressure of the compressor inlet is less than 2.1%, and for the compressor outlet, it is less than 0.9%. For the relative error of the temperature, the average value of the compressor inlet is less than 1.6%, and for the compressor outlet, it is less than 2.9%. The maximum dynamic relative errors of pressure and temperature in each subsystem are less than 5%. The relative error distribution of each compression subsystem is slightly different, and the overall trend is generally consistent. The reason is that the conditions of each subsystem are consistent in this verification, and both the structure and the parameters of the subsystems are the same, whether in real industry or the dynamic simulation. The average error is less than 3% which proves the reliability of MDSG as a gray box model in real-time dynamic simulation. The precision of dynamic simulation can be improved by coupling characteristic functions of key components on the premise of the modeling method based on physical mechanisms. In summary, experiment and simulation verify that the MDSG model is suitable for the real-time dynamic simulation study of parallel compression systems.

4. Simulation Research on Surge Condition

4.1. Modeling of the Compression System with One Throttle Valve

The MDSG model is used to simulate the compression system with one throttle valve, which includes a compressor, a pipeline, and a throttle valve. As with common compressor performance testing systems, the compressor intake is exposed to the atmosphere. A long and straight round pipe is installed at the downstream outlet of the compressor, connecting with a butterfly valve on the other side. The butterfly valve will discharge the gas from the compressor to the atmosphere. In the MDSG model, compressors, valves, and pipes are treated as separate lumped parameter components. The schematic diagram of the modeling and a serial number of the connecting surface of each component are also shown in Figure 9. The prototype of the compressor module is a centrifugal compressor with a design mass flow of 2.7 kg/s. According to the geometric dimensions of the compressor, Lc = 0.317 m, and Ac = 0.0471 m2. The pipeline is straight, with a length of 1.5 m and a pipe diameter of 0.2 m. The throttle is a butterfly valve with a diameter of 0.2 m. The upstream and downstream boundaries are both atmospheres, where pressure p0 and temperature T0 are 97,600 Pa and 290 K, respectively. The dynamic parameter of valve opening uT(t) from outside input is shown in Figure 10. To simulate the physical opening behavior of the valve, the valve opening is a linear variable. The initial pressure of the pipeline is set as atmospheric pressure, and the initial mass of the compressor is a minimal disturbance. The time step of the simulation is a variable step in which the max step is 0.01 s and the min is 10−6 s, and the relative tolerance of the simulation value is 10−3.
The dynamic simulation is carried out by adjusting the valve until the compressor system enters the surge state. Figure 11 shows the system trajectories, and Figure 12 shows the time responses of mass flow, pressure, and temperature of the compressor. The πp is defined as the ratio of outlet pressure to the inlet pressure of the compressor. As the figure shows, the compression system is initially working steadily at throttle opening uT = 100%. The operation point is then changed at 3 s, 6 s, 9 s, and 12 s by reducing the valve opening to 70%, 50%, 30%, and 10%, respectively. As the valve turns down from t = 0 s to t = 12 s, the mass decreases and the pressure increases synchronously at the compressor outlet as the operation point is switched between a stable and unstable state. During this period, the compressor works normally, and its operation point migrates from point A to point B. From t = 13 s, the surge occurs, and the mass flow and pressure of the system fluctuate periodically. The surge phenomenon is shown on the compressor map in Figure 11 as operation points following an “F-B-C-D-E-F” cycle. When the operation point closes to the surge line, the mass flow of the system is so small that the downstream pressure of the compressor component is greater than the upstream pressure. Pressure points calculated by Ψ during compressor iterations migrate continuously to the left of the surge line (point B). The appearance of reversed flow (w2 < 0) causes the pressure to decrease, and the operation point migrates to point D. Then, the high pressure downstream of the compressor is released with the operating condition points going from D to E and finally to F because of reversed flow. The surge will continue to repeat the above process and vibrate the system periodically. The dynamic phenomenon of compressor surge obtained by the MDSG model in Figure 11 is consistent with the Bond Graph model by Uddin and Gravdahl [3]. In both models, the migration of operating points is the same. Furthermore, there is a specific phase difference between pressure and mass flow fluctuation. The same conclusion in the simulation provides support for the reliability of surge simulation by the MDSG model.
As shown in Figure 12a, the mass flow at the outlet of the compressor fluctuates sharply, while the mass flow at the outlet of the pipeline network fluctuates less. The reason is that the plenum of the pipeline network has the function of air storage, and the change of mass flow at the inlet and outlet of the pipeline network is transformed into the fluctuation of pressure. In addition, the phase difference between pressure fluctuation and flow fluctuation is one-quarter of a cycle under unsteady conditions. The temperature fluctuation at the outlet of the compressor is consistent with the pressure trend. The temperature is continuously rising because the system is affected by heat exchange with the environment, which makes heat equilibrium take more time than pressure equilibrium. For compressor systems, the condition of the surge is determined by the compressor map and valve flow characteristics. The amplitude and frequency of pulsation are affected by compressor parameters and pipeline volume.
In summary, the compression system with one throttle valve is simulated by using the MDSG modeling method. The simulation results of surge conditions are consistent with previous studies by Uddin and Gravdahl [3]. The specific valve opening was not given in their study, but the migration diagram of operating points and the parameter fluctuations were given. The migration of the operating point during the surge obtained in this study is consistent with Uddin’s study. The surge frequency in this study is similar to Uddin’s result, which is about 6 Hz. In addition, the phase difference between pressure fluctuation and mass flow fluctuation is one-quarter of a cycle under surge conditions, which can be obtained from the MDSG modeling and the bond graph modeling in Uddin’s study. Consequently, the MDSG modeling method is feasible for compression systems.

4.2. Modeling of the Compression System with Two Throttle Valves

In practical industrial applications and compressor performance tests, it is common to install two valves at the inlet and outlet of the compressor. Based on the compression system shown in Figure 9, a pipe network and a throttle valve are added to establish a compression system with two valves, as shown in Figure 13. The serial number of the connecting surface of each component is shown in Figure 13, in which interface 3 is the inlet of the compressor component and interface 4 is the outlet. Pipeline networks A and B are both 1.5 m in length and 0.2 m in diameter. The valve 0# and 1# are butterfly valves with a diameter of 0.2 m. The compressor parameters and atmospheric parameters are the same as the previous one. In the industrial gas supply system, a typical ending gas supply process is to reduce the outlet valve first and then the inlet valve. The compressor faces the risk of entering a surge condition when the air supply stops. According to the industrial process, the valve opening is set in the simulation system. The throttle openings uT_0(t) and uT_1(t) are given in Figure 14. The operating point of the system is controlled by the inlet and outlet valves of the system. The system trajectory is shown in Figure 15, and the time response of compressor pressure, mass flow, and temperature is shown in Figure 16. From 0 to 12 s, valve 1# is gradually closed, causing the compressor system to migrate between multiple steady-state conditions. As valve 1# is closed in sequence, the operation point of the compression system moves to the left side of the surge line from t = 13 s. So far, it was seen that the change of unsteady conditions and the surge phenomenon before 13 s are similar to the previous results. In addition, the dynamic variables of pipeline A and the inlet mass flow w1 of the system are also given to further analyze the distribution of the thermodynamic parameter of the system. From 13 to 15 s, the inlet mass flow w1 of the system vibrates more than the outlet mass flow w6. The reason is that the pressure vibration amplitude of upstream pipe network A of the compressor is smaller than that of downstream pipe network B when a surge occurs, as shown in Figure 16b. The difference in pressure vibration amplitude between pipeline networks A and B is affected by the valve opening of the pipe network. The opening of valve 1# is less than that of valve 0#, so the resistance of air leaving pipe network B is greater, and the energy of the gas is more easily converted into pressure fluctuations in pipe network B. In other words, the energy of the gas in the compressor is dissipated by pressure fluctuation or mass flow fluctuation during the surge.
From t = 15 s to t = 20 s, uT_0 is reduced from 100% to 10%. Under the condition of the surge, as valve 0# is continuously regulated, we can observe that the vibration amplitude of w1 decreases, and the vibration amplitude of p3 increases with the decrease in uT_0. As valve 0# is closed, the resistance of gas entering pipe network A increases. Therefore, the impact of the surge is reflected in the increase in pressure fluctuation and the decrease in average pressure in pipe network A. From the figures, we can also observe that the vibration amplitude and mean pressure of p4 decrease with the closing of valve 0#. For the compression system, a smaller uT_0 means that the mass flow into the system is smaller and the load on the entire compressor system is lower. There is a similar experience in the actual industrial site; the upstream valve of the compressor is more easily affected by the adjustment of the compressor power, while the downstream valve has a greater impact on the migration of the operation point. The results also show that the temperature trend is consistent with the pressure. Because T3 is similar to T0 in pipe network A, there is less heat transfer on the pipe wall in front of the compressor. Therefore, there is no obvious trend in the average temperature of T3 except for the dynamic changes caused by pressure fluctuations. T4 tends to rise because the compressor effect and the heat transfer balance take longer to reach. Finally, the vibration frequency of the compressor surge increases as the inlet valve 0# is turned down. According to the dynamic changes of parameters during the surge, it can be observed that the vibration frequency of mass flow is different among t = 13–15 s, t = 15–18 s, and t = 18–20 s. The frequency characteristics of pressure, temperature, and flow under surge conditions in the above three periods are obtained by FFT, as shown in Figure 17. It can be observed from the figure that valve 0# will cause a change in the surge frequency of the compressor system. From 13 to 15 s, valve 0# is 100% open. From 16 to 18 s and 19 to 20 s, the opening of valve 0# is 50% and 10%, respectively. With the decrease in the opening of the inlet valve, the frequency of the compression system increases. In addition, for the surge in the same period, the vibration frequencies of mass flow, pressure, and temperature are the same. The increase in surge frequency is caused by the decrease in mass flow of the system when closing the inlet valve, and the main frequency of surge changes with the opening of the inlet valve.
The top, middle, and bottom of each figure represent the frequencies of 13–15 s, 15–18 s, and 18–20 s respectively.
Conclusively, MDSG modeling can broaden the application scope of the Greitzer model and obtain a wider range of dynamic parameter information. For example, for the target compressor system with multiple valves, the MDSG model can obtain the dynamic changes of pressure, temperature, mass flow rate at the inlet and outlet of each valve and the compressor and show different responses when different valve actions are put into operation. Hence, MDSG provides more ideas and opportunities for compression systems with two or more valves and other complex systems to further study surge characteristics and surge control.

5. Conclusions

Based on the analysis of existing modeling methods, an MDSG model of a complex compression system was proposed. A complex gas suction parallel compression system was also developed by the MDSG method. The experimental validation of the parallel compression system showed that the average error is less than 3% and the maximum error is less than 5%.
The compression systems with one valve and two valves were established by the MDSG model, and the dynamic performance of the surge phenomenon of the compression system was simulated and analyzed. The simulation results are consistent with the surge phenomenon in previous studies, which indicates that MDSG modeling can simulate the dynamic changes of compressor surge conditions.
In the dynamic simulation research of compressor surge based on MDSG modeling, when a surge occurs, the operating point suddenly migrates on the performance curve, and the pressure is consistent with the vibration frequency of the mass flow during the surge. The phase difference between pressure fluctuation and flow fluctuation is one-quarter of a cycle under unsteady conditions because that plenum of the pipeline network has the function of air storage, and the change of mass flow at the inlet and outlet of the pipeline network is transformed into the fluctuation of pressure.
Adjusting the outlet valve instead of the inlet valve of the compression system can make the system enter the surge condition more efficiently. Furthermore, adjusting the inlet valve of the system will change the amplitude, frequency, and base value of the vibration of the pressure and flow under the surge condition.

Author Contributions

Conceptualization, Y.S. and X.C.; methodology, Y.S. and X.C.; software, Y.S.; validation, X.L. (Xiaoming Liu), X.W. and X.L. (Xiaodong Li); formal analysis, Y.S. and X.C.; investigation, X.C.; resources, X.L. (Xiaoming Liu); data curation, X.L. (Xiaoming Liu), X.W. and X.L. (Xiaodong Li); writing—original draft preparation, Y.S.; writing—review and editing, X.C.; visualization, Y.S.; supervision, Y.S.; project administration, X.C.; funding acquisition, X.L. (Xiaoming Liu), X.W. and X.L. (Xiaodong Li). All authors have read and agreed to the published version of the manuscript.

Funding

This research was funded by The Stable Support Research Project of AECC Sichuan Gas Turbine Establishment [Grant No. GJCZ-0013-19] and The Open Foundation of State Key Laboratory of Compressor Technology (Compressor Technology Laboratory of Anhui Province) [Grant No. SKL-YSJ2020007].

Conflicts of Interest

The authors declare that they have no known competing financial interests or personal relationships that could have appeared to influence the work reported in this paper.

Abbreviations

ρDensity
pAbsolute pressure
TAbsolute temperature
wMass flow rate
vAbsolute velocity
uiTensor form of velocity
xiTensor form of Distance
fiTensor form of force
Ux, Uy, UzVelocity in direction of x, y, and z
μCoefficient of viscosity
UModerate form of velocity
RgConventional gas constant
CpConstant pressure heat capacity
hIsentropic enthalpy
αThermal conductivity of the gas
ΦHeat from viscosity
ShHeat source
a01Speed of sound
NSpeed of the compressor
AcCross-sectional area of the compressor duct
LcEffective length of the equivalent compressor duct
λFriction factor
VcVolume of the internal flow passage of a single compressor
ΨDimensionless performance function of the compressor
pcUniform pressure of plenum Vc
ATFlow area of the valve
DTDiameter of the valve
kTCoefficient for calculating AT, which is related to the geometry and type of valve
CfFlow resistance coefficient
uTThrottle opening ranges from 0 to 100%
VpVolume of the pipeline network
QsHeat transfer between the pipe gas and the wall

References

  1. Bianchini, A.; Carnevale, E.A.; Biliotti, D.; Altamore, M.; Cangemi, E.; Giachi, M.; Rubino, D.T.; Tapinassi, L.; Ferrara, G.; Ferrari, L. Development of a Research Test Rig for Advanced Analyses in Centrifugal Compressors. Energy Procedia 2015, 82, 230–236. [Google Scholar] [CrossRef]
  2. Gravdahl, J.T.; Egeland, O. Compressor Surge and Rotating Stall: Modeling and Control; Incorporated; Springer Publishing Company: Berlin/Heidelberg, Germany, 1999. [Google Scholar]
  3. Uddin, N.; Gravdahl, J.T. Bond graph modeling of centrifugal compression systems. Simul. Trans. Soc. Model. Simul. Int. 2015, 91, 998–1013. [Google Scholar] [CrossRef]
  4. Jager, B.D. Rotating stall and surge control: A survey. Proceedings of 1995 34th IEEE Conference on Decision and Control, New Orleans, LA, USA, 13–15 December 1995. [Google Scholar]
  5. Willems, F.; Jager, B.D. Modeling and control of rotating stall and surge: An overview. In Proceedings of the 1998 IEEE International Conference on Control Applications, Trieste, Italy, 4 September 1998. [Google Scholar]
  6. Greitzer, E.M. Surge and Rotating Stall in Axial Flow Compressors—Part I: Theoretical Compression System Model. J. Eng. Power 1976, 98, 190. [Google Scholar] [CrossRef]
  7. Moore, F.K.; Greitzer, E.M. A Theory of Post-Stall Transients in Axial Compression Systems: Part II—Application. J. Eng. Gas Turbines Power 1986, 108, 231–239. [Google Scholar] [CrossRef]
  8. Moore, F.K.; Greitzer, E.M. A Theory of Post-Stall Transients in Axial Compression Systems: Part I—Development of Equations. J. Eng. Gas Turbines Power 1986, 108, 68–76. [Google Scholar] [CrossRef]
  9. Gravdahl, J.T.; Egeland, O.; Vatland, S.O. Drive torque actuation in active surge control of centrifugal compressors. Automatica 2002, 38, 1881–1893. [Google Scholar] [CrossRef]
  10. Backi, C.J.; Gravdahl, J.T.; Grotli, E.I. Nonlinear observer design for a Greitzer compressor model. In Proceedings of the 21st Mediterranean Conference on Control and Automation, Crete, Greece, 25–28 June 2013. [Google Scholar]
  11. Backi, C.J.; Gravdahl, J.T.; Skogestad, S. Simple method for parameter identification of a nonlinear Greitzer compressor model. IFAC Pap. 2018, 51, 198–203. [Google Scholar] [CrossRef]
  12. Gravdahl, J.T.; Egeland, O. Compressor surge control using a close-coupled valve and backstepping. Am. Control. Conf. 1997, 2, 982–986. [Google Scholar]
  13. Gravdahl, J.T.; Willems, F.; Jager, B.D.; Egeland, O. Modeling for surge control of centrifugal compressors: Comparison with experiment. IEEE Conf. Decis. Control 2007, 2, 1341–1346. [Google Scholar]
  14. Cortinovis, A.; Ferreau, H.J.; Lewandowski, D.; Mercangz, M. Experimental evaluation of MPC-based anti-surge and process control for electric driven centrifugal gas compressors. J. Process Control 2015, 34, 13–25. [Google Scholar] [CrossRef]
  15. Taleb Ziabari, M.; Jahed-Motlagh, M.R.; Salahshoor, K.; Ramezani, A.; Moarefianpur, A.; Lam, J. Robust adaptive control of surge instability in constant speed centrifugal compressors using tube-MPC. Cogent Eng. 2017, 4, 1–20. [Google Scholar] [CrossRef]
  16. Shafieian, M.; Zavar, M.; Rahmanian, M. Simulation and Control of Surge Phenomenon in Centrifugal Compressors. Traitement Signal 2019, 36, 259–264. [Google Scholar] [CrossRef]
  17. Powers, K.H.; Kennedy, I.J.; Brace, C.J.; Milewski, P.A.; Copeland, C.D. Development and Validation of a Model for Centrifugal Compressors in Reversed Flow Regimes. In Proceedings of the ASME Turbo Expo 2020: Turbomachinery Technical Conference and Exposition, London, UK, 21–25 September 2020. [Google Scholar]
  18. Grapow, F.; Likiewicz, G. Study of the Greitzer Model for Centrifugal Compressors: Variable Lc Parameter and Two Types of Surge. Energies 2020, 13, 6072. [Google Scholar] [CrossRef]
  19. Jaeschke, A.; Liskiewicz, G. Sensitivity Study of Greitzer Model Based on Physical System Parameters of Radial Compressing Units. Energies 2020, 13, 5111. [Google Scholar] [CrossRef]
  20. Tournes, C.; Landrum, D. Development of a physically based axial compressor model. Proceedings of Thirtieth Southeastern Symposium on System Theory, Morgantown, WV, USA, 10 March 1998; pp. 120–124. [Google Scholar]
  21. Venturini, M. Development and Experimental Validation of a Compressor Dynamic Model. J. Turbomach. 2005, 127, 599–608. [Google Scholar] [CrossRef]
  22. Yoon, S.Y.; Lin, Z.; Goyne, C.; Allaire, P.E. An enhanced Greitzer compressor model with pipeline dynamics included. J. Vib. Acoust. 2011, 133, 051005. [Google Scholar] [CrossRef]
  23. Jin, Y.; Fu, Y.; Qian, Y.; Zhang, Y. A Moore-Greitzer Model for Ducted Fans in Ground Effect. J. Appl. Fluid Mech. 2020, 13, 693–701. [Google Scholar] [CrossRef]
  24. Lu, S.; Liu, Y.; Yao, Y.; Sun, L.; Zhong, M. Bond-graph model of a piezostack driven jetting dispenser. Simul. Model. Pract. Theory 2014, 49, 193–202. [Google Scholar] [CrossRef]
  25. Montazeri, G.M.; Miran, F.S.A. Application of Bond-Graph Method in Microjet Engine Cold Start Modeling to Investigate the Idea of Injecting Compressed Air. Appl. Mech. Mater. 2015, 799–800, 890–894. [Google Scholar] [CrossRef]
  26. Montazeri, G.M.; Fashandi, S.A.M. Bond graph modeling of a jet engine with electric starter. Proc. Inst. Mech. Eng. Part G-J. Aerosp. Eng. 2019, 233, 3193–3210. [Google Scholar] [CrossRef]
  27. Lu, Y.; Wang, F.; Jia, M.; Qi, Y. Centrifugal compressor fault diagnosis based on qualitative simulation and thermal parameters. Mech. Syst. Signal Process. 2016, 81, 259–273. [Google Scholar] [CrossRef]
  28. Liu, E.; Lv, L.; Yi, Y.; Xie, P. Research on the Steady Operation Optimization Model of Natural Gas Pipeline Considering the Combined Operation of Air Coolers and Compressors. IEEE Access 2019, 7, 83251–83265. [Google Scholar] [CrossRef]
  29. Shakya, P.; Ooi, K.T. Dynamic modelling and experimental validation of Coupled Vane Compressor. IOP Conf. Ser. Mater. Sci. Eng. 2021, 1180, 012029. [Google Scholar] [CrossRef]
Figure 1. System diagram of iteration and calculation in compressor module.
Machines 11 00213 g001
Figure 2. The structure diagram of an air suction compression system.
Machines 11 00213 g002
Figure 3. The schematic diagram of the MDSG model of an air suction parallel compression system.
Machines 11 00213 g003
Figure 4. The variation in the opening of valves in the air suction system over time. (a) Opening of valve 0, (b) opening of valve M.
Machines 11 00213 g004aMachines 11 00213 g004b
Figure 5. Comparison of simulation and experimental results on compressor pressure. (a) Results of compression subsystem 1, (b) results of compression subsystem 2, (c) results of compression subsystem 3.
Machines 11 00213 g005
Figure 6. Comparison of simulation and experimental results on compressor temperature. (a) Results of compression subsystem 1, (b) results of compression subsystem 2, (c) results of compression subsystem 3.
Machines 11 00213 g006
Figure 7. The simulation results of the suction pipeline. (a) The simulation results of the pressure, (b) the simulation results of the temperature.
Machines 11 00213 g007
Figure 8. The relative error of simulation and experimental results. (a) The relative error of inlet pressure, (b) the relative error of outlet pressure, (c) the relative error of inlet temperature, (d) the relative error of outlet temperature.
Machines 11 00213 g008aMachines 11 00213 g008b
Figure 9. System diagram of the compression system with one throttle valve.
Machines 11 00213 g009
Figure 10. Opening of valve.
Machines 11 00213 g010
Figure 11. Compressor operating trajectory of the compression system with one throttle valve. Where the red solid line is the track of the migration of operating points, and the black dotted line is the compressor performance curve. The points “ABCDEF” are the key node for the change of compressor working condition. The blue shear head represents the direction of migration of working condition point during surge.
Machines 11 00213 g011
Figure 12. Mass flow (a), pressure (b), and temperature (c) of the compression system with one throttle valve in surge condition.
Machines 11 00213 g012
Figure 13. System diagram of the compression system with two throttle valves.
Machines 11 00213 g013
Figure 14. Opening of two valves of the compression system.
Machines 11 00213 g014
Figure 15. Compressor operating trajectory of the compression system with two throttle valves. Where the red solid line is the track of the migration of operating points, and the black dotted line is the compressor performance curve.
Machines 11 00213 g015
Figure 16. Mass flow (a), pressure (b), temperature (c) of the compression system with two throttle valves.
Machines 11 00213 g016
Figure 17. Simulation parameters of the different surges in the frequency domain. (a) Mass flow, (b) pressure, (c) temperature.
Machines 11 00213 g017aMachines 11 00213 g017b
Disclaimer/Publisher’s Note: The statements, opinions and data contained in all publications are solely those of the individual author(s) and contributor(s) and not of MDPI and/or the editor(s). MDPI and/or the editor(s) disclaim responsibility for any injury to people or property resulting from any ideas, methods, instructions or products referred to in the content.

