Article

Thermal-Fluid-Solid Coupling Simulation and Oil Groove Structure Optimization of Wet Friction Clutch for High-Speed Helicopter

1
State Key Laboratory of High Performance Complex Manufacturing, College of Mechanical and Electrical Engineering, Central South University, Changsha 410017, China
2
National Key Laboratory of Science and Technology on Helicopter Transmission, Hunan Aviation Powerplant Reseach Institute, Aero Engine Corporation of China, Zhuzhou 412002, China
3
Shenzhen Research Institute of Central South University, Shenzhen 518057, China
4
Guangdong Provincial Key Laboratory of Manufacturing Equipment Digitization, Guangdong HUST Industrial Technology Research Institute, Dongguan 523770, China
*
Author to whom correspondence should be addressed.
Machines 2023, 11(2), 296; https://doi.org/10.3390/machines11020296
Submission received: 1 December 2022 / Revised: 9 February 2023 / Accepted: 10 February 2023 / Published: 16 February 2023
(This article belongs to the Special Issue Dynamic Stability Analysis of Aerospace Structures)

Abstract

:
Wet friction clutch is the key functional component of the high-speed helicopter variable-speed transmission system, which is used to change the power transmission path. In the engagement process of wet friction clutch, the driving/driven disc will produce drag torque under the shearing of lubricating oil, which reduces the transmission efficiency. This unnecessary drag torque reduces efficiency and increases clutch temperature. The temperature increase promotes the wear of gears and bearings and the aging deformation of friction plates, which leads to local wear and reduces the service life of the clutch. From the principle of wet friction clutch, the oil groove structure is directly related to the drag torque and the temperature rise of friction disc. It is very important for the long-distance flight and service life of high-speed helicopters to obtain the groove structure with low drag torque and low temperature rise. In order to solve this problem, taking the wet friction clutch of a high-speed helicopter as the research object, based on the radial and annular compound groove, the thermal-fluid-solid coupling simulation model of the wet friction clutch is established to obtained the flow characteristics and temperature field distribution of the lubricating oil in the friction disc oil groove, and to analyze the influence law of the oil groove structure parameters on the drag torque and temperature field. In order to improve the transmission efficiency and the service life of friction disc, Taguchi experiment and non-dominated neighborhood immune algorithm were used to optimize the structural parameters of the oil grooves. The comparison results show that the optimized structural can effectively reduce the drag torque and the temperature rise. This work can provide a theoretical reference for the structure design of a wet friction clutch.

1. Introduction

High-speed helicopters occupy an important position in the field of modern air weapons and equipment by the virtue of their high mobility, wide range of operations, and strong close air support capability. The transmission system of high-speed helicopter changes the power transmission path by engaging and disengaging the wet friction clutch, which is an important means of high mobility. The engagement process of the wet friction clutch can be divided into three operating states: full engagement, sliding, and disengagement. The friction disc and the separator disc on disengagement stage are in a complete separation state, but the speed difference of discs is large. Due to the shear action of lubricating oil, there will be greater resistance torque between discs, which is useless torque to reduce transmission efficiency. According to the working principle of the wet friction clutch, the oil groove structure of the friction disc is directly related to the drag torque and temperature rise. Therefore, it is very important to obtain the oil groove structure with a small drag torque and low temperature rise for a wet friction clutch.
Regarding the design of a wet friction clutch oil groove structure, scholars at home and abroad have carried out a lot of research work. Scholars have explored this process from different perspectives. Kong et al. [1] applied CFD to simulate the heat flow coupling process of wet friction clutch, constructed different oil groove structures, and analyzed the frictional heat, convective cooling characteristics, and temperature distribution under the modes. However, there is a lack of research on thermal deformation behavior and energy loss. Zhang et al. [2] and Wu et al. [3] analyzed the mechanism of friction and impact at high speeds, established a fluid-solid coupling model considering the coupling motion of friction disc and separate disc, and analyzed the influence of lubricating oil flow rates on drag torque combined with the impact of friction disc. Hu et al. [4] studied the resistance moment generated by mechanical contact at high speed by establishing rigid body collision model from the perspective of mechanical contact between friction plate and separation plate at high speed. This is a new perspective in clutch research. However, most scholars conduct research on oil film movement behavior.
For the simulation method of wet friction clutch, most scholars use the description of complex multiphase flow form. Hu et al. [5] showed through experimental studies that the gradual decrease in oil film coverage area with the increase in rotational speed was a major reason affecting the drag torque, but no theoretical calculation model was established for this process. Yuan et al. [6] considered the surface tension of the oil film and believed that the drag torque was reduced due to air entering the clearance. A two-phase flow model was used to demonstrate the aeration process of the clutch at different speeds, and the phenomenon of the entire oil film breaking from the outer diameter to the inner diameter was clarified. Zhou et al. [7], in the analysis of two-speed dual clutches, improved the drag torque model of wet clutch by Yuan et al., and proposed a new method considering the equivalent radius of oil film contraction phenomenon. Li et al. [8], based on the relationship between inlet and outlet oil flow rate and volume, obtained a new equation for calculating the equivalent radius of oil film. In particular, the peak torque and the corresponding critical speed are also taken as two evaluation indexes. Iqbal et al. [9,10] regarded the drag torque as the sum of torques of oil film and atomized oil, and deduced the calculation model of drag torque on the basis of N-S equation and verified the reliability of the model through experiments. Meanwhile, the relationship between the relevant parameters of friction disc and the change in drag torque was studied. Leister et al. [11] used the method of dimensionless analysis to analyze the governing equation of fluid and proposed a modeling method for hydraulic diameter, which provided a prediction method for resistance and torque. Cui et al. [12,13] used the iterative method to solve the fluid drag torque and showed that when the rotational speed reached a certain value, centrifugal force played an important role in fluid distribution. Most scholars believe that drag torque is mainly affected by oil film morphology.
In order to find the influence of radial groove depth and radial groove number on disk performance under fixed clearance, Thomas et al. [14] and Zhang et al. [15] applied CFD simulation model and experiments, showing that groove number has a greater impact on drag torque, while groove depth has a smaller impact. Zhang et al. [15] analyzed the change rule of drag torque from three aspects of lubrication oil flow, density, and viscosity of wet single-disc friction clutch, and also emphasized the influence of heat dissipation performance on friction clutch. These studies emphasize that the rationality of oil groove structure has great influence on clutch performance.
The structure parameters of the oil groove directly affect the drag torque and friction temperature rise. However, the research fields of wet friction clutch at home and abroad are mostly vehicles, ships, and mining machinery. There is less research work on high-speed and heavy-duty clutch in the field of aviation. Moreover, most scholars only have a single target optimization with torque or friction disc temperature rise that less research on taking into account both. The drag torque and temperature distribution of friction clutch are important indexes to measure the performance of friction clutch. Therefore, the optimization of both can improve the working efficiency and service life of wet friction clutch.
This paper takes the wet friction clutch used in a high-speed helicopter transmission system as the research object. In order to reduce the temperature rising and drag torque as the optimization goal, a thermal-fluid-solid coupling simulation model based on radial-annular compound oil groove is established and orthogonal experiment is designed by Taguchi method. The influence of oil groove structure parameters on clutch working conditions is analyzed comprehensively; the multi-objective optimization algorithm of drag torque and maximum temperature is carried out by using non-dominant neighborhood immune algorithm (NNIA) to obtain the friction groove structure with small drag torque and low temperature rise.

2. Thermal-Fluid-Solid Coupling Modeling and Simulation

2.1. Working Principle of Wet Clutch

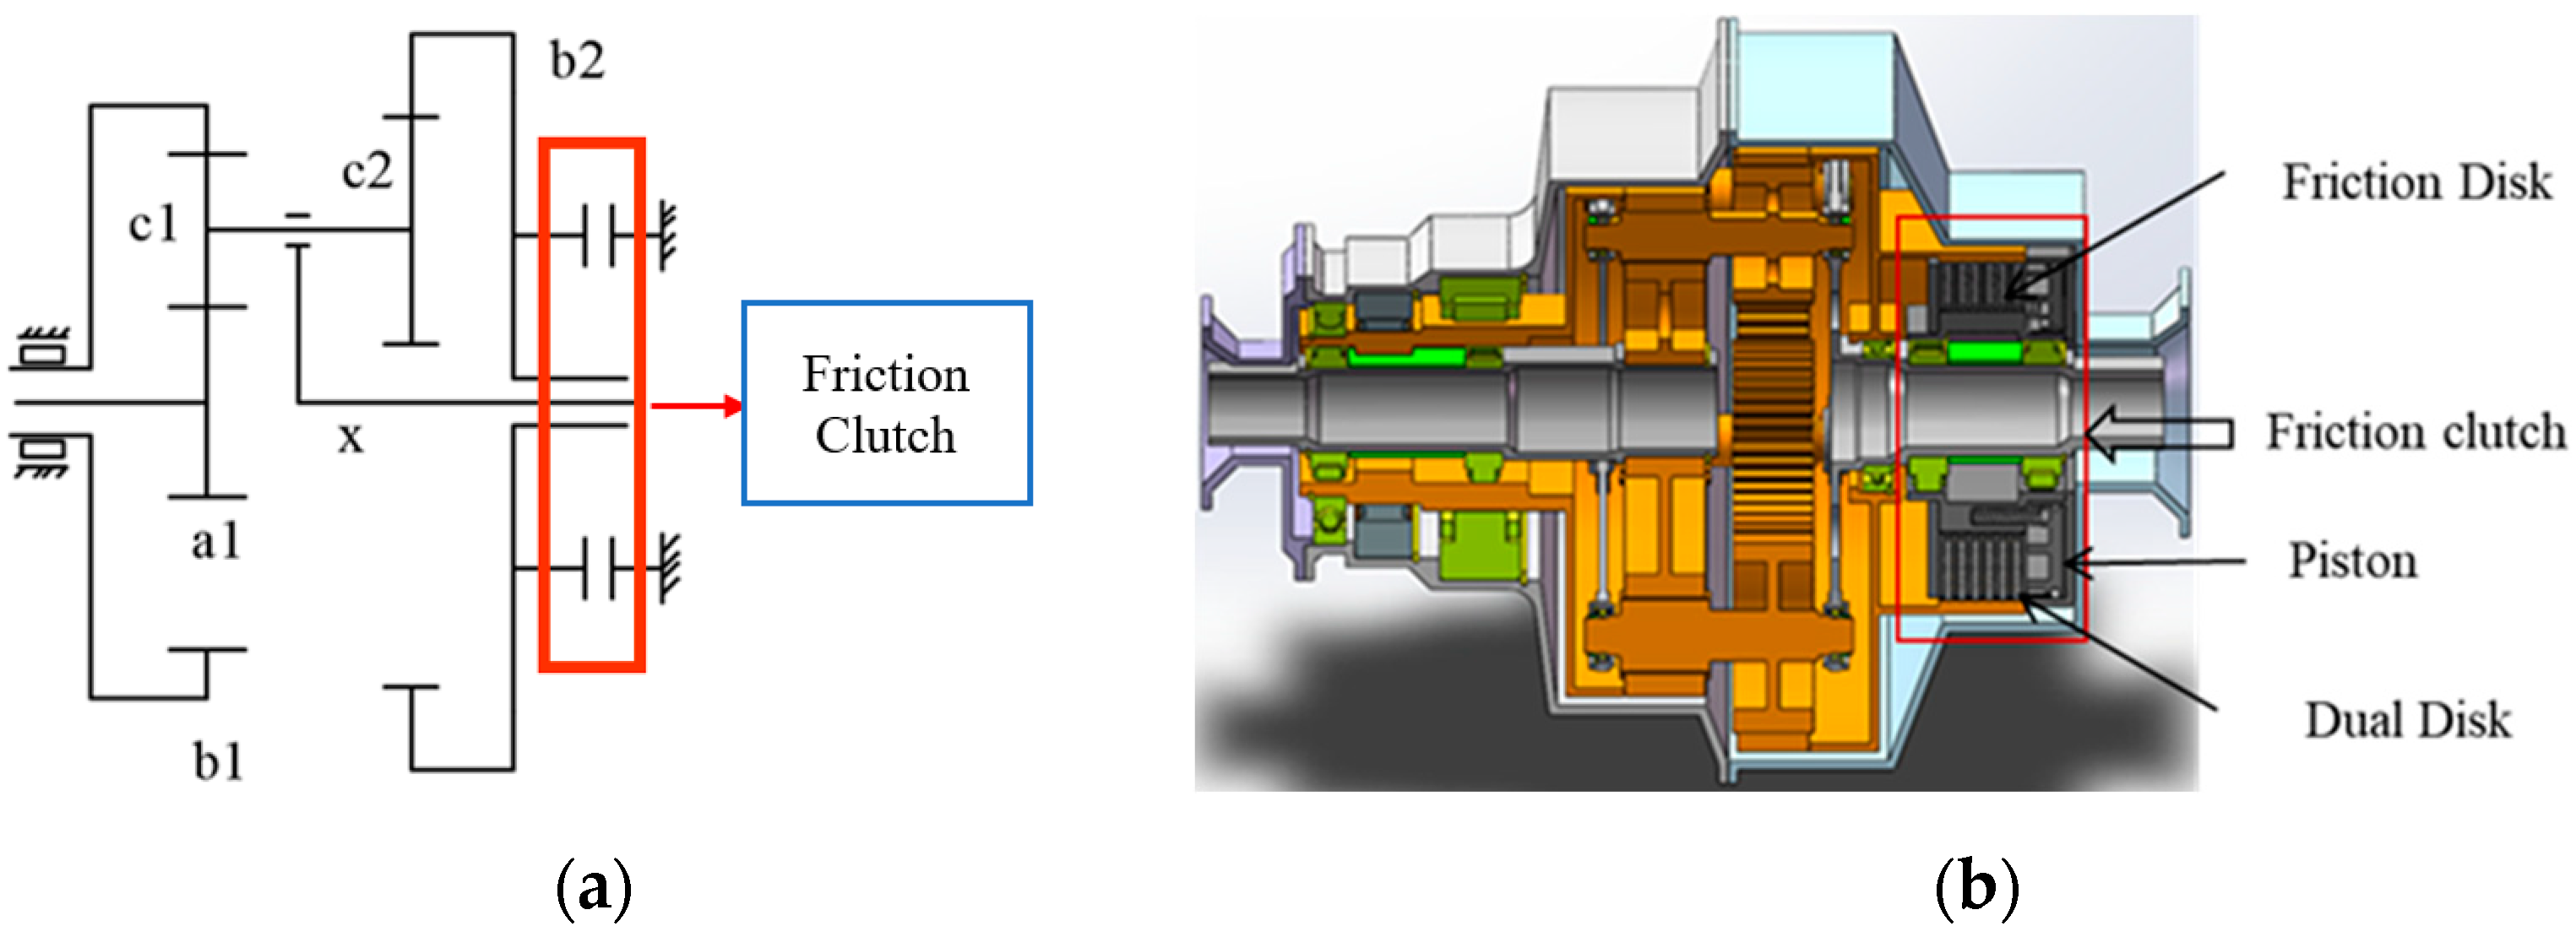
The variable speed transmission system of a high-speed helicopter is shown in the Figure 1a, and the transmission system consists of a multi-stage gear drive system and a wet friction clutch. System power is input by solar wheel b1 and transmitted to Planetary Shelf X by gear variable speed at all levels. As an important part of the helicopter variable speed transmission system, the wet friction clutch needs to be greased in order to function properly. When the variable speed transmission system switches from high-speed to low-speed, the hydraulic system controls the friction disc and the pair disc pressing to complete the engagement, and relies on the friction between the two to secure the ring, the shift process, the completion of the speed control of the high-speed helicopter.
As shown in Figure 1b, the friction clutch consists of friction discs, dual discs, piston, input shaft and output shaft. When the friction begins to engage, pressure will be applied to the piston, which is then transferred to the friction disks and dual disks. Due to the engagement pressure, friction discs and dual discs begin to move closer to each other. When they come into contact, torque is transmitted through friction.

2.2. Drag Torque Mathematical Model

The surface appearance of wet clutch friction disc is too complex and diverse to analyze directly, but the main working part of the clutch is the friction pair. Therefore, the main working part of the friction disc and the pair can be simplified, as shown in Figure 2.
In Figure 2, the pair is driven at a speed n and the friction disc is stationary. The wet clutch friction pair is regarded as two relative moving discs with a distance of δ, since the δ is generally small enough, the fluid between them can be assumed as a stratospheric flow [16], and the speed of the fluid between the two discs can be considered as a linear change. The lubricant between the two forms shear stresses due to the relative motion of the dual and friction disc. Where, n is the rotation speed of drive disc. v is the speed difference between drive disc and driven disc.
The structure of wet friction clutch is complicated, but the main working part is composed of several friction pairs. Based on the analysis of a single friction pair, the simplified model of the friction pair is shown in Figure 2. The torque produced by shear action in lubricating oil reservoir is called drag torque. When the wet clutch is idling, the friction plate and the dual plate separation is not complete and there will be friction or sliding, of which the shear effect is more serious, resulting in not completely separated. There is also a loss of energy. The clearance of friction pair is different in practice. The clearance in the middle is larger, while the clearance on both sides is smaller. The average clearance of the total length is taken as the calculation parameter in this model.
In Figure 2, the pair is driven at a speed n and the friction disc is stationary. The wet clutch friction pair is regarded as two relative moving discs with a distance of δ, since the δ is generally small enough, Relative moving discs with a distance of δ, since the δ is generally small enough, the fluid between them can be regarded as a stratospheric flow, and the speed of the fluid between the two discs can be considered as a linear change. The lubricant between the two forms shear stresses due to the relative motion of the dual and friction disc.
Some grooves, including radial grooves and circumferential grooves, are designed on the surface of the friction plate of the wet friction clutch to ensure the flow of the lubricating oil film. It is necessary to consider the factor of groove to reveal the pressure distribution of friction pair clearance. Based on a single friction pair, the influence of radial groove and circumferential groove should be considered in the parametric model.
It is assumed that the lubricating oil between the friction plates is an incompressible fluid, the viscosity is constant, and the oil film is in an isothermal field. According to the theory of hydrodynamic lubrication, hydrodynamic and oil film shear forces are generated between the clutch plates. The complete analytical Laplace equation of these forces is:
2 p r 2 + 1 r 2 2 p θ 2 + 1 r p r = 0
where p is the fluid pressure, r is the radius of curvature, and θ is the position angle.
The radial grooves and annular grooves of the friction disks are both rectangular grooves. As shown in Figure 3, in order to simplify the calculation, it is approximately considered that the radial rectangular groove is a fan-shaped groove with an angle of θ1, the thickness of the oil layer is δ1, and the angle of the non-radial oil groove area is approximated. θ2, in which the thickness of the oil layer in the non-oil groove area is δ2, the thickness of the oil layer in the annular groove area is δ3. According to the incompressibility and continuity of the lubricating oil, the pressure distribution in the θ1 and θ2 regions can be obtained as:
{ p θ 1 = p 0 + p 1 θ 1 θ p θ 2 = p 0 + p 2 θ 2 θ
p 1 = 6 μ r 2 ω ( δ 1 δ 2 ) K 1
p 2 = 6 μ r 2 ω ( δ 1 δ 3 ) K 2
K 1 = δ 1 3 θ 1 + δ 2 3 θ 2
K 2 = δ 1 3 θ 1 + δ 3 3 θ 2
where p1 is the highest pressure at the boundary line of the non-oil groove area of θ1 and θ2; p2 is the highest pressure at the boundary line of the annular groove area of θ1 and θ2; p0 is determined by boundary conditions; μ is the dynamic viscosity of lubricating oil; ω is the rotational speed of the dual plate.
Take the micro-units dz, dr, and rdθ in the area θ1, carry out the circumferential force analysis on the micro-unit body, and establish the equilibrium equation:
d p θ 1   d z d r ( p θ 1 + d p θ 1 ) d z d r τ r d θ d r + ( τ + d τ ) r d θ d r = 0
Due to the small thickness of the oil layer, the pressure of the oil layer in the z direction is considered to be constant. According to Newton’s law of internal friction, the internal friction force τ = −μ(dv/dz), where dv/dz is the velocity gradient. The known boundary conditions are the following: the rotational speed of the dual plate is ω, and the rotational speed of the friction plate is 0 (z = 0, v = 0; z = δ1, v = ). Therefore:
v = 1 2 μ r d p θ 1 d θ z 2 + ( δ 1 2 μ r d p θ 1 d θ r ω δ 1 ) z
The oil layer shear stress is:
τ = μ d v   d z = 3 δ 1 μ r ω ( δ 1 δ 2 ) K 1 θ 1 + μ r ω δ 1
The drag torque due to shear stress is:
d T d 1 = τ r 2 d θ d r = ( 3 δ 1 μ r ω ( δ 1 δ 2 ) K 1 θ 1 + μ r ω δ 1 ) r 2 d θ d r
The drag torque in the region θ1 is
T d 1 = r 1 r 2 0 θ 1 ( 3 δ 1 μ r ω ( δ 1 δ 2 ) K 1 θ 1 + μ r ω δ 1 ) r 2   d θ d r = 3 δ 1 μ ω ( δ 1 δ 2 ) 4 K 1 + μ θ 1 ω ( r 2 4 r 1 4 ) 4 δ 1
The drag torque transmitted by the shearing of the oil layer at the θ2 non-oil groove area r is:
d T d 2   F = ( 3 δ 2 μ r ω ( δ 1 δ 2 ) K 1 θ 2 + μ r ω δ 2 ) r 2 d θ d r
The drag torque in this annular area is:
T d 2   F = r a 1 r a 2 0 θ 2 ( 3 δ 2 μ r ω ( δ 1 δ 2 ) K 1 θ 2 + μ r ω δ 2 ) r 2   d θ d r = 3 δ 2 μ ω ( δ 1 δ 2 ) ( r a 2 4 r a 1 4 ) 4 K 1 + μ θ 2 ω ( r a 2 4 r a 1 4 ) 4 δ 2
where ra1 and ra2 are the inner and outer diameters of each annular region in the non-oil groove area of θ2. Therefore, the drag torque in the non-oil groove area of θ2 is:
T d 2 = T d 2   F = ( 3 δ 2 μ ω ( δ 1 δ 2 ) ( r a 2 4 r a 1 4 ) 4 K 1 ) + ( μ θ 2 ω ( r a 2 4 r a 1 4 ) 4 δ 2 )
The drag torque transmitted by the shearing of the oil layer at the annular groove region r of θ2 is:
d T d 3 F = ( 3 δ 3 μ r ω ( δ 1 δ 3 ) K 2 θ 2 + μ r ω δ 3 ) r 2 d θ d r
Then the drag torque in the circumferential groove is:
T d 3 F = r b 1 r b 2 0 θ 2 ( 3 δ 3 μ r ω ( δ 1 δ 3 ) K 2 θ 2 + μ r ω δ 3 ) r 2 d θ d r = 3 δ 3 μ ω ( δ 1 δ 3 ) ( r b 2 4 r b 1 4 ) 4 K 2 + μ θ 2 ω ( r b 2 4 r b 1 4 ) 4 δ 3
where rb1 and rb2 are the inner and outer diameters of each annular groove in the area of θ2. Then, the drag torque in the annular groove area of θ2 can be obtained as:
T d 3 = T d 3   F = ( 3 δ 3 μ ω ( δ 1 δ 2 ) ( r b , 2 4 r b , 4 ) 4 K 2 ) + ( μ θ 2 ω ( r b 2 4 r b 1 4 ) 4 δ 3 )
The drag torque transmitted by the clutch is totally:
T d = 2 π θ 1 + θ 2 ( T d 1 + T d 2 + T d 3 )

2.3. Thermal-Fluid-Solid Coupling Simulation of Compound Oil Groove

At present, there are different types of oil grooves on the friction disc surface of wet friction clutch, among which single radial groove, annular groove, arc groove, and waffle groove are more common. The research shows that compared with the single oil groove, the radial-annular compound oil groove has lower temperature rise and stronger heat dissipation; compared with the double circular arc oil groove and waffle groove, the radial-annular compound oil groove can maintain the circumferential high-speed flow of oil, the maximum flow rate changes little, and the comprehensive performance is better [14].
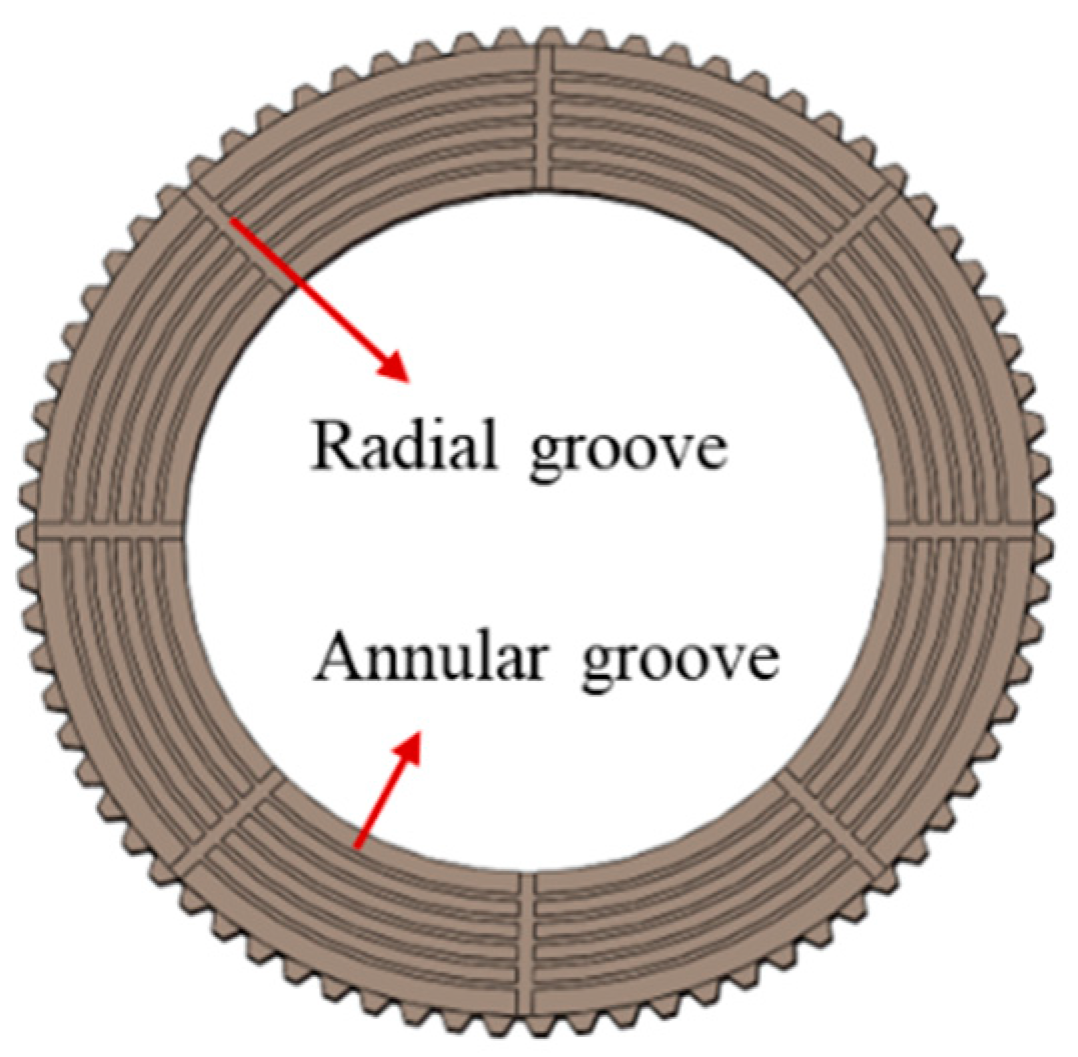
Figure 4 shows the structure of the friction disc that is radial-annular compound oil groove. In addition, the radial-annular compound oil groove has the advantages of good oil supply on the friction surface, good cooling effect, and large friction coefficient.
Table 1 shows the relevant working parameters of wet friction clutch. According to the heat flow coupling modeling theory of wet friction clutch, a single oil film is taken as the research object, and the geometric model of oil film is established according to the design parameters; the parameters of oil film in air loss stage can be obtained by establishing high quality grid for the model and combining the post-processing function of FLUENT ANSYS software 18.0; Software for Technical Computation; ANSYS: Pennsylvania, USA 2019. Table 2 shows the working parameters of lubricating oil.
Figure 5 shows the simulation model meshing. The mesh of friction plate simulation model is divided in the form of unstructured mesh, and Poly-Hexcore volume mesh generation method is adopted. This mesh is superior to tetrahedron in simulation calculations. It is characterized by the unique hexahedral mesh and polyhedral mesh to achieve common node connection, and can increase the number of hexahedral mesh to achieve the purpose of improving the efficiency and accuracy of solving. The angle and the tip are refined.
As shown in the Figure 6, the inlet boundary condition is mass inflow, with flow rate of 0.1 kg/s, and the outlet boundary condition is outflow. The oil layer surface is set as the wall surface, where the oil layer surface close to the active surface is the moving wall surface rotating at the working speed. The form of heat transfer between the oil layer, friction disc, and dual disc is convection.
The divided high-quality mesh was imported into FLUENT for calculation. The pressure—based solver is selected for the heat—flow coupling simulation analysis. The simulation focuses more on the result and adopts the steady-state calculation. The calculation model is SST k-ω model, which is used to predict the propagation rate of free shear flow, so it can be applied to wall bound flow and free shear flow. Complete pressure-velocity coupling can be achieved using the Coupled coupling algorithm. A heat flow coupling simulation model is established under viscous heating, incompressible heat dissipation, and convection heat dissipation.
Table 3 shows the drag torque and maximum temperature of group A and group B, which have different oil groove structure parameters. m is the number of radial grooves, b1 and b2 are the width of radial and annular grooves, respectively, l is the spacing between two annular grooves. The simulation results show that the drag torque of group A is smaller, but the temperature rise is higher. In group B, the number of oil grooves is increased, so the heat dissipation capacity is stronger, and the drag torque is larger.
Figure 7 illustrates the pressure distribution and temperature distribution of thermal-fluid-solid coupling simulation. Temperature distribution: the temperature of oil film in Figure 3 shows concentric circular distribution, and with the increase in radius, the larger the line speed, the more heating of oil film, the higher the temperature; the temperature in the outer ring area is higher, and the heat dissipation effect is not good at this time, and the area where high temperature wear is most likely to occur.
Pressure distribution: it can be seen in Figure 8 that the oil film is divided into several fan-shaped areas by radial groove, and the pressure is distributed symmetrically. The high-pressure area is mainly distributed in the outer ring; when the friction disc rotates in the anti-clockwise direction, the oil pressure in the sector area decreases in the anti-clockwise direction due to the strong oil scraping ability of the radial oil groove.
3. Taguchi Experiment Design and Simulation Results Analysis

3.1. Design of Simulation Experiments by Taguchi Method

Taguchi method is an effective robust optimization experiment design method. Compared with the traditional full factor design method, Taguchi method provides a more effective method to adjust the uncertain factors. It can greatly reduce the number of simulation cases or experiments and obtain robust and reliable experimental results with strong anti-interference ability and stable performance. Many researchers have obtained better experimental results by applying MINITAB to analyze the Taguchi experiment with the main effect of mean or signal-to-noise(S/N) ratio as an indicator [17,18,19,20,21,22,23]. Based on the response analysis of signal-to-noise ratio, the influence of oil groove structure parameters on drag torque and friction disc temperature rise is analyzed.
The working performance of the clutch mainly depends on the material property of the friction disc, the type of oil groove and the effective friction area. Complex grooves composed of radial grooves and annular grooves. Among these factors, the effective friction area depends on the number, width, spacing, and other factors (such as surface roughness and waviness) of oil groove. According to the research, when the effective friction area S is 70~80% of the total area, the normal working performance of the friction disc can be guaranteed [18].
Under the condition that the working performance is basically the same, the design range of the structural parameters of the friction disc oil groove is shown in Table 4.

3.2. Simulation Results and Analysis of Taguchi Experiment

3.2.1. Simulation Results of Taguchi Method

Through the post-processing of FLUENT, the drag torque M and the maximum temperature Tm of each group of experiments could be obtained, and the results are shown in Table 4. Taguchi method takes signal-to-noise ratio (S/N) as the evaluation index to measure the target parameters. The maximum signal-to-noise ratio is the optimal target parameter under the given conditions, and the influence degree of each parameter can be reflected by its numerical value. The flow chart of oil groove structure parameter optimization for wet friction clutch is as shown in Figure 9.

3.2.2. Influence of Oil Groove Structure Parameters on Drag Torque

The signal-to-noise ratio response of oil groove structure parameters to drag torque is shown in Table 5. MINITAB allocates rank based on DELTA value, and rank 1 is the most influential. That is, the descending order of the influence of the structural parameters of the oil groove on the drag torque is as follows: the number of radial grooves, the width of the annular groove, the spacing between the annular grooves, and the width of the radial groove. The main effect of the signal-to-noise ratio of the drag torque is shown in Figure 10. It shows that the optimal combination is when the number of radial grooves is 10, the width of radial groove is 6 mm, the width of annular groove is 2.5 mm, and the spacing of annular groove is 2 mm.

3.2.3. Influence of Oil Groove Structure Parameters on Maximum Temperature

For the temperature field of clutch, the maximum temperature is taken as the main index to measure the influence of the structure parameters of the oil groove. The S/N response to the highest temperature is shown in Table 6. The descending order of the influence of the structural parameters on the drag torque is as follows: the spacing between the annular grooves, the number of radial grooves, the width of the annular groove, and the width of the radial groove. The main effect of the signal-to-noise ratio of the drag torque is shown in Figure 11. It shows that the optimal combination is when the number of radial grooves is 6, the width of radial groove is 8 mm, the width of annular groove is 2.5 mm, and the spacing of annular groove is 2 mm.
The parameter combinations are shown in Table 7. For the drag torque and maximum temperature, the optimal combination results obtained by the signal-to-noise ratio analysis of Taguchi experiment are different. Further analysis is needed to optimize the two at the same time. The optimization problem has more than one optimization objective and needs to be dealt with at the same time, so it becomes a multi-objective optimization problem.

4. Multi-Objective Optimization Algorithm and Verified Simulation

4.1. Non-Dominated Neighborhood Immune Algorithm

Based on the experimental data obtained from the simulation experiment, the multi-objective optimization algorithm is applied to optimize the structural parameters of the oil groove for M and Tm.
Non-dominated neighborhood immune algorithm (NNIA) is an immune algorithm that simulates natural immune function and is used for multi-objective optimization [18]. Inspired by immunology, the algorithm simulates the coexistence of diverse antibodies and the activation of a small number of antibodies in the process of immunization, and takes a small number of relatively independent non-dominant individuals as active antibodies. The proportion of active antibodies was cloned, recombined, and hypermutated based on the selection of non-dominated fields and the measurement of crowding degree [20]. NNIA is a multi-objective optimization algorithm based on Pareto optimal solution. Its focus on low congestion area has great advantages in high-dimensional multi-objective optimization problems. Figure 12 represents the flow chart, and the main steps are as follows [18,19,20]:
(1)
Initialization
Primary antibody group (B0), dominated antibody group, activity antibody group and clone antibody group are generated in this procedure. Where, the size of primary antibody group is nD.
(2)
Update dominant groups
The dominant antibodies (Bt) are recognized in this procedure. All dominant antibodies are copied to form the temporary dominant antibody group (DTt+1).
(3)
Select based on nondominated neighbor
If DTt+1 is not more than nD, DTt+1 is set as Dt+1. Otherwise, the crowding distance between the all individuals in the DTt+1 is calculated to arrange individuals in descending order. The top-nD individuals in the first group form Dt+1 according to the crowding distance in descending order. If Dt is not more than nA, At is set as Dt. Otherwise, the top-nD individuals in the first group form At according to the crowding distance in descending order.
(4)
Proportional clone
Clone group (Ct) is obtained through applying proportional clone on At.
(5)
Recombination and hypermutation
Clone group (Ct) is reorganized and hyper mutated. C is set as new clone group (Ct) and go to step 2.
(6)
End.
The second order regression equation of drag torque as follow, which can be obtained from the results of Taguchi method:
M = 15.55 1.024 m 0.432 b 1 + 0.88 b 2 + 1.40 l + 0.0451 m 2 + 0.0199 b 1 2 + 0.175 b 2 2 + 0.110 l 2 + 0.0221 m b 1 0.786 l b 2
The second order regression equation of the maximum temperature is shown as follows:
T m = 80.85 + 0.62 m 0.34 b 1 1.2 b 2 6.96 l 0.0479 m 2 0.0368 b 1 2 + 0.09 b 2 2 + 1.23 l 2 + 0.077 m b 1 + 0.642 l b 2
According to the design experience, the number of radial grooves is generally even and more than 6, and its width depends on the diameter of the friction disc. The effective friction area of the friction disc is determined by the spacing and width of the annular groove, so the size of the annular groove is between 0.5 and 3 mm. Taking the drag torque and temperature as the optimization objectives, a multi-objective optimization model is established, as shown as follow:
M i n   M ( m , b 1 , b 2 , l ) M i n   T max ( m , b 1 , b 2 , l ) s . t { 6 m 12 2 b 1 8 1.5 b 2 3 0.5 l 3
Table 8 lists the parameters in NNIA algorithm. Table 9 describes the partial solution set of NNIA and Figure 13 shows the Pareto optimal solution of drag torque and maximum temperature. Table 10 describes that when only a single optimization objective is considered, the minimum drag torque can reach 11.56 Nm, and the minimum temperature can reach 72.57 °C. It means drag torque and the maximum temperature cannot be minimized at the same time. However, the solution set can be used to design the structural parameters of radial-annular compound oil groove according to different performance requirements.
Table 10 shows the comparison between simulation data and Pareto optimal solution sets. It describes the improvement of NNIA: The drag torque of 1~3 groups of data are very similar. The optimized temperature can be reduced in the range of 2.00~5.40%. The maximum temperature of 4~6 groups of data are very similar, and the torque decreases by 4.34–12.22%. The results show that the NNIA optimization algorithm can effectively improve the working performance of radial annular compound oil groove friction clutch.

4.2. Verification of the Structure Parameters from the Multi-Objective Optimization

To verify the effectiveness of the optimization results of oil groove structure, two verification simulations are carried out in Figure 14. Table 11 describes the comparison results of verified simulation. It shows that the relative error between the predicted data and the experimental data is between 0.30% and 1.93%, which is in good agreement with the experimental data. These results are a further proof that the Pareto optimal solution set obtained by NNIA has high accuracy and reliability.

5. Verification of the Thermal-Fluid-Solid Coupling Simulation of Compound Oil Groove

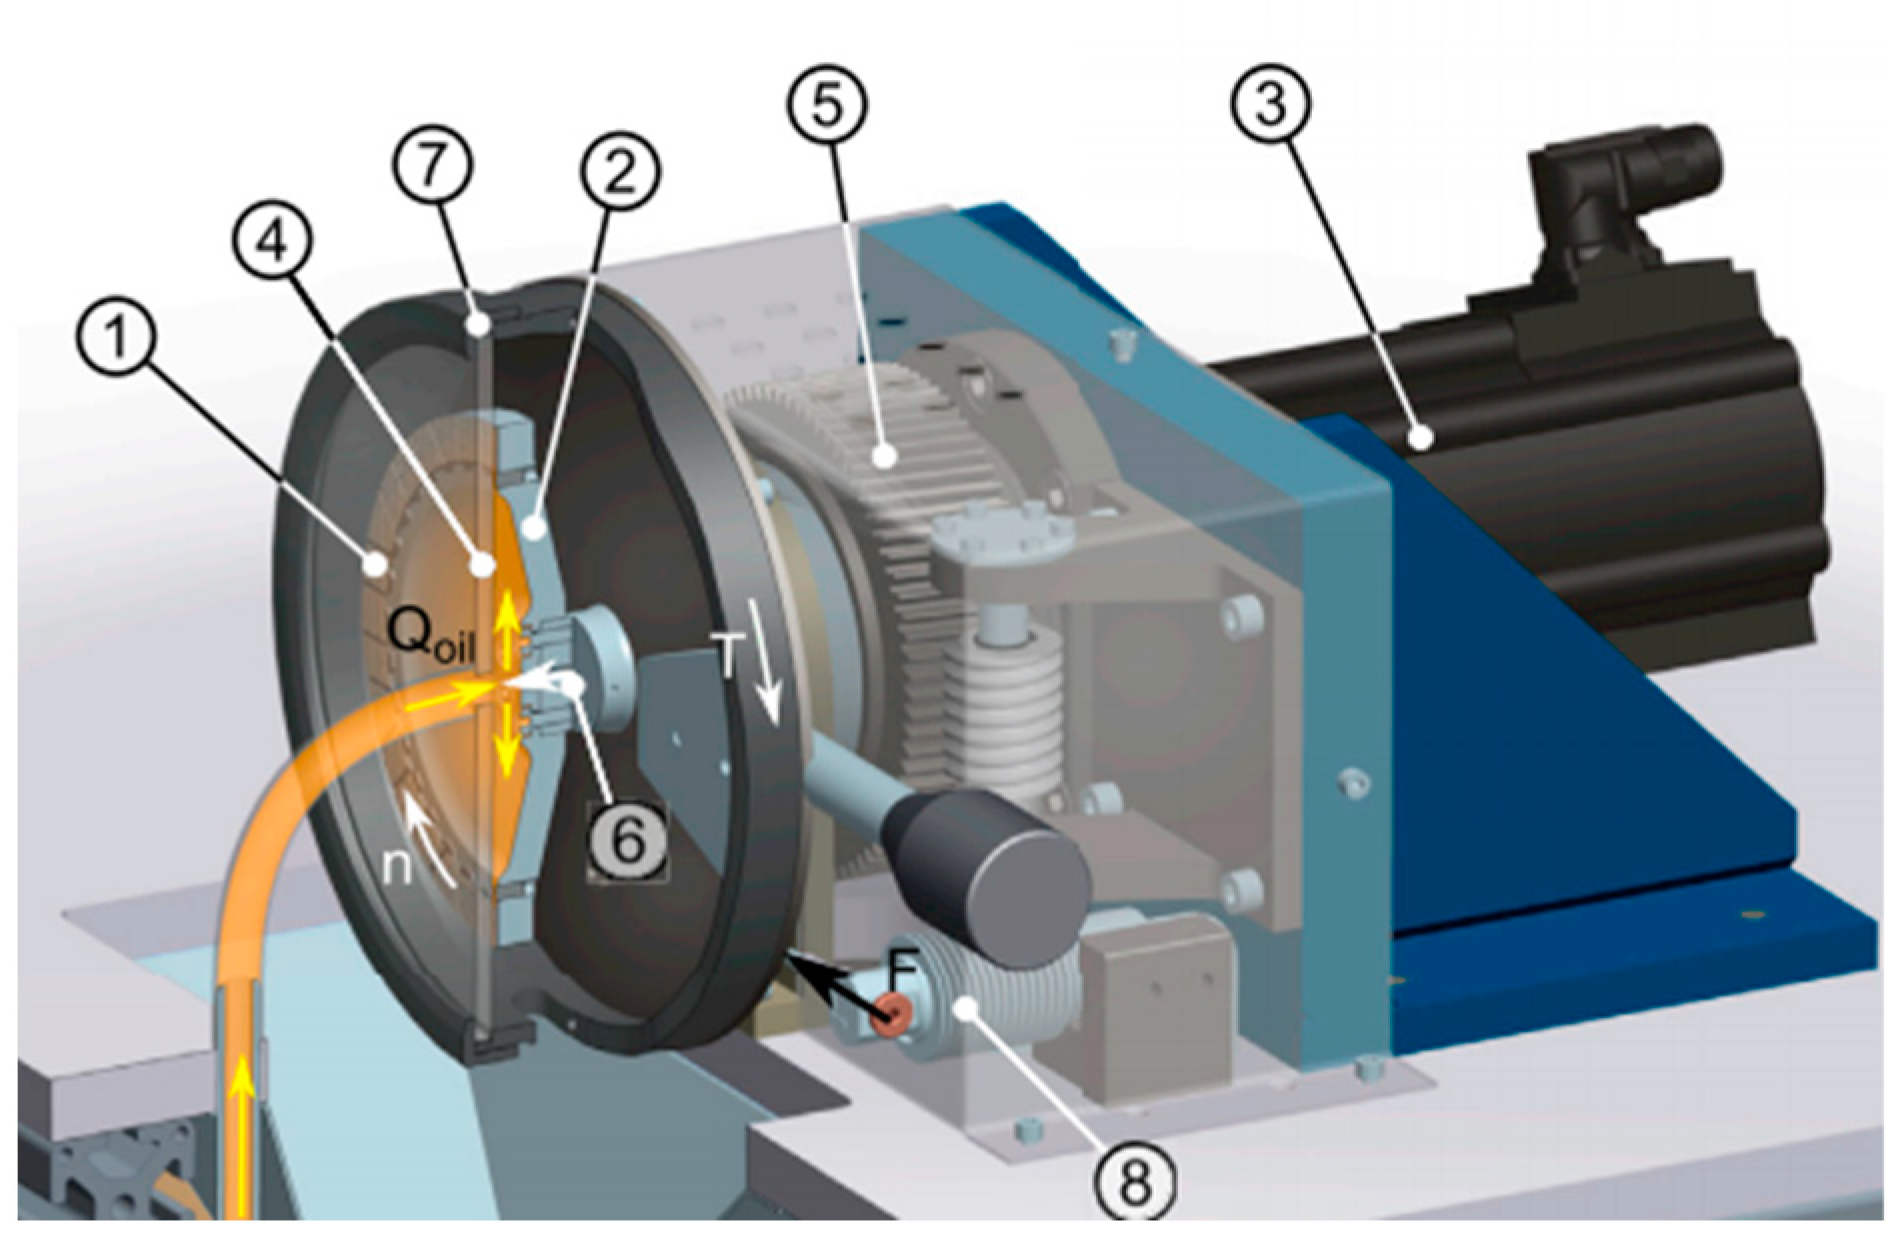
In order to verify the correctness of the mathematical model and simulation method of drag torque, experimental verification was carried out on a single-disc test rig with a clutch disc which is shown in Figure 15.
In the test rig, the clutch disc is rotated by the driving motor. A stationary glass plate is used to represent the dual disc. The clearance is adjustable through the pre-stressed precision thread. When the driving motor start, the cooling oil is fed through the center of the glass plate, and then the drag torque can be measured by the force sensor.
In the experiment, the rotating speed is set to increase with a linear speed gradient of 10 (r/min)/s. The used clutch disc is machined with oil grooves, and the number, width, and depth are 6, 1.5 mm, and 0.6 mm, respectively. The parameters for simulation and experiments are shown in Table 12.
In these experiments and simulations, the clearance between friction discs and dual discs were set to 0.10 mm, 0.15 mm, 0.20 mm, and 0.25 mm, respectively. The experimental results [16,23] and simulation results of drag torque are shown in Figure 16.
As shown in Figure 13, the change trend of experiments results and simulation results of the drag torque is consistent. Where the rotating speed is faster, the drag torque becomes greater. On the other hand, drag torque became smaller while the clearance increased. The experimental results are basically consistent with the simulation results, which verify the correctness of the mathematical model and simulation method.

6. Conclusions

(1) Based on the Taguchi experiment, the effects of the number and width of radial and annular groove on the drag torque and maximum temperature were studied. The signal-to-noise ratio response shows that the number of radial grooves and the width of annular grooves have a great influence on the strip row torque and temperature rise. It is proved that there is a certain conflict between reducing the drag torque and reducing the temperature rise.
(2) A multi-objective optimization method based on NNIA optimization algorithm is proposed, which decreases Tm by 2.00~5.40% and reduces M by 4.34–12.22%. Furthermore, the Pareto optimal solution set of NNIA has high accuracy and strong reliability, and oil groove parameters can be set for specific performance requirements.
(3) The experimental results are basically consistent with the simulation results, which verifies the correctness of the mathematical model and simulation method.

Author Contributions

W.T.: Conceptualization; Funding acquisition; Formal analysis; Methodology; Investigation; Writing. Z.L.: Data curation; Investigation; Resources; Formal analysis; Writing. H.Y.: Data curation; Investigation. Z.C.: Funding acquisition; Investigation; Methodology; Validation. All authors have read and agreed to the published version of the manuscript.

Funding

This research is supported by Natural Science Foundation of Changsha City, China (Grant No. 73773), Fundamental Research Funds for the Central Universities of Central South University (Grant No. 2022zzts0786), the Natural Science Foundation of Guangdong Province, China (Grant No. 2022A1515011226), Project of State Key Laboratory of High Performance Complex Manufacturing, Central South University (Grant ZZYJKT2022-10), Central Government Funds for Guiding Local Scientific and Technological Development (Grant No. 2021Szvup167), the project of Guangdong Provincial Key Laboratory of Manufacturing Equipment Digitization (Grant No. 2020B1212060014).

Data Availability Statement

Not applicable.

Conflicts of Interest

The authors declare no conflict of interest.

References

  1. Kong, J.; Jang, S. Temperature Analysis of Wet Clutch Surfaces During Clutch Engagement Processes Based on Friction Pad Patterns. Int. J. Automot. Technol. 2020, 21, 813–822. [Google Scholar] [CrossRef]
  2. Zhang, L.; Wei, C.; Hu, J.; Hu, Q. Influences of lubrication flow rates on critical speed of rub-impact at high circumferential velocities in No-Load multi-plate wet clutch. Tribol. Int. 2019, 140, 105847. [Google Scholar] [CrossRef]
  3. Wu, W.; Xiong, Z.; Hu, J.; Yuan, S. Application of CFD to model oil–air flow in a grooved two-disc system. Int. J. Heat Mass Transf. 2015, 91, 293–301. [Google Scholar] [CrossRef]
  4. Hu, J.; Hou, S.; Wei, C. Drag torque modeling at high circumferential speed in open wet clutches considering plate wobble and mechanical contact. Tribol. Int. 2018, 124, 102–116. [Google Scholar] [CrossRef]
  5. Hu, J.; Peng, Z.; Wei, C. Experimental Research on Drag Torque for Single-plate Wet Clutch. Tribol. Int. 2012, 134, 014502. [Google Scholar]
  6. Yuan, S.; Guo, K.; Hu, J.; Peng, Z. Study on Aeration for Disengaged Wet Clutches Using a Two-Phase Flow Model. J. Fluids Eng. 2010, 132, 111304. [Google Scholar] [CrossRef]
  7. Zhou, X.; Walker, P.; Ruan, J.; Zhang, N.; Zhu, B. Numerical and experimental investigation of drag torque in a two-speed dual clutch transmission. Mech. Mach. Theory 2014, 79, 46–63. [Google Scholar] [CrossRef]
  8. Li, H.; Jing, Q.; Ma, B. Modeling and Parametric Study on Drag Torque of Wet Clutch. Lect. Notes Electr. Eng. 2012, 193, 21–30. [Google Scholar]
  9. Iqbal, S.; Al-Bender, F.; Pluymers, B.; Desmet, W. Mathematical Model and Experimental Evaluation of Drag Torque in Disengaged Wet Clutches. ISRN Tribol. 2013, 2013, 1–16. [Google Scholar]
  10. Iqbal, S.; Al-Bender, F.; Pluymers, B.; Desmet, W. Model for Predicting Drag Torque in Open Multi-Disks Wet Clutches. J. Fluids Eng. 2013, 136, 021103. [Google Scholar] [CrossRef]
  11. Leister, R.; Najafi, A.; Gatti, D.; Kriegseis, J.; Frohnapfel, B. Non-dimensional characteristics of open wet clutches for advanced drag torque and aeration predictions. Tribol. Int. 2020, 152, 106442. [Google Scholar] [CrossRef]
  12. Cui, H.; Yao, S.; Yan, Q.; Feng, S.; Liu, Q. Mathematical model and experiment validation of fluid torque by shear stress under influence of fluid temperature in hydro-viscous clutch. Chin. J. Mech. Eng. 2014, 27, 32–40. [Google Scholar] [CrossRef]
  13. Huang, J.-H.; Fan, Y.-R.; Qiu, M.-X.; Fang, W.-M. Effects of groove on behavior of flow between hydro-viscous drive plates. J. Central South Univ. 2012, 19, 347–356. [Google Scholar] [CrossRef]
  14. Neupert, T.; Benke, E.; Bartel, D. Parameter study on the influence of a radial groove design on the drag torque of wet clutch discs in comparison with analytical models. Tribol. Int. 2018, 119, 809–821. [Google Scholar] [CrossRef]
  15. Zhang, L.; Wei, C.; Hu, J.B. Model for the prediction of drag torque characteristics in wet clutch with radial grooves. Proc. Inst. Mech. Eng. Part D J. Automob. Eng. 2018, 233, 095440701881495. [Google Scholar] [CrossRef]
  16. Thomas, N.; Elisabeth, B.; Dirk, B. Parameter study on the influence of a radial groove design on the drag torque of wet clutch discs in comparison with analytical models. Tribol. Int. 2017, 119, 809–821. [Google Scholar]
  17. Darbari, A.M.; Alavi, M.A. Application of Taguchi method in the numerical analysis of fluid flow and heat transfer around a flat tube with various axial ratios. Int. Commun. Heat Mass Transf. 2021, 126, 105472. [Google Scholar] [CrossRef]
  18. Venkatesan, G.; Kulasekharan, N.; Iniyan, S. Design and selection of curved vane demisters using Taguchi based CFD analysis. Desalination 2014, 354, 39–52. [Google Scholar] [CrossRef]
  19. Gu, P.; Xing, L.; Wang, Y.; Feng, J.; Peng, X. A multi-objective parametric study of the claw hydrogen pump for fuel cell vehicles using taguchi method and ANN. Int. J. Hydrogen Energy 2020, 46, 6680–6692. [Google Scholar] [CrossRef]
  20. Geng, B.; Li, L.; Jiao, L.; Gong, M.; Cai, Q.; Wu, Y. NNIA-RS: A multi-objective optimization based recommender system. Phys. A Stat. Mech. Its Appl. 2015, 424, 383–397. [Google Scholar] [CrossRef]
  21. Gong, M.; Pan, X.; Yao, S.; Ma, W. Research on evolutionary multi-objective optimization algorithms. J. Softw. 2009, 20, 271–289. [Google Scholar] [CrossRef]
  22. Gong, M.; Jiao, L.; Du, H.; Bo, L. Multiobjective immune algorithm with nondominated neighbor-based selection. Evol. Comput. 2008, 16, 225–255. [Google Scholar] [CrossRef] [PubMed]
  23. Pan, H.; Zhou, X.; Ma, B.; Dui, G.; Yang, S.; Xin, L. Experimental and Theoretical Analysis of the Drag Torque in Wet Clutches. Fluid Dyn. Mater. Process. 2019, 15, 403–417. [Google Scholar] [CrossRef] [Green Version]
Figure 1. High-speed helicopter transmission system. (a) structure diagram (b) 3D model.
Machines 11 00296 g001
Figure 2. Simplified model of clutch friction pair.
Machines 11 00296 g002
Figure 3. Simplified model of clutch friction pair.
Machines 11 00296 g003
Figure 4. Structure of friction disc.
Machines 11 00296 g004
Figure 5. Simulation model meshing.
Machines 11 00296 g005
Figure 6. Model boundary condition.
Machines 11 00296 g006
Figure 7. Temperature simulation results. (a): temperature distribution of No.A in Table 3, (b): temperature distribution of No.B in Table 3, (c): temperature curve along radius of No.A in Table 3, (d): temperature curve along radius of No.B in Table 3.
Machines 11 00296 g007
Figure 8. Pressure simulation results. (a): pressure distribution of No.A in Table 3, (b): pressure distribution of No.B in Table 3, (c): pressure curve along radius of No.A in Table 3, (d): pressure curve along radius of No.B in Table 3.
Machines 11 00296 g008
Figure 9. Flow chart of oil groove structure parameter optimization for wet friction clutch.
Machines 11 00296 g009
Figure 10. Main effect of S/N Rate of drag torque.
Machines 11 00296 g010
Figure 11. Main effect of SNR of maximum temperature.
Machines 11 00296 g011
Figure 12. Flow chart of NNIA.
Machines 11 00296 g012
Figure 13. Pareto optimal solution of drag torque and maximum temperature.
Machines 11 00296 g013
Figure 14. Verification simulations results.
Machines 11 00296 g014
Figure 15. Test rig for drag torque [16]. ➀ clutch disc, ➁ disc bracket, ➂ driving motor, ➃ glass plate, ➄ precision thread, ➅ valve, ➆ housing, ➇ force sensor.
Machines 11 00296 g015
Figure 16. Comparison of drag torque experiment results and simulation results [16].
Machines 11 00296 g016
Table 1. Relevant working parameters of wet friction clutch.
ParametersData
Working speed n [rpm]2450
Diameter of the inlet d0 [mm]182
Diameter of the outlet d1 [mm]245
Clearance δ [mm]0.5
Oil feeding flow rate Q [kg/s]0.1
Lubricating oil temperature T0 [°C]58
Wall temperature T1 [°C]50
Convective heat transfer coefficient of separator disc
h2 [W/(m2·°C)]
1890
Convective heat transfer coefficient of friction disc
h1 [W/(m2·°C)]
380
Table 2. Working parameters of lubricating oil.
Parameter of Lubricating Oil ValueUnit
Density ρ880kg/m3
Dynamic viscosity μ96.8mPa·s
Specific heat volume C1900J/(kg·°C)
Thermal conductivity λ0.144W/(m·°C)
Table 3. Simulation results of thermal-fluid-solid coupling simulation model.
No.mb1/mmb2/mml/mmM/(N·m)Tm/°C
A882.52.012.0875.20
B1281.52.512.5074.03
Table 4. Design value of structural parameters of friction disc oil groove.
ParametersValue
Number of radial groovesm681012
Radial groove width [mm]b12468
Annular groove width [mm]b21.522.53
Annular groove spacing [mm]l1.522.53
Table 5. SNR value of drag torque (Smaller-the-Better).
Parametersmb1b2l
121.9721.8421.9521.81
221.9521.9121.9021.68
321.4721.7321.6621.90
421.8421.7521.7321.84
Delta0.490.190.290.22
Rank1423
Table 6. SNR value of highest temperature (smaller-the-better).
Parametersmb1b2l
1−37.44−37.50−37.48−37.55
2−37.51−37.51−37.53−37.46
3−37.53−37.51−37.47−37.47
4−37.52−37.49−37.52−37.53
Delta0.090.030.060.09
Rank2431
Table 7. Optimal parameters of Taguchi experiment.
mb1/mmb2/mml/mm
M1062.52
Tm682.52
Table 8. The parameters in NNIA algorithm.
Parameters
Gmaxmaximum number of generations50
nDmaximum size of dominant population30
nAmaximum size of active population40
nCsize of clone population60
buthe upper boundary of variable[12,8,3,3]
bdthe nether boundary of variable[6,2,1.5,1.5]
DGmax+1final approximate Pareto-optimal set
Table 9. Results of Taguchi experiment.
No.mb1/mmb2/mml/mmS/mm2M/N·mTm/°C
1621.51.512,80712.8475.70
2642.02.012,59212.5373.78
3662.52.512,08612.5474.02
4683.03.012,02012.2674.54
5822.02.512,80412.7074.78
6841.53.014,35713.1375.10
7863.01.512,18012.1975.10
8882.52.011,56612.0875.20
91022.53.012,36311.6374.57
101043.02.512,26112.0576.20
111061.52.012,51811.6374.57
121082.01.511,51812.0975.70
131223.02.012,59212.3074.95
141242.51.511,83112.1875.10
151262.03.012,85612.4576.67
161281.52.512,06812.5074.03
Table 10. The comparison of simulation data and the Pareto optimal solution sets.
No.Simulation DataPareto-Optimal SetImprovement
M/(N·m)Tm/°CM/(N·m)Tm/°C
112.1875.1012.1373.64−2.00% of Tm
212.8475.7012.7972.57−4.31% of Tm
312.4576.6712.5472.74−5.40% of Tm
412.5074.0411.9874.06−4.34% of M
512.8475.7011.5675.64−6.22% of M
613.1375.1011.7075.08−12.22% of M
Table 11. Verified simulation results table.
ParametersM/(Nm)Tm/°C
No.mb1b2lSSimulationPredictederrorSimulationPredictederror
163.592.401.6712,82912.8512.681.38%72.9272.620.41%
2124.102.402.8112,18212.1011.871.93%74.6374.410.30%
Table 12. Parameters for experiments [16,23].
Parametersρ (kg/m3)r1 (mm)r2 (mm)μ (Pa s)Q (L/min)
Values87070.684.250.0531.0
Disclaimer/Publisher’s Note: The statements, opinions and data contained in all publications are solely those of the individual author(s) and contributor(s) and not of MDPI and/or the editor(s). MDPI and/or the editor(s) disclaim responsibility for any injury to people or property resulting from any ideas, methods, instructions or products referred to in the content.