Abstract
Installing surge protection devices in a hybrid photovoltaic (PV)–wind system is essential to guarantee the survival of the system’s components. If the surge arresters are connected without taking into account the recommendations given by standards, the equipment to be protected might be damaged despite the energy coordination of the arresters. In this study, nonlinear surge protective devices (SPDs) are designed for a multi-MW hybrid system based on lightning protection standards with optimised threat level ratings to investigate the mitigation of lightning transients to an acceptable level. The system is implemented using Power System Computer-Aided Design for Electromagnetic Transients including Direct Current (PSCAD/EMTDC) software. It comprises a 2 MW PV farm, a 2 MW wind farm, and a backup energy storage system (ESS), which are all connected to a 132 kV grid via a step-up transformer and a transmission line. The results were obtained at critical system nodes for two standard lightning current surges, i.e., 1/10 µs and 10/350 µs, considering two lightning strike point scenarios with and without a lightning protection system (LPS). The simulation results showed that the connected SPDs could successfully limit the transient overvoltage in the system to an acceptable level. The analysis in this work is crucial for designing, operating, and maintaining a hybrid PV–wind system. It can help to find the potential vulnerability areas within such a system and implement appropriate protection measures since there is no available lightning standard for such systems. Additionally, it assists the system operators in increasing the uptime and dependability of their RE systems, limiting expensive downtime and environmental effects while optimising energy output. Based on the results obtained, recommendations were made for lightning protection developers.
1. Introduction
The demand for energy is increasing day by day due to the world’s rapidly growing population and standards of living. Meeting such significant energy demands poses great challenges for the power industry due to limited energy sources, greenhouse gas (GHG) emissions, and other environmental concerns associated with fossil fuels. As a result, the focus is shifting towards utilising various renewable energy sources (RE), such as solar, wind power, hydroelectric power, fuel cells, and biogas, which can be integrated to form a hybrid system [1,2,3,4] to achieve sustainable and clean power generation that lowers the environmental effect [5]. These sources can be connected to a backup energy storage system to overcome the intermittence and site-specificity disadvantages. Integrating different RE power sources can overcome the limitations of a single power source, such as system stability, reliability, efficiency, fuel flexibility, and emissions [6,7,8]. However, these systems have higher installation costs and more disadvantages than conventional power generation technologies [9]. In addition, due to their physical structure and installation locations in wide open areas, they are vulnerable to direct or indirect lightning strikes. The probability of lightning strikes is higher, especially in large-scale systems with large PV arrays [10] and wind turbines (WTs) with higher structures [11,12]. A generated induced overvoltage during a lightning strike can damage the equipment in hybrid RE systems, such as PV modules, converters, inverters, generators, transformers, control systems [13,14], meters, and data networks, which include sensors and transducers, or decrease PV system efficiency by affecting the IeV and PeV characteristics of the module [15]. Replacing damaged components due to lightning can significantly increase these systems’ installation and maintenance costs and can have indirect environmental consequences if a damaged system takes time to repair or replace. The temporary reduction in renewable energy generation may increase reliance on non-renewable energy sources, leading to increased carbon emissions and environmental impact. Therefore, an adequate lightning protection system (LPS) must be installed to protect the system components based on the available lightning protection standard.
Various studies have been conducted on the effects of lightning on PV and WT systems, either theoretically by using appropriate simulation software [16,17,18,19,20,21,22,23,24,25,26,27], or experimentally by performing field measurements or laboratory tests [28,29,30,31,32,33,34]. In [16,17], a lightning effects analysis on a grid-connected PV farm was performed by using Power System Computer-Aided Design for Electromagnetic Transients including Direct Current (PSCAD/EMTDC) software. In [18], the impacts of turbine basis reinforcement, mutual coupling, and interconnection cables between the grounding systems of neighbouring turbines in a wind farm were analysed and simulated. In [19], lightning protection based on artificial intelligence for a smart grid distribution system was proposed. In [20], basic protection measures against lightning strikes on WTs were presented. In [21], lightning risk assessment and lightning strike effects on a small-scale rooftop PV system based on computational methodology were performed. In [22], an analysis of group grounding effects on the potential rise across PV panels during a lightning strike was conducted. In [11,12,23,24,25], comprehensive lightning surge analyses were performed on wind farms using Electromagnetic Transients Program (EMTP) software. In [26,27], the impacts of lightning current on large-scale critical WT components, such as blades, receptors, nacelle, towers, and bases, were investigated by using COMSOL software and experimental work.
In [28], an experimental study of lightning overvoltage based on using a reduced-size model was performed in WT generation systems. In [29], the impact of the soil electrical parameter’s frequency dependence on the lightning performance of typical WT grounding systems was investigated based on simulation and experimental works. In [30], research advances in LPSs for offshore WTs were presented for the physical mechanism aspects of lightning attachment. In [31], the impact of receptors on the lightning strike protection of WT blades was investigated. In [32], a study of transient behaviour during lightning strikes to multi-blades of offshore WTs was conducted. In [33], an impulse generator was designed to investigate the effects of indirect lightning current on a utility-scale PV installation. In [34], an experimental study was performed on lightning attachment manner to WT blades with a lightning protection system. The experimental model is not flexible due to the large cost of experimental research [35].
Most previous studies have focused on lightning analysis for PV or wind systems individually. In addition, the appropriate design and installation of LPSs is still being investigated [36]. Many lightning protection standards are available for PV and wind systems, but standards for hybrid systems are not yet available. This study analyses the performance of a protection system against the effects of direct lightning on a grid-integrated hybrid system using PSCAD/EMTDC software. The LPS based on surge-protective devices (SPDs) is selected according to recommendations given by the European Committee for Electrotechnical Standardization (CENELEC) and International Electrotechnical Commission (IEC) standards. From the analysis, the protection level of the designed SPDs is investigated under fast-front lightning currents as it is necessary to determine the risk of damage and to know whether they are sufficient for such a system as required by the IEC 62305 standard [37] for design considerations. These SPDs must limit transient overvoltage to below the protection level to protect the hybrid system from lightning transients. Lightning analysis is crucial for designing, operating, and maintaining RE systems, particularly those involving WTs and solar panels. Conducting a risk assessment can help to identify potential vulnerability areas within the hybrid system, assess the impact of lightning strikes on the system’s components, and implement appropriate protection measures. Also, it helps the system operators to enhance the reliability and uptime of their RE systems, minimising costly downtime and environmental impact and maximising energy production. The paper is organised as follows: The second section presents the methodology and design of the system. In the third section, the results and discussion are presented. Finally, the fourth section is the conclusion and perspectives of this paper.
2. Methodology and Design
This section includes the modelling design of a hybrid PV–wind system, lightning current, and lightning protection. The PSCAD library allows users to build and design custom electrical systems with the help of an assortment of function blocks. The modelling design’s detail is discussed in the following subsections.
2.1. Modelling of the Hybrid System
The hybrid PV–wind system’s model comprises a 2 MW PV farm, a 2.1 MW wind farm, an energy storage system, and a 1 MW-per-phase load, as illustrated in Figure 1. The operating frequency of the system is set at 60 Hz. The system is integrated into the utility grid through a 33/132 kV step-up transformer and transmission lines.
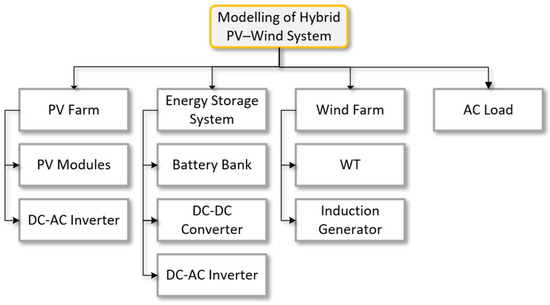
Figure 1.
Modelling design chart of the hybrid system.
2.1.1. PV Farm
The PV farm contains five units of 400 kW PV modules, generating 2 MW power, a grid-connected inverter, and a 0.480/33 kV step-up transformer. The effect of maximum power point tracking (MPPT) was ignored in the simulation, so the DC-DC converter is not included in the PV farm. The parameters of the PV module are presented in Table 1.

Table 1.
Parameters of a single-unit PV module.
The generated DC power from the PV farm was converted to AC power using a voltage source inverter (VSI). It comprises six insulated-gate bipolar transistors (IGBTs), an inverter control circuit, and an LCL filter, as illustrated in Figure 2. The filter removes the harmonic content in the inverter output voltage. The PV farm’s output is connected to a 33 kV bus through a 0.480/33 kV step-up transformer. The current control mode operates the inverter, which includes two control loops. The first loop maintains the DC link voltage at a constant reference value. In contrast, the second loop controls the active and reactive currents in the d-q synchronous reference frame aligned to the grid voltage and current vectors [38]. A phase-locked loop (PLL) algorithm is used to determine the phase angle of grid voltage in order to synchronise the delivered energy [39,40,41,42]. The inverter control circuit generates the IGBTs’ gate signals using a triangular carrier signal with a space vector pulse-width modulation (SVPWM) technique. These generated signals turn the IGBTs of the inverter off and on (Figure 2).
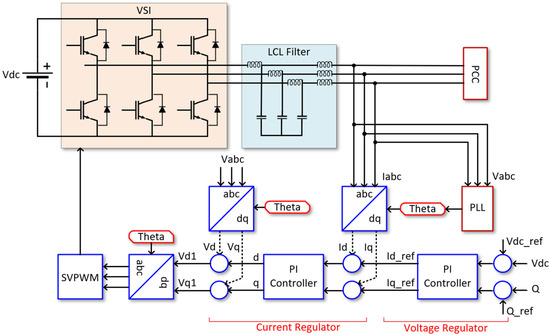
Figure 2.
Grid–connected inverter design.
2.1.2. ESS
The ESS model comprises a battery bank, a bidirectional DC–DC converter, and a bidirectional inverter. The schematic circuit of a buck–boost converter is illustrated in Figure 3. The converter takes an input voltage and regulates it to a desired output voltage level. It uses semiconductor switches, such as transistors, to switch the input voltage on and off at a high frequency. This high-frequency switching allows the converter to step up or down the voltage level. During charging the battery, the converter works as a buck and as a boost during discharging [43]. The converter’s output is connected to the inverter. Note that the same inverter model presented in the PV farm is used in ESS and connected to the 33 kV bus through a 0.480/33 kV step-up transformer. The ESS typically stores energy from solar PV and WT systems when sunlight or airflow are absent.
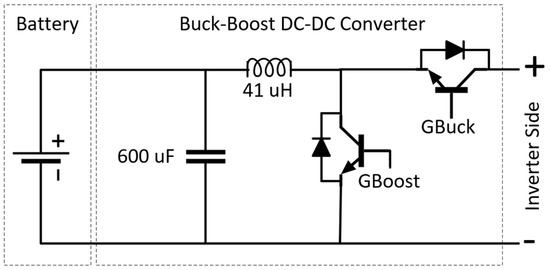
Figure 3.
The DC−DC converter design is used in energy storage systems.
2.1.3. Wind Farm
A fixed-speed WT model with a rated capacity of 2.1 MW and an induction generator was used to implement the wind farm in PSCAD. Such a WT is robust, reliable, affordable, easy to maintain, and field-proven. The PSCAD library provides different models for wind power, such as the wind source, turbine, and induction generator models. The rotor blades’ pitch angle is fixed at a constant value. The generator’s output is linked to a 0.690/33 kV step-up transformer. Table 2 and Table 3 present the wind farm’s specifications.
Table 2.
Parameters of a WT system.
Table 3.
Parameters of induction machine.
The wind farm’s rated power () is presented in Equation (1).
where is air density, is the turbine swept area, is power coefficient, and υ is wind speed. The turbine mechanical torque is described in the following equation:
where is the rotor angular speed in rad/s.
The hybrid system is integrated into the 132 kV grid through a step-up transformer and transmission line. The frequency-dependent model is used for the transmission line in PSCAD, as presented in Figure 4.
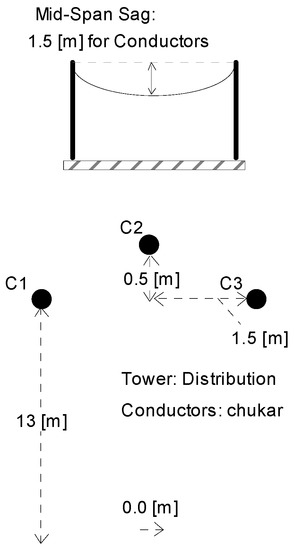
Figure 4.
Transmission line diagram in PSCAD.
2.2. Lightning Current
Three lightning currents are modelled in this work using PSCAD 4.5 software with the standard waveforms 1/10 µs, 8/20 µs, and 10/350 µs based on the following Heidler function equation:
where is peak current, is the correction factor, and are the waveform’s rise time and decay time, respectively, and is the steepness factor. The parameters of PSCAD-modelled lightning currents and their waveforms are presented in Table 4 and Figure 5.
Table 4.
The parameters of lightning currents.
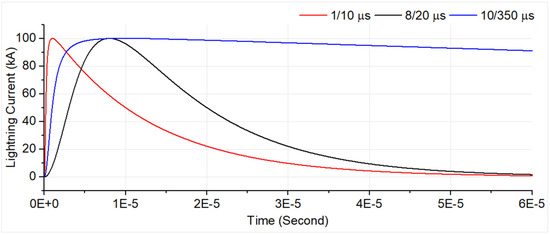
Figure 5.
Lightning current waveforms: 1/10 μs and 10/350 μs, 100 kA.
The generated lightning currents are injected into the hybrid system through two main strike points which are the DC side of the PV farm (point 1) and the WT side (point 2) since they are the most vulnerable to lightning.
2.3. Lightning Protection
A suitable protective mechanism based on SPDs was developed using guidelines from the CENELEC [44] and IEC standards, which are available for PV systems with an integrated external LPS. Figure 6 shows the suggested locations where SPDs should be installed in a hybrid system. According to the standard, seven specified points in the figure were utilised with class 1 SPDs. Two sets of SPDs are installed close to the DC and AC sides of the PV inverter. However, only one set of SPDs is installed at location 1 since it is assumed that the distance between the PV modules and PV inverter on the DC side of the PV system is less than 10 metres. Since there is no particular standard for hybrid systems, the same standard is used for SPDs to protect the remaining components of the hybrid system, including the ESS, transformers, WT generator, and load. The protection level (Up) for the employed SPDs was chosen according to the standards recommendations in Table 5. For systems between 0.4 and 0.69 kV, the Up value for first-class SPDs is set at a maximum of 2.5 kV, whereas it is 4 kV for systems between 0.69 and 1 kV. The withstand voltage for the 33 kV sides of the transformers is around 160 kV, and the Up value of the SPDs is set at 130 kV. Due to its faster response time than other SPD types, metal oxide varistor (MOV) SPDs are employed for all locations. To guarantee adequate protection of the equipment, the Up value should be lower than the withstand voltage of the equipment to be protected with a safety margin of at least 20%. The I–V characteristics of SPDs were selected based on the recommended maximum continuous operation voltage (MCOV) shown in Table 5. These MCOV values were chosen following the guidelines provided by the IEC and the Institute of Electrical and Electronic Engineers (IEEE) standards [45]. An effective LPS depends on the location, construction type, utilisation [46], MCOV, voltage protection level, and nominal discharge current ratings associated with its application. Therefore, configuration surge arresters need to be adjusted based on the scale and the topology of the system [11]. Figure 7 and Figure 8 display the I–V characteristics and residual voltage curves of the designed SPDs.
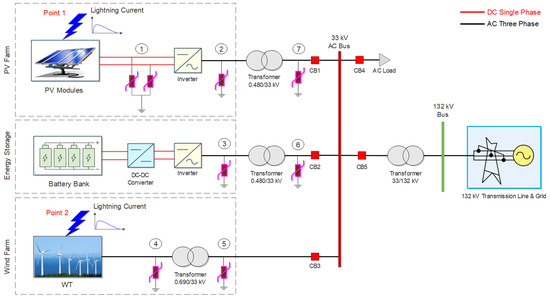
Figure 6.
4.1 MW hybrid grid-connected system.
Table 5.
Specification of SPDs used in the system.
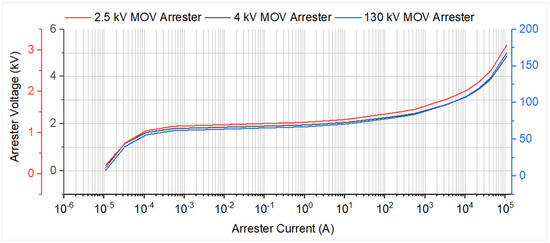
Figure 7.
SPDs’ I−V characteristics curve.
Figure 8.
Residual voltages of class 1 SPDs under 10/350 µs, 25 kA lightning current.
3. Results and Discussion
Three case studies were carried out in this section, including a hybrid PV–wind system under normal operating conditions without lightning, lightning transient effects on the hybrid system without LPS, and lightning transient effects on the hybrid system with the connection of the proposed LPS according to the CENELEC standard. The simulation results of these cases are presented and discussed in detail in the following subsections, respectively.
3.1. Simulation Results of Case 1
In this simulation case, the results of the hybrid system were obtained without lightning currents to investigate the system under normal operating conditions. Figure 9 shows that the results of the grid output current and voltage waveforms are clean-sinewave-symmetrical around zero, and the system generates a total of 4.1 MW of power. Note that the peak values of the voltages in the figure are instantaneous phase-to-ground quantities obtained in the PSCAD. The peak value of the voltage waveform at the primary side of the 33 kV grid is calculated according to Equation (9).
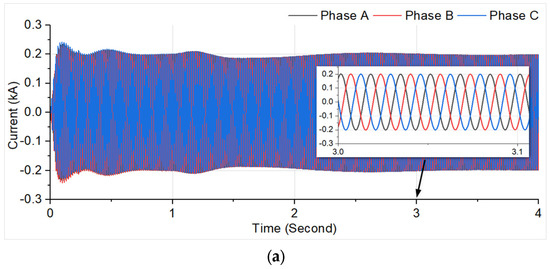
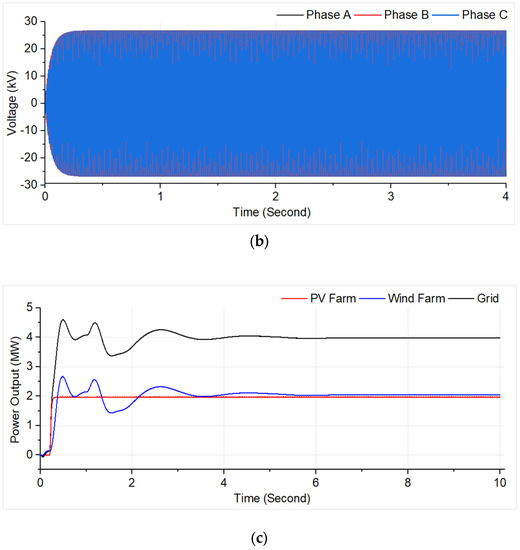
Figure 9.
Output results of hybrid PV−wind system: (a) instantaneous current, (b) instantaneous voltage, and (c) active power.
3.2. Simulation Results of Case 2
In this simulation case, the transient effects of direct lightning strikes were analysed on the hybrid system by injecting two standard lightning currents, 1/10 µs and 10/350 µs waveforms, without LPS in the separate simulation cases. The lightning currents were injected into the system at the DC side of the PV farm (point 1) and WT side (point 2), with 100 kA and 50 kA current magnitudes, respectively, as illustrated in Figure 6. The reason for selecting 50 kA for the WT side is assuming that the lightning strikes the WT tower and 50% of the lightning current is discharged to the electrical system of the WT. In the first part of this case, the transient current and overvoltage results are obtained at the different locations of the hybrid system due to a fast-front 1/10 µs standard lightning current, as presented in Figure 10.
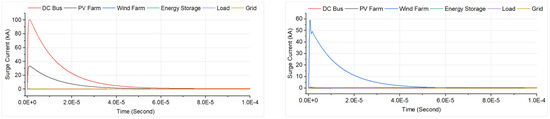
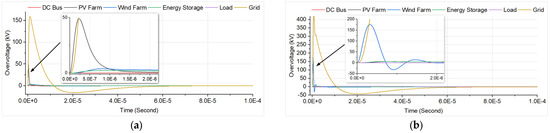
Figure 10.
Transient current and overvoltage waveforms at different system points due to 1/10 µs standard lightning current when it strikes at (a) the DC side of the PV farm and (b) the WT side without LPS.
Figure 10a shows that when 100 kA lightning current was injected into the DC side of the PV system (point 1), high transient current and overvoltage were developed in the hybrid system, especially at the PV and 33 kV grid system sides, and the maximum transient overvoltage at these sides was obtained with the values of 49.11 kV and 159.29 kV, respectively. These values are several times higher than the system voltage at these sides. In Figure 10b, when a 50 kA lightning current is injected into the WT side, a high transient overvoltage is observed at the same side and 33 kV grid side with a value of 175.37 kV and 424.67 kV, respectively. Also, from the figure, the highest transient currents are observed close to the lightning strike points and are almost equal to the lightning current magnitudes. These observed transient overvoltages at various parts of the hybrid system can cause damage to the equipment on its path, like the PV modules, inverters, WT generators, and transformers, or affect their expected lifetime.
In the second part of this simulation case, the hybrid system was tested with another important standard lightning waveform, 10/350 μs. Again, the transient current and overvoltage results were obtained across the hybrid system without lightning protection, as presented in Figure 11. The figure shows that in this simulation part, lower overvoltage values were obtained across the hybrid system compared to the previous simulation results since the induced overvoltage across the conductor was directly proportional to the variation rate of the current passing through it, as presented in Equation (11) [15]. Similar results were obtained in other studies [11,36] due to the type of lightning current.
where is the induced overvoltage and is the mutual inductance in Henries (H).
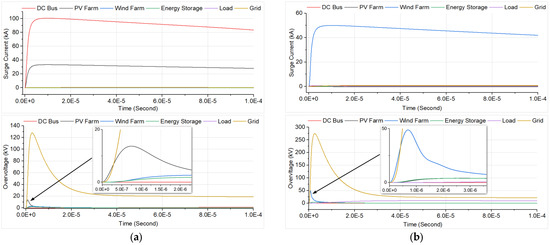
Figure 11.
Transient current and overvoltage waveforms at different points of the system due to 10/350 µs standard lightning current when it strikes at (a) the DC side of the PV farm and (b) the WT side without LPS.
In Figure 11a, it is seen that when the lightning current was injected into the PV system side, the overvoltages at the AC side of the PV inverter and the 33 kV grid side were 13.67 kV and 127.85 kV, respectively. When lightning was injected into the WT system, the overvoltages were obtained with values of 48.81 kV and 274.78 kV at the WT and 33 kV grid sides, respectively. Despite lower overvoltage peak values, the waveforms of the observed transient currents and overvoltages in the system have longer rise and decay times, producing extremely high energy and causing severe damage to the system’s components. This is because this injected lightning current has a longer decay time, as presented in Figure 5.
The developed overvoltage and lightning threat depend on several lightning parameters, such as the waveform’s peak current, rise and decay times, maximum current derivative, specific energy, and charge transfer. The high transient currents may melt the equipment in the system due to the high energy dissipation in the form of heat.
3.3. Simulation Results of Case 3
In this simulation, the transient effect analysis in the previous section was repeated on the hybrid system with the installed SPDs based on the CENELEC standard recommendations to investigate whether it is sufficient for the hybrid PV–wind system application and the mitigation level of transient effects. Note that these SPDs are connected to the system at the main seven locations (Figure 6). The results in Figure 12 and Figure 13 show that the developed lightning transient overvoltages due to 1/10 µs and 10/350 µs lightning currents across the hybrid PV–wind system are clamped successfully to below the protection level presented in Table 5 for both injection points at the DC side of the PV system and the WT side. For example, in Figure 12a, when 1/10 µs lightning current is injected into the PV system, the developed overvoltage at the grid side is reduced to 0.78 kV. In contrast, Figure 12b shows a reduction to 51.79 kV when injected into the WT side. In Figure 13a,b, the maximum overvoltage values at the grid side are reduced to 1.74 kV and 61 kV when 10/350 µs lightning current is injected into the PV and WT sides, respectively.
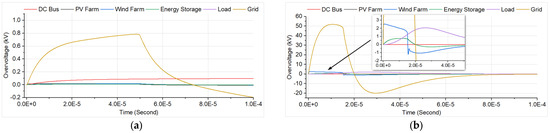
Figure 12.
Transient overvoltage waveforms at different points of the system due to 1/10 µs standard lightning current when it strikes at (a) the DC side of the PV farm and (b) the WT side with LPS.
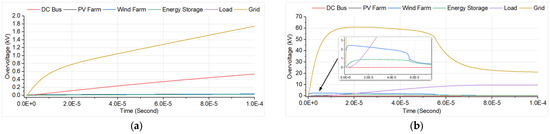
Figure 13.
Transient overvoltage waveforms at different points of the system due to 10/350 µs standard lightning current when it strikes at (a) the DC side of the PV farm and (b) the WT side with LPS.
Also, Figure 12 and Figure 13 show that the developed transient overvoltage at the WT sides is reduced to about 2.5 kV for both lightning currents, equal to the protection level for that side (Table 5). International standards require test SPDs with fast-front lightning current waveforms to investigate whether SPDs can clamp short and long durations of lightning impulses like those in lightning events [47]. In this simulation case, we also presented the dissipated energy through the SPDs connected to the system at different locations for both lightning current waveforms to investigate the stress level during the clamping process, as illustrated in Figure 14. The surge arrester energy () depends on the area under the curve and is computed during the transient process by the following equation [12]:
where is the arrival time of the lightning surge at the arrester, and and are the instantaneous voltage and discharge current across the arrester, respectively.
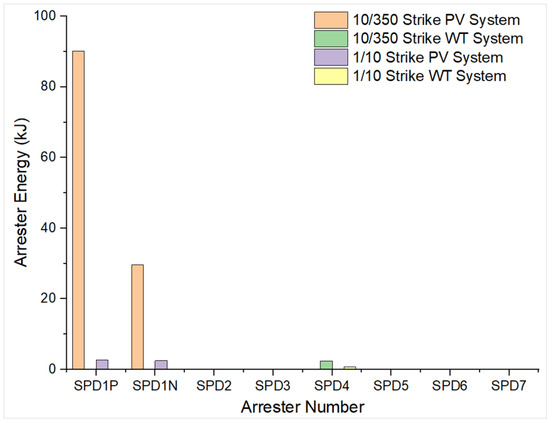
Figure 14.
The energy dissipated through the arresters in the system during the lightning strikes.
Figure 14 demonstrates that when lightning current is injected into the DC side of the PV system, only the SPD connected to that side is enabled. In contrast, the SPD at the WT side is enabled when injected to that side, which means only the SPDs close to the lightning strike points were enabled. However, small leakage currents in the range of milliamperes can still be observed through those SPDs that need to be enabled and hence are neglected. Also, from the figure, one can notice that the energy dissipated through the SPDs due to 10/350 µs lightning current is significantly greater than that obtained due to 1/10 µs lightning current since 10/350 µs produces much more energy, as we discussed in the previous simulation case. Similar to the results of other work, the highest energy obtained through the SPDs which are close to the strike point [12], especially the SPD connected to the positive pole of the DC side of the PV system (location 1), had a value of 90.19 kJ due to the 10/350 µs lightning current. This is because the magnitude of the injected lightning current at that side is 100 kA, while at the WT side, 50 kA was injected in this work. When the lightning discharge current increases, the energy absorption and current through the SPDs are raised. Moreover, it is clear from the figure that the SPD linked to the negative pole of the DC side of the PV is less stressed than the positive-pole SPD, indicating that the positive and negative poles of that side do not receive an equal distribution of the lightning current [36]. The lifespan of a low-voltage SPD is influenced by the number of lightning discharges, current intensity, and stroke duration [48]. Note that the obtained results in this work may differ from another hybrid system design, which also depends on other system topologies and connected load ratings.
The adequacy of the SPD simulation results in this work was validated using the data for three low-voltage arresters provided by Lira et al. [49], since this work mainly focuses on lightning protection based on SPDs and uses similar nonlinear arresters. The arresters were exposed to an 8/20 μs, 10 kA impulse current in PSCAD software. The PSCAD circuit is illustrated in Figure 15. The experimental results of the arresters’ residual voltages provided by the study were compared with PSCAD results, as presented in Table 6 and Figure 16. The results show that the residual voltages of the arresters in PSCAD are extremely close to the experimental values with minimal errors.
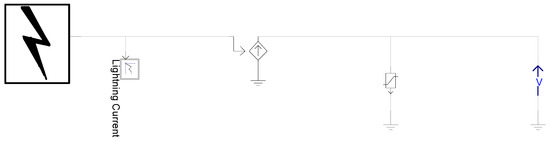
Figure 15.
PSCAD circuit used for validation.
Table 6.
Residual voltage comparison results of three low-voltage arresters under 8/2 µs, 10 kA lightning obtained through experimental work provided by Lira et al. [49] and PSCAD simulation.
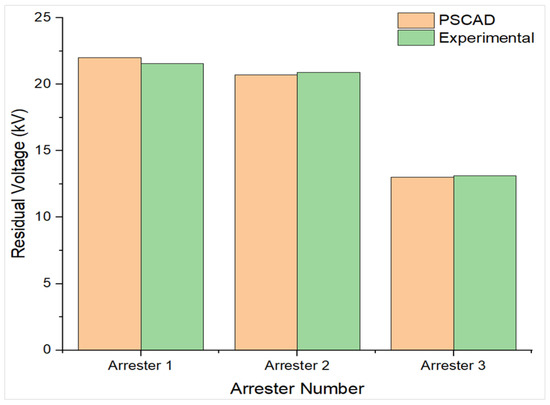
Figure 16.
Residual voltage comparison results of three-low voltage arrester under 8/2 µs, 10 kA lightning obtained through experimental work provided by Lira et al. [49] and PSCAD simulation.
4. Conclusions
In this study, the application of CENELEC standards to the hybrid system has been investigated to determine the levels of mitigation of lightning-induced transient effects using PSCAD software. The simulation results were obtained across the hybrid system using 1/10 µs and 10/350 µs standard lightning current waveforms with and without an LPS. Extreme overvoltage values were observed at several points in the hybrid system when the LPS was not installed. The highest overvoltage values were at the primary side of the WT transformer and the 33 kV grid side with values of 175.37 kV and 424.67 kV, respectively. The severity is sufficient to cause insulation failure, which may damage the hybrid system’s connected electrical devices and equipment. The most destructive damage could be due to the 10/350 µs lightning current waveform, mainly due to the large amount of energy that may dissipate at various load points.
LPSs were then applied to the hybrid system according to the standards. The SPDs were connected to the system at different locations based on recommendations given by the standards, and simulations were repeated to investigate the mitigation levels of induced transients by the installed SPDs. The type 1 arrester could clamp the developed overvoltage successfully. However, stresses were observed in the connected SPDs at the DC side of the PV system and the WT side due to the high overvoltage and dissipated energy. The highest dissipated energy was obtained through the SPD connected to the positive pole at the DC side of the PV system with a value of 90.19 kJ. Based on the results, the following recommendations are provided to developers of lightning protection:
(1) The installed SPDs, according to the CENELEC standards at the 0.48 kV and 33 kV system sides at locations 2, 3, 5, 6, and 7 successfully clamp the transient overvoltage to below 2.5 and 130 kV protection levels, respectively, due to 1/10 µs and 10/350 µs, 10 kA current waveforms, so they are appropriate to protect the system from lightning transients.
(2) The installed SPDs at the DC side of the PV farm and the WT side (locations 1 and 4) successfully clamped the overvoltages to below their protection levels for both lightning currents. However, due to the high overvoltage and dissipated energy, an overstress was observed in the connected SPDs, as mentioned earlier. Therefore, we advise connecting two sets of class 1 SPDs in parallel with the same I–V characteristics on the DC and WT sides. Good matching in the characteristics of related SPDs is required to equally discharge current and energy through them and avoid an overstress of one of the arresters. The SPDs connected in parallel release the energy stress on them since the rating energy of the arresters is doubled and the surge current is discharged into the ground by the two paths, reducing the failure probability.
(3) At the DC side of the ESS, installing SPDs is unnecessary as the AC side is connected to an SPD stage (location 3). Because the ESS is generally mounted close to the bus and not in an open area, the system’s vulnerability to the lightning effects is thus minimal.
Author Contributions
Conceptualization, M.Z.A.A.K. and Z.M.K.A.; methodology, Z.M.K.A.; validation, H.H. and C.G.; formal analysis, Z.M.K.A.; investigation, Z.M.K.A. and M.Z.A.A.K.; writing—original draft preparation, Z.M.K.A.; writing—review and editing, Z.M.K.A.; supervision M.Z.A.A.K., H.H. and C.G.; project administration, M.Z.A.A.K. and Z.M.K.A.; funding acquisition, M.Z.A.A.K. and H.H. All authors have read and agreed to the published version of the manuscript.
Funding
The authors would like to thank and acknowledge Universiti Putra Malaysia and Advanced Lightning, Power and Energy Research Centre (ALPER) for supporting this research under Inisiatif Putra Berkumpulan [GP-IPB/2022/9717002].
Data Availability Statement
Not applicable.
Acknowledgments
The authors would like to thank the Advanced Lightning Power and Energy Research Centre (ALPER) and the Department of Electrical and Electronic Engineering, University Putra Malaysia for their invaluable support and facilities, which led to the successful completion of this work.
Conflicts of Interest
The authors declare no conflict of interest. The funders had no role in the design of the study; in the collection, analyses, or interpretation of data; in the writing of the manuscript, or in the decision to publish the results.
References
- Das, P.; Chandramohan, V. A review on recent advances in hybrid solar updraft tower plants: Challenges and future aspects. Sustain. Energy Technol. Assess. 2023, 55, 102978. [Google Scholar] [CrossRef]
- Krishna, K.S.; Kumar, K.S. A review on hybrid renewable energy systems. Renew. Sustain. Energy Rev. 2015, 52, 907–916. [Google Scholar] [CrossRef]
- Tan, J.D.; Chang, C.C.W.; Bhuiyan, M.A.S.; Nisa’Minhad, K.; Ali, K. Advancements of wind energy conversion systems for low-wind urban environments: A review. Energy Rep. 2022, 8, 3406–3414. [Google Scholar] [CrossRef]
- Roga, S.; Bardhan, S.; Kumar, Y.; Dubey, S.K. Recent technology and challenges of wind energy generation: A review. Sustain. Energy Technol. Assess. 2022, 52, 102239. [Google Scholar] [CrossRef]
- Kálecz, G.; Tóth, Z.; Kiss, I.; Németh, B. Theory behind the zone concept for external lightning protection of photovoltaic power plants. Electr. Power Syst. Res. 2022, 209, 108025. [Google Scholar] [CrossRef]
- Nema, P.; Nema, R.; Rangnekar, S. A current and future state of art development of hybrid energy system using wind and pv-solar: A review. Renew. Sustain. Energy Rev. 2009, 13, 2096–2103. [Google Scholar] [CrossRef]
- Bajpai, P.; Dash, V. Hybrid renewable energy systems for power generation in stand-alone applications: A review. Renew. Sustain. Energy Rev. 2012, 16, 2926–2939. [Google Scholar] [CrossRef]
- Worku, M.Y. Recent advances in energy storage systems for renewable source grid integration: A comprehensive review. Sustainability 2022, 14, 5985. [Google Scholar] [CrossRef]
- Nehrir, M.; Wang, C.; Strunz, K.; Aki, H.; Ramakumar, R.; Bing, J.; Miao, Z.; Salameh, Z. A review of hybrid renewable/alternative energy systems for electric power generation: Configurations, control, and applications. IEEE Trans. Sustain. Energy 2011, 2, 392–403. [Google Scholar] [CrossRef]
- Christodoulou, C.A.; Ekonomou, L.; Gonos, I.F.; Papanikolaou, N.P. Lightning protection of pv systems. Energy Syst. 2016, 7, 469–482. [Google Scholar] [CrossRef]
- Sun, Q.; Yang, L.; Zheng, Z.; Han, J.; Wang, Y.; Yao, L. A comprehensive lightning surge analysis in offshore wind farm. Electr. Power Syst. Res. 2022, 211, 108259. [Google Scholar] [CrossRef]
- Hosseini, S.A.; Mohammadirad, A.; Akmal, A.A.S. Surge analysis on wind farm considering lightning strike to multi-blade. Renew. Energy 2022, 186, 312–326. [Google Scholar] [CrossRef]
- Bak, C.L.; Einarsdóttir, K.E.; Andresson, E.; Rasmussen, J.M.; Lykkegaard, J.; Wiechowski, W. Overvoltage protection of large power transformers—A real-life study case. IEEE Trans. Power Deliv. 2008, 23, 657–666. [Google Scholar] [CrossRef]
- Djalel, D.; Abdallah, G.; Hocine, L. Study of the lightning impact on the wind-turbine. Energy Res. J. 2014, 5, 17. [Google Scholar] [CrossRef]
- Hetita, I.; Zalhaf, A.S.; Mansour, D.-E.A.; Han, Y.; Yang, P.; Wang, C. Modeling and protection of photovoltaic systems during lightning strikes: A review. Renew. Energy 2022, 184, 134–148. [Google Scholar] [CrossRef]
- Zaini, N.; Kadir, A.; Abidin, M.Z.; Radzi, M.; Amran, M.; Izadi, M.; Azis, N.; Ahmad, N.I.; Nasir, M.S.M. Lightning surge analysis on a large scale grid-connected solar photovoltaic system. Energies 2017, 10, 2149. [Google Scholar] [CrossRef]
- Said, A.; Abd-Allah, M.; Mohsen, M. Alleviation of the transients induced in large photovoltaic power plants by direct lightning stroke. Ain Shams Eng. J. 2023, 14, 101880. [Google Scholar] [CrossRef]
- Siahpoosh, M.K.; Li, L.; Dorrell, D.G. Wind farm grounding system analysis. In Proceedings of the 2017 IEEE Energy Conversion Congress and Exposition (ECCE), Cincinnati, OH, USA, 1–5 October 2017; pp. 4780–4785. [Google Scholar]
- Tong, C.; Cai, Y.; Zhang, Z.; Wang, Q.; Gao, Y.; Li, J.; Yu, D. Artificial intelligence-based lightning protection of smart grid distribution system. In Proceedings of the 2017 International Symposium on Lightning Protection (XIV SIPDA), Natal, Brazil, 2–6 October 2017; pp. 279–286. [Google Scholar]
- Pastromas, S.; Pyrgioti, E. Protection Measures on Wind Turbines against Lightning Strikes. In Proceedings of the International Conference on Renewable Energies and Power Quality (ICREPQ’17), Malaga, Spain, 4–6 April 2017. [Google Scholar]
- Holland, I.; Doorsamy, W.; Nixon, K. Computational methodology for lightning risk assessment of small-scale rooftop photovoltaic systems. In Proceedings of the 2018 IEEE International Conference on Environment and Electrical Engineering and 2018 IEEE Industrial and Commercial Power Systems Europe (EEEIC/I&CPS Europe), Palermo, Italy, 2–15 June 2018; pp. 1–6. [Google Scholar]
- Mohamed, F.P.; Siew, W.H.; Mahmud, S. Effect of group grounding on the potential rise across solar PV panels during lightning strike. In Proceedings of the 2019 11th Asia-Pacific International Conference on Lightning (APL), Hong Kong, China, 12–14 June 2019; pp. 1–5. [Google Scholar]
- Rodrigues, R.B.; Mendes, V.M.F.; Catalão, J.P.d.S. Protection of wind energy systems against the indirect effects of lightning. Renew. Energy 2011, 36, 2888–2896. [Google Scholar] [CrossRef]
- Sekioka, S.; Otoguro, H.; Funabashi, T. A study on overvoltages in windfarm caused by direct lightning stroke. IEEE Trans. Power Deliv. 2018, 34, 671–679. [Google Scholar] [CrossRef]
- Sun, Q.; Yang, L.; Li, Q.; Zhang, X.; Wang, F.; Chen, S.; Zhong, L. Surge analysis for lightning strike on overhead lines of wind farm. Electr. Power Syst. Res. 2021, 194, 107066. [Google Scholar] [CrossRef]
- Pastromas, S.A.; Sandros, K.; Koutras, K.N.; Pyrgioti, E.C. Investigation of lightning strike effects on wind turbine critical components. In Proceedings of the 2018 IEEE International Conference on High Voltage Engineering and Application (ICHVE), Athens, Greece, 10–13 September 2018; pp. 1–4. [Google Scholar]
- Li, P.; Lv, D.; Li, C.; Yue, X.; Cao, H. Optimized design of wind turbine blade receptors based on electrostatic field theory. Electronics 2019, 8, 1418. [Google Scholar] [CrossRef]
- Yamamoto, K.; Noda, T.; Yokoyama, S.; Ametani, A. An experimental study of lightning overvoltages in wind turbine generation systems using a reduced-size model. Electr. Eng. Jpn. 2007, 158, 22–30. [Google Scholar] [CrossRef]
- Alipio, R.; Conceição, D.; Dias, R.N.; Visacro, S.; Yamamoto, K. The effect of frequency dependence of soil electrical parameters on the lightning performance of typical wind-turbine grounding systems. In Proceedings of the 2017 international symposium on lightning protection (XIV SIPDA), Natal, Brazil, 2–6 October 2017; pp. 353–358. [Google Scholar]
- Shi, W.; Ren, J.; Yao, J.; Yuan, H.; Li, Q. Research advances and trends of lightning protection for offshore wind turbines. In Proceedings of the 2017 Chinese Automation Congress (CAC), Jinan, China, 20–22 October 2017; pp. 497–501. [Google Scholar]
- Wang, Y.; Hu, W. Investigation of the effects of receptors on the lightning strike protection of wind turbine blades. IEEE Trans. Electromagn. Compat. 2017, 59, 1180–1187. [Google Scholar] [CrossRef]
- Tao, S.; Zhang, X.; Wang, Y.; Yang, J. Transient behavior analysis of offshore wind turbines during lightning strike to multi-blade. IEEE Access 2018, 6, 22070–22083. [Google Scholar] [CrossRef]
- Coetzer, K.M.; Rix, A.J.; Wiid, P.G. Impulse generator design to investigate indirect lightning strike effects on utility-scale photovoltaic installations. In Proceedings of the 26th South African Universities Power and Engineering Conference, Johannesburg, South Africa, 24–26 January 2018; pp. 181–185. [Google Scholar]
- Guo, Z.; Li, Q.; Ma, Y.; Ren, H.; Fang, Z.; Chen, C.; Siew, W.H. Experimental study on lightning attachment manner to wind turbine blades with lightning protection system. IEEE Trans. Plasma Sci. 2018, 47, 635–646. [Google Scholar] [CrossRef]
- Zhang, L.; Fang, S.; Wang, G.; Zhao, T.; Zou, L. Studies on an electromagnetic transient model of offshore wind turbines and lightning transient overvoltage considering lightning channel wave impedance. Energies 2017, 10, 1995. [Google Scholar] [CrossRef]
- Zhang, Y.; Chen, H.; Du, Y. Lightning protection design of solar photovoltaic systems: Methodology and guidelines. Electr. Power Syst. Res. 2019, 174, 105877. [Google Scholar] [CrossRef]
- IEC-62305-2; Protection against lightning—Part 2: Risk Management. International Electrotechnical Commission (IEC): Milano, Italy, 2014; p. 112.
- Refaat, A.; Kalas, A.; Daoud, A.; Bendary, F. A control methodology of three phase grid connected pv system. Energy 2013, 1, 2. [Google Scholar]
- Kim, R.Y.; Choi, S.Y.; Suh, I.Y. Instantaneous control of average power for grid tie inverter using single phase DQ rotating frame with all pass filter. In Proceedings of the 30th Annual Conference of IEEE Industrial Electronics Society, 2004. IECON 2004, Busan, Republic of Korea, 2–6 November 2004; Volume 1, pp. 274–279. [Google Scholar]
- Abdalrahman, A.; Zekry, A.; Alshazly, A. Simulation and implementation of grid-connected inverters. Int. J. Comput. Appl. 2012, 60, 41–49. [Google Scholar] [CrossRef]
- Zhang, W.; Remon, D.; Cantarellas, A.M.; Rodriguez, P. A unified current loop tuning approach for grid-connected photovoltaic inverters. Energies 2016, 9, 723. [Google Scholar] [CrossRef]
- Muljadi, E.; Singh, M.; Gevorgian, V. User Guide for Pv Dynamic Model Simulation Written on Pscad Platform; National Renewable Energy Laboratory: Golden, CO, USA, 2014. [Google Scholar]
- Kaldellis, J.K. Stand-Alone and Hybrid Wind Energy Systems: Technology, Energy Storage and Applications; Elsevier: Amsterdam, The Netherlands, 2010. [Google Scholar]
- CENELEC. Low-Voltage Surge Protective Devices; European Committee for Electrotechnical Standardization (CENELEC): Brussels, Belgium, 2013; Volume CLC/TS 50539-12, p. 34. [Google Scholar]
- Woodworth, J.; Limburg, D. Arrester v–i Characteristics Tool. Available online: http://www.arresterworks.com/arresterfacts/Arresterfacts_Arrester_Modeling.php (accessed on 2 May 2018).
- Ahmad, N.; Ab-Kadir, M.; Izadi, M.; Azis, N.; Radzi, M.; Zaini, N.; Nasir, M. Lightning protection on photovoltaic systems: A review on current and recommended practices. Renew. Sustain. Energy Rev. 2018, 82, 1611–1619. [Google Scholar] [CrossRef]
- Stuckenholz, C.H.; Gamlin, M. Overview of impulse current test standards and the impact on test equipment. In Proceedings of the 2012 International Conference on Lightning Protection (ICLP), Vienna, Austria, 2–7 September 2012; pp. 1–6. [Google Scholar]
- Quyen, H.A.; Le, Q.T. Selection guide for low voltage surge protector. Int. J. Eng. Res. Technol. (IJERT) 2017, 6, 23–27. [Google Scholar]
- Lira, G.R.S.; Fernandes, D., Jr.; Costa, E.G. Computation of energy absorption and residual voltage in metal oxide surge arrester from digital models and lab tests: A comparative study. In Proceedings of the International Conference on Power Systems Transients (IPST’07), Lyon, France, 4–7 June 2007. [Google Scholar]


Disclaimer/Publisher’s Note: The statements, opinions and data contained in all publications are solely those of the individual author(s) and contributor(s) and not of MDPI and/or the editor(s). MDPI and/or the editor(s) disclaim responsibility for any injury to people or property resulting from any ideas, methods, instructions or products referred to in the content. |
© 2023 by the authors. Licensee MDPI, Basel, Switzerland. This article is an open access article distributed under the terms and conditions of the Creative Commons Attribution (CC BY) license (https://creativecommons.org/licenses/by/4.0/).