Article

Study on the Evolution of Sealing Performance during the Start-Up Process of Dynamic Pressure Seals Based on Three-Dimensional Fractal Functions

College of Mechanical and Electrical Engineering, Beijing University of Chemical Technology, Beijing 100029, China
*
Author to whom correspondence should be addressed.
Machines 2024, 12(4), 269; https://doi.org/10.3390/machines12040269
Submission received: 20 March 2024 / Revised: 14 April 2024 / Accepted: 15 April 2024 / Published: 17 April 2024
(This article belongs to the Section Advanced Manufacturing)

Abstract

:
A model based on a three-dimensional fractal function is developed and used in conjunction with experiments to analyze the evolutionary pattern of sealing performance during the start-up process of dynamic pressure seals, and the influence of end-face microscopic features on the evolution law is discussed. It is found that the opening state of the seal is divided into three stages: the non-opened stage, transition stage, and full-opened stage. The isotropic dimensions of the cavities have a coupling effect on the leakage, and they diminish as the speed increases. In order to enhance the sealing performance during start-up, it is suggested that the seal faces have a fractal dimension of 2.4 to 2.6, and a characteristic factor of less than 1 × 10⁻⁹ m.

1. Introduction

Dynamic pressure seals are extensively utilized in the aerospace industry because of their excellent low leakage and non-contact properties [1,2,3]. During the start-up of a dynamic pressure seal, the seal end-face gradually transitions from a contact state to a non-contact state. This transition leads to an increase in seal leakage and a decrease in the sealing performance if there is improper design or significant machining errors. In severe cases, static leakage may occur, significantly impacting the seal’s operational lifespan [4,5,6]. Therefore, the study of the performance of the dynamic pressure seal start-up process is very important.
The dynamic and static leakage rates of the seal are important performance indices of the dynamic pressure seal. In order to reduce the increase in the dynamic leakage rate caused by external interference, Park [2], Su [7], and Yin [8] obtained the optimized structure of the seal. This structure can maintain a stable dynamic film thickness and lower leakage rate through numerical analysis. On this basis, Zhang [3], Wang [9], and Hu [10] considered the influence of the dissolution effect, cavitation effect, and phase change characteristics of the sealing medium on the dynamic sealing performance of dynamic pressure seals. They established a variable physical properties analysis model for dynamic pressure seals, which enabled the accurate prediction of the dynamic leakage rate of dynamic pressure seals. Compared with the dynamic sealing performance, the static sealing performance of dynamic pressure seals is also important [11,12]. However, due to the discontinuity of the flow field in the static sealing gap of dynamic pressure seals, the analysis of the static leakage rate of dynamic pressure seals becomes significantly more challenging. In order to analyze the leakage characteristics of the discontinuous flow field, many scholars have developed a static leakage model of the contact seal based on fractal theory. Hossain [13] conducted a static leakage study on the axial leakage of the contact seal, while Cui [14] introduced a porous medium in the model to enhance the calculation accuracy. Yang [15] considered the effect of the asperities deformation on the leakage rate of the contact seal and further optimized the static leakage model. These studies have established a theoretical foundation for analyzing the static sealing performance of dynamic pressure seals. Li [6] and Bai [16] found that the dynamic leakage rate of the dynamic seal increased significantly compared to the static leakage rate through experimental study. This indicates the importance of analyzing the evolution of sealing performance during the start-up process of the dynamic pressure seal. In order to analyze the evolution of the sealing performance during the start-up process of a dynamic pressure seal, Chen [17] and Li [18] analyzed and calculated the opening force during the start-up of the seal using numerical analysis based on the assumption of critical film thickness, and found that there are obvious stage changes in the start-up process. On this basis, many scholars have found that the shallow groove structure on the end-face of the dynamic pressure seal significantly influences the evolution of the seal-opening process performance [19,20,21,22]. However, the calculation accuracy based on the assumption of critical film thickness is low. In order to enhance the accuracy of performance analysis during the start-up process of the dynamic pressure seal, Fan [23] incorporated the traditional GW contact model into the calculation of the contact force of the dynamic pressure seal, and found that the microscopic characteristics of the rough end-face have a significant influence on the sealing characteristics during the seal start-up process. However, only the elastic deformation of the asperity was considered in the analytical process. According to the current study, it is known that the contact deformation of the asperity includes elastic-plastic deformation and complete plastic deformation in addition to elastic deformation [24]. In order to analyze the elastic-plastic deformation of the asperity, A. Majumdar [25] firstly established the MB model, which can describe the elastic-plastic contact fractal model based on the WM fractal function. On this basis, L. Kogut [26] found that the elastic-plastic deformation can be divided into first-order elastic-plastic deformation and second-order elastic-plastic deformation by numerical analysis. They derived fitting equations for the contact force at each deformation stage of the asperity. In order to calculate the specific number of the asperities on the end-face in different stages of deformation, Yuan [27] and Zhang [28,29] introduced a frequency index to characterize the number of the asperities on the end-face in different stages of deformation based on the KE contact model. However, they were unable to characterize the distribution of the end-faces of the micro-convex bodies. The fractal functions used in the above studies are two-dimensional functions, which cannot adequately characterize the rough end-faces of the dynamic seal end-faces. Additionally, the analysis process does not consider the effect of thermal deformation of the asperity.
In order to solve the problem that the existing fractal characterization of seal end-face cannot describe the distribution of the asperities, this paper establishes an analytical model for the performance evolution of seals during start-up based on the characterization of three-dimensional fractal functions of the end-face and the thermoelastic deformation of the asperity. The aim of the model is to analyze the evolution of seal performance during start-up and to explore the influence of fractal parameters and end-face micro-features on the evolution mechanism of seal performance. The aim is to provide theoretical guidance for the structural design and daily maintenance of dynamic pressure seals.

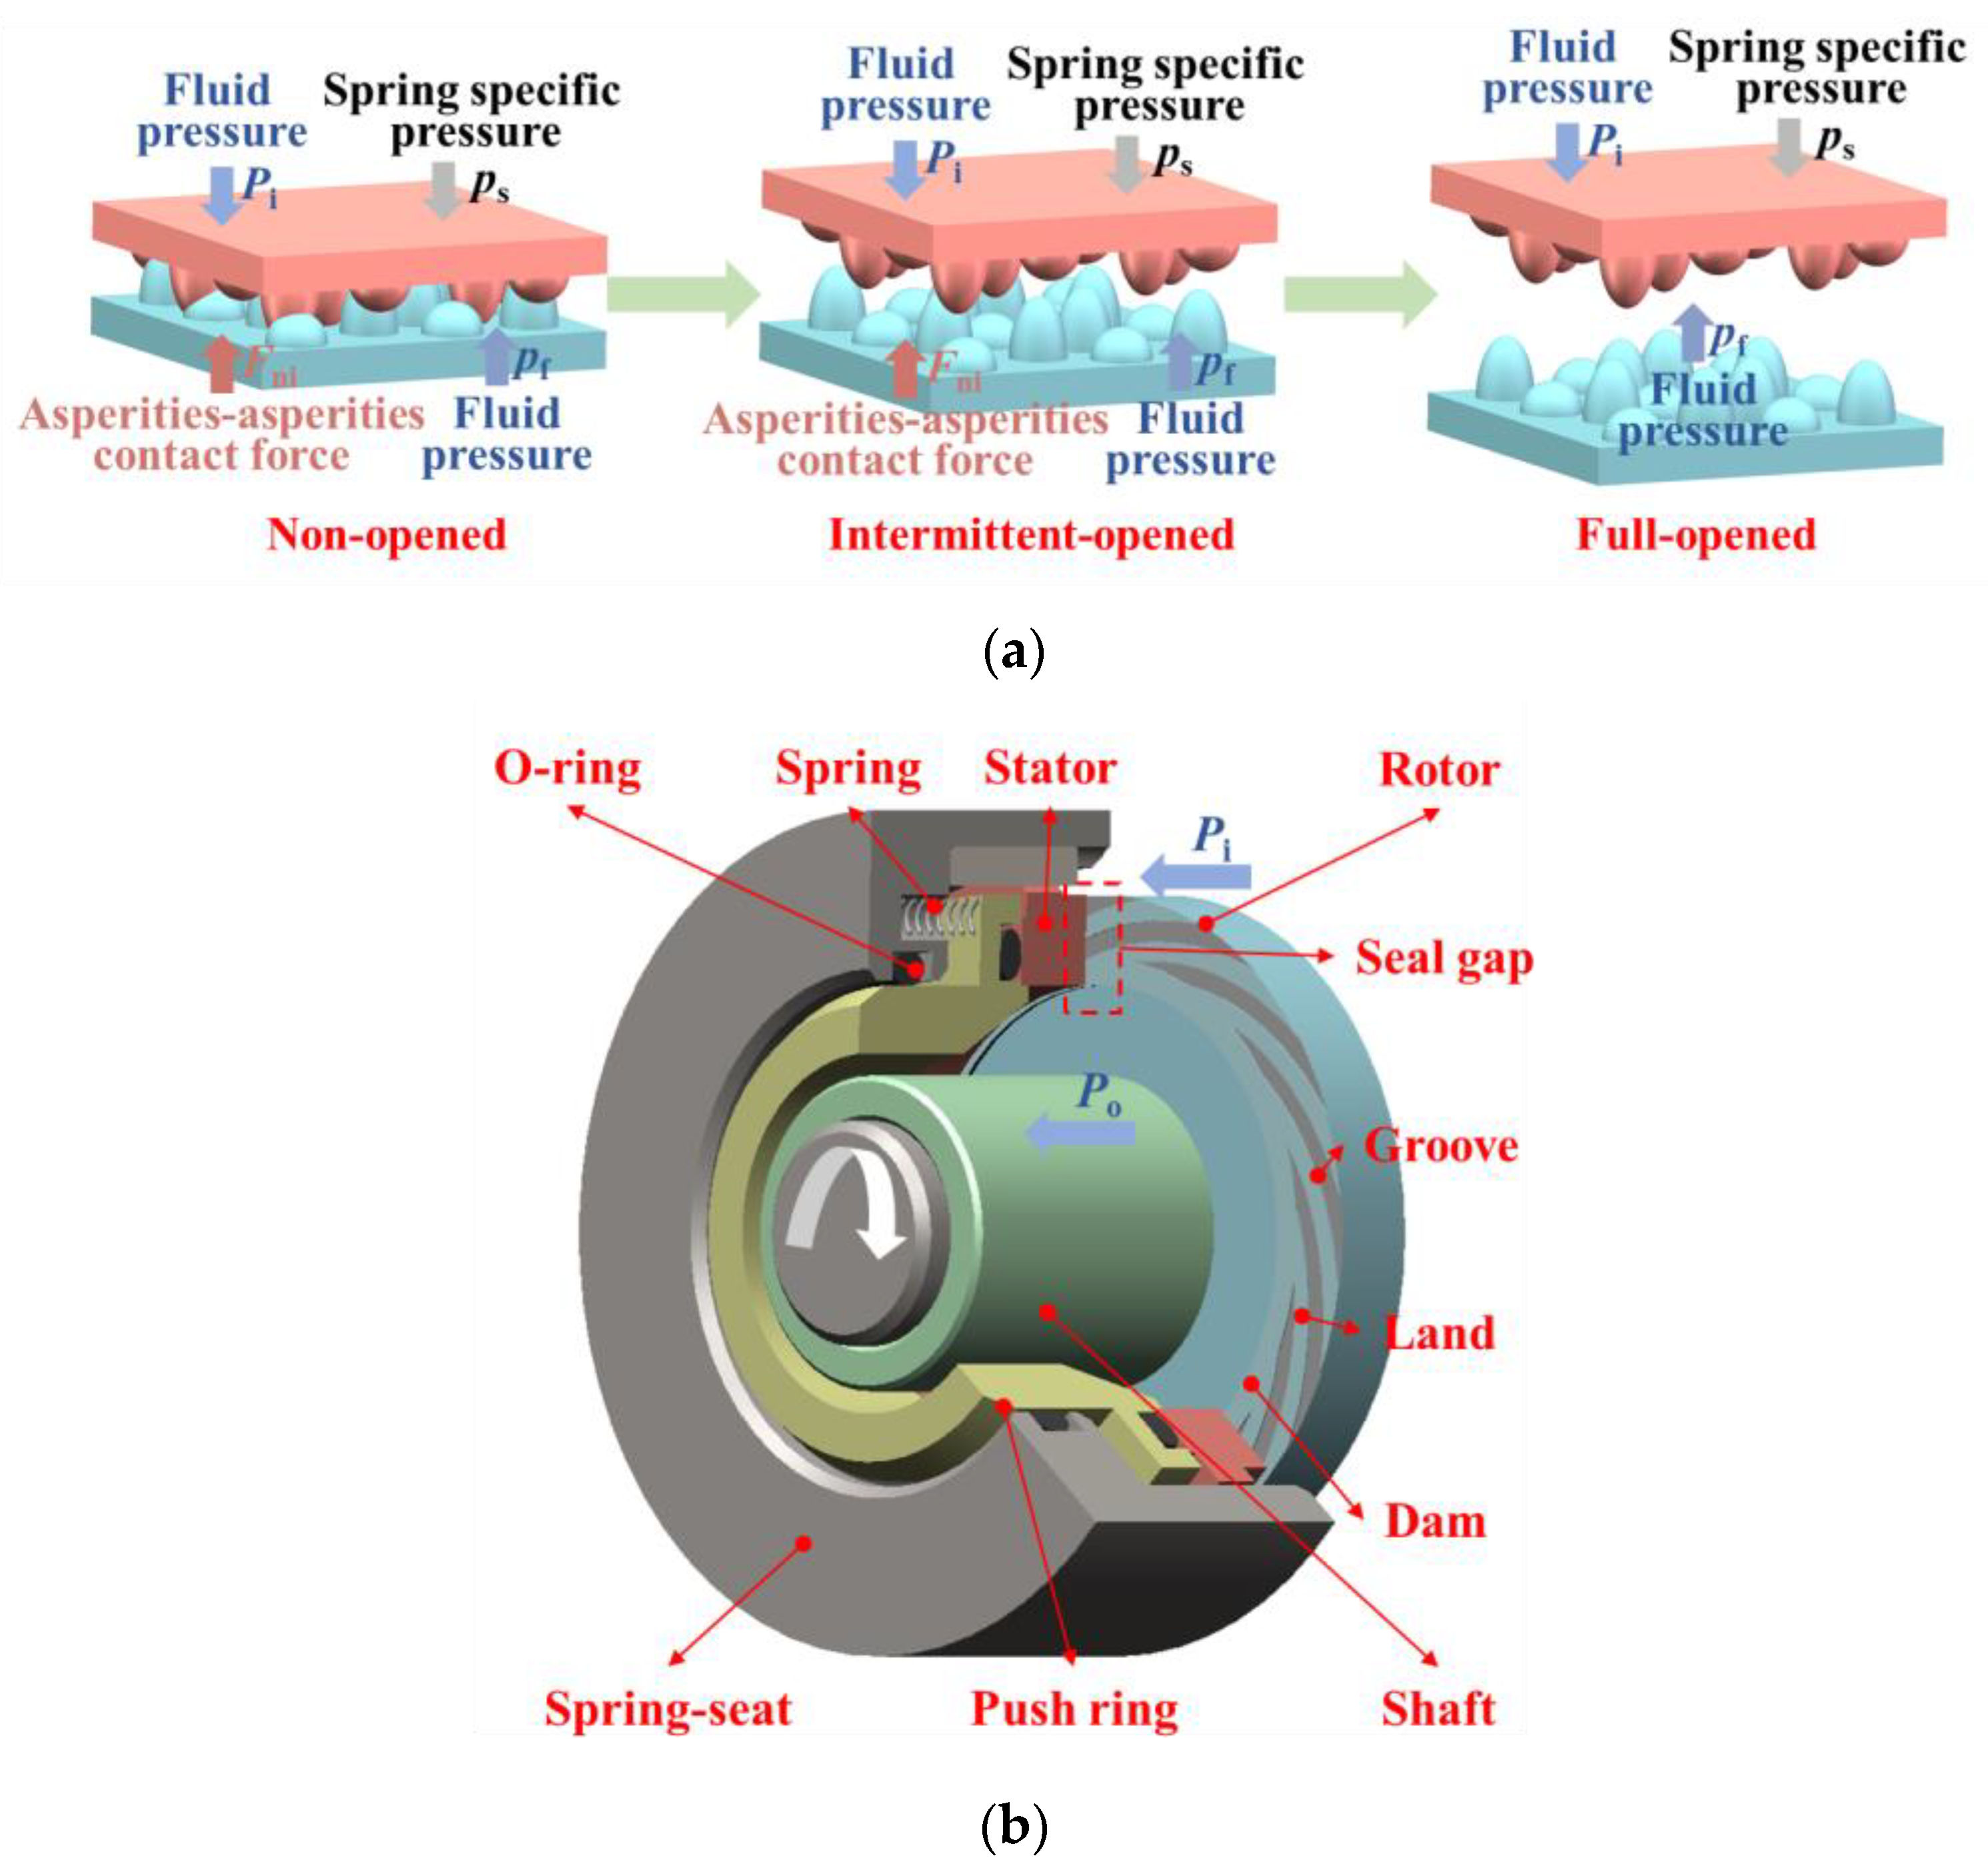
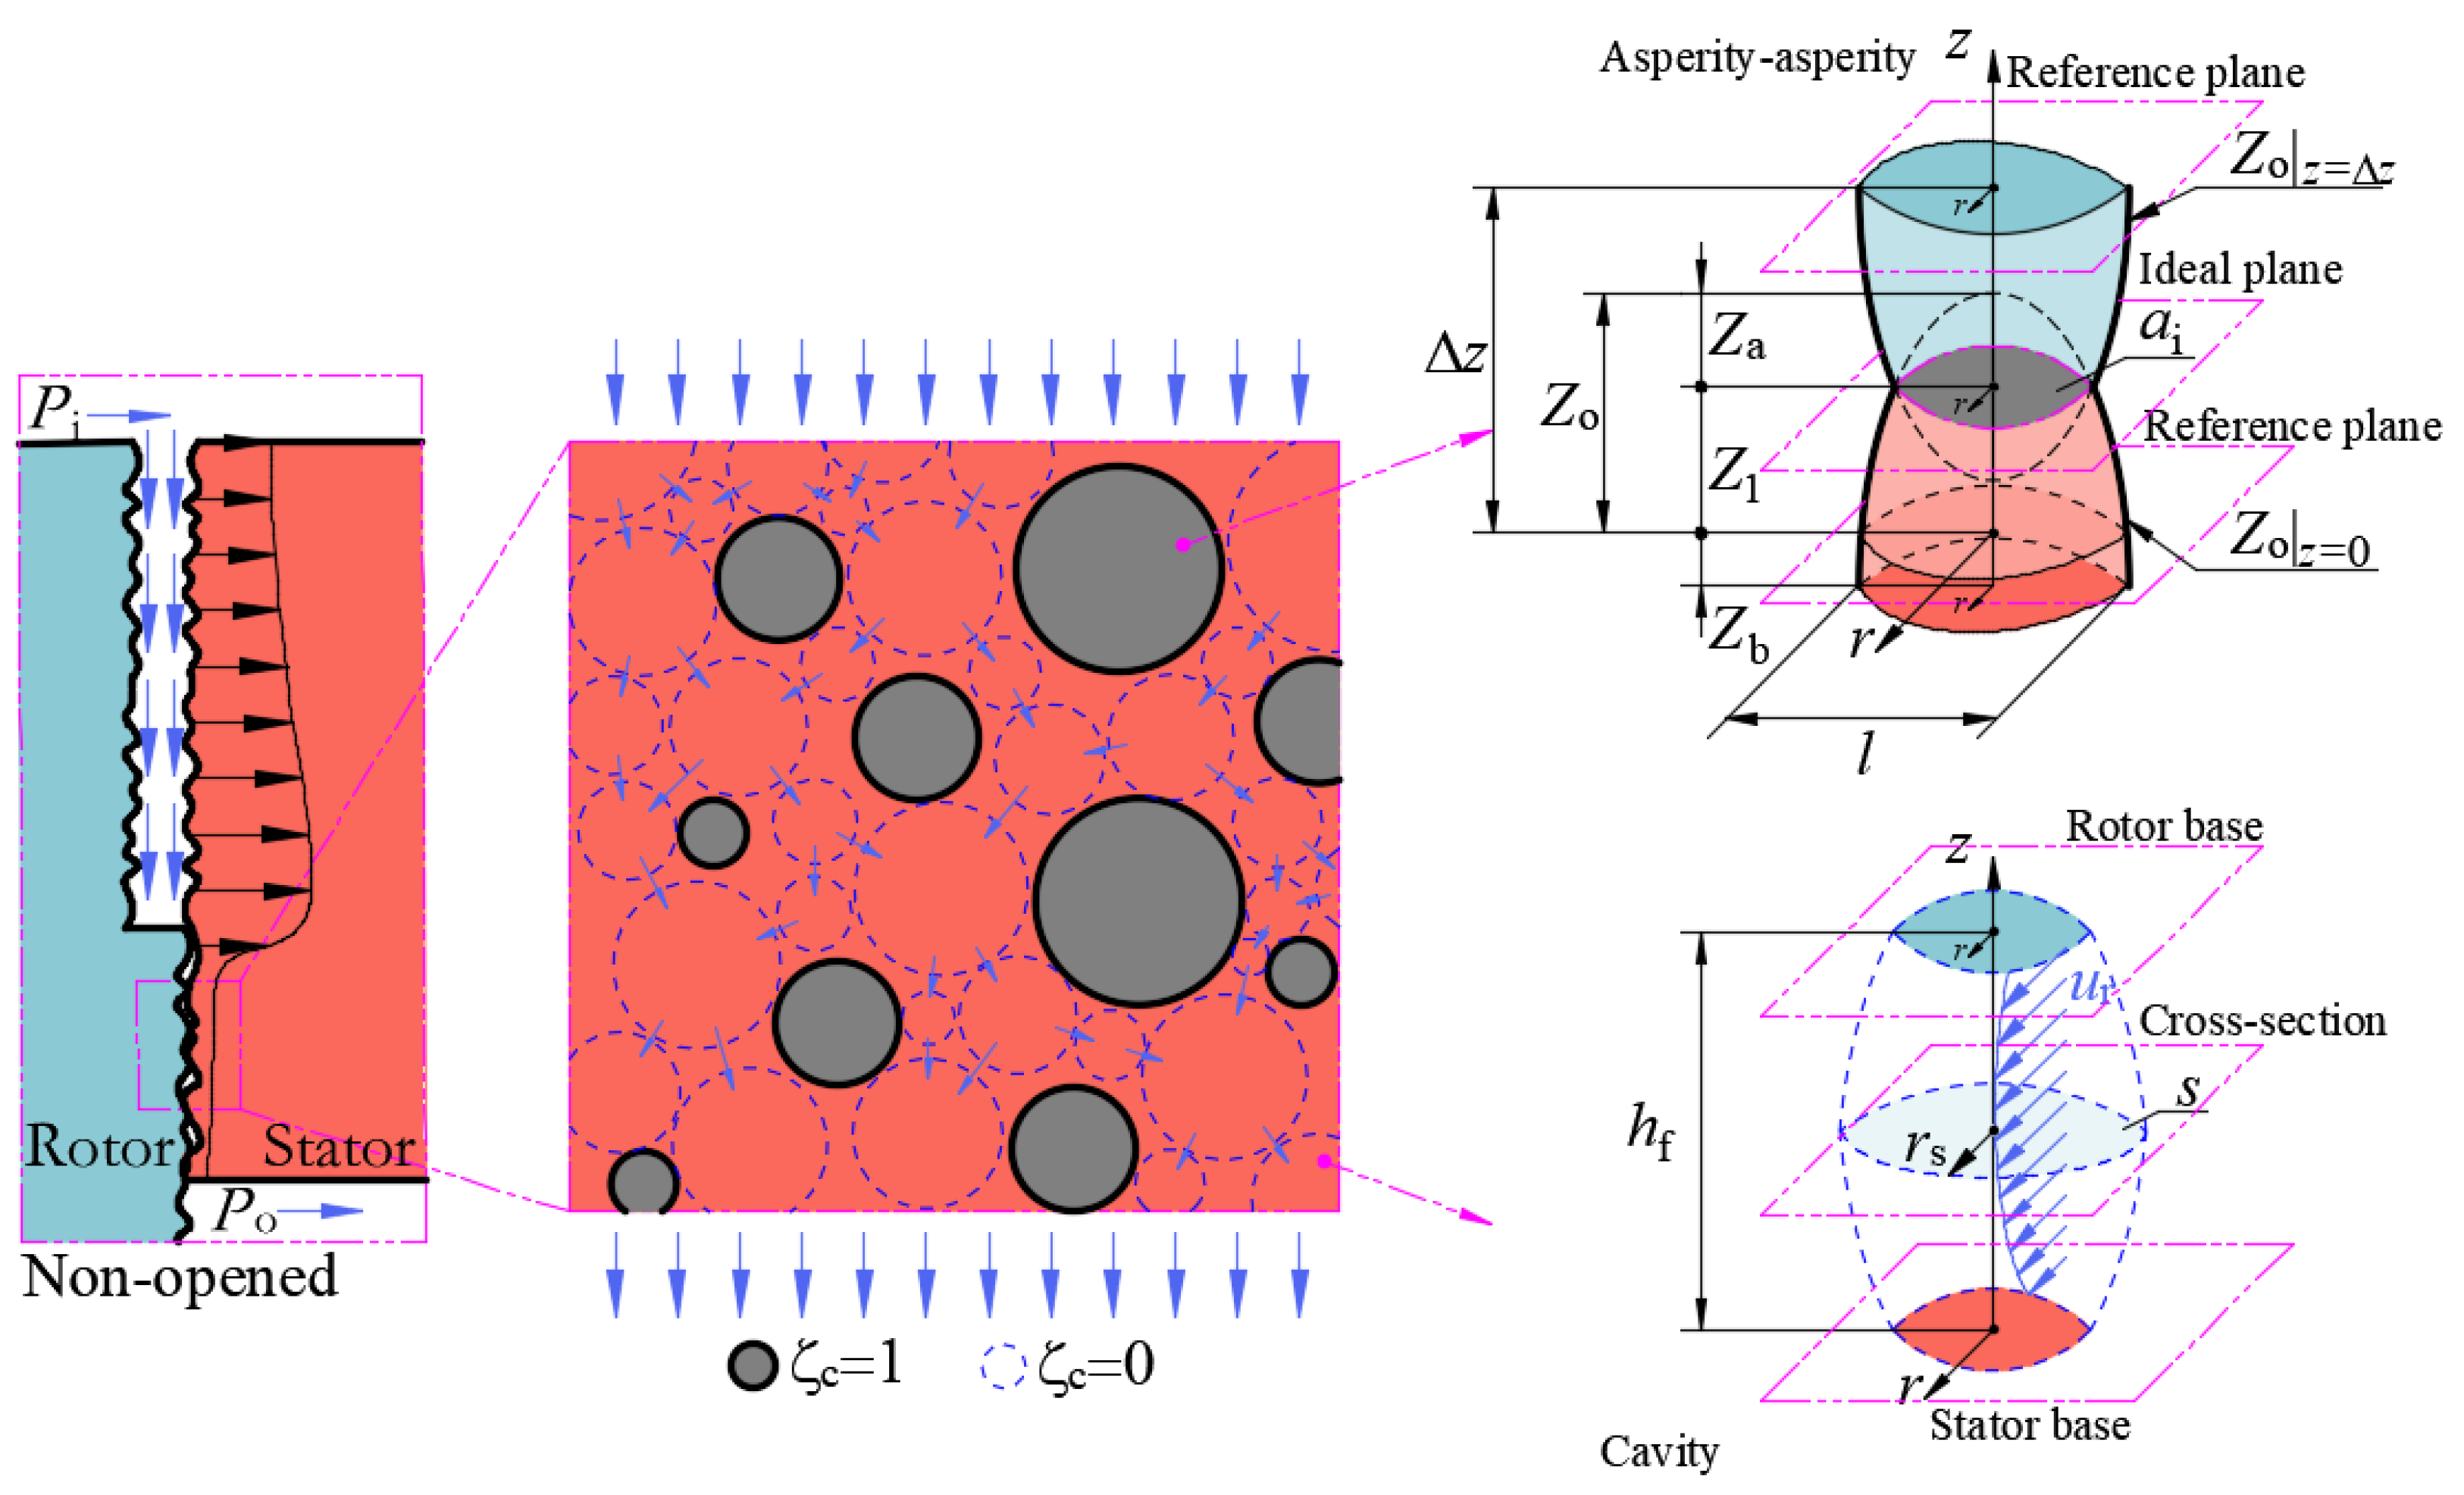
2. Dynamic Pressure Seal Structure and Sealing Principle

A dynamic pressure seal consists mainly of a rotor, stator, auxiliary seal, spring, and other components. The end-face of the rotor has a set of 12 evenly distributed spiral grooves along the line of rotation, as shown in Equation (1). When the rotor is in a stationary position relative to the stator, the asperities of the end-faces are squeezed against each other to form small discretely distributed cavities. The gas flows in through the outer side of the sealing gap, then into the cavities, and finally out through the inner side of the sealing gap. When the rotor and stator move relative to each other, the rotor forces the gas in the cavities and spiral grooves to flow, converting the kinetic energy of the gas into potential energy. As a result, the force to open the sealing gap increases until the gap is fully open, allowing the dynamic pressure seal to operate without contact, as shown in Figure 1. The structural parameters of the seal ring studied in this paper are taken according to the conventional design of a typical dynamic seal structure, and the physical parameters of the seal ring and the sealing medium are referred to the physical parameter curves in the references [30,31,32]. The parameters of the seal are shown in Table 1.
r = r g e β tan α .

3. The Model for the Evolution of Seal Performance during Seal Initiation

3.1. Asperity-Asperity Thermoelastic-Plastic Contact Deformation Analysis

The microscopic features of the seal ring material surfaces are similar and can be described using the three-dimensional WM fractal function [29,33]. The function is as follows:
Z o = L ( G L ) D 2 ( ln γ M ) 1 / 2 C = 1 C = 100 n min n max γ ( D 3 ) n { cos ϕ m , n cos [ 2 π γ n r 2 L cos ( θ π m M + ϕ m , n ) ] }
In Formula (2), Z o is the surface profile before deformation, G is the characteristic scale factor, D ( 2 < D < 3 ) is the three-dimensional fractal dimension, L is the sample length, (in general, L = 0.8 mm ), γ is the spectral correlation constant (in general, γ = 1.5 ), C is the number of overlapping surface cycles, ϕ m , n is the random phase angle, rad, n is the frequency index, n min is the minimum frequency, n min = lg L / lg γ , n max is the maximum frequency, n max = int [ lg L / lg γ lg L s / lg γ ] , and L s is atomic spacing of materials [28], (in general, L s = 0.34 nm ).
The asperity of the end-faces can be regarded as a semi-ellipsoidal sphere. It is assumed that the contact surfaces of the asperity on the end-faces of the rotor and stator are parallel surfaces. The asperity-asperity contact model is simplified to asperity-ideal plane-asperity contact models, which can be solved using the KE model (sphere-ideal plane contact model). It only takes into account the asperity subjected to axial load. The assumption is that the asperity and the base both experience thermal deformation due to axial thermoelastic deformation, as shown in Figure 2.
According to Newton’s third law, the contact force on the asperities at the end-face of the rotor, and the asperity at the end-face of the stator are equal in magnitude and opposite in direction, so it is sufficient to calculate the contact force on the asperities body at the end-face of the stator. Then, the critical deformation Zac, the critical contact force F ic , and the critical contact area a ic of the asperity are calculated according to the KE model [26,27,28,29] as follows:
{ Z ac = 2.46 π 2 G 2 3 D 2 l 2 D 2 2 ( 0.454 + 0.41 ν 2 ) 2 E c 2 H 2 2 F ac = 5.16 π 4 G 2 6 2 D 2 l 2 2 D 2 4 ( 0.454 + 0.41 ν 2 ) 3 E c 2 H 2 3 a ac = 7 . 74 π 4 G 2 6 2 D 2 l 2 2 D 2 4 ( 0.454 + 0.41 ν 2 ) 3 E c 2 H 2 2
In Formula (3), l 2 is the diameter of the base of the stator end-face [29], l 2 = Z o 2 1 / ( 3 D 2 ) G 2 ( 2 D 2 ) / ( 3 D 2 ) , and Z o 2 is the roughness profile of stator end-face ( Z o 2 = Z o ( D 2 , G 2 , r , θ ) ), and E c is the contact modulus of elasticity [26], E c 1 = ( 1 ν 1 2 ) E 1 1 + ( 1 ν 2 2 ) E 2 1 .
In addition to elastic deformation, there are also elastic-plastic and plastic deformations in the deformation stages of the asperity. By comparing the interference between the asperity and the ideal plane with the critical deformation amount of the asperity, it is possible to differentiate between the elastic deformation ( 0 < ( Z a 2 + Z b 2 ) / Z ac < 1 ), elastic-plastic deformation ( 1 ( Z a 2 + Z b 2 ) / Z ac < 6 , 6 ( Z a 2 + Z b 2 ) / Z ac < 110 ), and plastic deformation ( ( Z a 2 + Z b 2 ) / Z ac 110 ) of the asperity. Subsequently, the contact force and contact area of the asperity can be calculated at different deformation stages [26,27,28,29].
F ni = { F ac , 0 < ( Z a 2 + Z b 2 ) / Z ac < 1 1.03 F ac ( Z a 2 + Z b 2 ) 1.425 Z ac 1.425 , 1 ( Z a 2 + Z b 2 ) / Z ac < 6 1.40 F ac ( Z a 2 + Z b 2 ) 1.263 Z ac 1.263 , 6 ( Z a 2 + Z b 2 ) / Z ac < 110 π 1 G 2 3 D 2 l D 2 2 H Z a 2 , ( Z a 2 + Z b 2 ) / Z ac 110  
a i = { a ac 0.93 a ac ( Z a 2 + Z b 2 ) 1.136 Z ac 1.136 0.94 a ac ( Z a + Z b ) 1.146 Z ac 1.146 2 a ac , 0 < ( Z a 2 + Z b 2 ) / Z ac < 1 , 1 ( Z a 2 + Z b 2 ) / Z ac < 6 , 6 ( Z a 2 + Z b 2 ) / Z ac < 110 , ( Z a 2 + Z b 2 ) / Z ac 110
In Formulas (4) and (5), Za2 is the contact deformation of the stator end-face, Z a 2 = Z o 2 ( 1 + α 2 Δ T Z o 2 ( Z o 1 + Z o 2 ) 1 Δ z ) , Z o 1 is the roughness profile of the end-face of the rotor ( Z o 1 = Z o ( D 1 , G 1 , r , θ ) ), Z b 2 is the base deformation of the stator end-face, α 2 is the coefficient of thermal expansion of the stator, and Δ T is the temperature difference between the end-faces and the environment.
According to Equations (4) and (5), the contact load and area of a single asperity can be calculated. Subsequently, the axial load and area on the basal area of each asperity where the contact deformation occurs can be determined. Integration is then performed to obtain the contact force F n and the specific pressure of the end-face p c .
In the calculation of the contact force and the specific pressure, a contact factor ζ c is introduced in order to distinguish between contact and non-contact regions.
ζ c = { 0 , h f 0 1 , h f = 0
{ F n = 0 2 π r i r o ζ c 4 F ni π l 2 2 r d r d θ p c = 0 2 π r i r o ζ c 4 F ni π a i l 2 2 r d r d θ
The outer side of the rotor is subjected to fluid pressure P i , the back side of the stator is subjected to fluid pressure P i and the pressure of the spring p s , and the inside of the stator is subjected to fluid pressure P o . The rotor is limited to axial and radial displacements by shaft and sleeve. The stator is limited to radial displacements by spring and seat. When the end-faces are pressed together, the contact deformation of the asperities generate contact force F n . The fluid pressure p f in the sealing gap is confined to the opening force F o . The closing force F c on the seal is mainly composed of spring force and fluid pressure.
F c = π [ ( P i + p s ) ( r o 2 - r e 2 ) + P o ( r e 2 - r i 2 ) ]
In Formula (8), P i is the inlet pressure, p s is the spring specific pressure, and r o , r i , and r e are the structural parameters of the seal.

3.2. Thermoelastic Deformation Analysis of the Bases

According to Equations (4) and (5), it can be seen that the deformation of the substrate has impact on the calculation of the contact force of the asperity. According to the theory of elastic mechanics, the axial thermo-elastic deformation of the base can be calculated using the following Formula (9) [21].
{ Z b 1 = [ α 1 Δ T ζ c 4 F ni π l 1 2 E 1 ( 1 ζ c ) p f E 1 ] B Z b 2 = [ α 2 Δ T ζ c 4 F ni π l 2 2 E 2 ( 1 ζ c ) p f E 2 ] B
In Formula (9), Z b 1 is the deformation of the rotor base, and Zb2 is the deformation of the stator base, l 1 is the diameter of the base of the stator end-face [29], l 1 = Z o 1 1 / ( 3 D 1 ) G 1 ( 2 D 1 ) / ( 3 D 1 ) , and p f is the fluid pressure.
The heat transfer between the rotor and the fluid is a strong convective heat transfer. In contrast, the heat transfer between the stator and the fluid is a weak convective heat transfer [19]. The heat sources at the seal end-face are mainly the shear heat of the fluid and the frictional heat of the asperities. The heat transfer equation for the ring is as follows:
T t + x ( T x ) + y ( T y ) + z ( T z ) = 0
The thermal boundary parameters can be calculated according to the Equation (11) [19].
{ q 1 = π n r r f F ni ( 1 r f ) 60 a i q 2 = π n r r f F ni r f 60 a i h 1 = 0.0675 λ f r R [ ( u θ r R ρ f 2 μ f ) 2 + ( 2 u z r R ρ f μ f ) 2 ] 1 / 3 ( μ f C f k f ) 1 / 3 h 2 = 0.105 λ f Δ δ [ π n r r R Δ δ ρ f 60 μ f ( Δ δ r R ) 1 / 2 ] 1 / 2 ( μ f C f k f ) 1 / 4
In Formula (11), h 1 is the coefficient of the strong convection heat transfer, h 2 is the coefficient of the weak convection heat transfer, Δ δ is the clearance between stator and shaft, r R is the outer diameter of the shaft, n r is the rotation speed, and f is the dry friction coefficient of the friction pair [31,32], f = 0.4 .
r f is the heat distribution coefficient.
r f = [ 1 + ( ρ 1 C 1 λ 1 ) 1 / 2 ( ρ 2 C 2 λ 2 ) 1 / 2 ] 1

3.3. Microfluidic Characterization of Thin Films with Sealing Gaps

The roughness profile after the deformation of the end-faces can be calculated from the original profile, the deformation of the asperities, and the deformation of the bases [29].
{ Z 1 = Z o 1 + Z a 1 + Z b 1 Z 2 = Z o 2 + Z a 2 + Z b 2
The asperity of the end-faces are extruded into each other to form cavities. The axial clearance of the cavities is shown as Equation (14).
h f = Δ z + h g ζ g Z 1 Z 2
In Formula (14), Δ z is the distance between the reference planes of the end-faces, ζ g is the area coefficient of the end-face ( ζ g = 0 for the non-groove area, ζ g = 1 for the groove area), Z 1 is the roughness profile of the rotor end-face, and Z2 is the roughness profile of the stator end-face.
The flow field in the sealing gap of the dynamic pressure seal can be described using the Reynolds equation [10].
r ( ρ f h f 3 12 μ f p f r ) + r θ ( ρ f h f 3 12 μ f p f θ ) = π n r 120 ( ρ f h f ) θ + ( ρ f h f ) t
In Formula (15), ρ f is the fluid density, and μ f is the fluid viscosity.
The energy equation about fluid in the sealing gap of the dynamic pressure seal is shown in Equation (16) [19].
T t + u r T r + u θ r T θ = k f ρ f C f [ 1 r r ( r T r ) + 1 r 2 2 T θ 2 + 2 T z 2 ] + μ f ρ f C f [ ( u θ z ) 2 + ( u r z ) 2 ]
In Formula (16), kf is the thermal conductivity of the fluid, C f is the specific heat capacity of the fluid, and u r , u θ are the radial and circumferential flow rate of the fluid.
The inlet pressure is 0.6 MPa, the outlet pressure is 0 MPa, the inlet temperature is 350 K, and the outlet temperature is 293.15 K. The flow rate of sealing gap fluid near the stator end-face is 0, and the flow rate of sealing gap fluid near the rotor end-face is uri. The opening force F o is obtained by integrating the pressure p f at the end-face, and the leakage Q is obtained by integrating the normal flow velocity u out at the outlet.
F o = 0 2 π r i r o p f ( 1 ζ c ) r d r d θ
Q = 0 2 π u out h f r i d θ
In Formula (18), u out is the normal flow velocity of the fluid on the outlet.

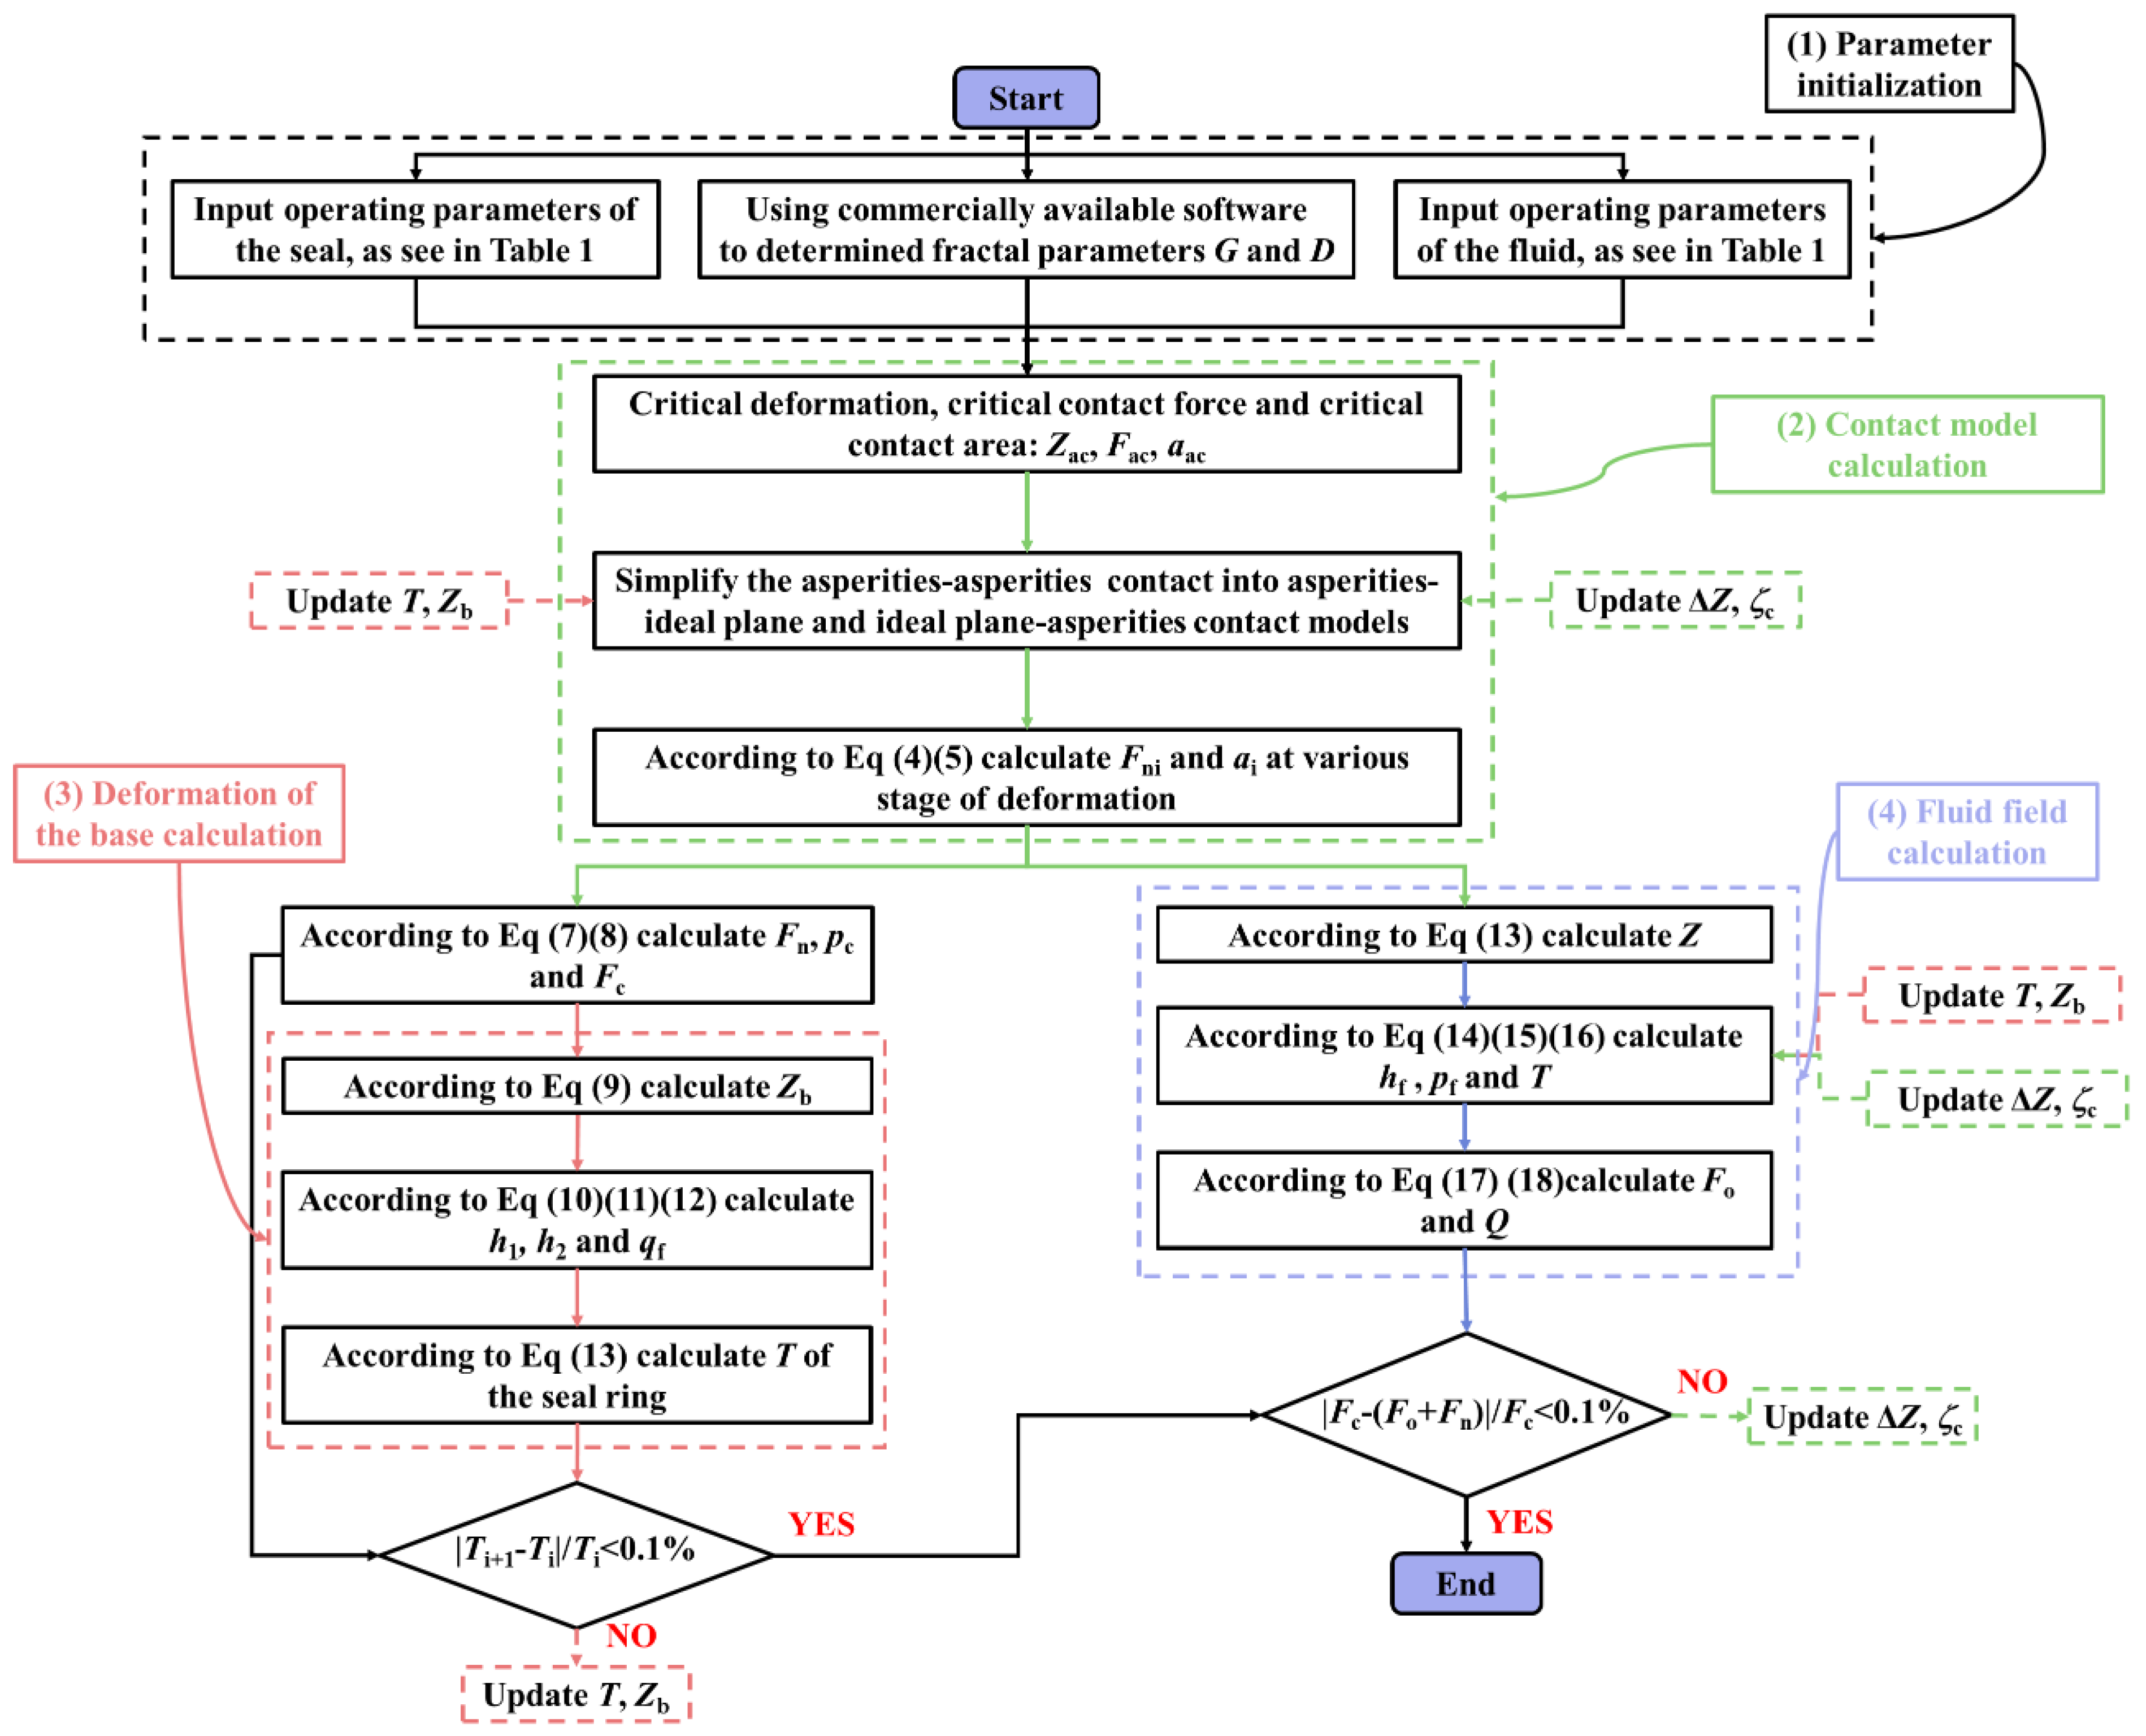
3.4. Coupled Analysis Process

Simulation software (COMSOL Multiphysics ® 5.6) was used to solve the above equations. It is assumed that there is no installation error of the dynamic pressure seal, and the disturbance caused by the deflection of the shaft during start-up is ignored. After verifying the mesh independence, the number of meshes is determined to be 654, with 135 to ensure the accuracy of the calculation. The solution process is shown in Figure 3. The accuracy of the model calculations was verified through experimental studies.

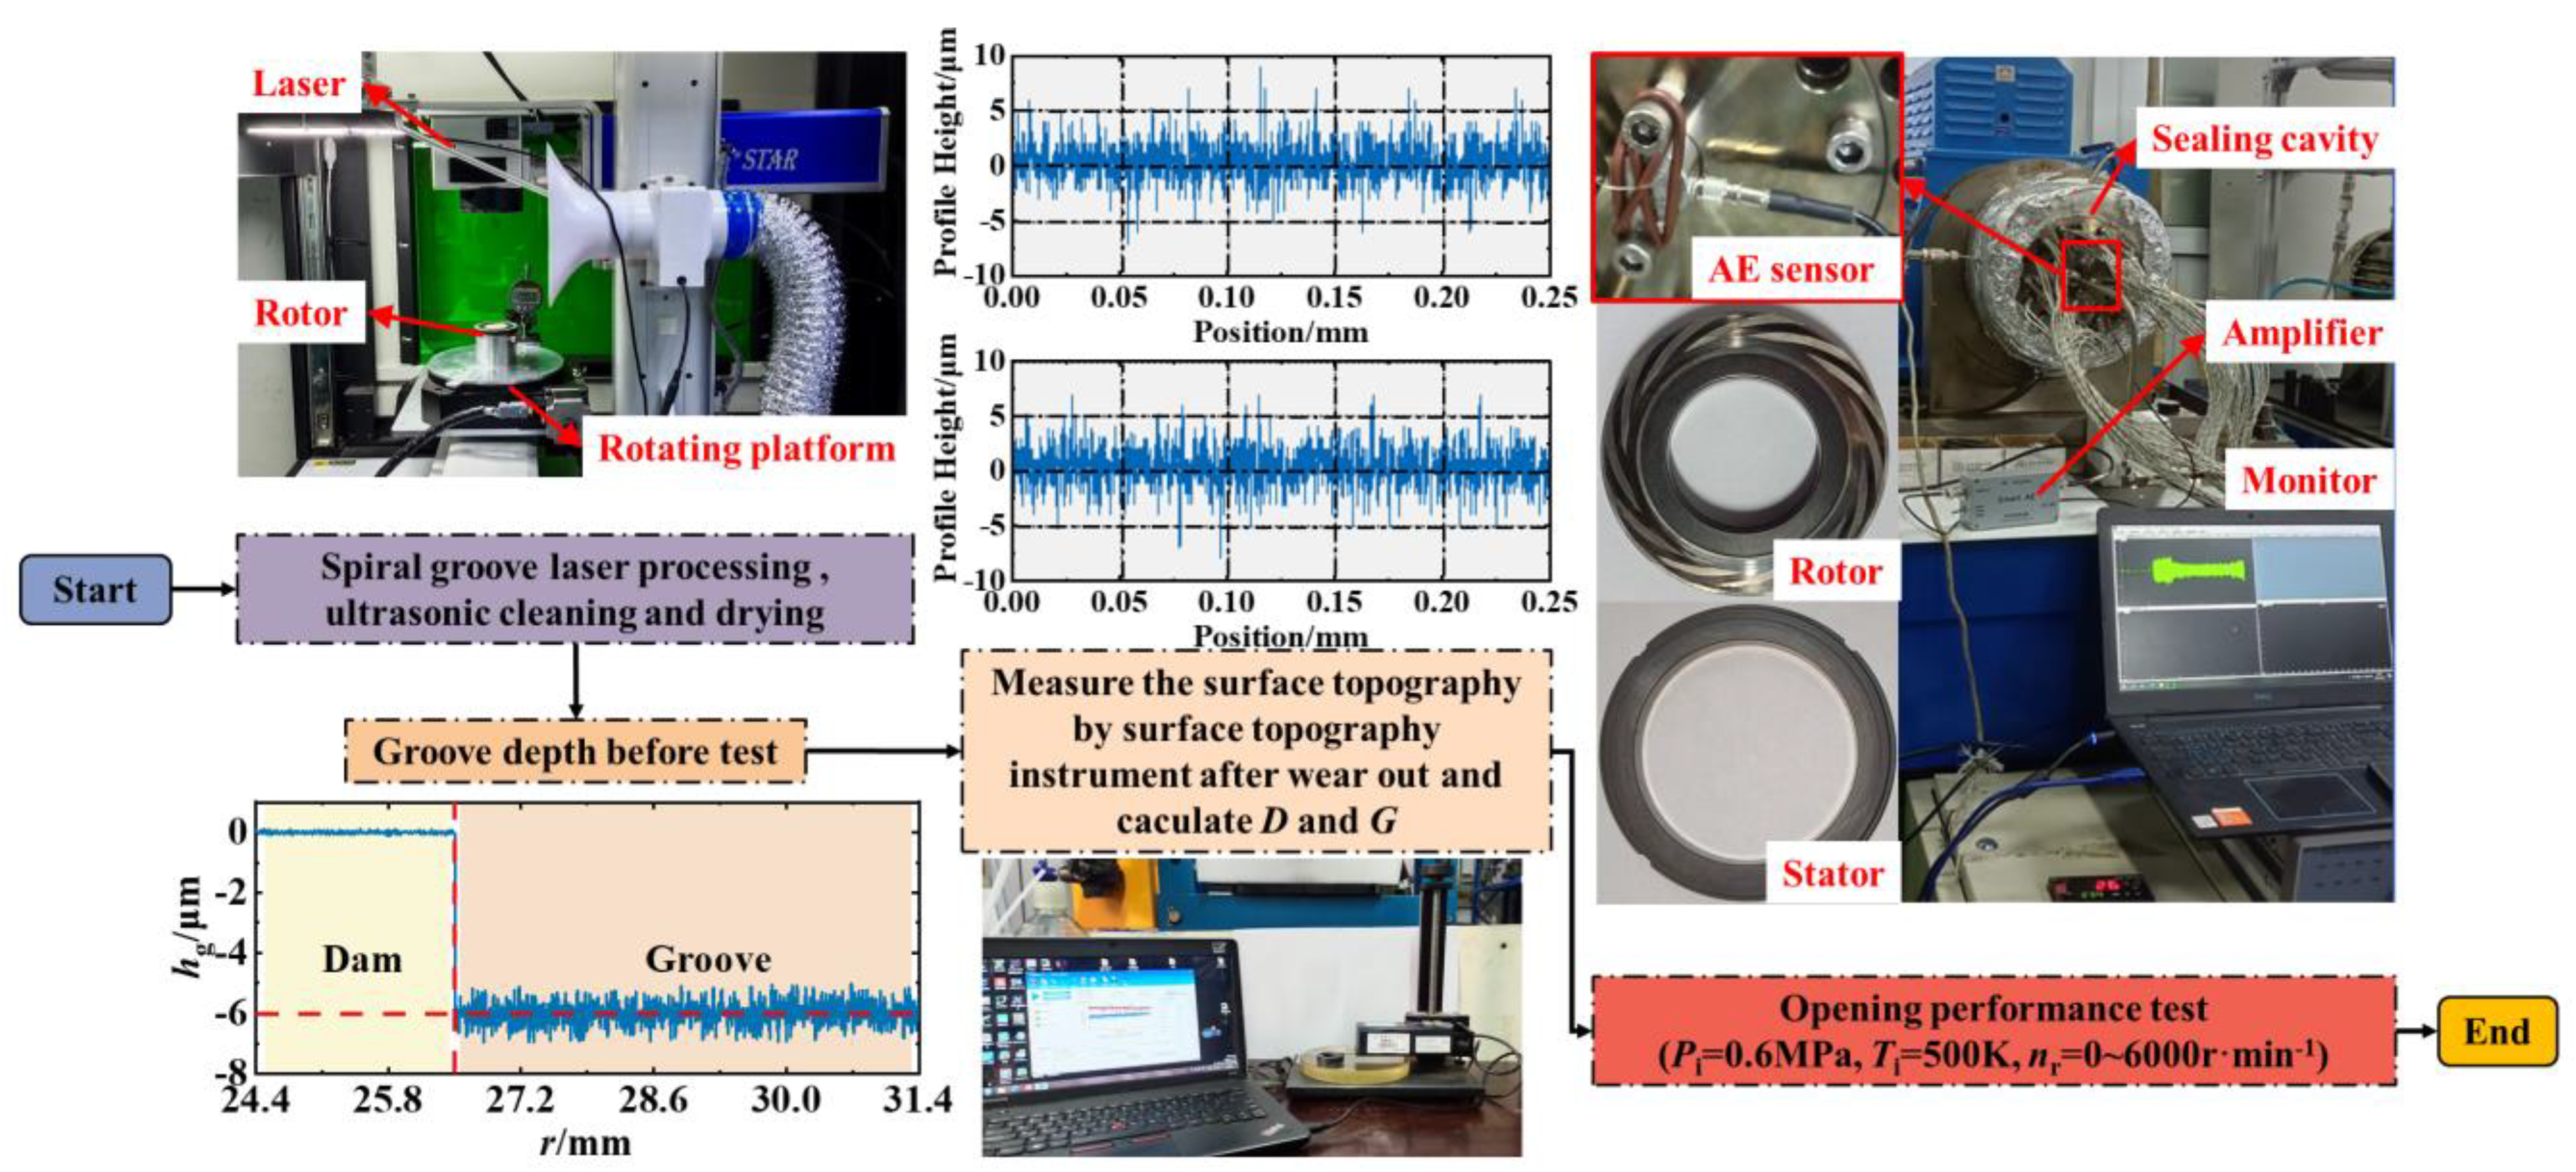
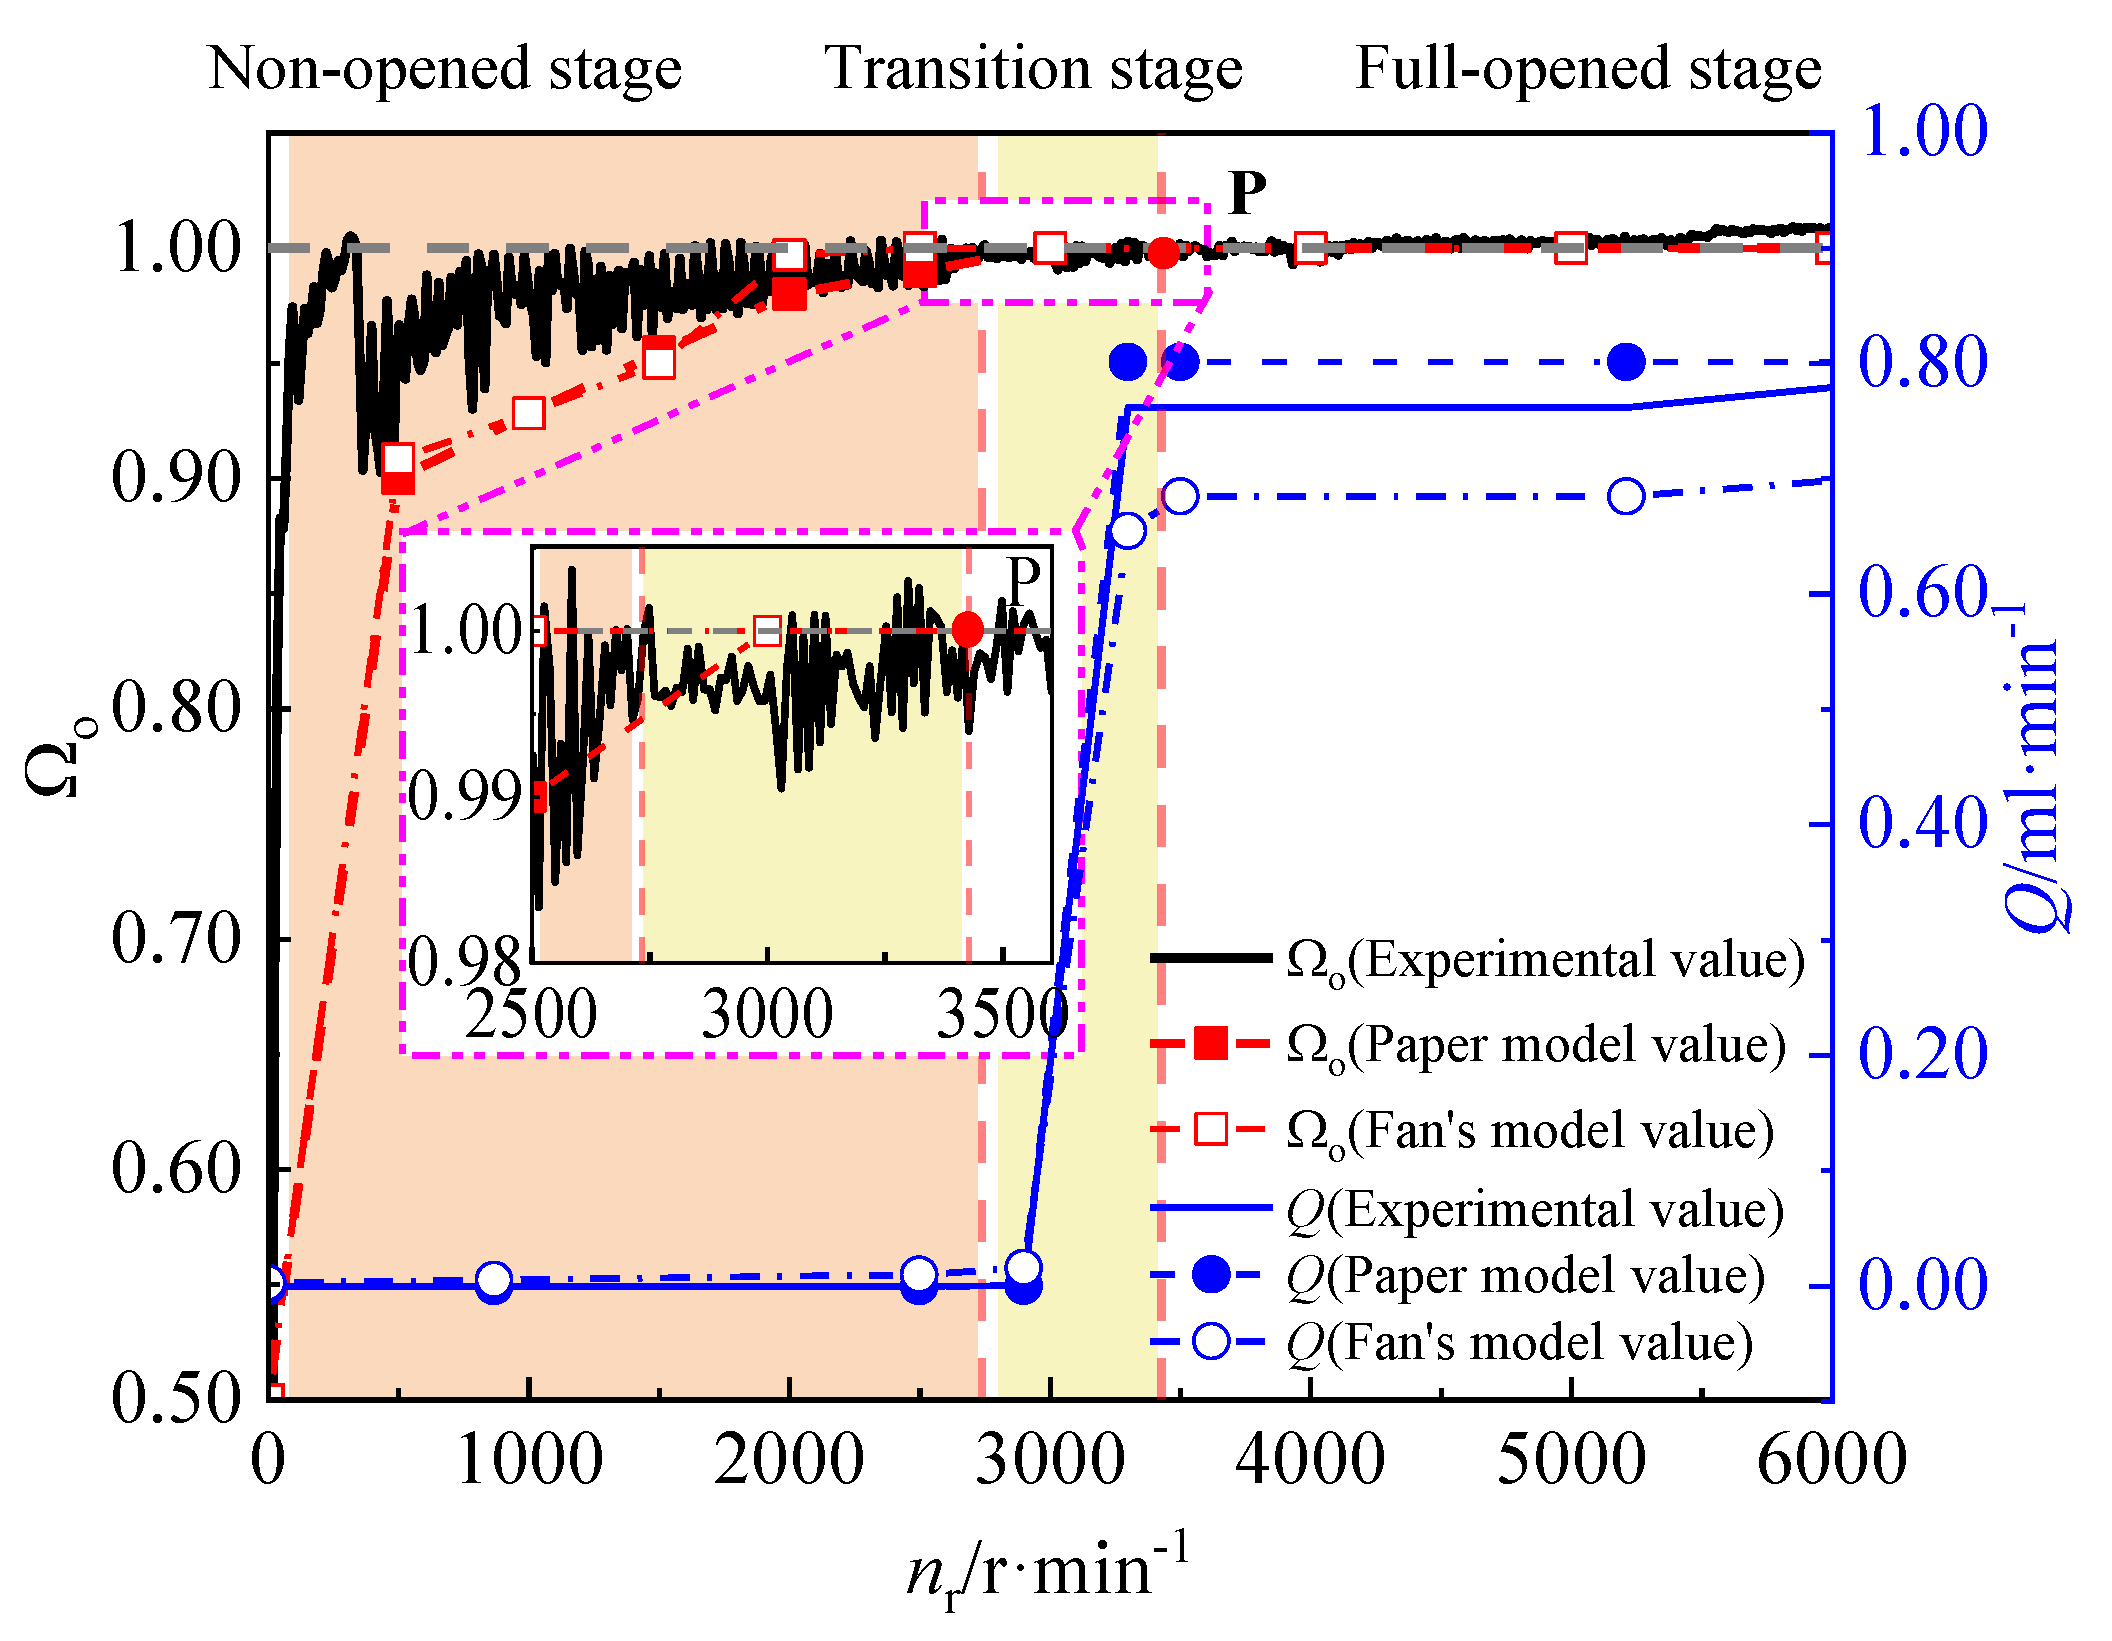
3.5. Model Validation

In order to experimentally verify the accuracy of the model calculations, the relevant experimental studies are conducted. The seal ring specimen is first ground to ensure that the flatness and finish of the seal end-face meets the general design requirements. On this basis, a shallow groove structure on the end-face of the moving ring was processed using laser etching technology, and the depth of the shallow groove was measured using the ARS2200 surface roughness measuring instrument. The sealing end-face of the sealing ring specimen was ground again. After cleaning, the roughness profile of the sealing end-face of the specimen was measured. The end-faces of the dynamic pressure seal can be characterized using the fractal function, and the three-dimensional fractal function of the friction ring generally has a fractal dimension value in the range of 2.2~2.8, and the characteristic coefficients generally take values in the range of 1 × 10 11 ~ 1 × 10 8 m [34]. In order to obtain accurate fractal parameters, three measurement points were uniformly selected in the circumferential direction of the end-face of the specimen using an ARS220 surface roughness measuring instrument (Beijing Times Guangnan Testing Technology Co., Ltd., Beijing, China), with a sampling length of 0.25 mm, to measure the local contour values of the end-face and to derive the fluctuation of the contour of the measured area using RC filtering method. The fractal dimensions and characteristic coefficients of the end-faces based on the structure function method [31]. The fractal dimension and the characteristic coefficients of the end-faces are shown as Table 2. The acoustic emission sensor can effectively characterize the opening characteristics of the seal during start-up [35,36]. A dynamic pressure seal test setup was constructed to measure the acoustic emission signals and leakage during seal initiation. Eventually, the prepared sealing ring specimen was mounted into the test chamber for the opening performance test. The test flow is illustrated in Figure 4.
During the start-up process, the end-faces change from a contact state to a non-contact state, and the collision between the asperities generate acoustic emission signals, which is related to the product of the non-circular contact force and the rotational speed as follows [37,38]:
U ˙ AE = f F n u ri K e 4
In Formula (19), K e is the conversion factor.
The ratio of contact force to closure force during the start-up of the dynamic pressure seal can be calculated according to the following Equation (20).
Ω n = F n F c = 4 ( U ˙ AE Δ U ˙ AE ) f u ri F c K e
In Formula (20), Δ U ˙ AE is the stabilized value of the acoustic emission at the end of the seal start-up, which was measured experimentally to be 0.045.
The sum of the contact force and the opening force at the seal end-face during seal start-up is equal to the closing force, then the ratio of the opening force to the closing force during seal start-up is:
Ω o = 1 Ω n = 1 4 ( U ˙ AE Δ U ˙ AE ) f u ri F c K e
During the start-up process, the trends in leakage is closely related to the opening state of the end-faces. The leakage trend is distinguished by three stages of end-face opening: the non-opened stage, the transition stage, and the full-opened stage. In the non-opened stage, as the rotational speed of the shaft increases from 0 to 2750 r min 1 , the leakage slowly increases by 22.56% from 1.10 × 10 3   mL min 1 , while the opening force ratio rapidly increases by 3.13 times from 0.48. In the transition stage, as the rotational speed of the shaft increases from 2750 to 3400 r min 1 , the leakage increases rapidly by 10.48 times, indicating that the seal gap is gradually opening at this stage. However, the change in the opening force of the seal decreases gradually to 4.23%. In the full-opened stage of the seal, the leakage and the opening force of the seal tend to stabilize, as shown in Figure 5.
Comparing the results of this model of the paper considering the rough end-face and the literature model [23] without considering the 3D rough end-face and the test results, it is found that the calculated values of the opening force and leakage have the same trend with the experimental values. The difference between the opening rotational speed calculated by this paper’s model and the test results is 11.76%, and the difference between the leakage calculated by this paper’s model and the test results is 2.56%. However, the difference between the opening rotational speed calculated by the reference model and the test results is 26.47%, and the difference between the leakage calculated by the reference model and the test results is 10.36%. The calculation accuracy of the opening speed and leakage volume of this paper’s model is 55.55% and 75.29% higher than that of the reference model, which further illustrates the accuracy of this paper’s analytical model, as shown in Figure 5.

4. Discussion

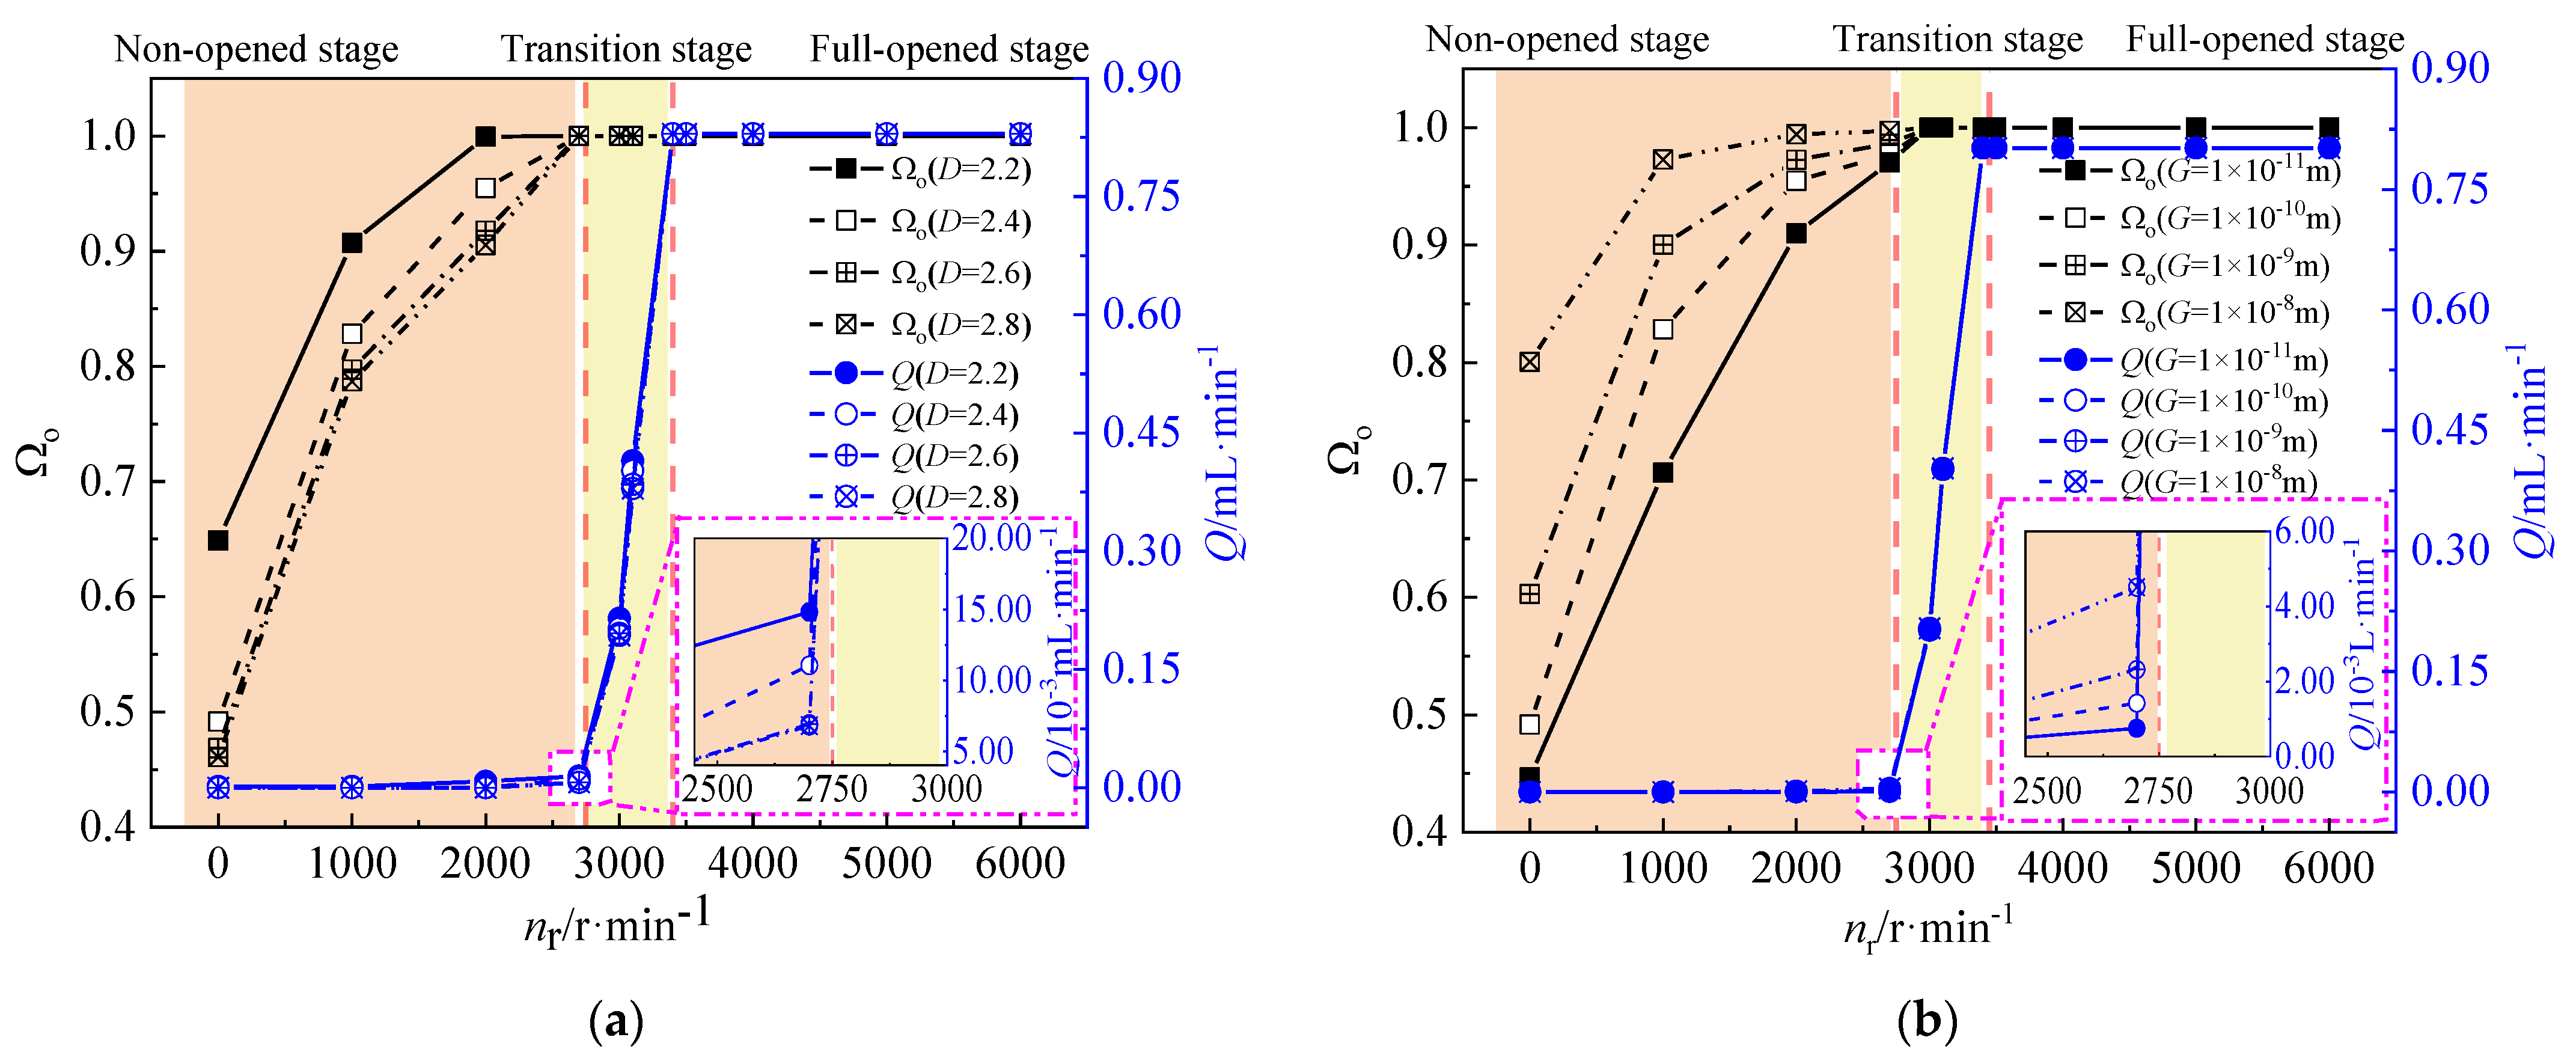
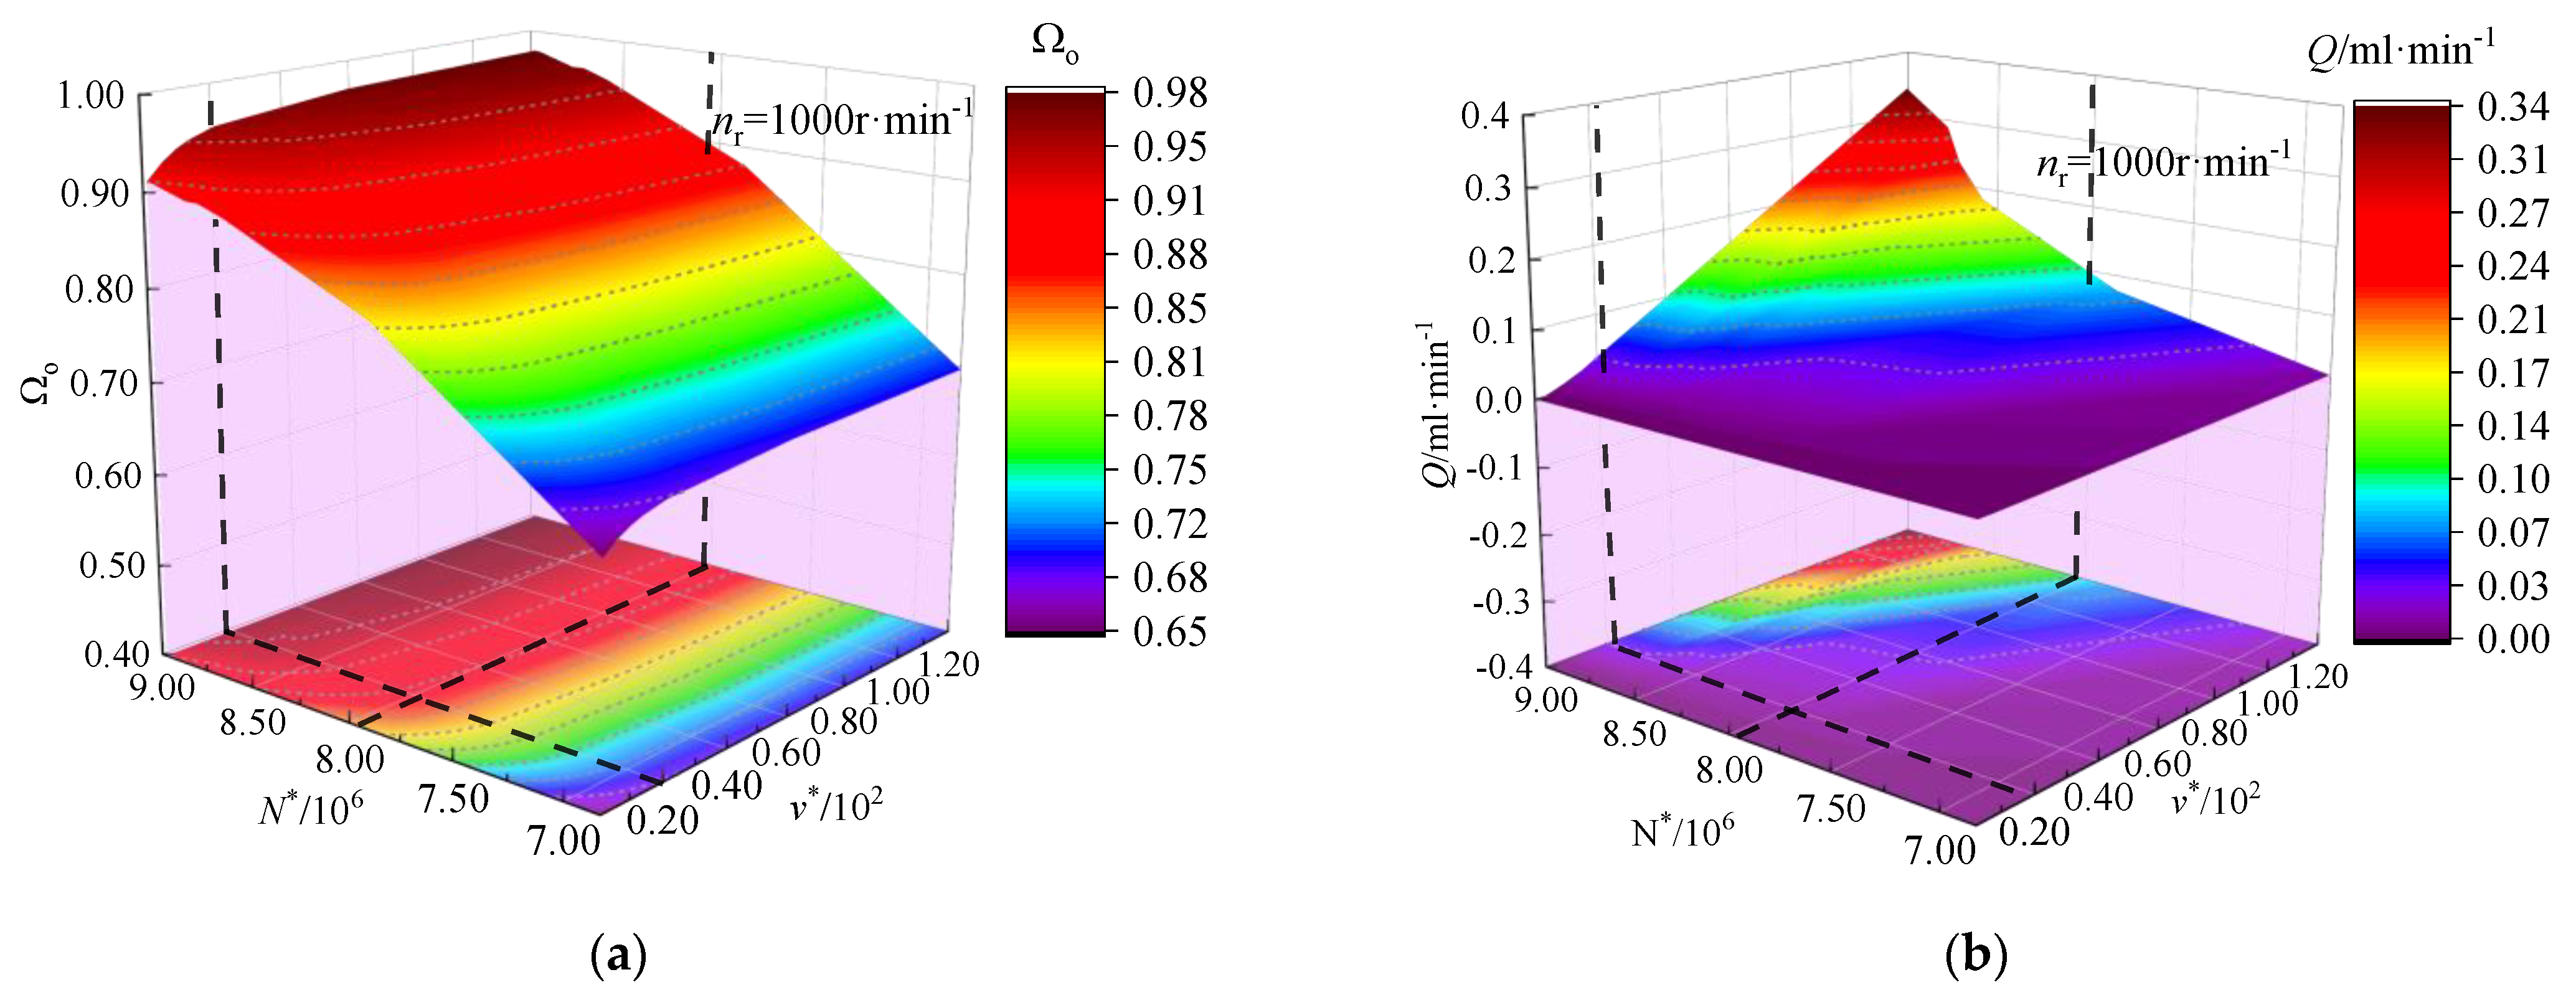
4.1. Effect of Fractal Parameters on the Sealing Performance during the Start-Up Process

The sealing gaps in the independent cavities are initially separate and gradually increase in the cross-sectional area. These independent cavities gradually connect with each other, leading to an increase in the air-carrying capacity within the cavities during the start-up process. Consequently, the sealing gaps expand gradually, resulting in an increase in the gas flow rate through the cavities, as shown in Figure 6.
As the fractal dimension increases from 2.2 to 2.6, the roughness of the end-face decreases. The opening force decreases by 28.88%, and the leakage decreases by 9.25%. With an increase in rotational speed of the shaft from 0 to 2700 R·min−1, the end-face gradually opens. The influence of the microscopic feature of the rough end-face on the opening force and leakage diminishes, with reductions of 50.45% and 45.90%, respectively, corresponding to the change in fractal dimension, as shown in Figure 7a. As the characteristic coefficient increases from 1 × 10 11 to 1 × 10 8 m, the end-face roughness increases. The opening force increases by 21.92%, and the leakage increases by 57.92%. Additionally, as the rotational speed of the shaft increases from 0 to 2700 r min 1 , the end-face gradually opens, and the magnitude of the opening force and leakage decreases with the variation of characteristic coefficients by 61.05% and 7.29%, respectively, as shown in Figure 7b. During the transition stage, as the rotational speed of the shaft increases from 2700 r min 1 to 3500 r min 1 , the end-face approaches opening. The changes in opening force and leakage, as influenced by the fractal dimension, decrease by 9.41% and 16.80%, respectively. Similarly, the changes in characteristic coefficients decrease by 18.82% and 3.32%. In the full-opened stage, when the rotational speed of the shaft exceeds 3500 r min 1 , the end-face is fully open, and the opening force and seal leakage are no longer influenced by the fractal dimension or characteristic coefficients, as shown in Figure 7.

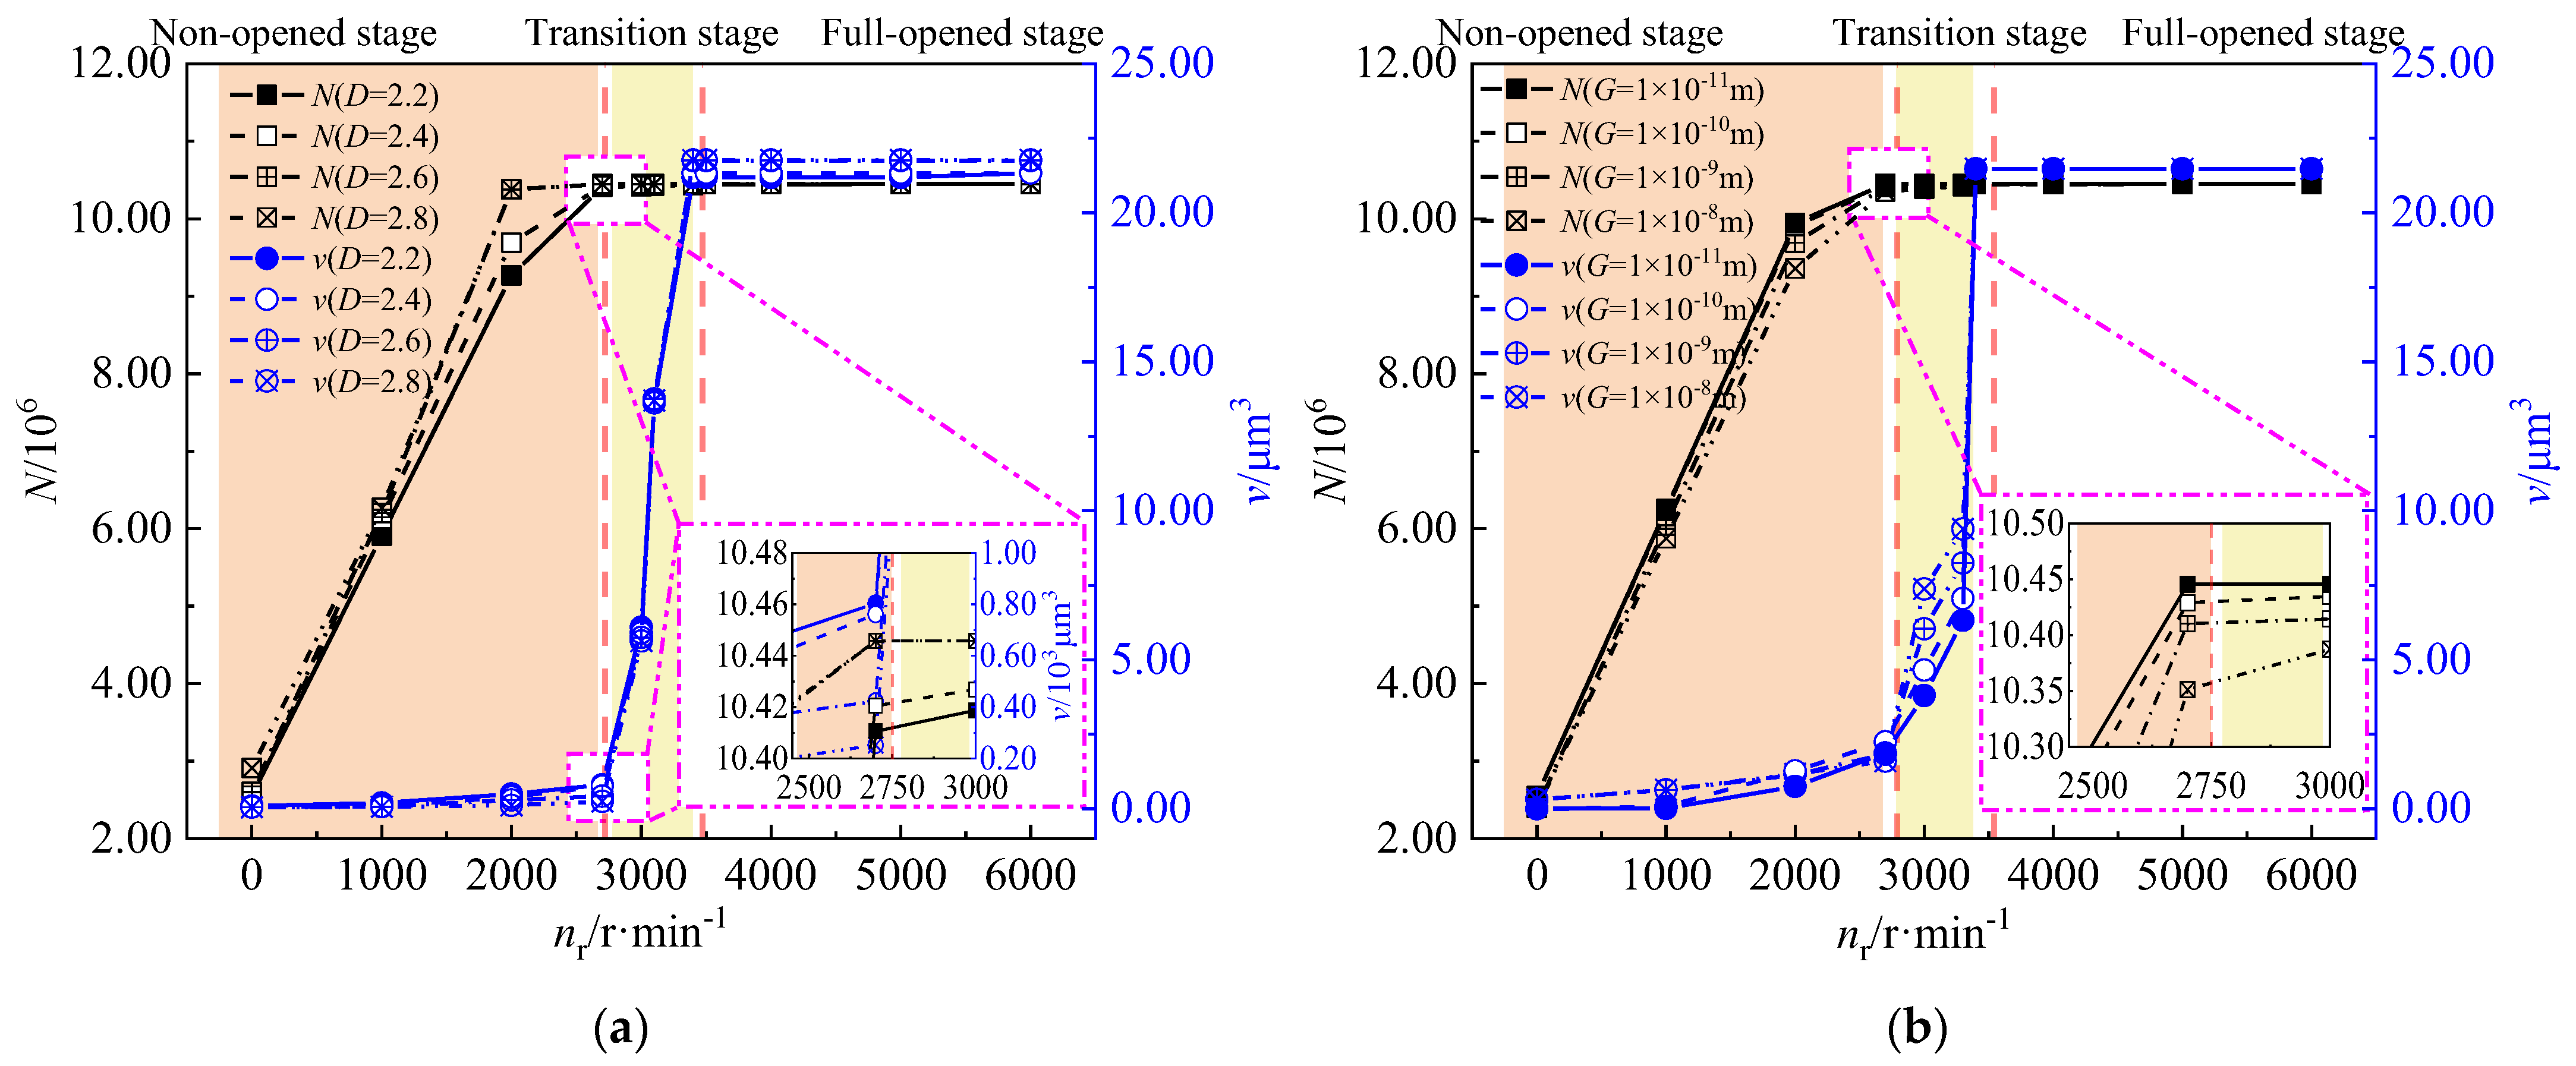
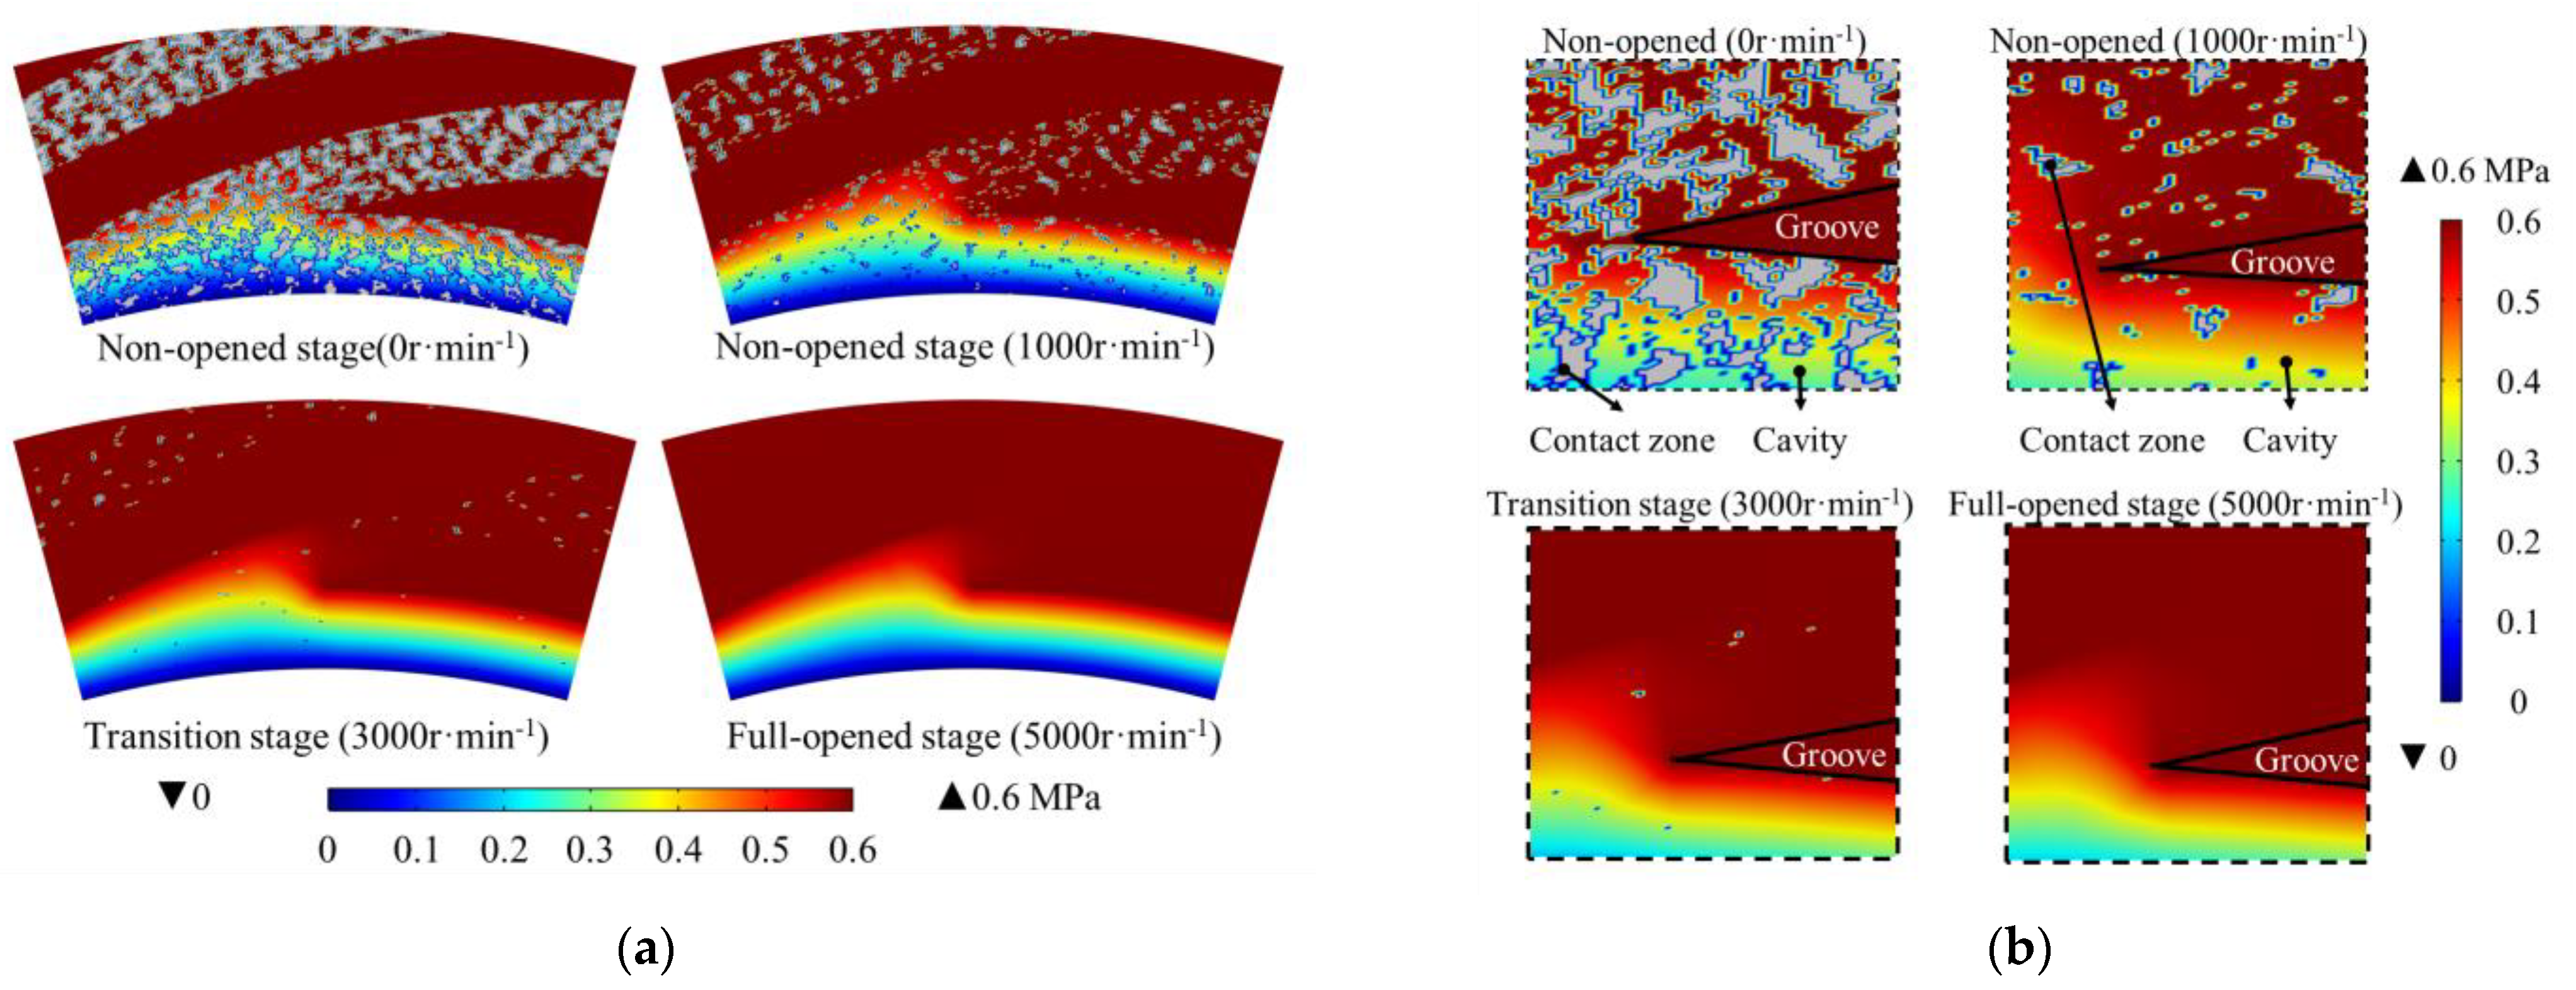
4.2. Effect of Fractal Parameters on the Micro-Features on End-Faces during Start-Up Process

Changes in fractal parameters result in variations in the roughness of the end-face, consequently affecting the sealing performance. To further analyze the influence of fractal parameters on the evolution of the sealing performance during the start-up process of the dynamic pressure seal, the number of the cavities, the average parallel cross-sectional area, and the average volume of the cavities are calculated to analyze the impact of the fractal parameters on the micro-feature of the end-faces, as shown in Figure 2. Assuming that the cavities in the sealing gap are independent of each other and disregarding the merging phenomenon of tiny cavities during the start-up process, the number of the cavities in the seal gap is determined by integrating the density function of the distribution of the non-contact area in the non-groove area of the end-faces. The calculation formula is as follows:
N = 0 2 π r i r o 4 ( 1 ζ c ) ( 1 ζ g ) π l 2 2 r d r d θ
By integrating the density function of the distribution of the non-contact area in the non-grooved area of the seal end-face, and then calculating the total non-contact area of the seal end-face, and subsequently determining the average cross-sectional area of the cavities, the formula is as follows:
s = N 1 0 2 π r i r o ( 1 ζ c ) ( 1 ζ g ) r d r d θ
Assuming that the cavity is an ellipsoid with the long axis equal to 0.5 h f and the short axis equal to r s , the average volume of the cavities can be calculated using the ellipsoid volume formula. To calculate the distribution density function of the average volume of the cavities per unit of the basal area, integrate the calculation to obtain the average volume of the cavities. The formula is as follows:
v = N 1 0 2 π r i r o 2 π 3 h f r s 2 ( π l 2 2 4 ) 1 r d r d θ
In Formula (24), rs is the radius of the cross-sectional area of the cavities, r s = s 1 / 2 π 1 / 2 .
During the non-opened stage, as the rotational speed increases from 0 to 2700 r min 1 , the number of the cavities increases by 2.33 times from 2.70 × 10 6 , and the average volume of the cavities increases by 2.41 times from 0.4 μ m 3 . In the transition stage, as the rotational speed of the shaft increases from 2700 r min 1 to 3500 r min 1 , the rate of change of the number of the cavities decreases, and the growth decreases to 5.26%. Meanwhile, the rate of change of the average volume of the cavities increases, and the growth increases to 6.60%, as shown in Figure 8. Changes in fractal dimension and characteristic coefficients will lead to changes in the microscopic feature of the end-face characterized based on the fractal function. The end-face roughness decreases as the fractal dimension increases. When the fractal dimension is less than 2.4, the number of the cavities increases by 4.54% and the average volume of the cavities decreases by 21.21%. When the fractal dimension is from 2.4 to 2.6, the rate of change of the number of the cavities increases to 7.08% and the changes in the volume of the cavity increases to 23.94%. When the fractal dimension is greater than 2.6, the increase of the number of cavities decreases to 0.91%, and the changes in the volume of the cavity increases to 37.25%, as shown in Figure 8a. With the increase in the characteristic coefficients, the degree of roughness of the end-face also increases. When the characteristic coefficients are less than 1 × 10 9 m, the number of the cavities decreases by 0.40%, and the average volume of the cavities increases by 39.70%. When the characteristic coefficient is greater than 1 × 10 9 m, the variation of the number of the cavities increases to 3.44% and the changes in the average volume of the cavities increases to 70.41%, as shown in Figure 8b.
During the non-opened stage, as the speed increased from 0 to 2700 R·min−1, the average parallel cross-sectional area of the cavities increased by 1.04 times from 1.05 μ m 2 , and the axial clearance of the cavities increased by 1.67 times from 0.15 μ m . In the transition stage, as the speed of the shaft increased from 2700 r min 1 to 3500 r min 1 , the growth of the parallel cross-sectional area of the cavities decreases, only increased by 78.56%, and the average axial clearance of the cavities further increased by 1.97 times. In the full-opened stage, the average parallel cross-sectional area of the cavities and axial clearance tend to stabilize, as shown in Figure 9.
With the increase of fractal dimension, the average parallel cross-sectional area and average axial clearance of the cavities decrease gradually. When the fractal dimension is lower than 2.4, the average parallel cross-sectional area of the cavities decreases by 26.17%, and the axial clearance decreases by 55.71%. When the fractal dimension ranges from 2.4 to 2.6, the average parallel cross-sectional area of the cavities is more stable, with only a 1.91% change, and the axial clearance decreases by 46.97%. When the fractal dimension is greater than 2.6, the average parallel cross-sectional area of the cavities decreases by 11.61% and the average axial clearance of the cavities decreases by 29.72%, as shown in Figure 9a. The average parallel cross-sectional area and the average axial clearance of the cavities gradually increases with the increase of the characteristic coefficient. When the characteristic coefficient is less than 1 × 10⁻⁹ m, the average parallel cross-sectional area of the cavities increases by 1.13% and the average axial clearance of the cavities increases by 31.35%. When the characteristic coefficient is greater than 1 × 10 9 m, the change in the average parallel cross-sectional area of the cavities increases to 4.47%, while the average axial clearance of the cavities increases to 189.88%, as shown in Figure 9b.

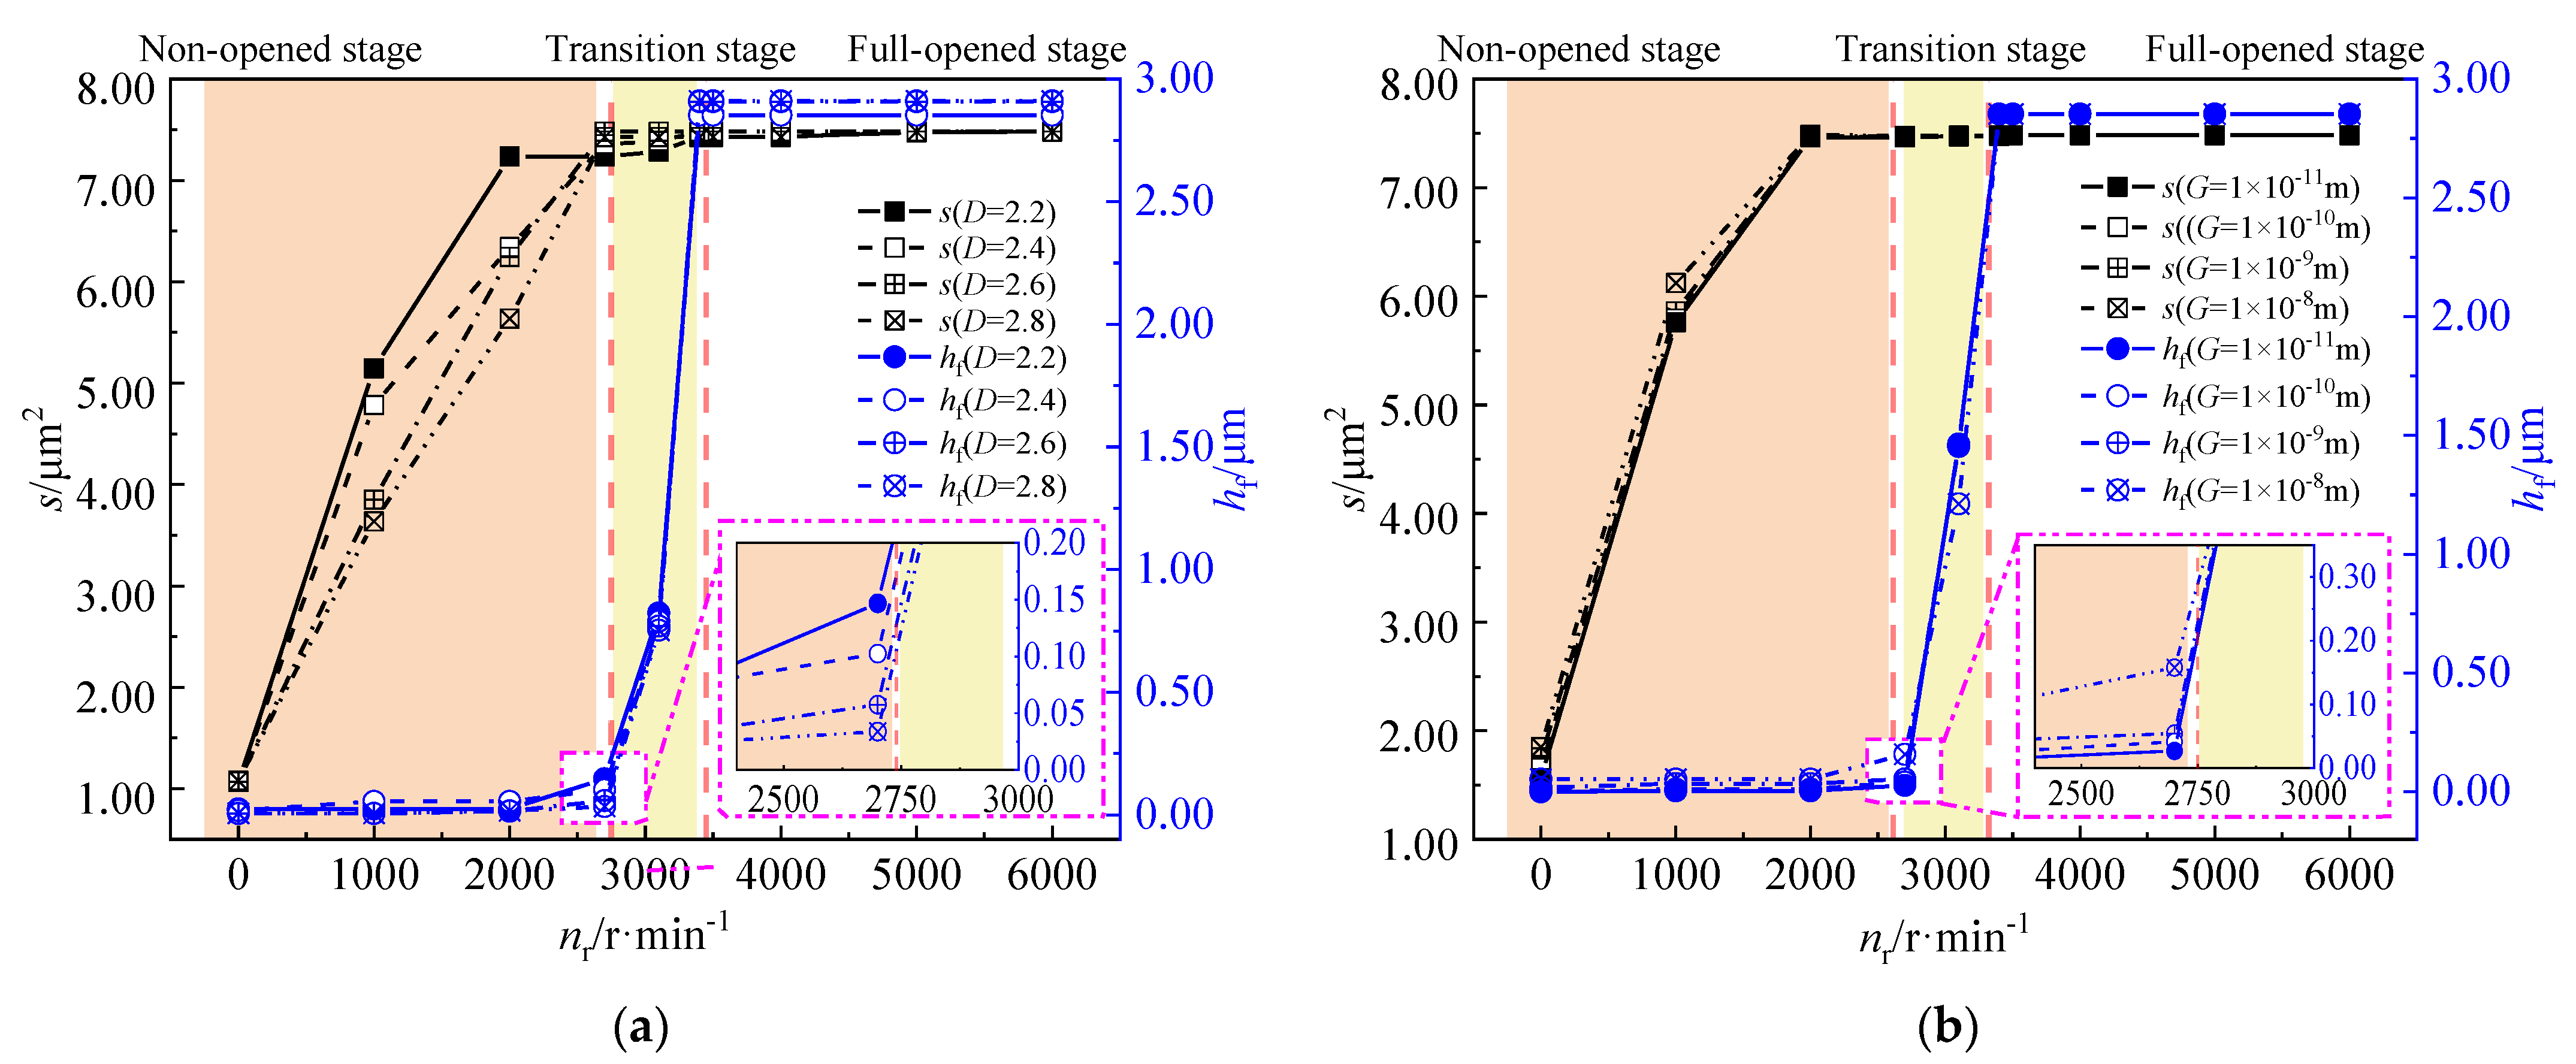
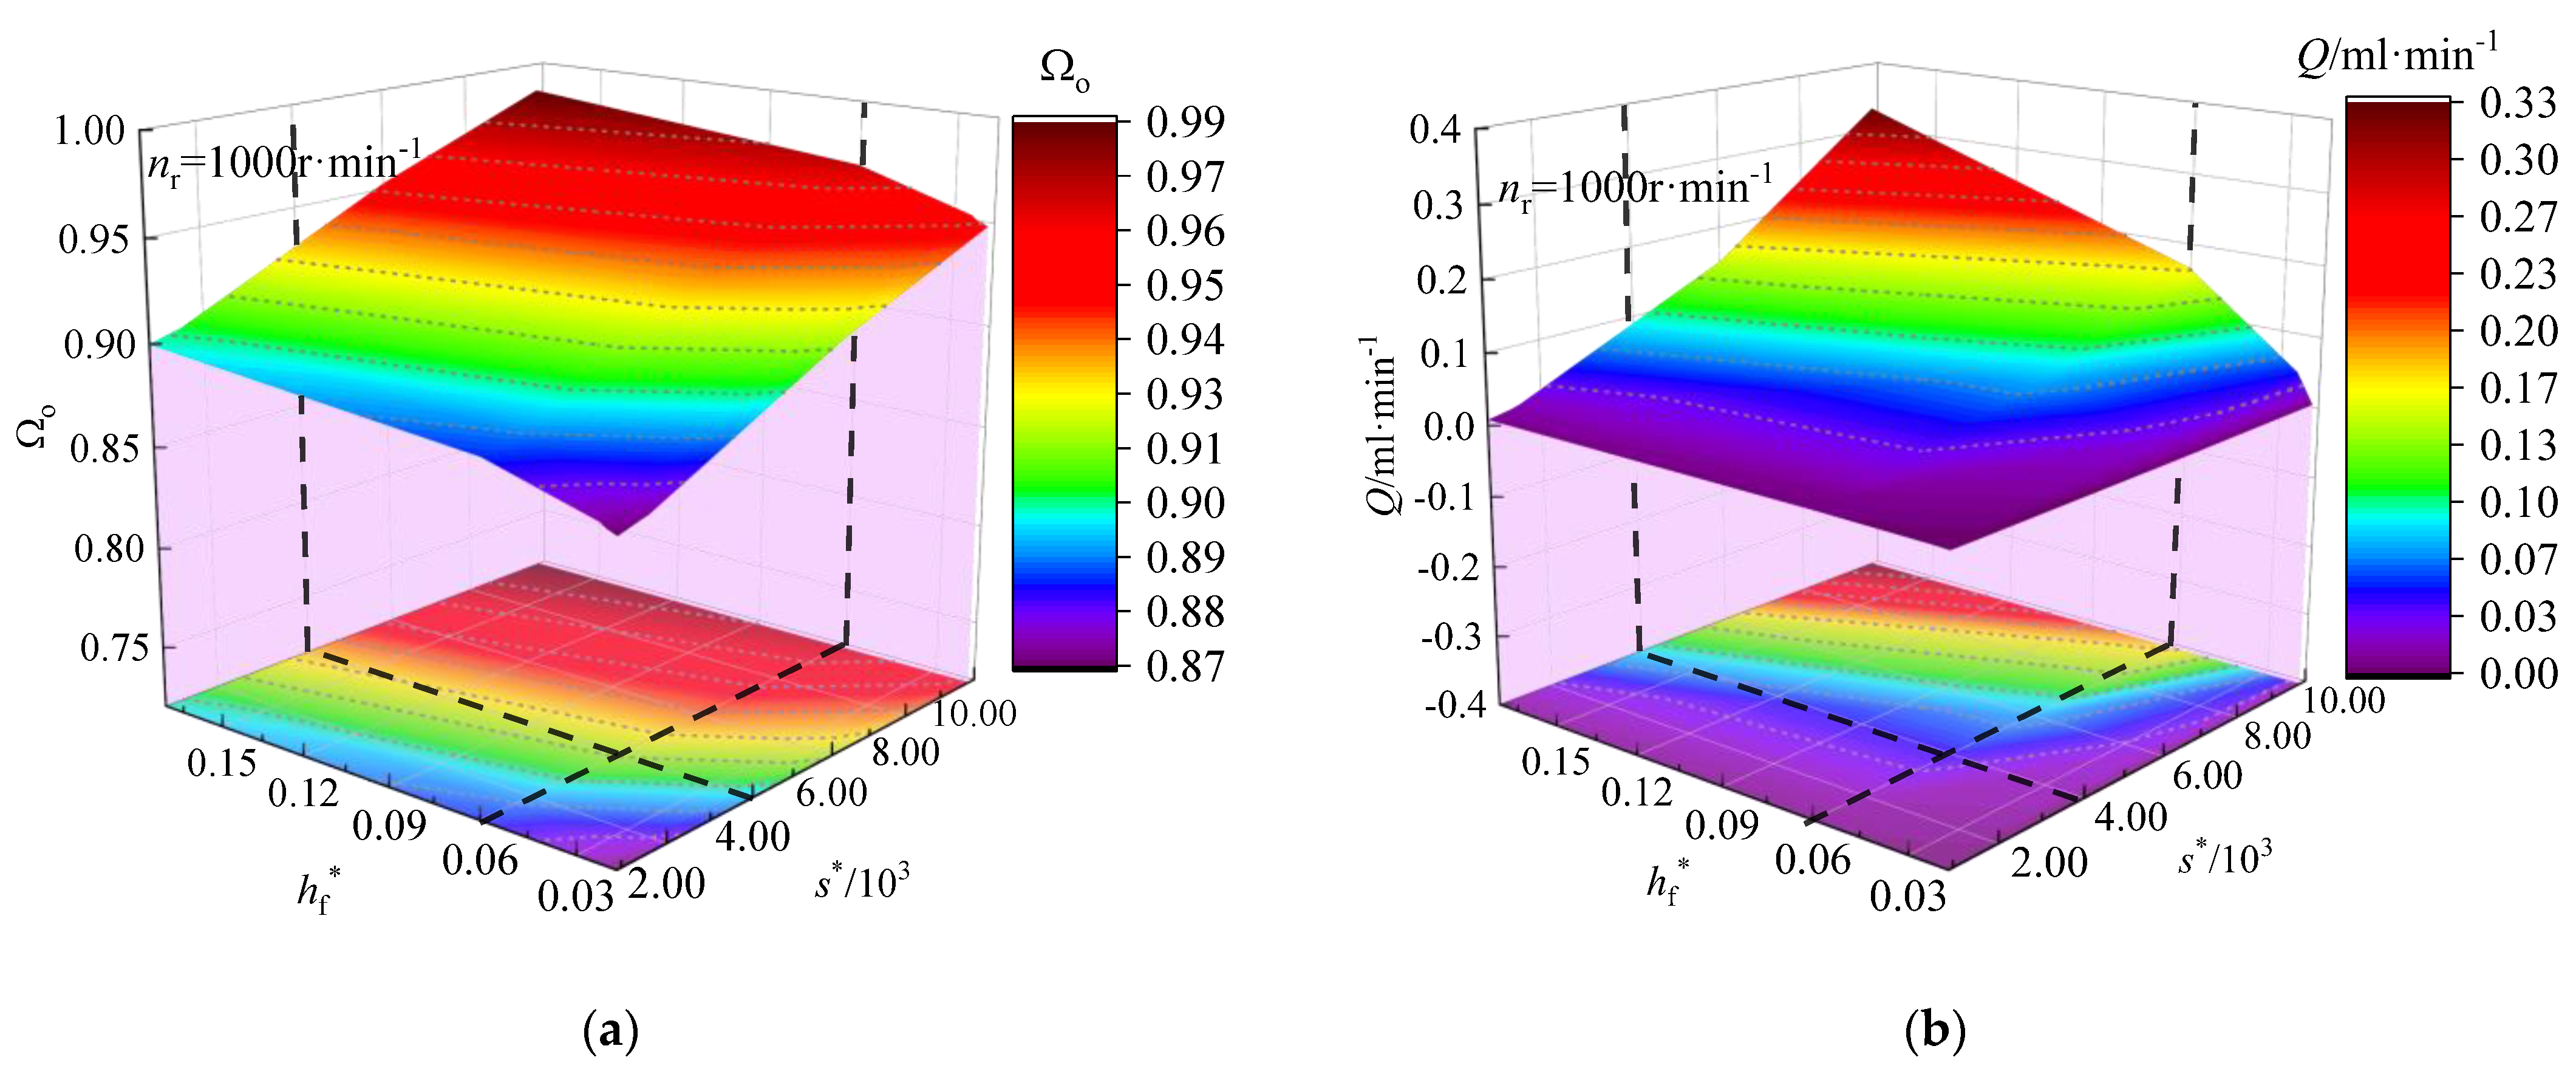
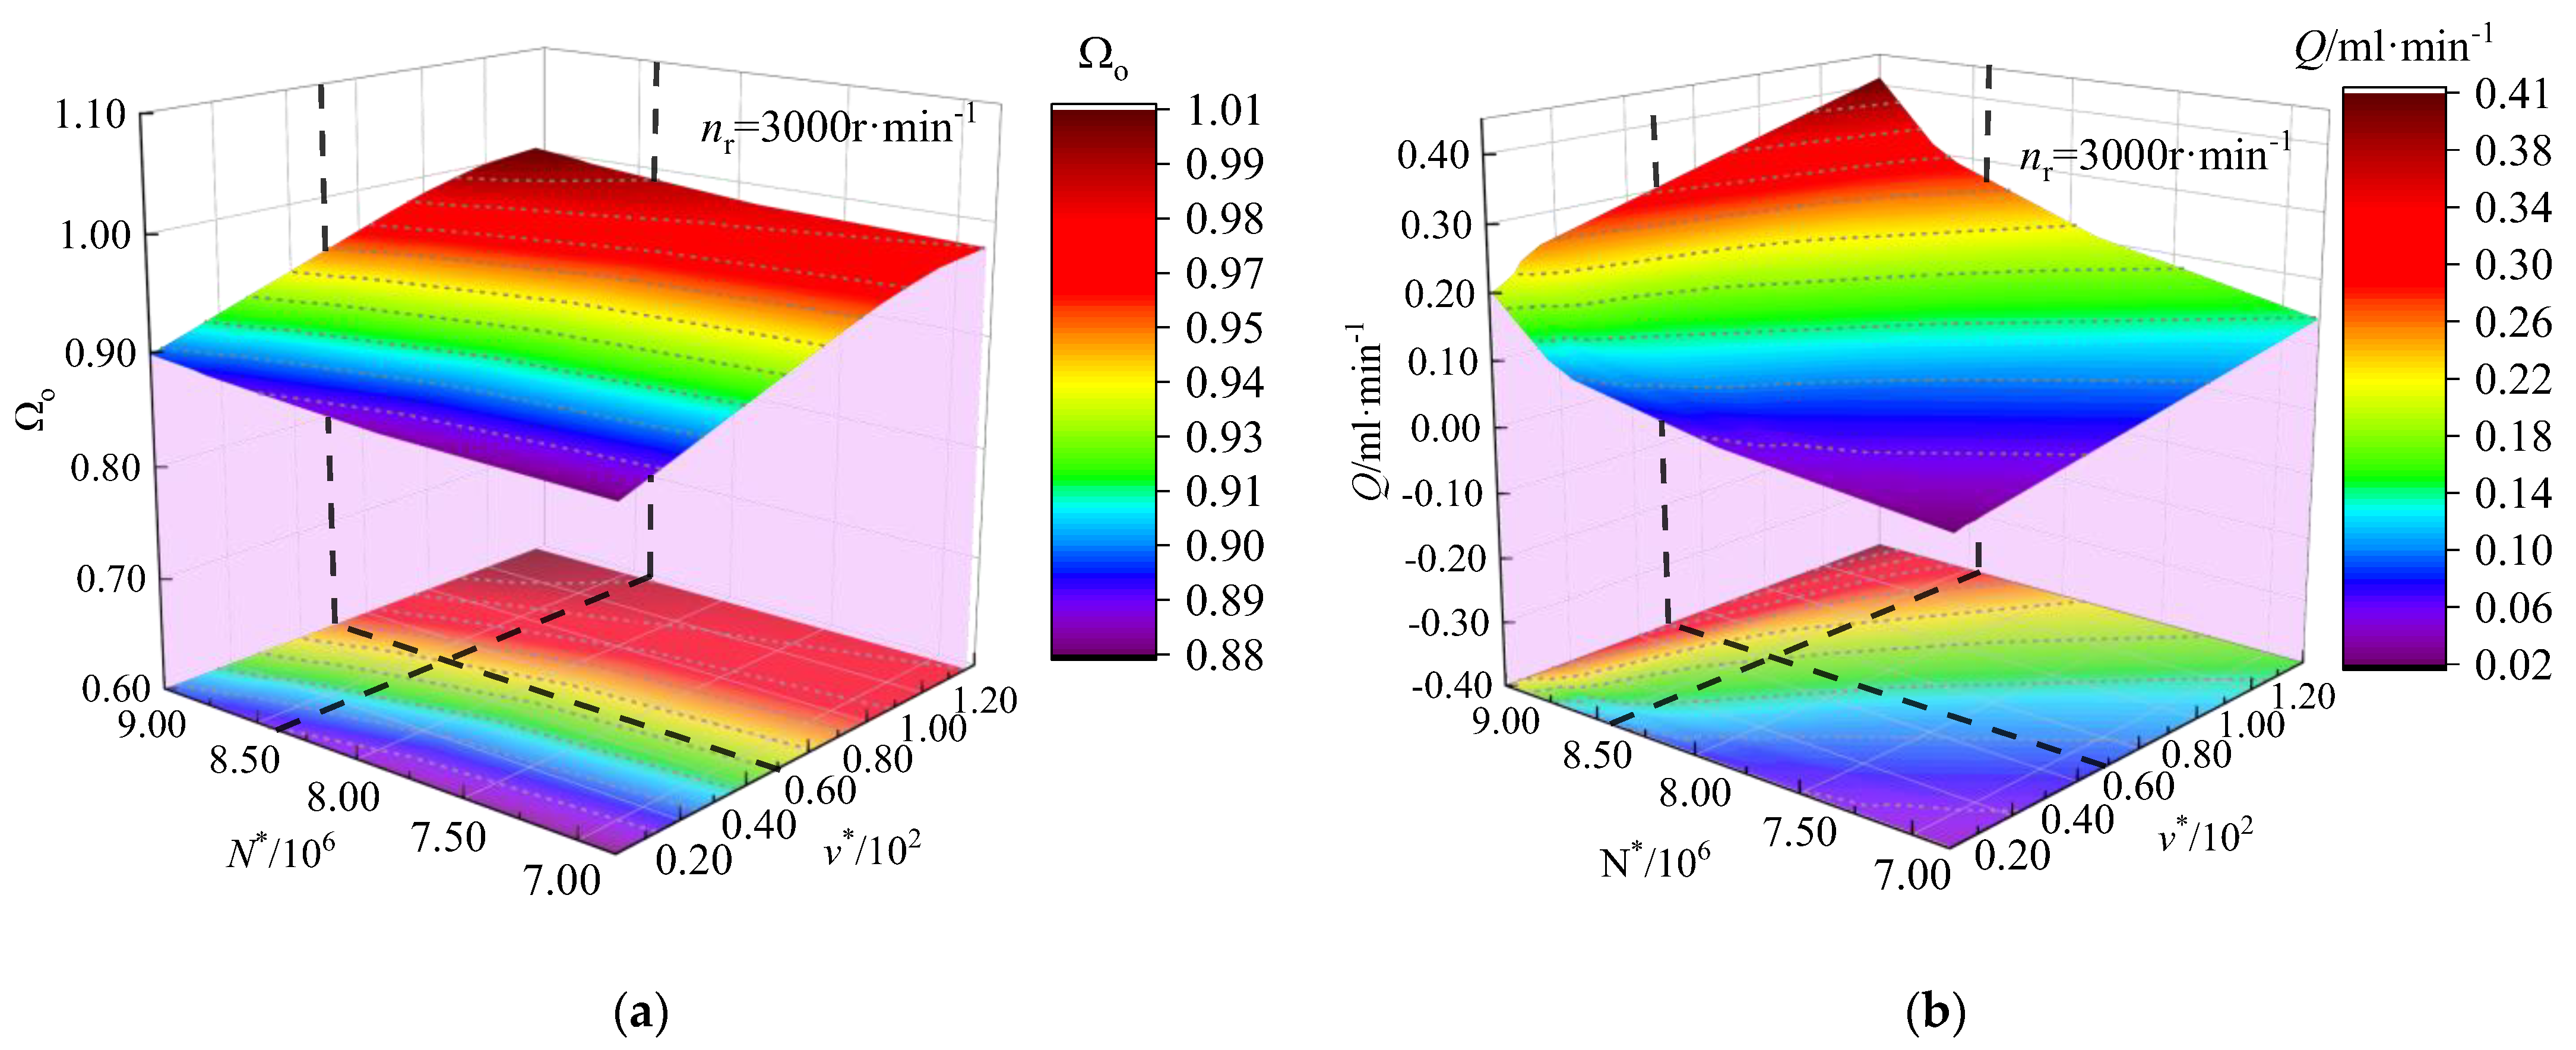
4.3. Effect of the Micro-Features on the Sealing Performance during the Start-Up Process

In order to further analyze the influence of the micro-features on the evolution of sealing performance during the start-up process of dynamic pressure seals, the relationship between the ratio of opening force and leakage and the number and size of tiny cavities in the non-opened stage and the transition stage are calculated, respectively. In order to facilitate the comparison of the effect of the micro-features on the evolution of sealing performance in different opening stages, the end-face feature parameters are dimensionless using the reference plane distance Δ z and axial thickness of sealing ring B .
{ h f * = h f Δ z ,   s * = s Δ z 2 N * = N B Δ z ,   v * = v Δ z 3
In the non-opened stage, as the dimensionless axial clearance of the cavities increases from 0.02 to 0.17, the opening force ratio increases by 3.45% from 0.87, and the leakage volume increases by 27.51 times from 1.05 × 10 3   mL min 1 . When the dimensionless axial clearance of the cavities is higher than 0.06, the growth of the opening force ratio decreases from 3.69% to 1.14%, and the growth of the leakage volume decreases from 27.05 times to 0.94 times. As the dimensionless parallel cross-sectional area of the cavities increases from 9.09 × 10 2 to 1.00 × 10 4 , the opening force ratio increases by 10.34% from 0.87 and the leakage increases by 27.46 times from 1.05 × 10 3   mL min 1 . When the dimensionless cross-sectional area of the cavity is greater than 4.05 × 10 3 , the increase in the opening force ratio increases from 3.33% to 5.32%, and the increase in the leakage increases from 5.79 times to 62.33 times, as shown in Figure 10.
As the dimensionless number of the cavities increases from 6.89 × 10⁻⁶ to 8.79 × 10 6 , the opening force ratio increases by 50.72% from 0.65, and the leakage volume increases by 28.12 times from 1.03 × 10 3   mL min 1 . When the dimensionless number of the cavities is greater than 7.89 × 10 6 , the increase in the opening force ratio decreases from 24.62% to 20.98% and the increase in the leakage volume increases from 29.50 times to 33.20 times. As the dimensionless volume of the cavities increases from 11.32 to 127.41, the opening force ratio increases by 15.38% from 0.65 and the leakage increases by 28.08 times from 1.03 × 10 3   mL min 1 . When the dimensionless volume of the cavities is greater than 200, the increase in the opening force ratio and leakage decreases gradually, as shown in Figure 11.
Comparison of the dimensionless parameters of the microscopic features reveals that the dimensionless volume of the cavities has a greater impact on the opening force ratio and leakage volume in the sealed non-opened stage. According to Equations (24) and (25), it can be seen that the volume of the cavities and the product of axial clearance and parallel cross-sectional area of the cavities are linearly correlated, but the dimensionless volume of the cavities has a greater impact on the opening force ratio and leakage amount. This suggests a coupling effect of the axial clearance and parallel cross-sectional area of the cavities on the ratio of seal-opening force and leakage amount.
In the transition stage, as the dimensionless axial clearance of the cavities increases from 0.02 to 0.17, the opening force ratio increases by 13.25% from 0.83, and the leakage volume increases by 4.04 times from 0.01 mL·min−1. When the dimensionless axial clearance of the cavities is greater than 0.07, the increase in the opening force ratio decreases from 12.04% to 2.19%. Additionally, when the dimensionless axial clearance of the cavities is greater than 0.05, the leakage volume increase decreases from 96.55% to 60.00%. As the dimensionless parallel cross-sectional area of the cavities increases from 9.09 × 10 2 to 1.00 × 10 4 , the opening force ratio increases by 9.64% from 0.83, and the leakage volume increases by 7.67 times from 0.01   mL min 1 . When the dimensionless parallel cross-sectional area of the cavities is larger than 5.00 × 10 3 , the increase in the opening force ratio decreases from 9.63% to 2.19%. When the dimensionless parallel cross-sectional area of the cavity is larger than 7.00 × 10 3 , and the increase in the leakage volume increases from 1.25 to 1.35 times, as shown in Figure 12.
As the dimensionless number of the cavities increases from 6.89 × 10⁶ to 8.79 × 10 6 , the opening force ratio increases by 2.27% from 0.88, and the leakage increases by 4.01 times from 0.01   mL min 1 . When the dimensionless number of cavities is greater than 8.40 × 10 6 , the increase in leakage increases from 23.52% to 95.23%. As the dimensionless volume of the cavities increases from 11.32 to 127.41, the opening force ratio increases by 10.23% from 0.88, the leakage increases by 16.21 times from 0.01   mL min 1 . When the dimensionless volume of the cavities is greater than 50.00, the change in leakage increases from 2.05 times to 2.26 times, as shown in Figure 13. Comparison of the dimensionless parameters of the microscopic features reveals that in the transition stage, the dimensionless axial clearance of the cavities has a higher impact on the opening force ratio, while the dimensionless volume of the cavities has a higher impact on the leakage volume. When comparing the results of the analysis in the non-opened stage, it is evident that the cavity volume has a greater influence on the opening force and leakage compared to the isotropic dimensions of the cavities. Additionally, the coupling effect on the opening force and leakage increases gradually with the rotational speed.

5. Conclusions

In order to analyze the evolution of the seal performance during the start-up process of the dynamic pressure seal, this paper proposes a dynamic pressure seal performance evolution analysis model based on the three-dimensional fractal function that characterizes the rough end-face, defines the parameters that can adequately characterize the microscopic features of the seal end-face, and analyzes the influence of the fractal parameters and the microscopic features on the evolution of the seal performance. This study aims to provide theoretical guidance for the structural design and processing of dynamic seals, and the main conclusions are as follows:
(1) The opening state of the seal end-face is divided into non-opened stage, transition stage and full-opened stage according to the change of seal leakage. In the non-opened stage, the leakage increases slowly by 22.56%, but the opening force increases rapidly by 3.13 times, in the transition stage, the leakage increases rapidly by 10.48 times, but the opening force increases only by 4.23%, and in the full-opened stage, the leakage and the opening force of the seal tend to stabilize.
(2) As the fractal dimension increases and the characteristic coefficients decrease, the leakage decreases. The leakage is mainly affected by the characteristic coefficients in the non-opened stage, and the leakage is mainly affected by the fractal parameters in the transition stage, but with the increase of the rotational speed, the influence of the end-face micro features on the leakage decreases. In the full-opened stage, the leakage is no longer affected by the fractal dimension and characteristic coefficients.
(3) In the non-opened stage, the leakage is mainly affected by the number of cavities, and its increase decreases from 62.33 times to 5.79 times when the dimensionless number of cavities is less than 7.89 × 10⁶. In the transition stage, the leakage is mainly affected by the volume of cavities, and the increase of leakage decreases from 2.26 times to 2.05 times when the dimensionless volume of the cavities is less than 50.00. Additionally, the coupling effect that exists in the anisotropic dimensions of the cavities on the leakage gradually diminishes as the rotational speed increases.
(4) As the fractal dimension increases and the characteristic coefficient decreases, the roughness of the end-face decreases, the number of cavities gradually increases, and the dimension of cavities in all directions gradually decreases. When the fractal dimension is 2.4~2.6, the average parallel cross-sectional area of the cavities is more stable. When the characteristic coefficient is less than 1 × 10 9 m, the change in the average axial clearance of the cavities decreases from 189.88% to 31.35%, and the change in the average parallel cross-sectional area of the cavity decreases from 4.47% to 1.13%.
(5) This paper provides a new method for testing the machining quality of the seal end-faces of dynamic pressure seals, which can be further examined by the fractal dimension and characteristic coefficients of the seal end-faces. The results of the study show that an excessively smooth surface, although providing excellent sealing performance, also leads to a significant reduction in the seal-opening characteristics. In order to improve the sealing performance during the start-up of dynamic seals, it is recommended that the 3D fractal dimension of the machined seal faces should be 2.4–2.6 and the characteristic coefficient should be less than 1 × 10⁻⁹ m.

Author Contributions

Conceptualization, E.B.; methodology, E.B.; software, E.B.; validation, E.B., J.Z. and A.L.; formal analysis, E.B.; investigation, E.B.; resources, S.L.; data curation, E.B.; writing—original draft preparation, E.B.; writing—review and editing, E.B.; supervision, J.Z.; project administration, S.L.; funding acquisition, S.L. All authors have read and agreed to the published version of the manuscript.

Funding

This research was funded by “National Key R&D Program of China” (Grant No.2018YFB2000800).

Data Availability Statement

The datasets generated and supporting the findings of this article are obtained from the corresponding author upon reasonable request. The authors attest that all data for this study are included in this paper.

Conflicts of Interest

The authors declare no conflicts of interest.

References

  1. Zhuo, Z.Y.; Chen, Y.; Li, Y.T.; Wang, B.Q.; Peng, X.D. Intelligent Prediction of Control Force of Active Hydrodynamic Pressure Dry Gas Seal under Random Conditions and Comparative Study of Its Algorithm Performance. Tribology 2023, 43, 1370–1380. [Google Scholar] [CrossRef]
  2. Park, Y.; Hahn, M.; Jang, G. Effect of Laminar, Turbulent and Slip Conditions on the Dynamic Coefficients of a Dry Gas Seal. Lubricants 2023, 11, 98. [Google Scholar] [CrossRef]
  3. Zhang, C.; Jiang, J.B.; Peng, X.D. Numerical analysis of supercritical CO dry gas seals with phase transitions. Ind. Lubr. Tribol. 2022, 74, 780–787. [Google Scholar] [CrossRef]
  4. Zhai, X.; Yang, X.C.; Chen, J.L.; Ding, X.X. Elastic-plastic contact stiffness model of dry gas seal friction interface. J. Vib. Shock. 2023, 42, 165–171. [Google Scholar] [CrossRef]
  5. Bai, S.X.; Song, Y.S.; Yang, J. Elastic deformation of liquid spiral groove face seals operating at high speeds and low pressure. Int. J. Mech. Sci. 2022, 226, 107397. [Google Scholar] [CrossRef]
  6. Li, Q.Z.; Li, S.X.; Zheng, R.; Jiang, L.; Zeng, Y.; Zhu, M.Y. Friction and Wear Performance of Oil-gas Miscible Reflux Pumping Seal During Start-up. Aeroengine 2023, 49, 167–174. [Google Scholar] [CrossRef]
  7. Su, W.T.; Hu, S.H.; Wang, L.; Feng, X.D. Performance analysis and optimized model selection of wavy hydrodynamic mechanical seals. J. China Univ. Pet. (Ed. Nat. Sci.) 2023, 47, 138–145. [Google Scholar] [CrossRef]
  8. Yin, T.; Wei, D.; Wang, T.; Xie, Z. Thermal compression and accumulation effect on lubrication regime transition mechanism of water seal. Tribol. Int. 2023, 181, 108285. [Google Scholar] [CrossRef]
  9. Wang, Q.Y.; Li, X.Y.; Wang, Z.L.; Yu, B.; Hao, M.M. Steady-State Performance of Liquid Film Seal Considering Dissolution of Methane. Tribology 2023, 43, 645–656. [Google Scholar] [CrossRef]
  10. Hu, Z.L.; Fan, X.; Diao, D.F. Facilitation of sp2 nanocrystallites on the formation of transfer films for stable low friction with in-situ TEM nanofriction study. Tribol. Int. 2022, 174, 107713. [Google Scholar] [CrossRef]
  11. Chen, W.; Song, P.Y.; Xu, H.J.; Sun, X.J. Study on Startup Process of Carbon Dioxide with Impurities Lubricating Dry Gas Seal. Lubr. Eng. 2022, 47, 1–9. [Google Scholar] [CrossRef]
  12. Wang, Z.; Wang, Q.; Hao, M.; Li, X.; Liu, K. The effect of thermal-elastic deformation on the sealing performance of supercritical CO dry gas seal. Ind. Lubr. Tribol. 2023, 75, 950–958. [Google Scholar] [CrossRef]
  13. Hossain Bhuiyan, M.M.; Sakib, A.N.; Corral, A.B.; Siddique, Z. Investigating the influence of operating variables on sealing performance of a V-ring seal stack in the oil and gas industry for enhanced environmental and operational performance. Polym. Test. 2024, 131, 108346. [Google Scholar] [CrossRef]
  14. Cui, Y.; Yu, Y.; Zhong, J.; Wang, Y. Prediction of sealing interface leakage based on porous medium model considering effective porosity. Tribol. Int. 2022, 174, 107695. [Google Scholar] [CrossRef]
  15. Yang, Z.; Zhu, W.; Dong, R.; Cao, Z. Multi-scale dimensionless prediction model of PEMFC sealing interface leakage rate based on fractal geometry. Int. J. Hydrogen Energy 2023, 48, 5276–5287. [Google Scholar] [CrossRef]
  16. Bai, L.Q.; Zhang, P.C.; Ahmad, K.Z. Semi Salix Leaf Textured Gas Mechanical Face Seal with Enhanced Opening Performance. Materials 2021, 14, 7522. [Google Scholar] [CrossRef]
  17. Chen, Y.; Peng, X.D.; Wang, B.Q.; Jiang, J.B.; Li, J.Y. Experimental and theoretical investigations on dry gas seal transient performance and its disparity with steady performance. Proc. Inst. Mech. Eng. Part J J. Eng. Tribol. 2022, 236, 1661–1673. [Google Scholar] [CrossRef]
  18. Li, Y.F.; Brunetière, N.; Hao, M.M.; Li, T.Z.; Liu, F.Y. Experimental study on transient frictional features of herringbone-grooved mechanical face seals in start-up and stop stages. Tribol. Int. 2022, 175, 107790. [Google Scholar] [CrossRef]
  19. Mutellip, A.; Runsheng, Y. Coupling analysis of thermal-solid deformation for spiral groove mechanical seal. In Proceedings of the International Conference on Mechanical Design and Simulation (MDS 2022), Wuhan, China, 18–20 March 2022; Volume 12261, p. 122610E. [Google Scholar] [CrossRef]
  20. Xu, W.; Tian, Y.; Song, Y.; Xu, Y. Bidirectional Trapezoidal Versus Unidirectional Spiral Groove Performance in Dry Gas Seals. Int. J. Fluid Mach. Syst. 2021, 14, 220–228. [Google Scholar] [CrossRef]
  21. Zhou, X.; Chen, Z.; Gu, C.H.; Wang, J.H. Thermo-mechanical coupling analysis of the end faces for a mechanical seal under dry friction. Tribol. Int. 2021, 160, 107050. [Google Scholar] [CrossRef]
  22. Zhang, C.; Jiang, J.B.; Zhao, W.J.; Jin, J.; Peng, X.D. A comprehensive multi-objective, multi-parameter and multi-condition optimization of a spiral groove in dry gas seals. J. Braz. Soc. Mech. Sci. Eng. 2022, 44, 206. [Google Scholar] [CrossRef]
  23. Fan, Y.; Song, P.Y.; Xu, H.J. Study on startup operation of dry gas seal with steam lubrication. CIESC J. 2020, 71, 3671–3680. [Google Scholar] [CrossRef]
  24. Zhang, H.B.; Izhak, E. Evolution of adhesive wear and friction in elastic-plastic spherical contact. Wear 2021, 478–479, 203915. [Google Scholar] [CrossRef]
  25. Majumdar, A.; Bhushan, B. Fractal Model of Elastic-Plastic Contact Between Rough Surfaces. J. Tribol. 1991, 113. [Google Scholar] [CrossRef]
  26. Kogut, L.; Etsion, I. Elastic-Plastic Contact Analysis of a Sphere and a Rigid Flat. J. Appl. Mech. 2002, 69, 657–662. [Google Scholar] [CrossRef]
  27. Yuan, Y.; Cheng, Y.; Liu, K.; Gan, L. A revised Majumdar and Bushan model of elastoplastic contact between rough surfaces. Appl. Surf. Sci. 2017, 425, 1138–1157. [Google Scholar] [CrossRef]
  28. Zhang, Z.M.; Ding, X.X.; Zhang, L.X.; Li, N.; Si, J.X. Fractal wear prediction model and numerical analysis of floating ring seal face. CIESC J. 2022, 73, 5526–5536. [Google Scholar] [CrossRef]
  29. Zhang, Z.; Ding, X.; Xu, J.; Jiang, H.; Li, N.; Si, J. A study on building and testing fractal model for predicting end face wear of Aeroengine’s floating ring seal. Wear 2023, 532–533, 205079. [Google Scholar] [CrossRef]
  30. Nordhagen, E.M.; Sveinsson, H.A.; Malthe-Sørenssen, A. Diffusion-Driven Frictional Aging in Silicon Carbide. Tribol. Lett. 2023, 71, 95. [Google Scholar] [CrossRef]
  31. Ramasubramanian, K.; Nikhil, C.; Rao, S.; Mandal, S.; Ganguly, R.; Rao, M.S.R.; Arunachalam, N. Tribological behavior of diamond coated reaction-bonded silicon carbide under dry and seawater environment. Surf. Coat. Technol. 2024, 476, 130204. [Google Scholar] [CrossRef]
  32. Zhao, W.; He, W.F.; Liang, X.Q.; Huang, Z.B.; Zhou, Q.; Pang, Z.C.; Song, J.D.; Hu, S.; Cui, L.Q.; Luo, S.H. Enhancing elevated-temperature fretting wear performance of GH4169 by tuning wear mechanism through laser shock peening. Tribol. Int. 2024, 192, 109215. [Google Scholar] [CrossRef]
  33. Wang, S. Real Contact Area of Fractal-Regular Surfaces and Its Implications in the Law of Friction. J. Tribol. 2004, 126, 1–8. [Google Scholar] [CrossRef]
  34. Zhao, Y.X.; Ding, X.X.; Wang, S.P. Prediction of Leakage Rate and Film Thickness of Mechanical Seal Based on Fractal Contact Theory. Lubr. Eng. 2022, 47, 156–163. [Google Scholar] [CrossRef]
  35. Ding, J.H.; Yu, S.R.; Liu, Z.; Wang, S.P.; Lu, J.J. Fault Diagnosis of Dry Gas Seal Operation Status Based on Acoustic Emission Monitoring. Lubricants 2024, 12, 2075–4442. [Google Scholar] [CrossRef]
  36. Hu, F.M.; He, Q.; Huang, W.F.; Yin, Y.; Wen, X.; Liu, Y.; Wang, Y.M. Face grooves for state monitoring in dry gas seals. Tribol. Int. 2023, 189, 108950. [Google Scholar] [CrossRef]
  37. Sun, X.; Zheng, X.; Xu, P.; Liu, H.; Tian, J.; Wang, Z.; Hao, M. Research on friction state monitoring method of liquid film seal during start-up based on acoustic emission. Appl. Acoust. 2023, 210, 109424. [Google Scholar] [CrossRef]
  38. Bi, H.C.; Hao, M.M.; Ren, B.J.; Sun, X.H.; Li, Y.F.; Li, T.Z.; Liu, F.Y.; Li, X.Y. Frictional Evolution of Contact Mechanical Seals with Hybrid Lubrication. Tribology 2023, 43, 1241–1253. [Google Scholar] [CrossRef]
Figure 1. Seal schematic of the dynamic pressure seal. (a) Schematic diagram of sealing gap opening state; (b) schematic diagram of the sealing structure.
Machines 12 00269 g001
Figure 2. Schematic calculation of the open state of the end-face.
Machines 12 00269 g002
Figure 3. Flowchart of the calculation.
Machines 12 00269 g003
Figure 4. Procedure of the opening performance test.
Machines 12 00269 g004
Figure 5. Analysis of the opening performance test. (Fan’s model [23]).
Machines 12 00269 g005
Figure 6. The fluid pressure of the sealing gap during the start-up. (a) Periodic part of the fluid pressure; (b) partial details of the fluid pressure.
Machines 12 00269 g006
Figure 7. The contact force ratio and leakage rate during the start-up of seal. (a) Fractal dimension; (b) characteristic factor.
Machines 12 00269 g007
Figure 8. Number and volumetric of cavities during the start-up of seal. (a) Fractal dimension; (b) characteristic factor.
Machines 12 00269 g008
Figure 9. Dimensions of cavities during the start-up of seal. (a) Fractal dimension; (b) characteristic factor.
Machines 12 00269 g009
Figure 10. Analysis of the effect of cavities dimensions on the of sealing performance (non-opened stage). (a) Opening force of the seal; (b) leakage of the seal.
Machines 12 00269 g010
Figure 11. Analysis of the effect of the number and volume on the of sealing performance (non-opened stage). (a) Opening force of the seal; (b) leakage of the seal.
Machines 12 00269 g011
Figure 12. Analysis of the effect of cavities dimensions on the of sealing performance (transition stage). (a) Opening force of the seal; (b) leakage of the seal.
Machines 12 00269 g012
Figure 13. Analysis of the effect of the number and volume on the of sealing performance (transition stage). (a) Opening force of the seal; (b) leakage of the seal.
Machines 12 00269 g013
Table 1. Parameters of the seal.
ParameterValueParameterValue
Outer radius of the end-face ro/mm31.4Specific heat capacity of the fluid
C f / J kg 1 K 1
1006
Inner radius of the end-face r i /mm24.4Thermal conductivity of the fluid
λ f / W K 1 m 1
0.026
Thickness of the ring B /mm8.0Density of the rotor material ρ 1 / kg m 3 8190
Radius of the groove root r g /mm26.5Specific heat capacity of the rotor material
C 1 / J kg 1 K 1
481.4
Balance radius of the seal r b /mm26.0Thermal conductivity of the rotor material
λ 1 / W K 1 m 1
13.4
Angle of the land θ 1 /rad π / 12 Modulus of elasticity of the rotor material
E 1 /GPa
539
Angle of the groove θ 2 /rad π / 12 Hardness of the rotor material H 1 /GPa1.54
Depth of the groove h g /μm0.6Poisson’s ratio of the rotor material ν 1 0.3
Inlet pressure P i /MPa0.0Expansion coefficient of the rotor material α 1 / 1 × 10 6   K 1 11.8.
Outlet pressure P o /MPa350Density of the stator material ρ 2 / kg m 3 3210
Inlet temperature T i /K293.15Specific heat capacity of the stator material C 2 / J kg 1 K 1 650
Outlet temperature T o /K6000Thermal conductivity of the stator material λ 2 / W K 1 m 1 490
Rotation speed n r / r min 1 69.78Modulus of elasticity of the stator material E 2 /GPa481
Acceleration of start-up a r / rad s 2 0.80Hardness of the stator material H 2 /GPa21
Density of the fluid ρ f / kg m 3 1.29Poisson’s ratio of the stator material ν 2 0.25
Viscosity of the fluid μ f / μ Pa s 17.9Expansion coefficient of the stator material α 2 / 1 × 10 6 K 1 4.4
Table 2. Three-dimensional fractal parameters of the end-faces.
RotorStator
Fractal dimension D2.692.702.722.512.522.53
Characteristic coefficient G / 10 10   m 1.691.721.7021.2021.1821.15
Disclaimer/Publisher’s Note: The statements, opinions and data contained in all publications are solely those of the individual author(s) and contributor(s) and not of MDPI and/or the editor(s). MDPI and/or the editor(s) disclaim responsibility for any injury to people or property resulting from any ideas, methods, instructions or products referred to in the content.

