
High-Precision Peg-in-Hole Assembly with Flexible Components Based on Deep Reinforcement Learning


Abstract
1. Introduction
2. Related Works
3. Materials and Methodology
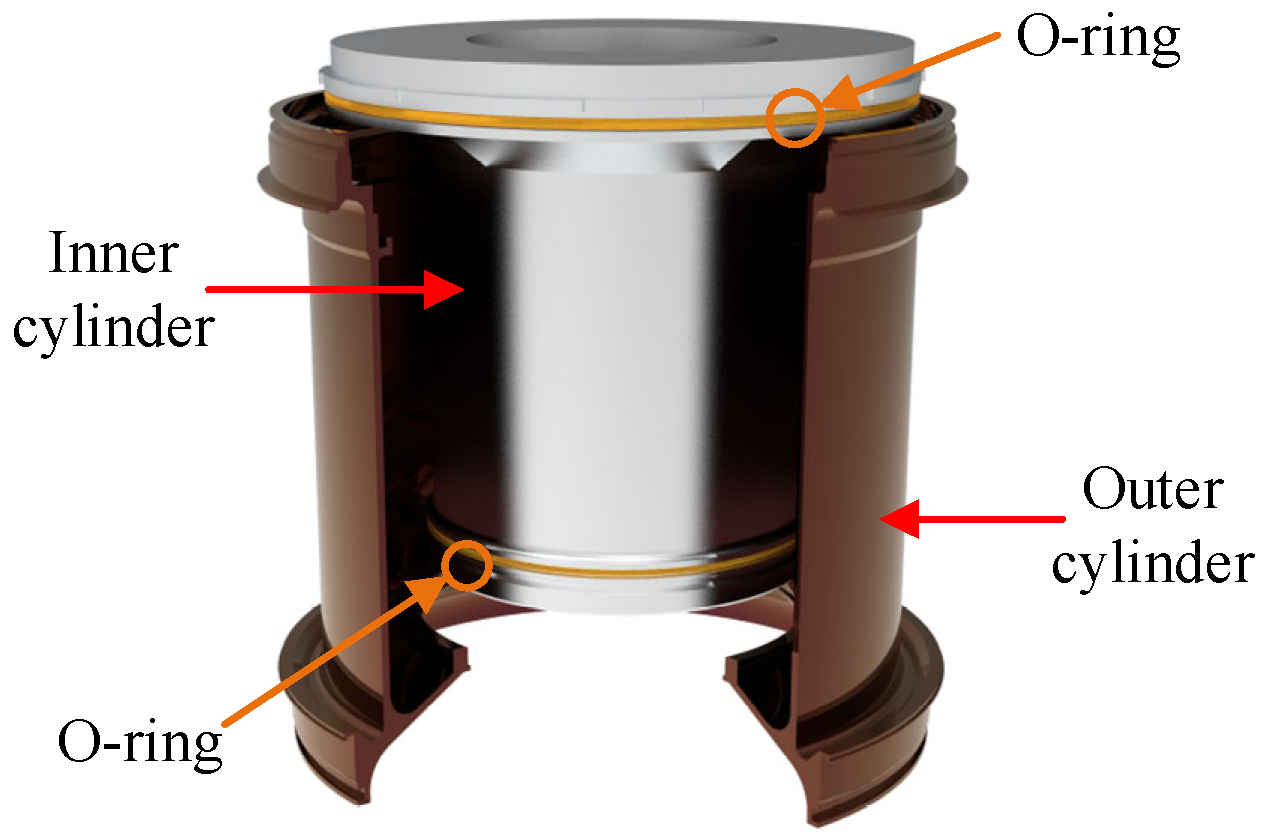
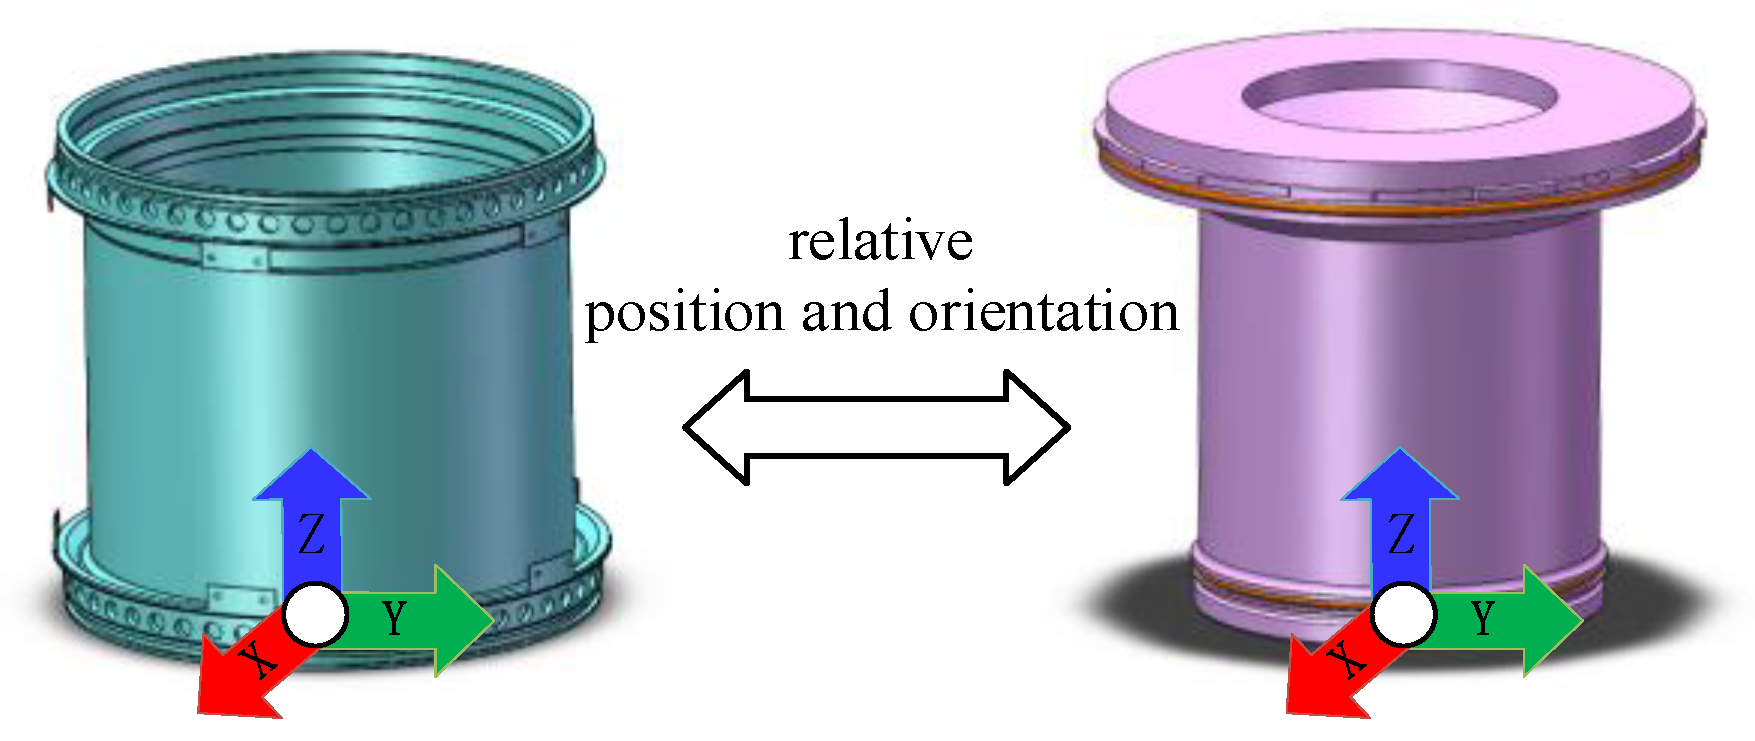
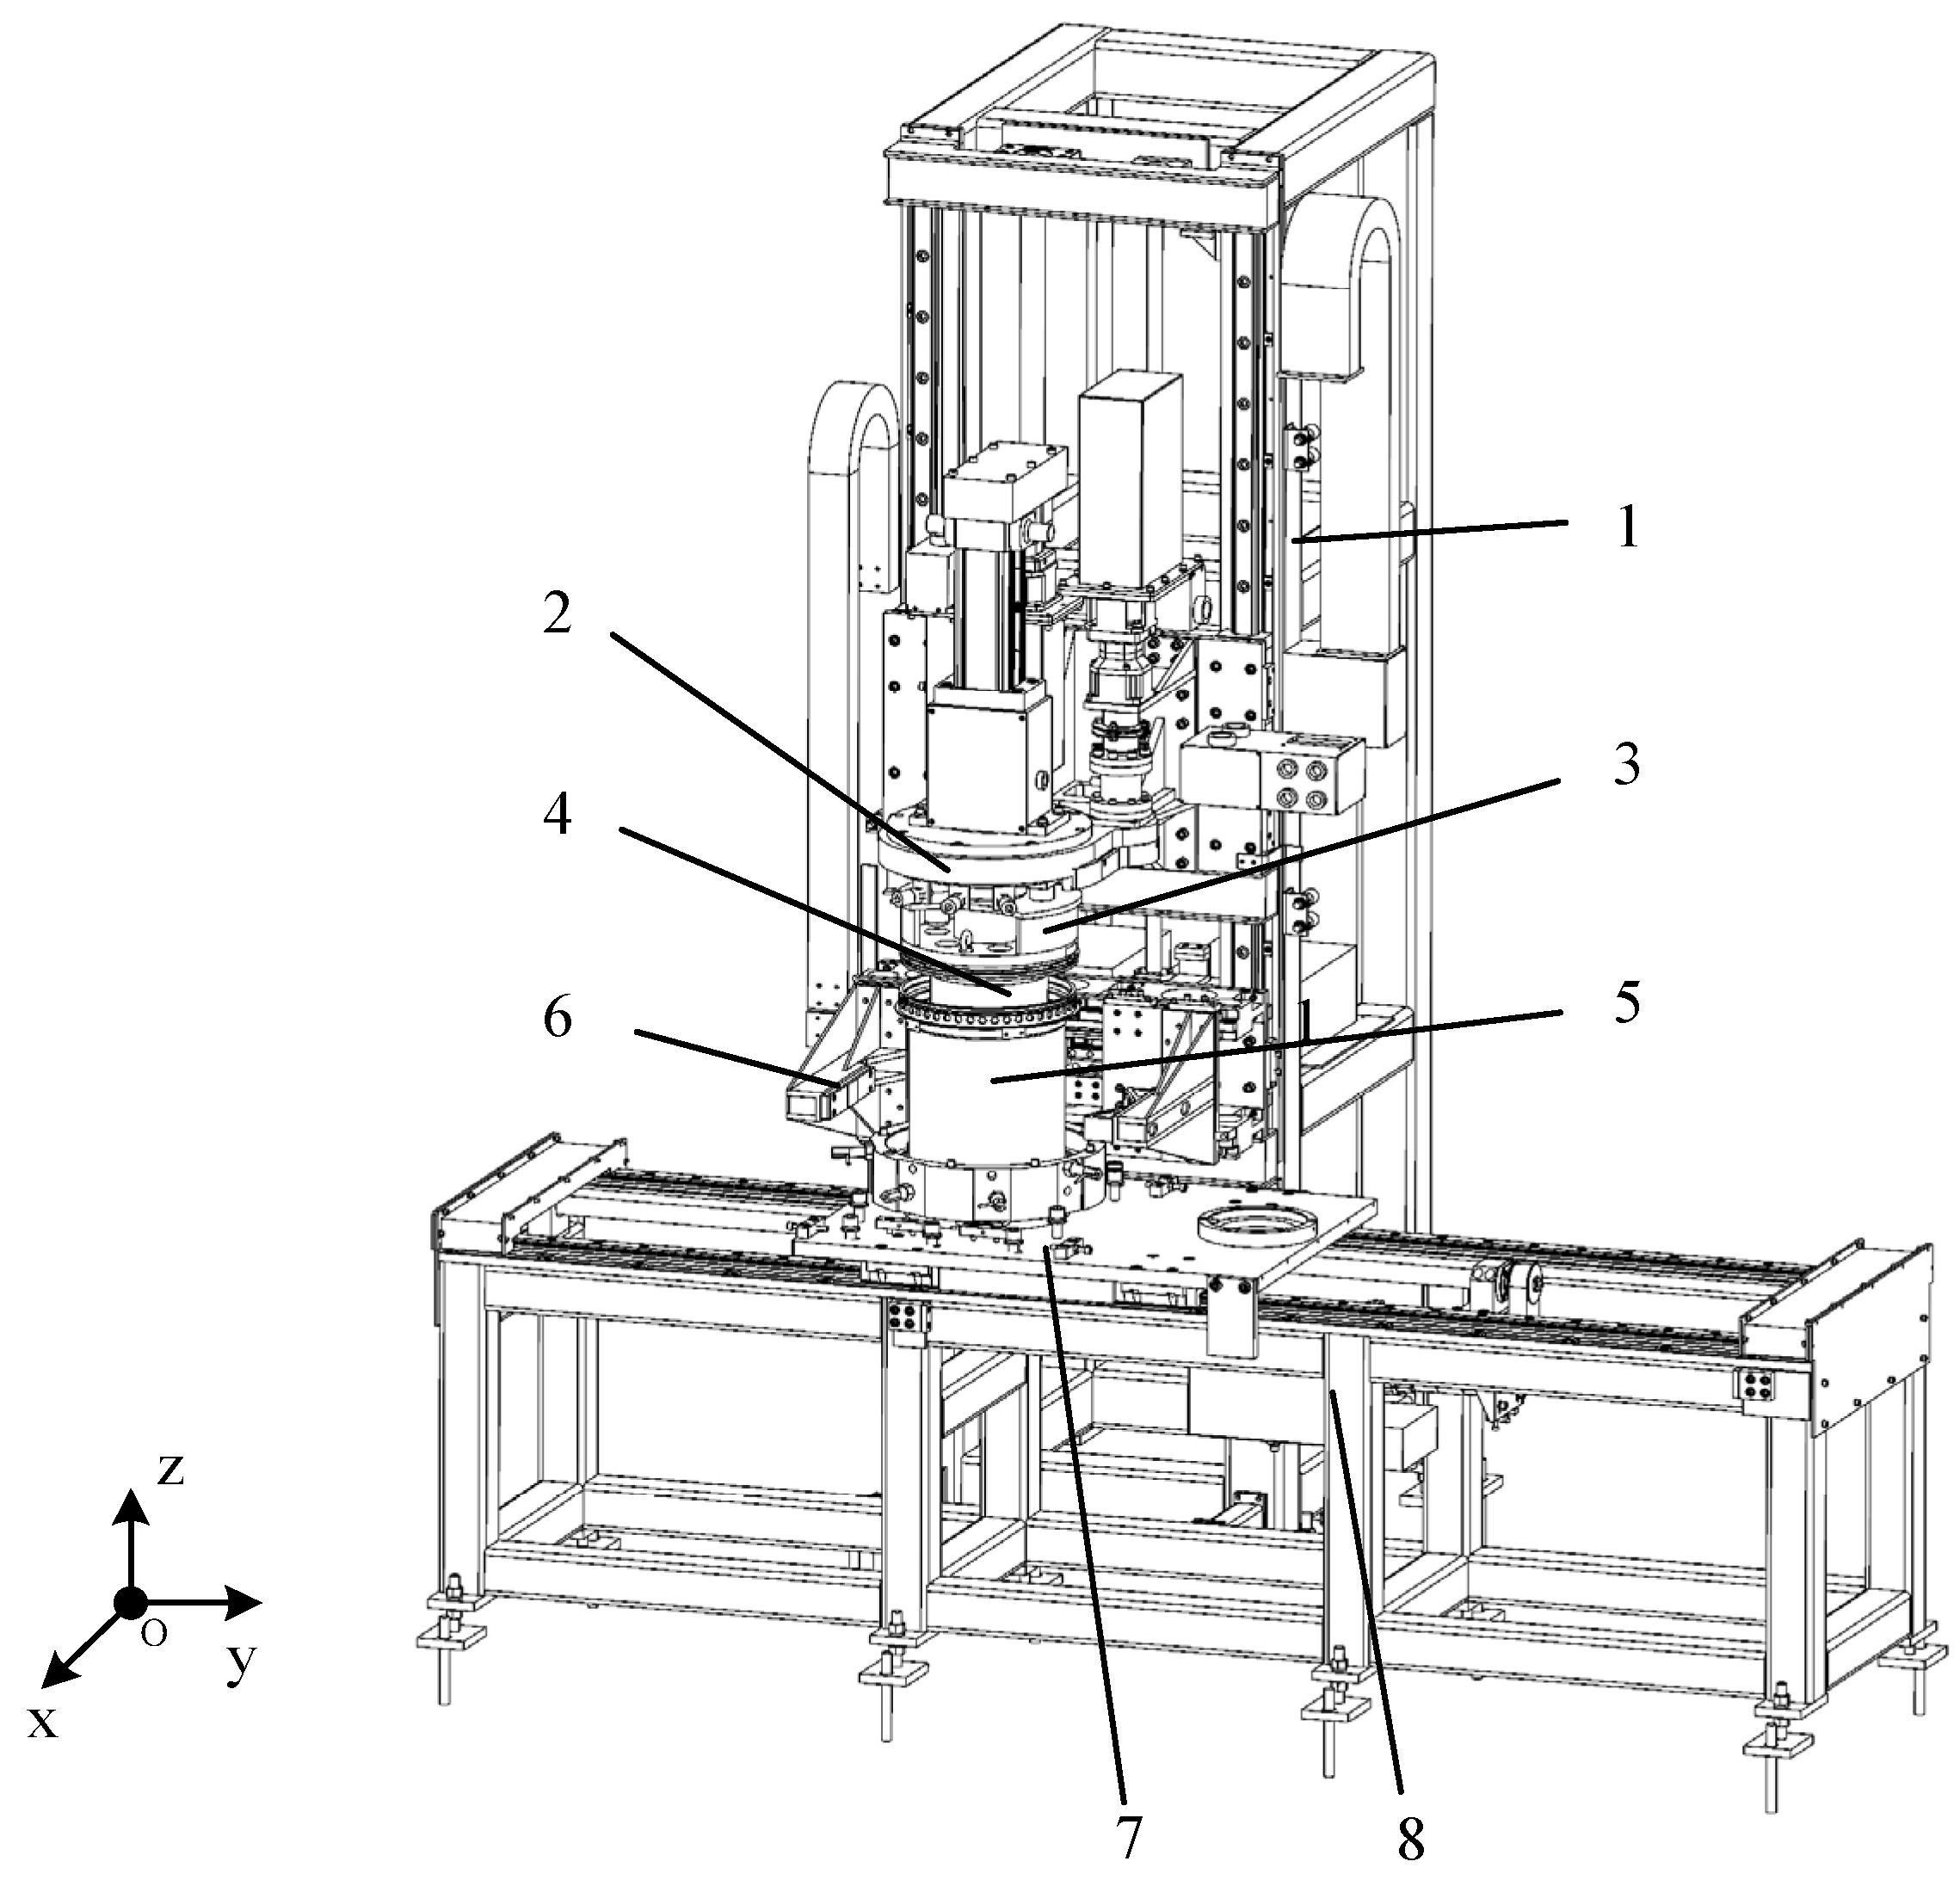
3.1. Introduction to the Structure of the Lateral Thrust Device
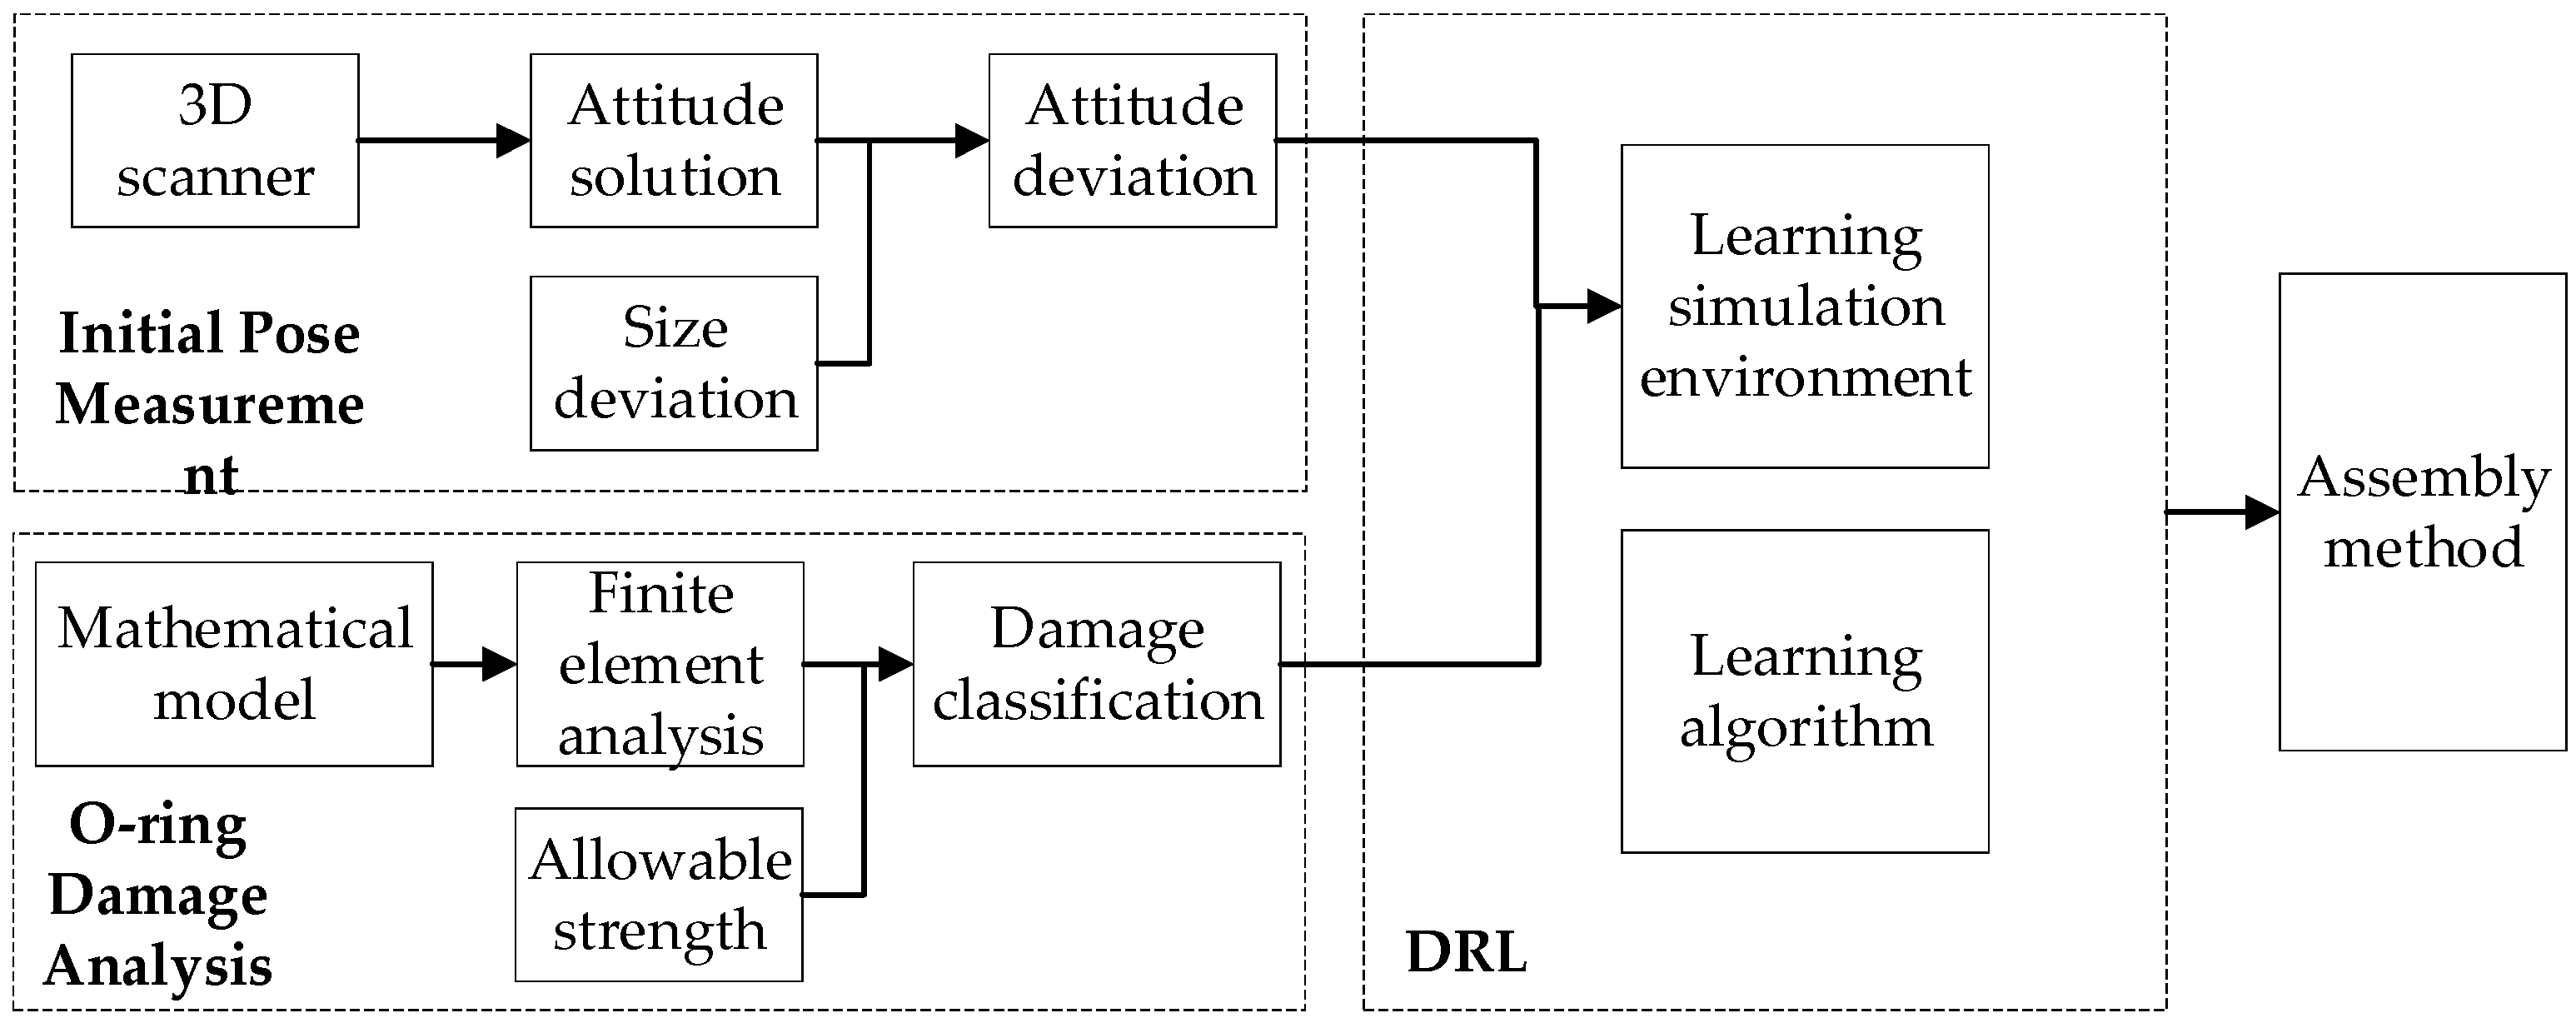
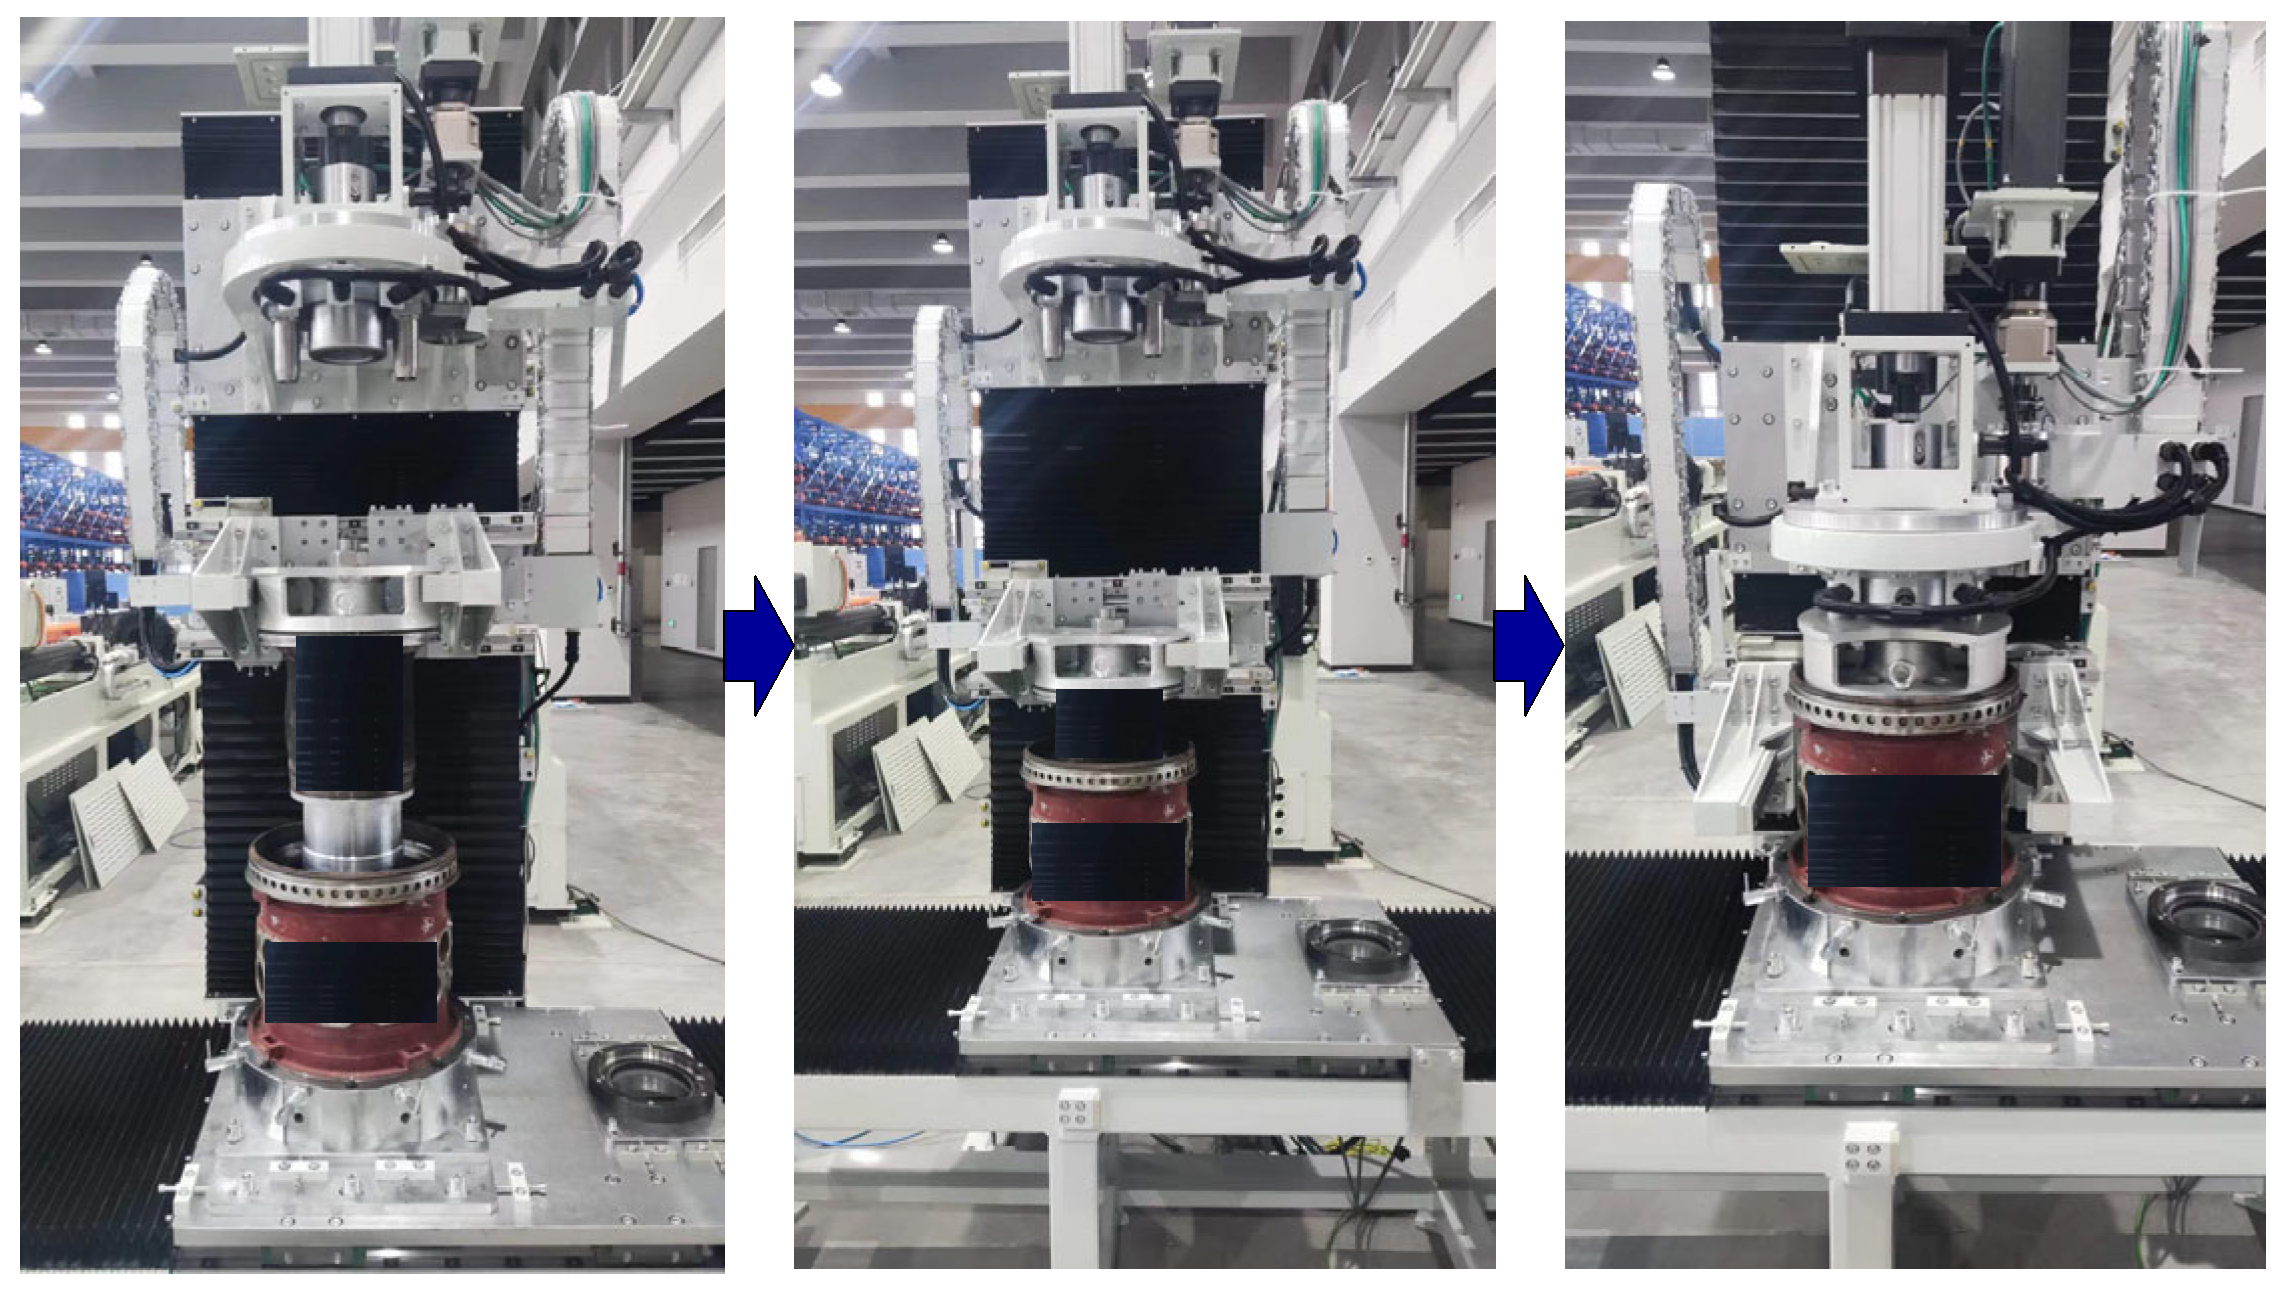
3.2. Assembly Method
4. Data Acquisition
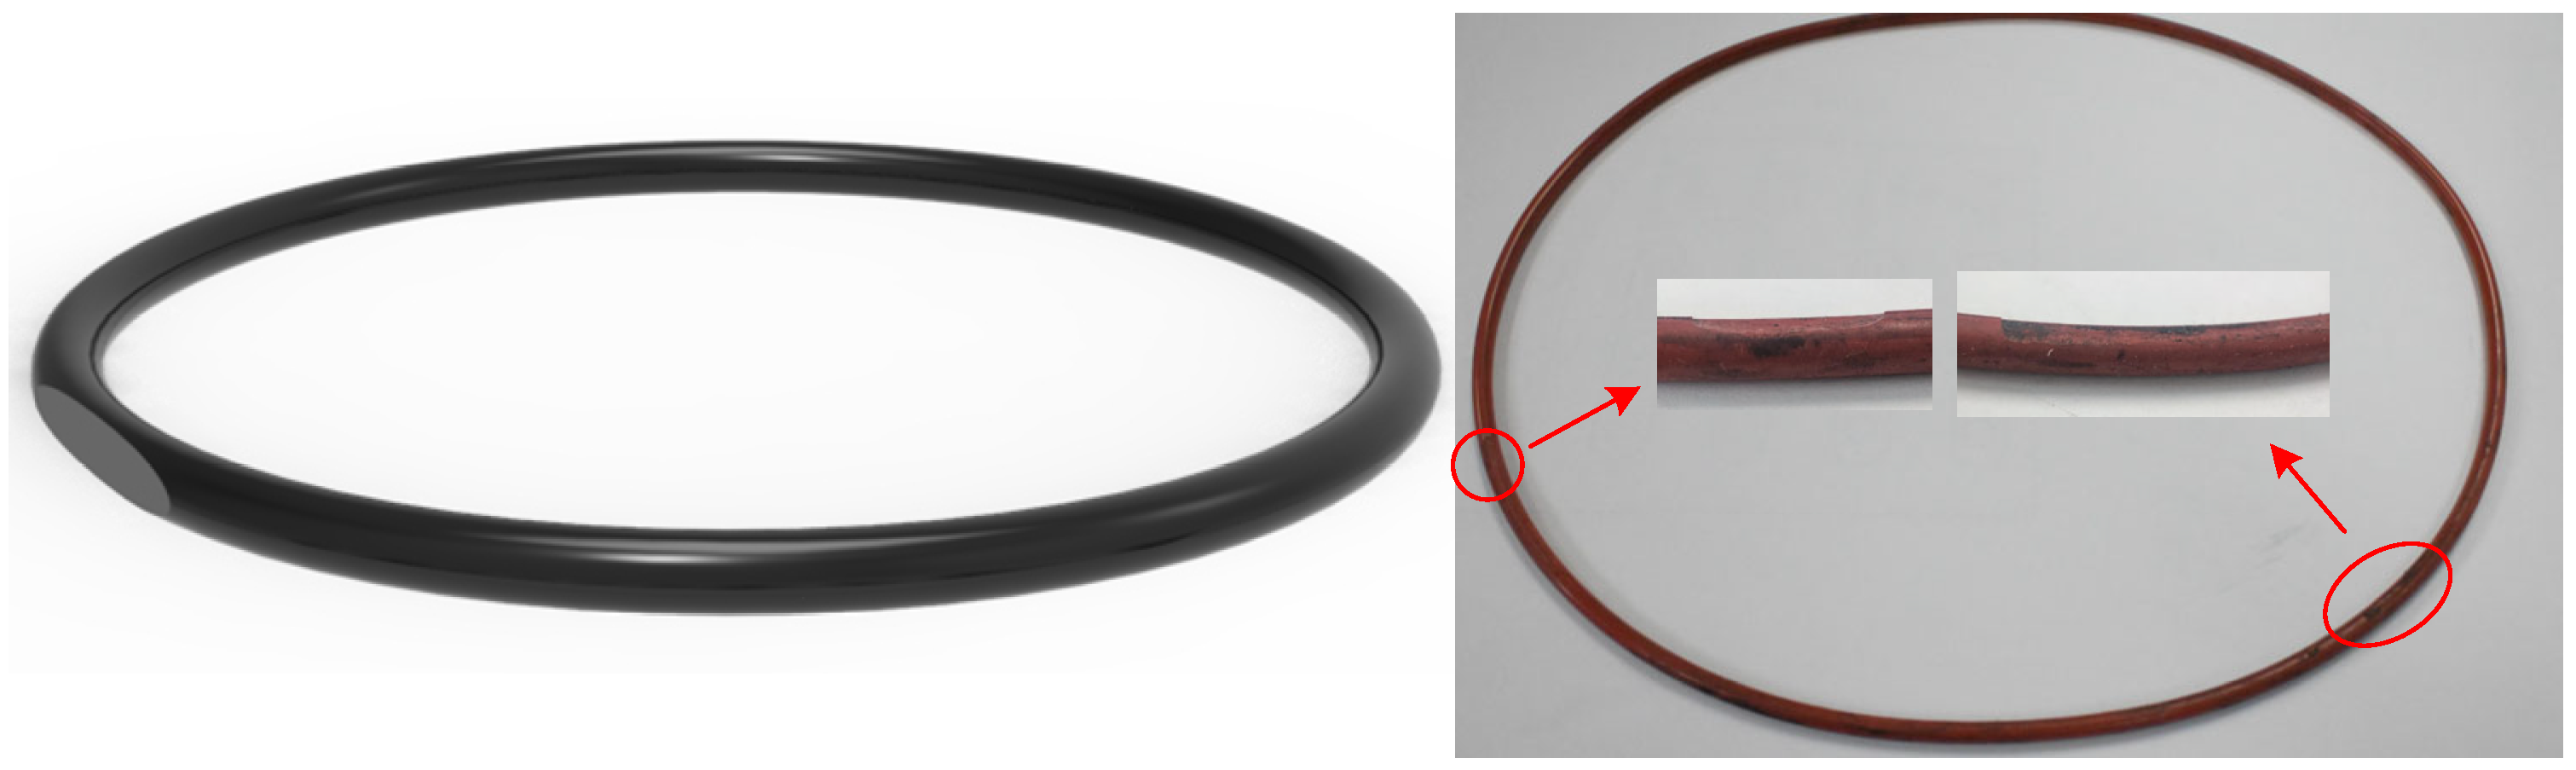
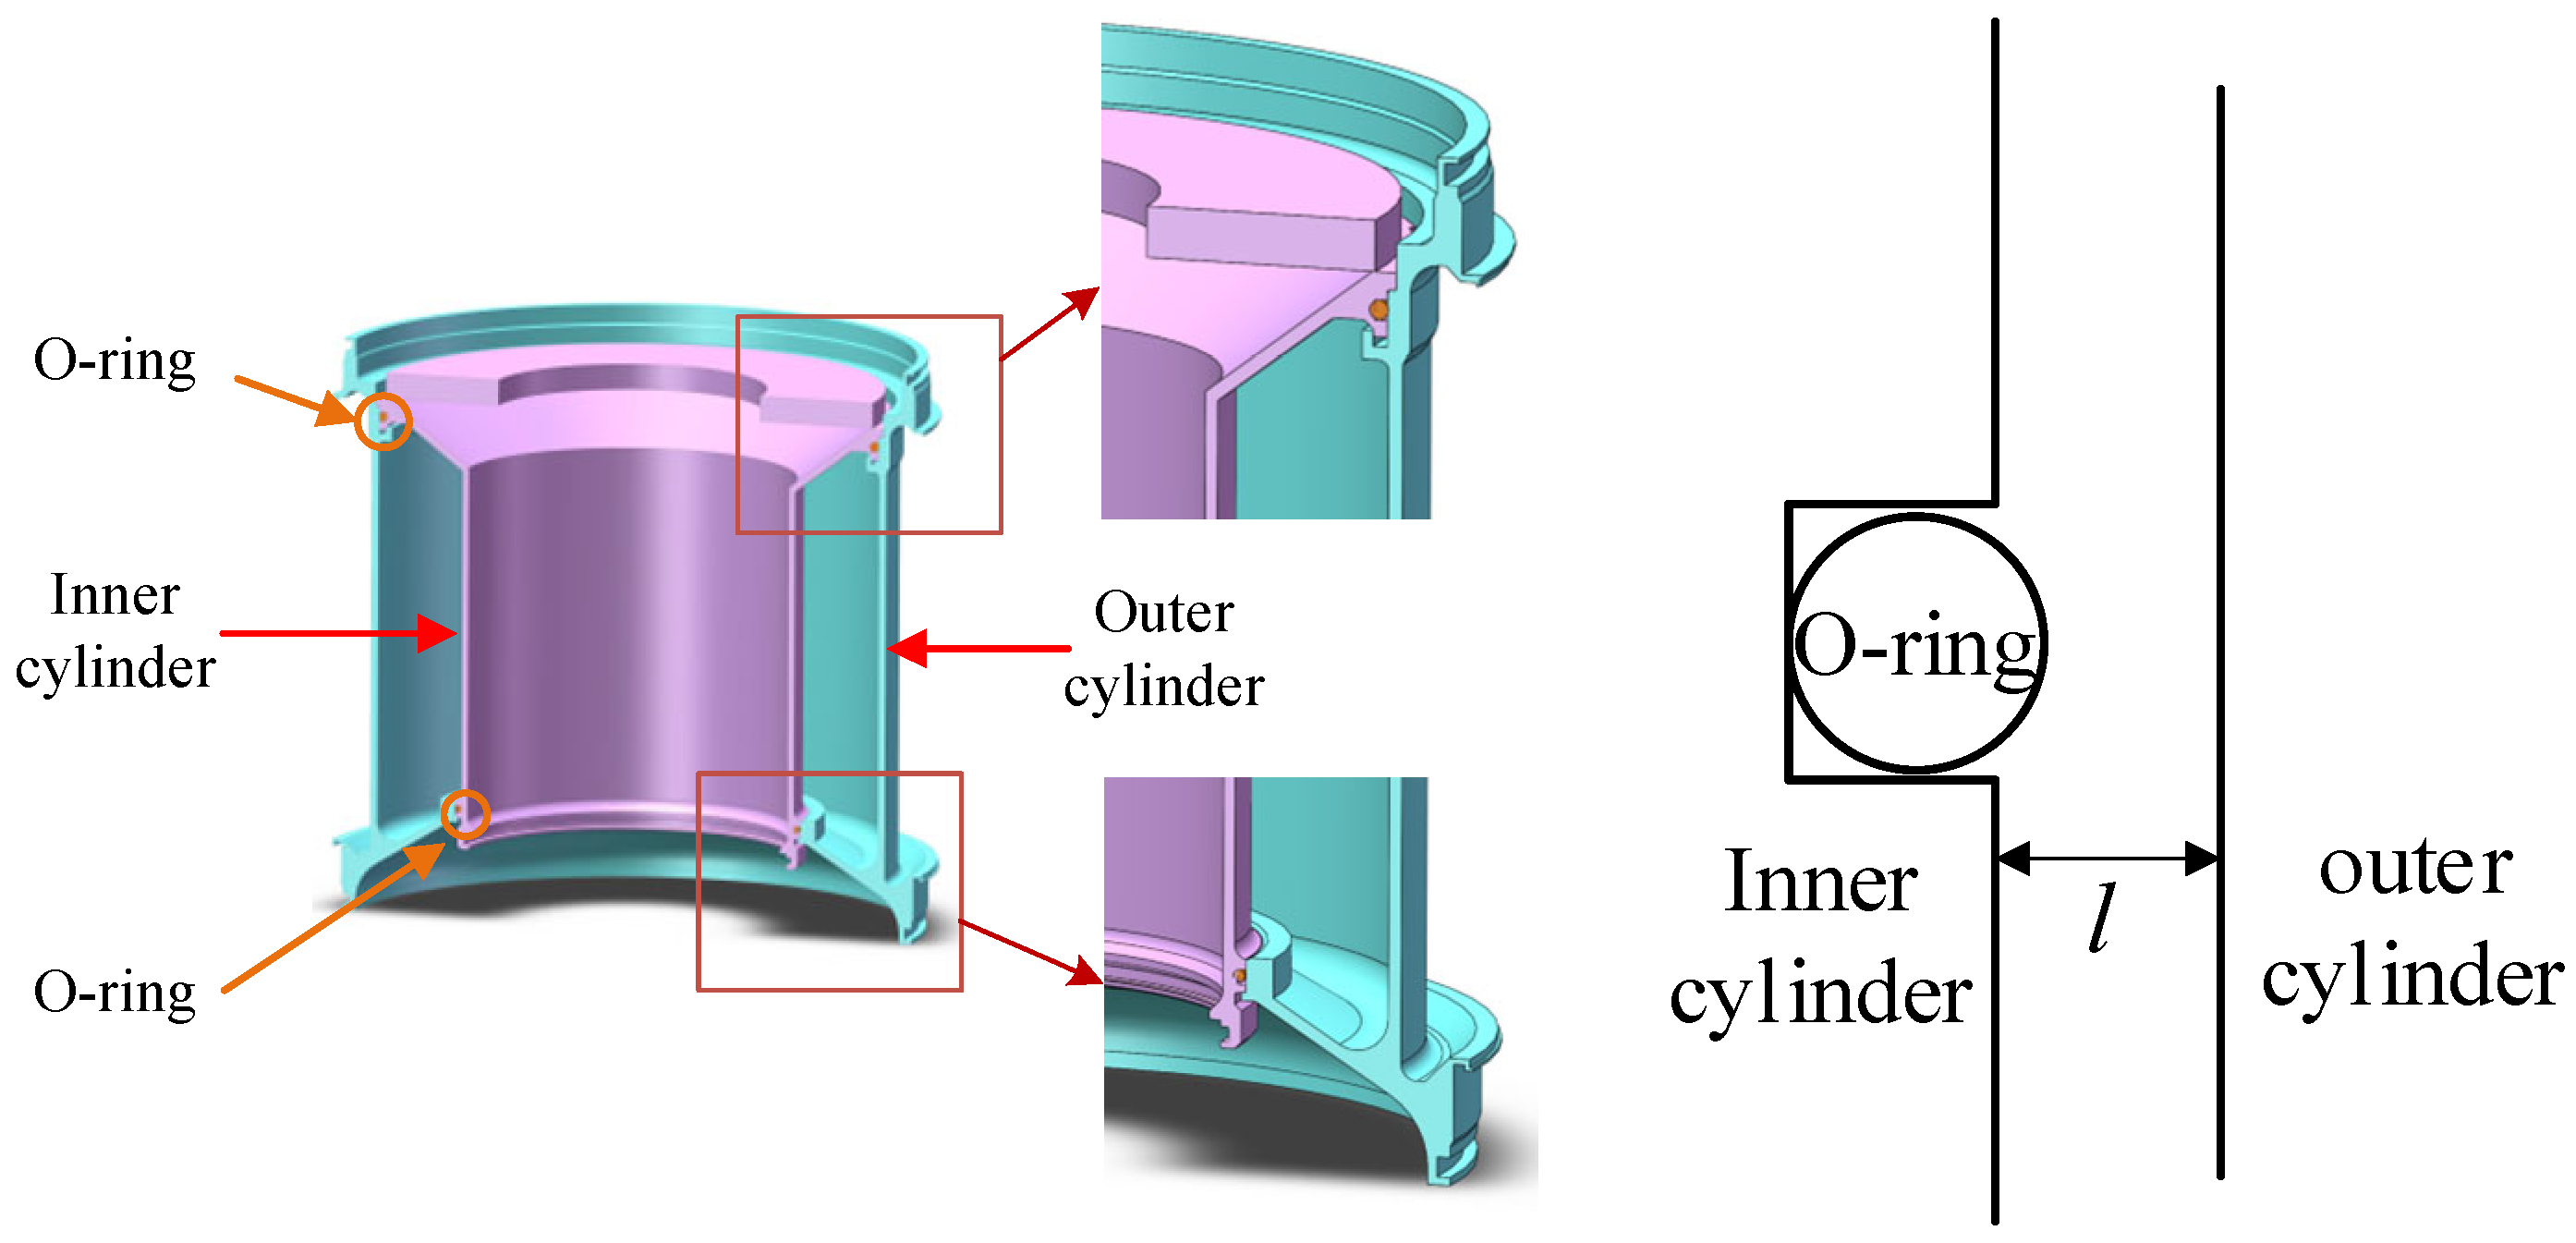
4.1. O-Ring Damage Analysis
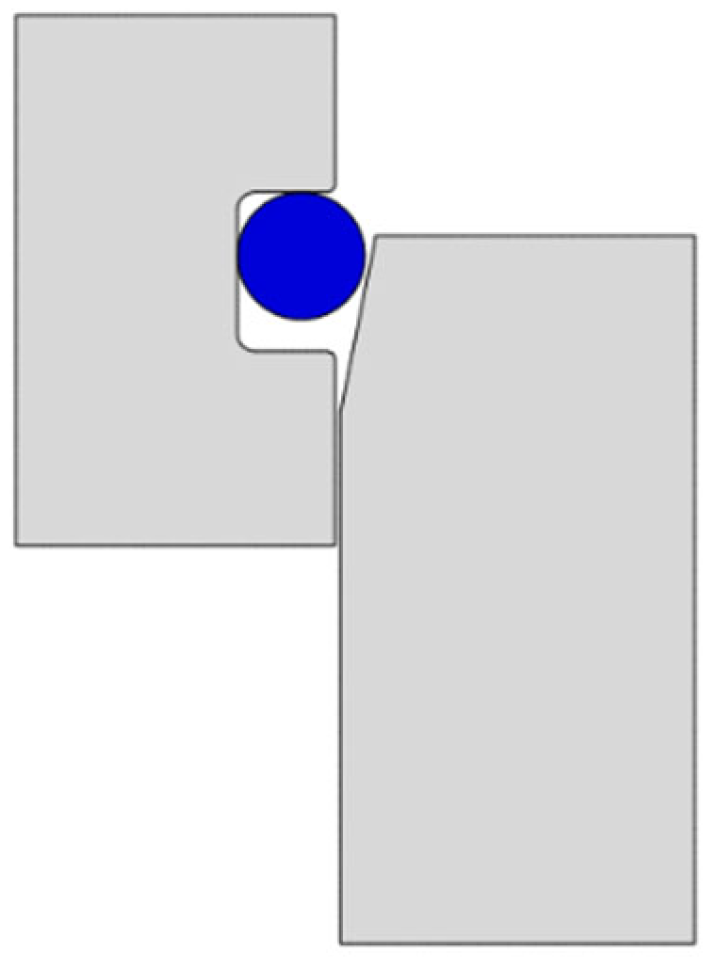
4.1.1. Theoretical Model
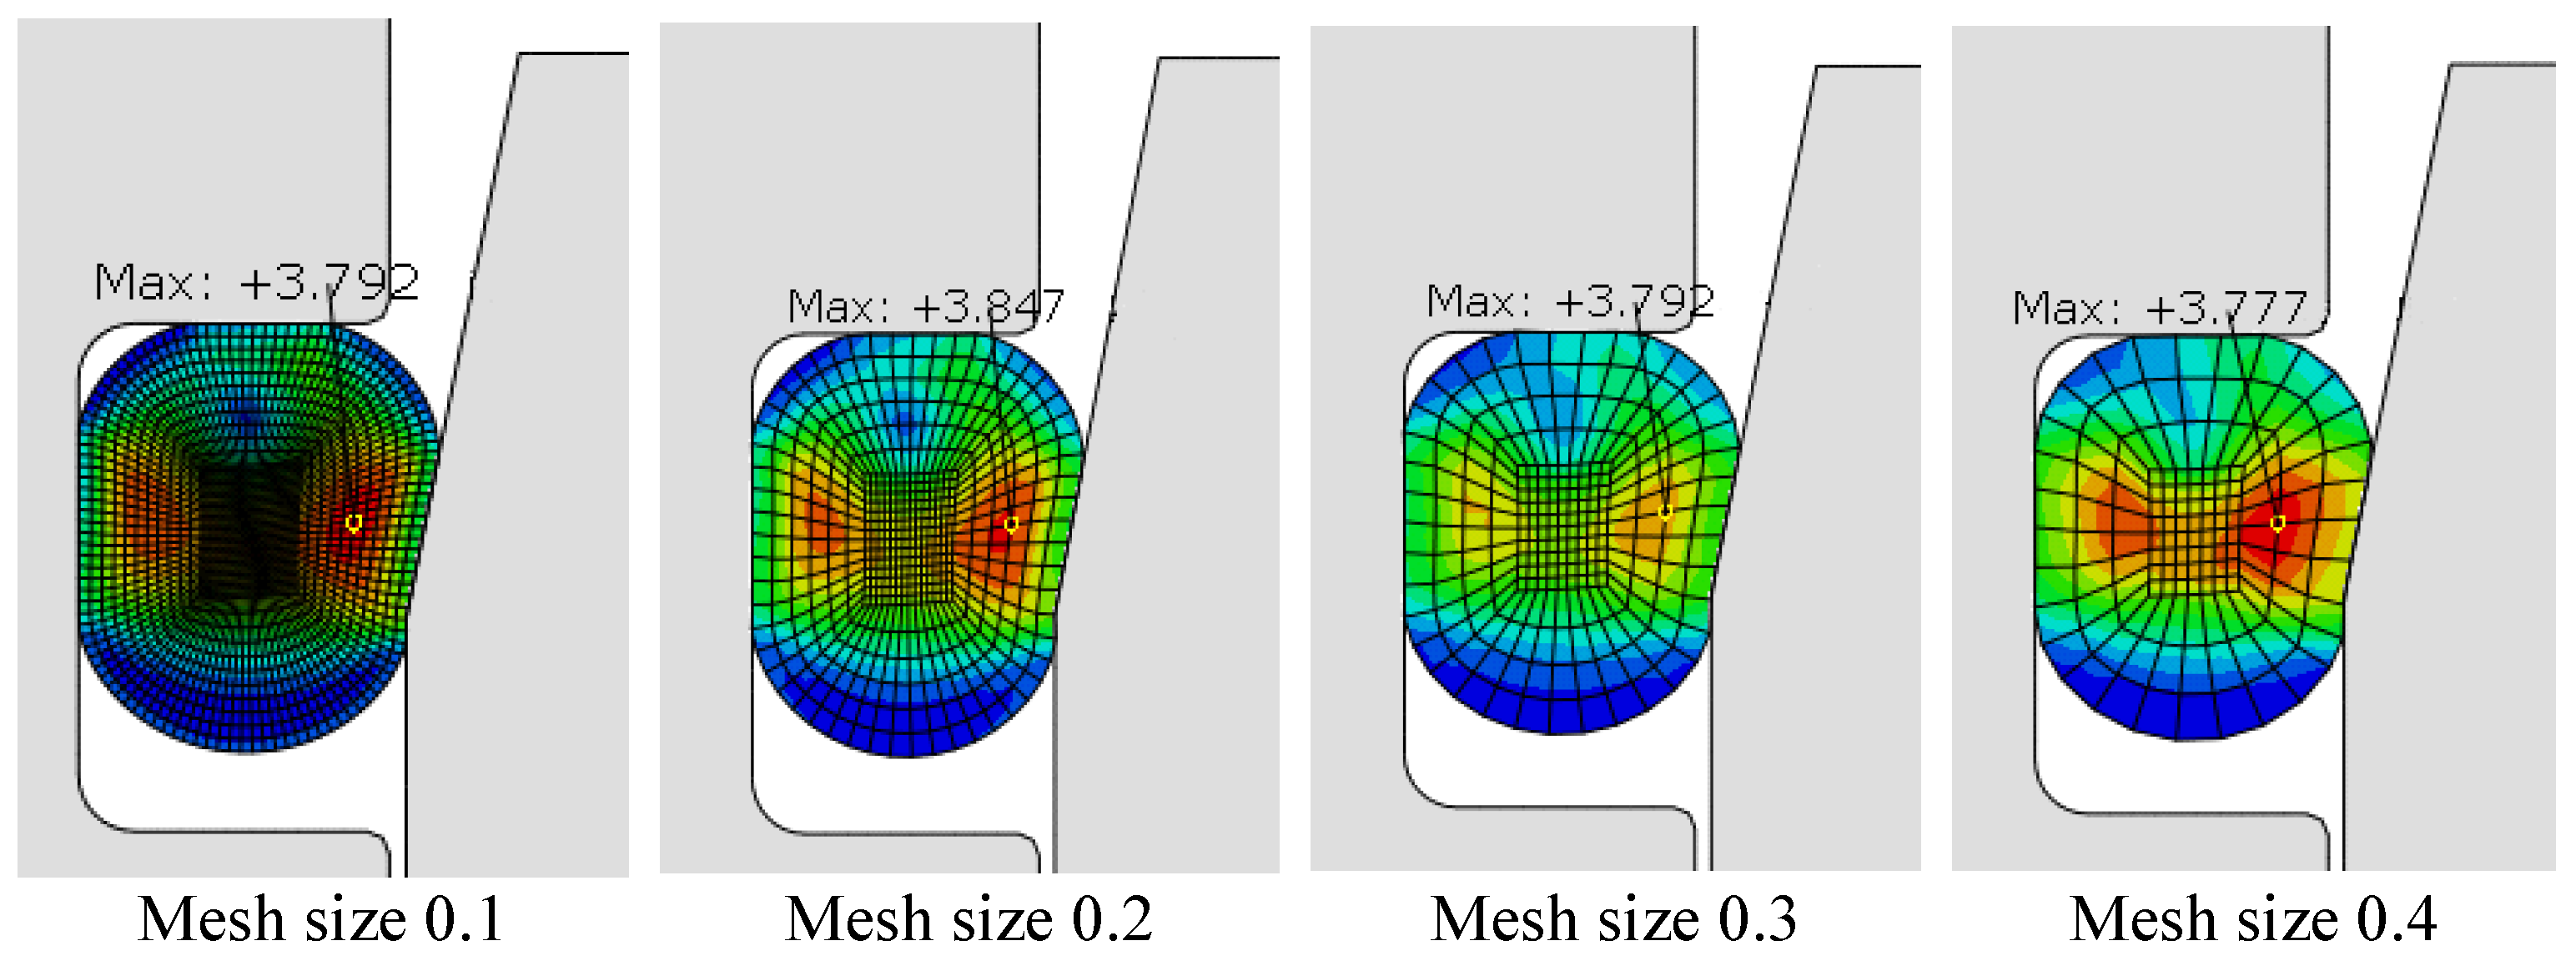
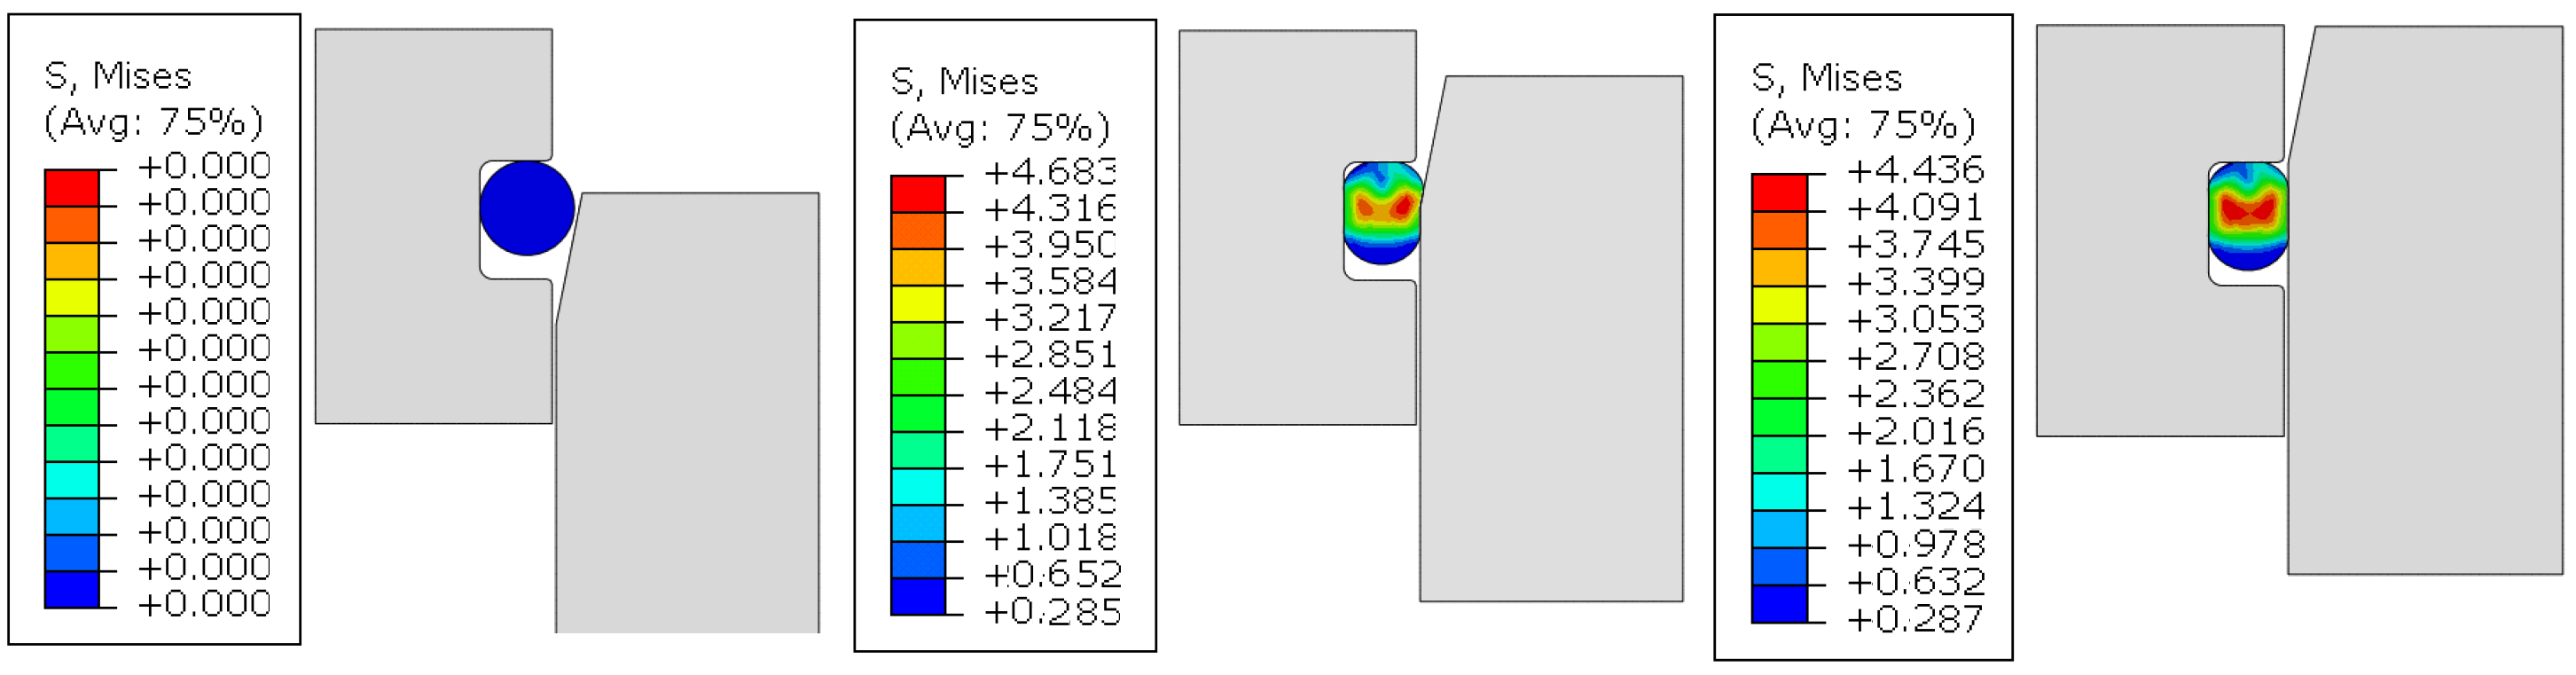
4.1.2. Establishment of Finite Element Model
- (1)
- The inner and outer cylinders were composed of rigid bodies;
- (2)
- The rubber material was isotropic and approximately incompressible;
- (3)
- Geometric nonlinearity effects were considered.
- (1)
- Ideal assembly process. The sealing structure of the inner and outer cylinders was considered axisymmetric and treated as rigid bodies. The O-ring was assumed to be defect-free and installed in a completely consistent state along the circumferential direction. The stress distribution of the O-ring under different assembly conditions was obtained through simulation. During the assembly process, axial displacement was applied to simulate the pre-assembly process of the O-ring, aligning with the actual ideal assembly process.
- (2)
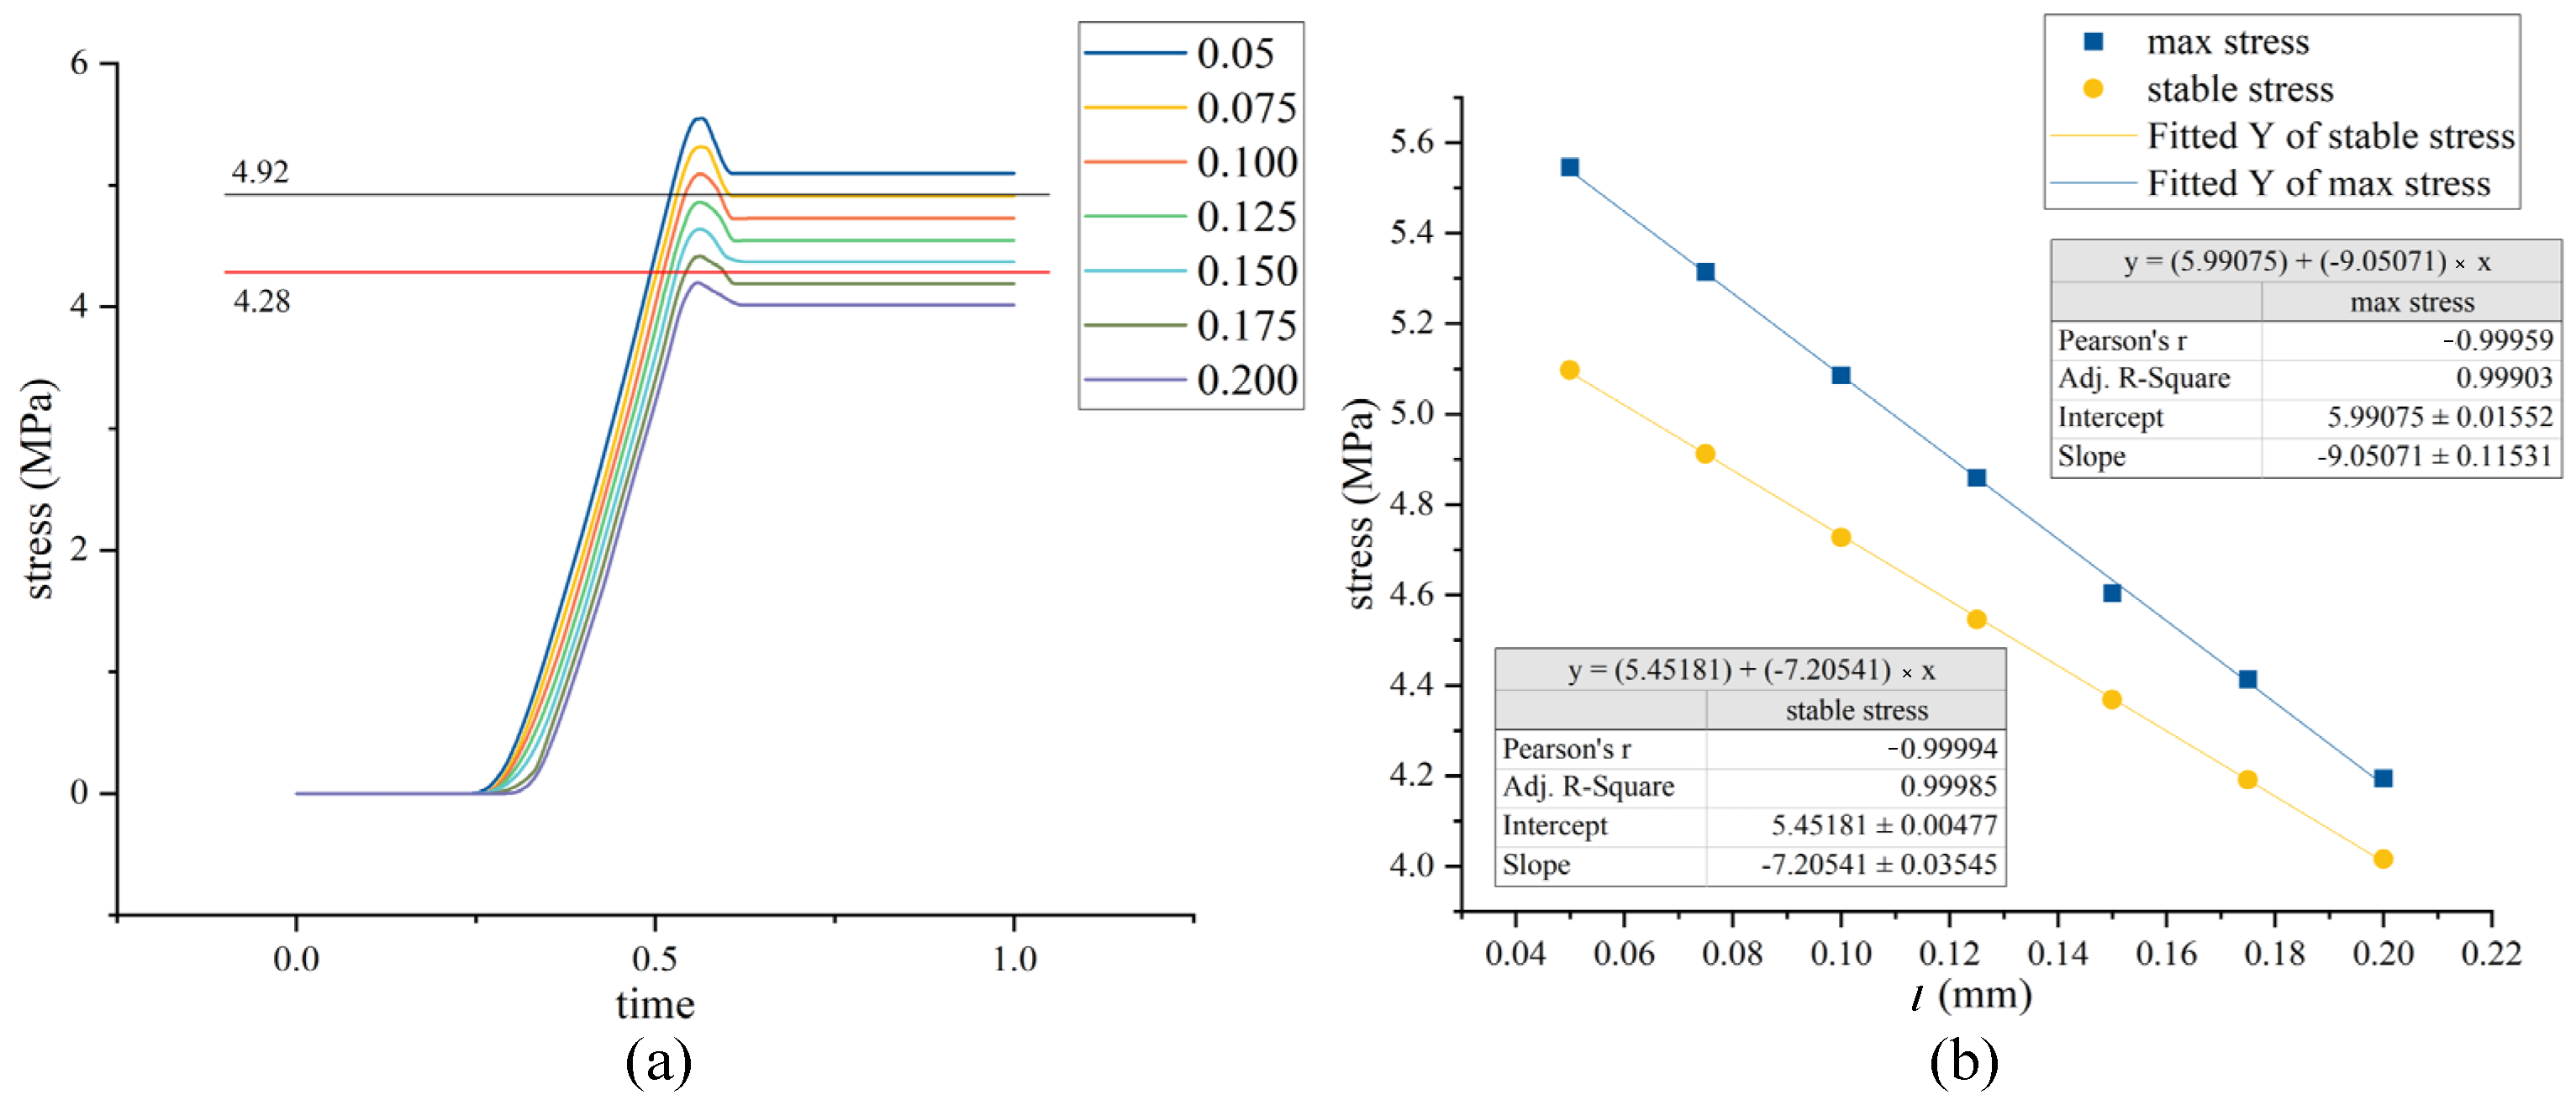
- General assembly process. The eccentricity value was periodically adjusted until it exceeded the stress limit of the O-ring, reaching the maximum eccentricity value. This was performed to simulate the general assembly process of the O-ring and the situation where the O-ring is damaged due to stress.
4.1.3. Eccentric Assembly Parameter Analysis
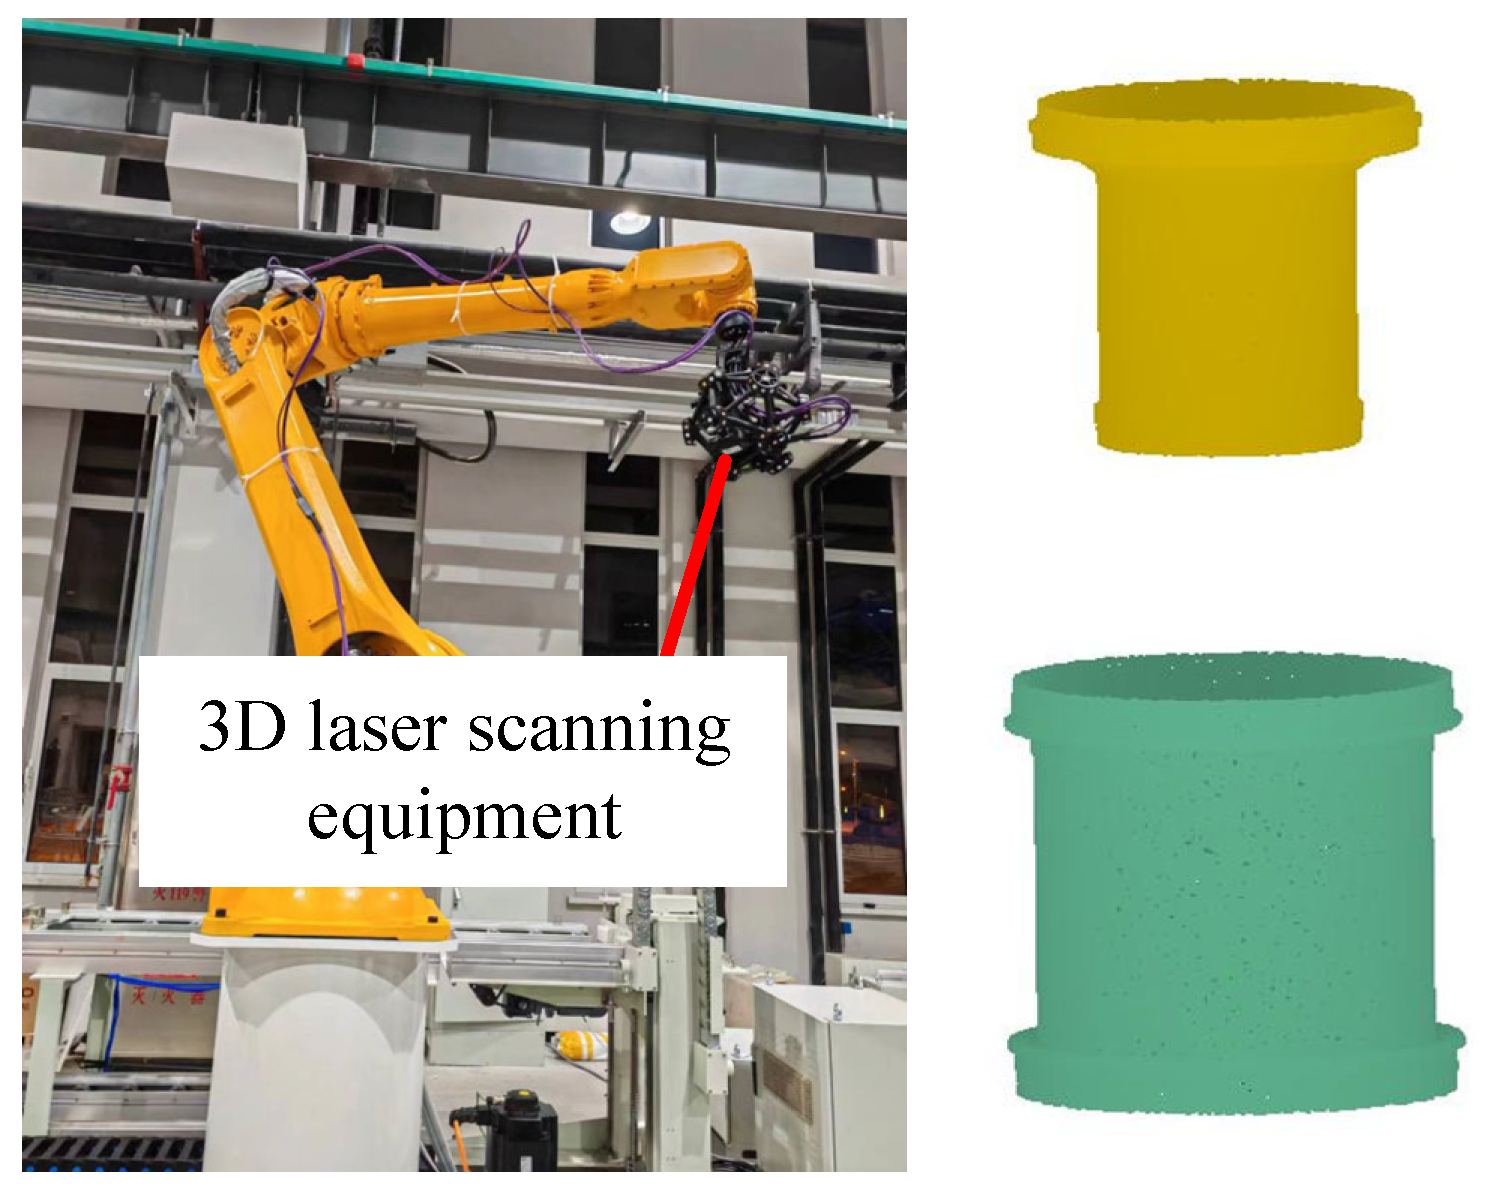
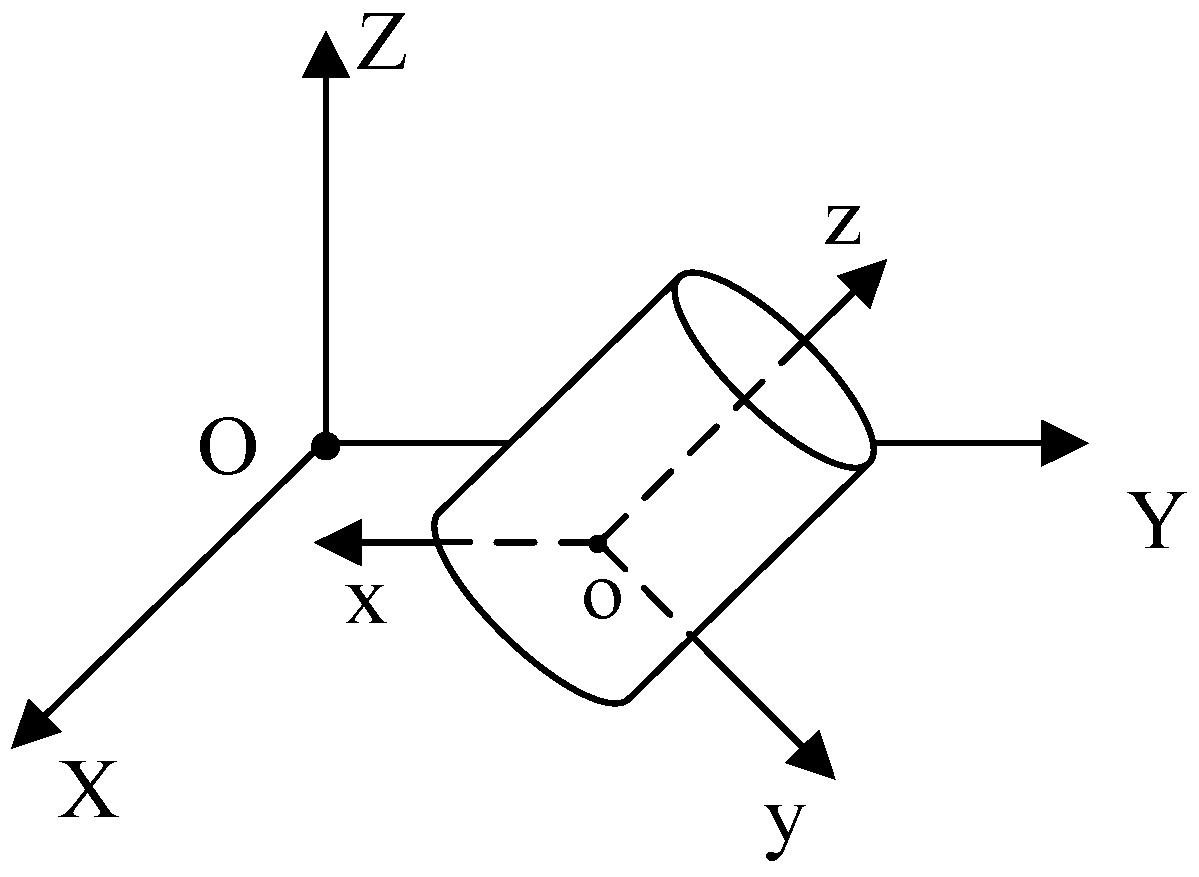
4.2. Initial Assembly Pose Measurement Analysis
5. Assembly Path Planning Based on DRL
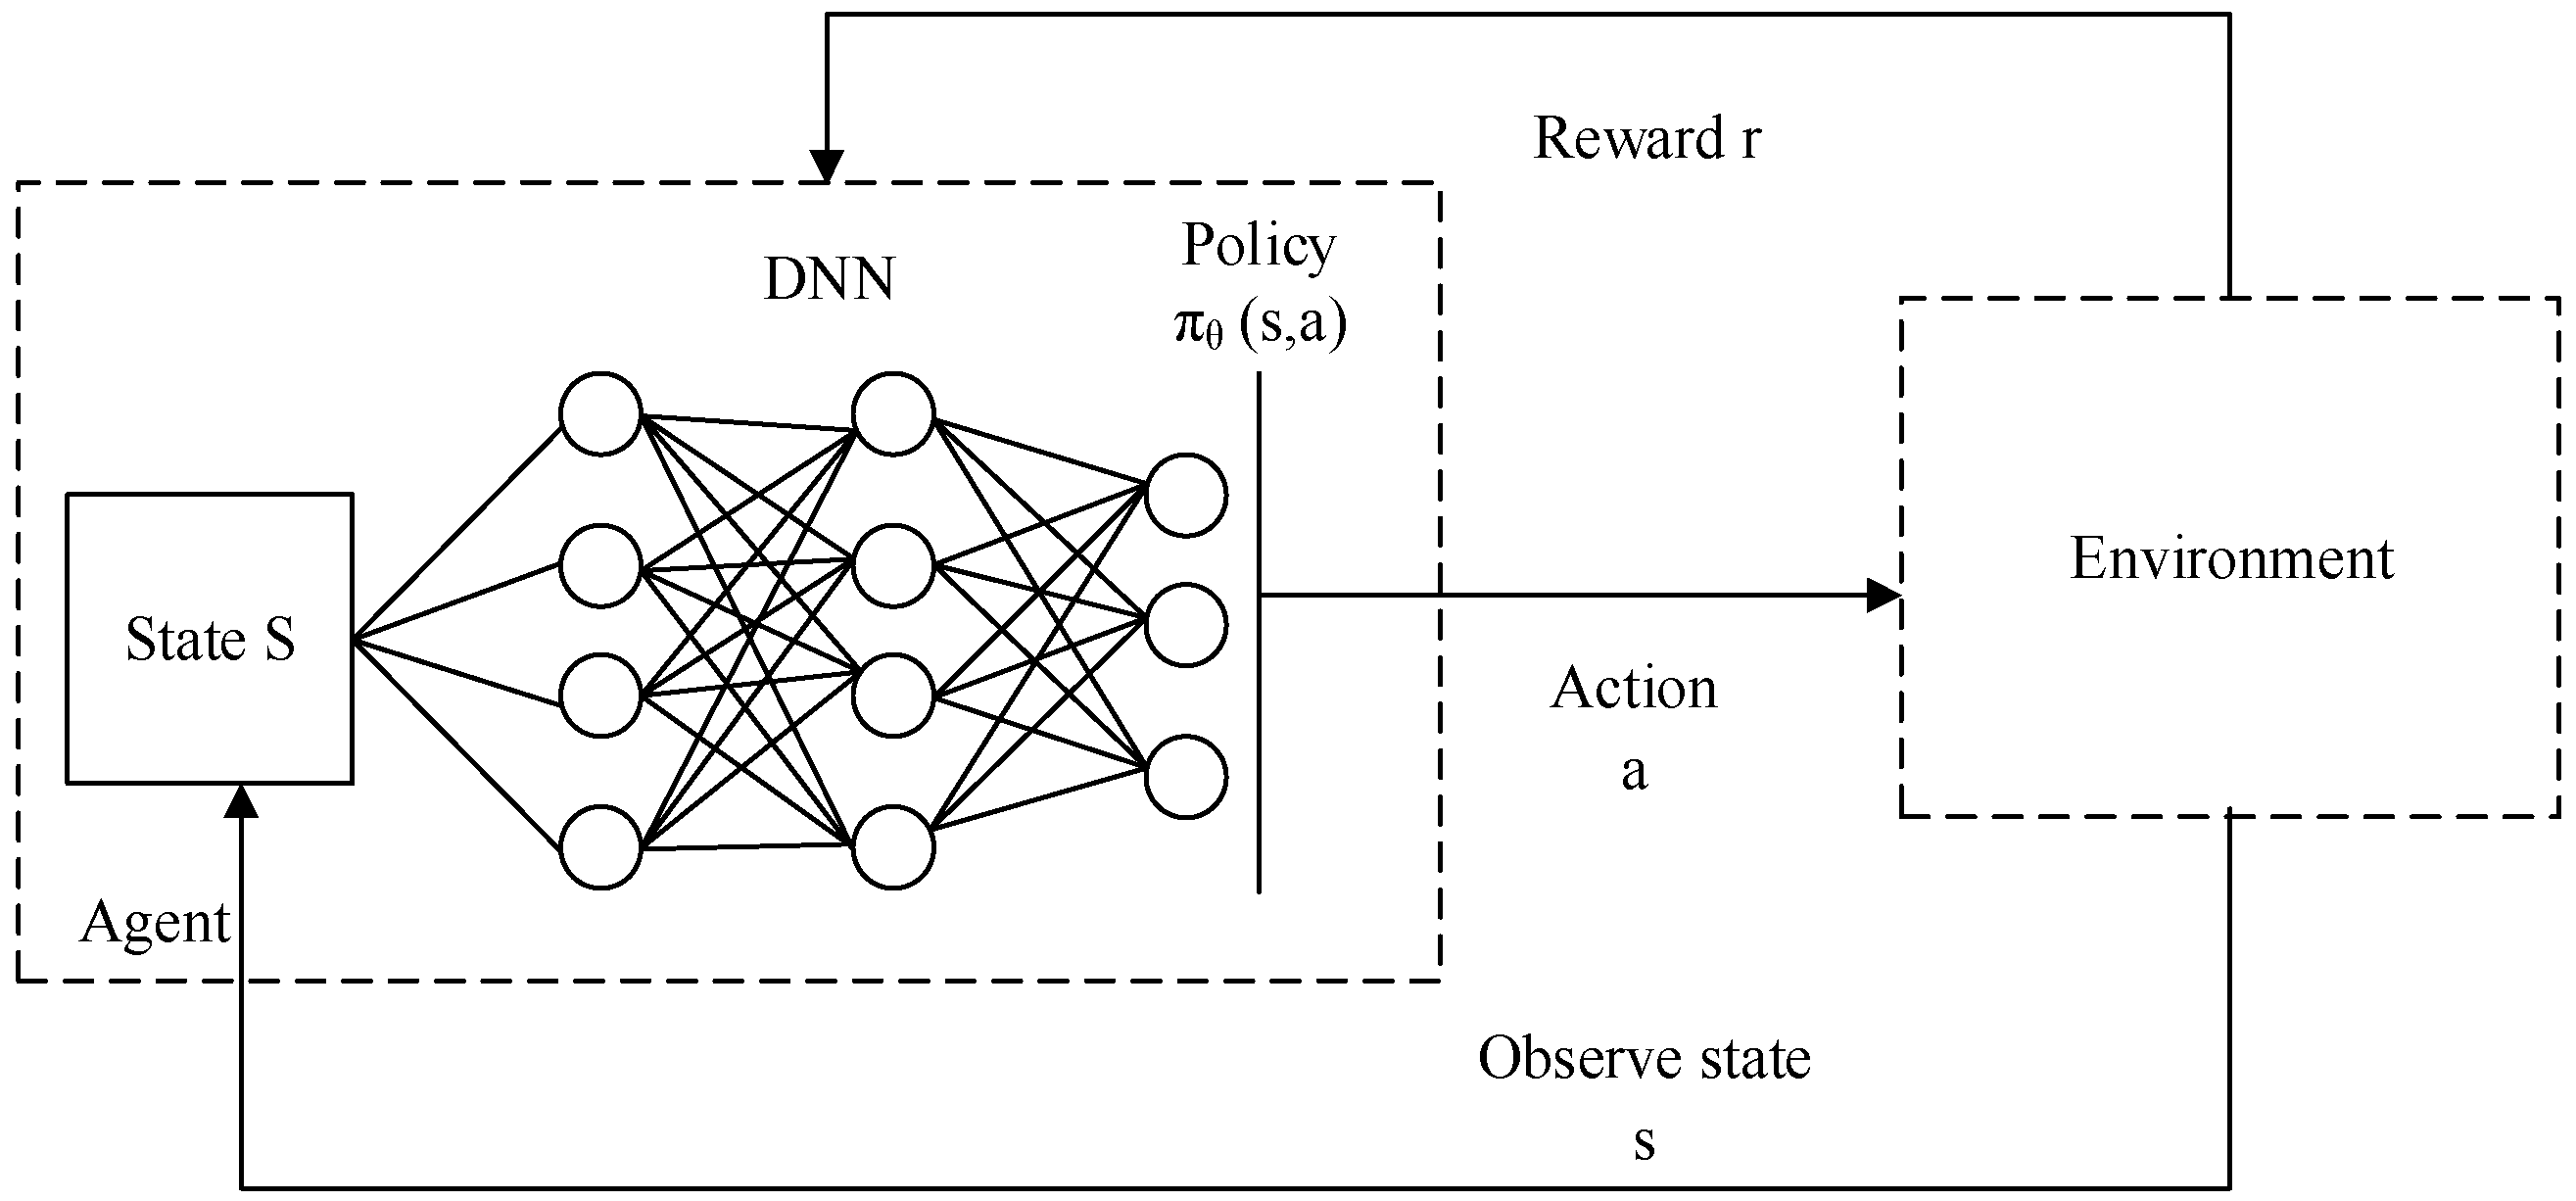
5.1. Learning Algorithm
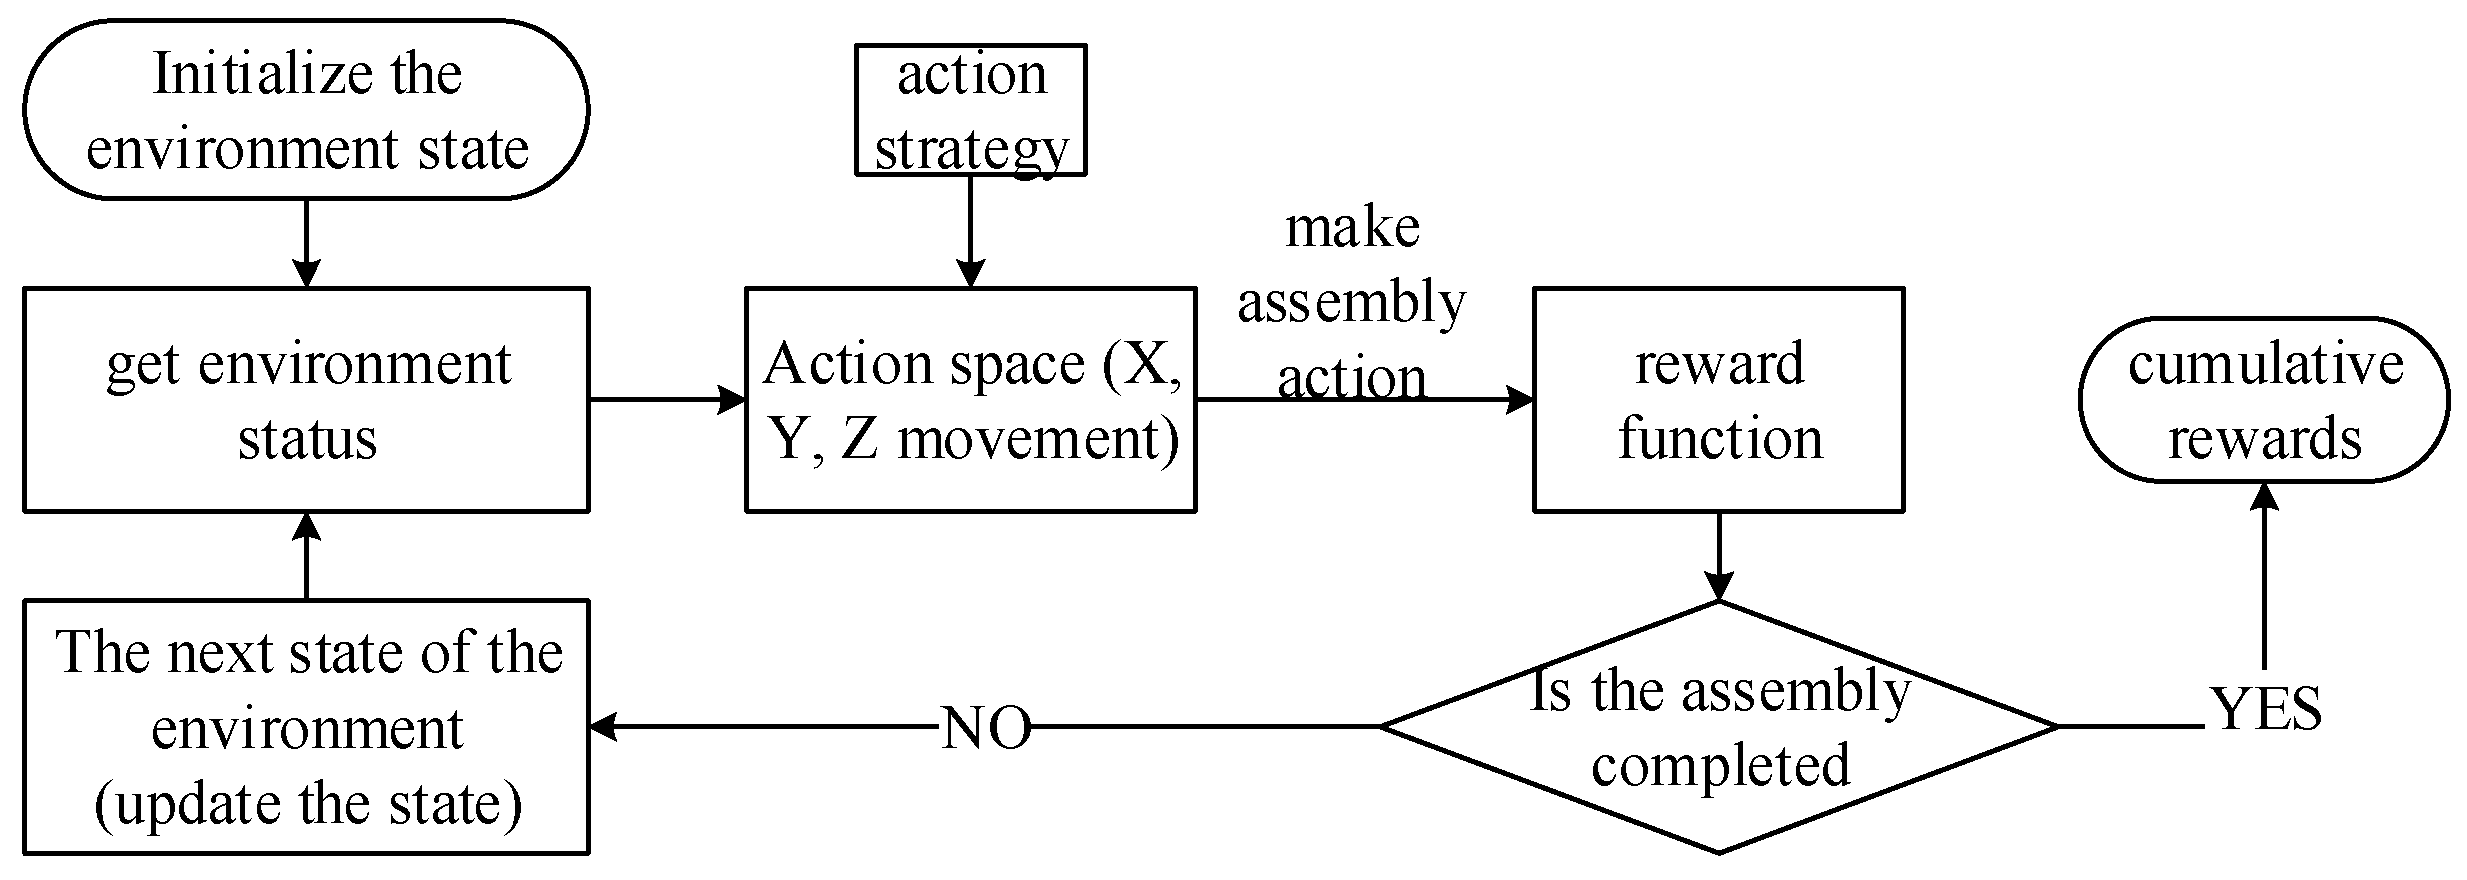
5.2. Setting Up the Learning Environment
- (1)
- Environment State (S): The design of the original features of the DRL environment state is crucial. The schematic diagram of the state space is shown in Figure 16. In this study, the design of the original state aimed to fully capture the states that lead to assembly quality issues during the assembly process. The relative positions between the inner and outer cylinders served as the state environment. Based on the previous analysis of assembly deviations, the various deviation ranges present in the initial assembly were used as randomly selected ranges for initialization. These ranges were then superimposed to form the initial state of the environment, reproducing the deviation issues that affect assembly quality.
- (2)
- Action Space (A): Actions are the choices made by the agent, and the state is updated based on the chosen actions. In this study, the motion in the X, Y, and Z directions constituted the action space. Since the inner and outer cylinders were an axisymmetric model, we only needed to set the deviation and action on the YOZ plane, and the minimum precision value was used as the discrete action value.
- (3)
- Reward (R): The reward is the feedback obtained by the agent after performing an action, guiding the agent’s learning process. At each time step, the reward obtained by the agent for taking action A in state S was denoted as R. Different from the sparse reward function, this paper added a linear reward value between reaching the target point and exceeding the assembly range. This part of the reward value was set based on the linear relationship between db obtained from simulation and assembly stress.
- (4)
- Policy (π): The policy is the action strategy specified to explore the environment thoroughly. It combines random actions with the actions taken by the agent to determine the final appropriate action. An ε-greedy strategy was employed as the action policy for selecting actions.
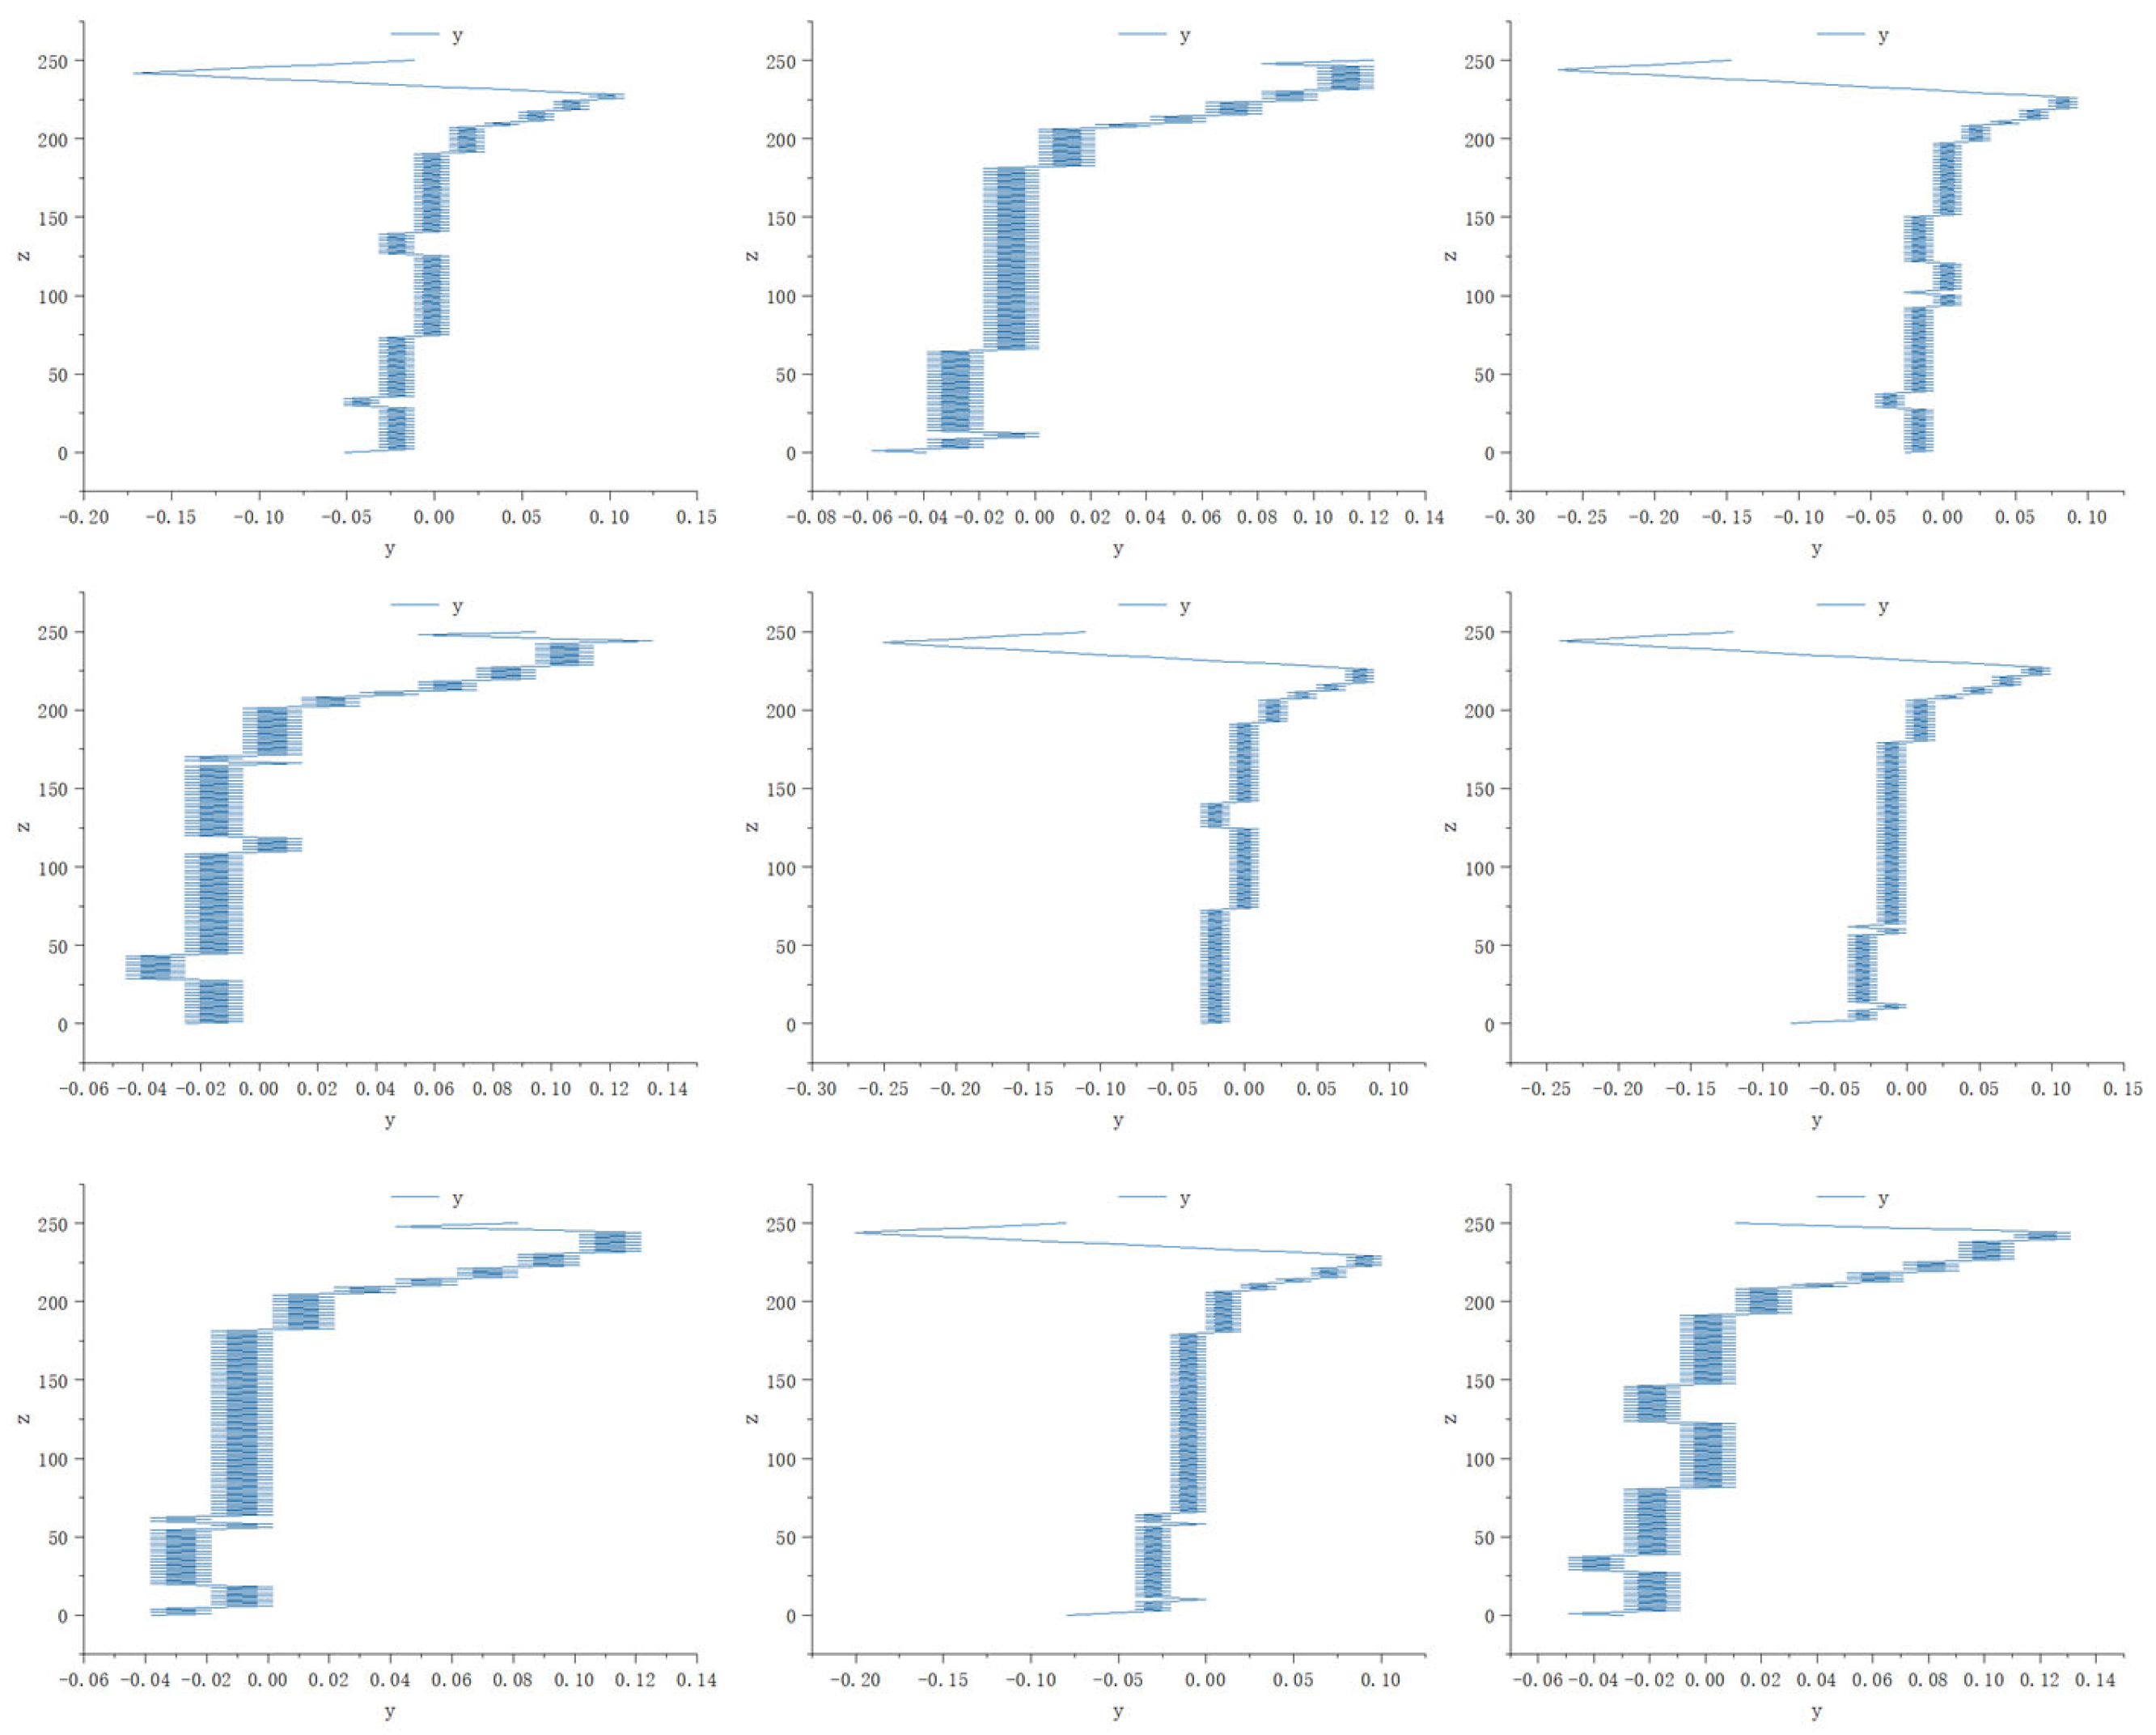
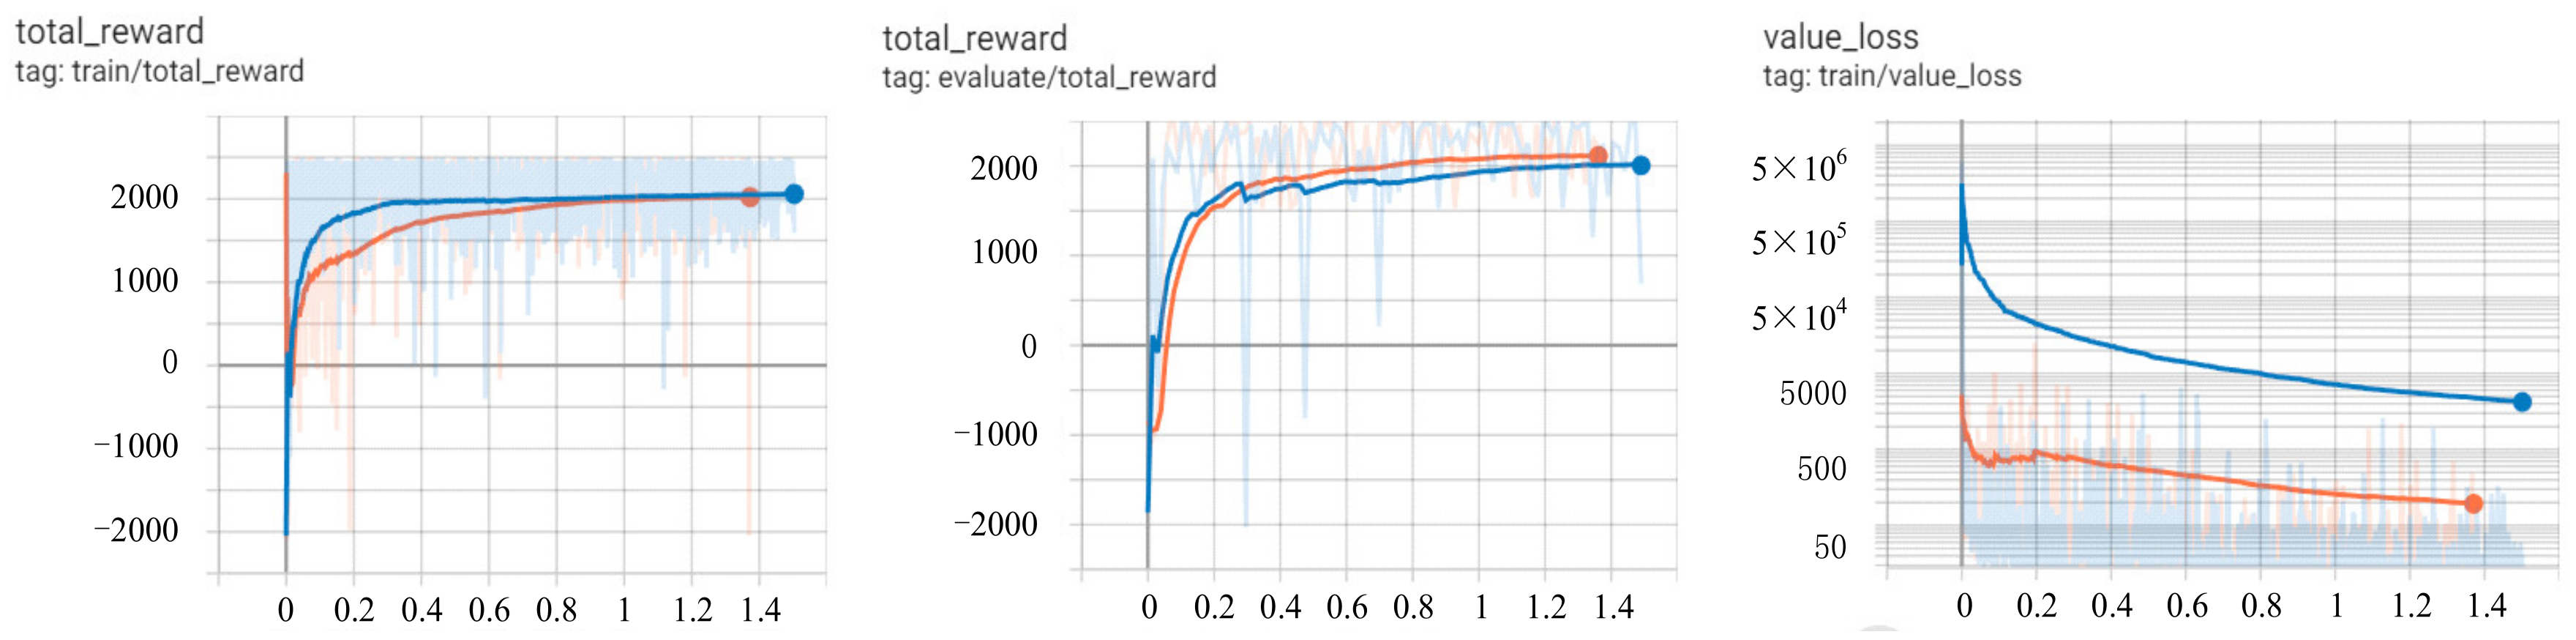
5.3. Analyzing Training Results
6. Experiment and Analysis
7. Conclusions
- (1)
- In precision assembly processes with flexible media, the initial posture deviation between the assembled objects affects the assembly quality;
- (2)
- O-ring damage is related to the compression value, and it can be determined whether the O-ring has reached the required stress value by evaluating the deviation value;
- (3)
- Using DRL algorithms to plan the assembly path for guiding the assembly is a feasible method, resulting in viable assembly paths that effectively guide the assembly operation.
Author Contributions
Funding
Data Availability Statement
Conflicts of Interest
References
- Han, Z.; Da, W.U.; Xudong, W.; Rugen, W. Numerical Simulation of Lateral Jet of Micro Pulse Solid Rocket Motor. J. Proj. Guid. 2016, 6, 92–96. (In Chinese) [Google Scholar] [CrossRef]
- Jiwei, L.; Junwei, C.; Guorui, W.; Zeyuan, Z. Parameter Analysis of Assembling Rubber O Ring Based on Finite Element. Aero Weapon. 2017, 6, 72–76. (In Chinese) [Google Scholar] [CrossRef]
- Dietrich, F.; Buchholz, D.; Wobbe, F.; Sowinski, F.; Wahl, F.M. On Contact Models for Assembly Tasks: Experimental Investigation beyond the Peg-in-Hole Problem on the Example of Force-Torque Maps. In Proceedings of the 2010 IEEE/RSJ International Conference on Intelligent Robots and Systems, Taipei, Taiwan, 18–22 October 2010. [Google Scholar]
- Thomas, G.; Chien, M.; Tamar, A.; Ojea, J.A.; Abbeel, P. Learning Robotic Assembly from CAD. In Proceedings of the 2018 IEEE International Conference on Robotics and Automation (ICRA), Brisbane, QLD, Australia, 21–25 May 2018; pp. 3524–3531. [Google Scholar]
- Huang, S.; Murakami, K.; Yamakawa, Y.; Senoo, T.; Ishikawa, M. Fast Peg-and-Hole Alignment Using Visual Compliance. In Proceedings of the 2013 IEEE/RSJ International Conference on Intelligent Robots and Systems, Tokyo, Japan, 3–7 November 2013; IEEE: Piscataway, NJ, USA, 2013; pp. 286–292. [Google Scholar]
- Shen, Y.; Jia, Q.; Wang, R.; Huang, Z.; Chen, G. Learning-Based Visual Servoing for High-Precision Peg-in-Hole Assembly. Actuators 2023, 12, 144. [Google Scholar] [CrossRef]
- Xia, Y.; Yin, Y.; Chen, Z. Dynamic Analysis for Peg-in-Hole Assembly with Contact Deformation. Int. J. Adv. Manuf. Technol. 2006, 30, 118–128. [Google Scholar] [CrossRef]
- Chen, Z.; Gao, Y.; Dong, R.; Wu, B.; Li, J. Finite Element Analysis of Sealing Characteristics of the Rubber O-Ring for a Mechanical Seal. J. Sichuan Univ. Eng. Sci. Ed. 2011, 43, 234–239. [Google Scholar]
- Chuanjun, H. Seal Performance Analysis of a Star Sealing Ring in Reciprocating Seal. Lubr. Eng. 2012, 37, 28–32. [Google Scholar]
- Tingting, L.U.; Weimin, W.; Lifang, C. A Study of the Performance of an O-Ring Seal with Viscoelasticity. J. Beijing Univ. Chem. Technol. Sci. Ed. 2014, 6, 93–97. [Google Scholar]
- Zhang, Z.; Sha, B.; Wang, C.; Yan, T. Analysis of the Double-Sealing Performance of O-Ring in Reciprocating Movement Based on Abaqus. Guti Huojian Jishu J. Solid Rocket. Technol. 2019, 42, 85–91. [Google Scholar]
- Windslow, R.J.; Busfield, J.J.C. Viscoelastic Modeling of Extrusion Damage in Elastomer Seals. Soft Mater. 2019, 17, 228–240. [Google Scholar] [CrossRef]
- Sieben, C.; Reinhart, G. Development of a Force-Path Prediction Model for the Assembly Process of o-Ring Type Seals. Procedia CIRP 2014, 23, 223–228. [Google Scholar] [CrossRef]
- Hassan, S.; Yoon, J. Haptic Assisted Aircraft Optimal Assembly Path Planning Scheme Based on Swarming and Artificial Potential Field Approach. Adv. Eng. Softw. 2014, 69, 18–25. [Google Scholar] [CrossRef]
- Chang, W.C.; Andini, D.P.; Pham, V.T. An Implementation of Reinforcement Learning in Assembly Path Planning Based on 3D Point Clouds. In Proceedings of the 2018 International Automatic Control Conference (CACS), Taoyuan, Taiwan, 4–7 November 2018. [Google Scholar]
- Beltran-Hernandez, C.C.; Petit, D.; Ramirez-Alpizar, I.G.; Harada, K. Variable Compliance Control for Robotic Peg-in-Hole Assembly: A Deep-Reinforcement-Learning Approach. Appl. Sci. 2020, 10, 6923. [Google Scholar] [CrossRef]
- Chen, J.P.; Zheng, M.H. A Survey of Robot Manipulation Behavior Research Based on Deep Reinforcement Learning. Robot 2022, 44, 236–256. [Google Scholar]
- Dong, X.; Duan, Z. Comparative Study on the Sealing Performance of Packer Rubber Based on Elastic and Hyperelastic Analyses Using Various Constitutive Models. Mater. Res. Express 2022, 9, 075301. [Google Scholar] [CrossRef]
- Guo, C.; Haiser, H.; Haas, W.; Lechner, G. Analysis of Elastomeric O-Ring Seals Using the Finite Element Method. Mech. Sci. Technol. 2000, 19, 740–744. [Google Scholar]
- Chen, Z.; Liu, T.; Li, J. The Effect of the O-Ring on the End Face Deformation of Mechanical Seals Based on Numerical Simulation. Tribol. Int. 2016, 97, 278–287. [Google Scholar] [CrossRef]
- Wu, G.-P.; Song, B.-F.; Cui, W.-M. Reliability Analysis for O-Ring Seals with Shear Failure. Mach. Des. Manuf. 2009, 8, 125–127. (In Chinese) [Google Scholar]
- Xiao, T.; Quanhai, L. Fitting of Spatial Cylindrical Surface Based on 3D Coordinate Transformation. Geotech. Investig. Surv. 2014, 42, 79–82. [Google Scholar]
- Cui, L.; Wang, X.; Zhang, Y. Reinforcement Learning-Based Asymptotic Cooperative Tracking of a Class Multi-Agent Dynamic Systems Using Neural Networks. Neurocomputing 2016, 171, 220–229. [Google Scholar] [CrossRef]
- Kober, J.; Bagnell, J.A.; Peters, J. Reinforcement Learning in Robotics: A Survey. Int. J. Robot. Res. 2013, 32, 1238–1274. [Google Scholar] [CrossRef]
- Wei, Q.; Song, R.; Zhang, P.; Wu, Z.; Huang, R.; Qin, C.; Li, J.L.; Lan, X. Path Planning of Mobile Robot in Unknown Dynamic Continuous Environment Using Reward-modified deepQ-network. Optim. Control Appl. Methods 2023, 44, 1570. [Google Scholar] [CrossRef]
- Fan, J.; Wang, Z.; Xie, Y.; Yang, Z. A Theoretical Analysis of Deep Q-Learning. In Proceedings of the Learning for Dynamics and Control—PMLR, Online, 31 July 2020; pp. 486–489. [Google Scholar]
- van Hasselt, H.; Guez, A.; Silver, D. Deep Reinforcement Learning with Double Q-Learning. In Proceedings of the AAAI Conference on Artificial Intelligence, Phoenix, AZ, USA, 12–17 February 2016; Volume 30. [Google Scholar] [CrossRef]


| Number | da (mm) | θ (°) | Number | da (mm) | θ (°) |
|---|---|---|---|---|---|
| 1 | 0.149 | 0.1 | 11 | 0.133 | 0.1 |
| 2 | 0.09 | 0.05 | 12 | 0.047 | 0.05 |
| 3 | 0.055 | 0.07 | 13 | 0.045 | 0.05 |
| 4 | 0.068 | 0.06 | 14 | 0.018 | 0.01 |
| 5 | 0.022 | 0.02 | 15 | 0.035 | 0.02 |
| 6 | 0.041 | 0.03 | 16 | 0.056 | 0.06 |
| 7 | 0.017 | 0.01 | 17 | 0.048 | 0.05 |
| 8 | 0.033 | 0.02 | 18 | 0.038 | 0.03 |
| 9 | 0.095 | 0.07 | 19 | 0.067 | 0.07 |
| 10 | 0.087 | 0.06 | 20 | 0.045 | 0.05 |
| NO. | 1 | 2 | 3 | 4 | 5 | 6 | 7 | 8 | 9 |
|---|---|---|---|---|---|---|---|---|---|
| maximum deviation (mm) | 0.051 | 0.058 | 0.047 | 0.045 | 0.030 | 0.081 | 0.038 | 0.080 | 0.049 |
| No. | Direct Assembly | Method in This Paper |
|---|---|---|
| 1 | 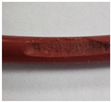 | 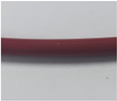 |
| damage | intact O-ring | |
| 2 | 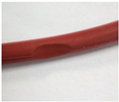 | 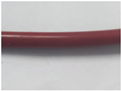 |
| damage | intact O-ring | |
| 3 | 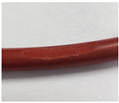 | 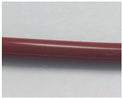 |
| damage | intact O-ring | |
| 4 | 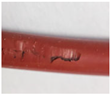 | 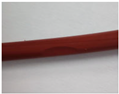 |
| damage | minor damage | |
| 5 | 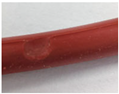 |  |
| damage | intact O-ring |
Disclaimer/Publisher’s Note: The statements, opinions and data contained in all publications are solely those of the individual author(s) and contributor(s) and not of MDPI and/or the editor(s). MDPI and/or the editor(s) disclaim responsibility for any injury to people or property resulting from any ideas, methods, instructions or products referred to in the content. |
© 2024 by the authors. Licensee MDPI, Basel, Switzerland. This article is an open access article distributed under the terms and conditions of the Creative Commons Attribution (CC BY) license (https://creativecommons.org/licenses/by/4.0/).
Share and Cite
Liu, S.; Liu, G.; Zhang, X. High-Precision Peg-in-Hole Assembly with Flexible Components Based on Deep Reinforcement Learning. Machines 2024, 12, 287. https://doi.org/10.3390/machines12050287
Liu S, Liu G, Zhang X. High-Precision Peg-in-Hole Assembly with Flexible Components Based on Deep Reinforcement Learning. Machines. 2024; 12(5):287. https://doi.org/10.3390/machines12050287
Chicago/Turabian StyleLiu, Songkai, Geng Liu, and Xiaoyang Zhang. 2024. "High-Precision Peg-in-Hole Assembly with Flexible Components Based on Deep Reinforcement Learning" Machines 12, no. 5: 287. https://doi.org/10.3390/machines12050287
APA StyleLiu, S., Liu, G., & Zhang, X. (2024). High-Precision Peg-in-Hole Assembly with Flexible Components Based on Deep Reinforcement Learning. Machines, 12(5), 287. https://doi.org/10.3390/machines12050287