Article

High-Precision Peg-in-Hole Assembly with Flexible Components Based on Deep Reinforcement Learning

1
Shenyang Institute of Automation, Chinese Academy of Sciences, Shenyang 110016, China
2
University of Chinese Academy of Sciences, Beijing 100049, China
*
Author to whom correspondence should be addressed.
Machines 2024, 12(5), 287; https://doi.org/10.3390/machines12050287
Submission received: 6 April 2024 / Revised: 17 April 2024 / Accepted: 18 April 2024 / Published: 25 April 2024
(This article belongs to the Section Advanced Manufacturing)

Abstract

:
The lateral thrust device is a typical high-pressure sealed cavity structure with dual O-rings. Because the O-ring is easily damaged during the assembly process, the product quality is unqualified. To achieve high-precision assembly for this structure, this paper proposes a reinforcement learning assembly research method based on O-ring simulation. First, a simulation study of the damage mechanism during O-ring assembly is conducted using finite element software to obtain damage data under different deformation conditions. Secondly, deep reinforcement learning is used to plan the assembly path, resulting in high-precision assembly paths for the inner and outer cylinder under different initial poses. Experimental results demonstrate that the above method not only effectively solves the problem that the O-ring is easily damaged but also provides a novel, efficient, and practical assembly technique for similar high-precision assemblies.

1. Introduction

The lateral thrust device constitutes an integral component of pulse solid rocket motor, employed to enhance the maneuverability performance of spacecraft [1]. The effectiveness of the sealing structure is one of the key factors affecting the quality of the pulse solid rocket motor. Notably, the quality of assembly during the production process plays a crucial role in the reliability of the sealing structure.
The lateral thrust device is a typical high-pressure sealed cavity structure with dual O-rings. Currently, there is limited research on the assembly methods for this high-pressure sealed cavity, with more focus on the service life of key components such as sealing rings [2].
The lateral force device is typically assembled by directly aligning the inner cylinder with the outer cylinder using fixtures. The lateral thrust device is shown in Figure 1. Due to unavoidable system errors, the initial assembly posture is affected, and this assembly process is prone to damage to O-rings.
Additionally, during assembly, O-rings are in an invisible and difficult-to-measure state, making it challenging to reverse-engineer and analyze the assembly process. Given these challenges, this paper first uses finite element software to simulate the damage assembly parameters during the O-ring assembly process, summarizing and establishing the impact parameters of damage under different deformation conditions. Secondly, it measures the initial deviation and attitude position of the inner and outer cylinders before assembly, uses deep reinforcement learning (DRL) to plan the assembly path, and obtains high-precision assembly paths for the inner and outer cylinders under different initial attitudes. Finally, the feasibility of the assembly method is experimentally validated, providing a novel, efficient, and practical assembly technique for such high-precision assemblies.

2. Related Works

The assembly process of a high-pressure sealed cavity containing O-rings can be viewed as the assembly of a rigid shaft with the addition of O-rings, involving research in both the assembly methods for rigid components and the sealing performance of O-rings.
In the research of assembly methods for rigid components, Franz Dietrich et al. used force and torque diagrams as models for assembly tasks, but this process requires accurate estimation of contact dynamics [3]. Garrett Thomas et al. utilized CAD models and images captured by binocular vision cameras to establish initial pose space data for assembly, obtaining assembly paths through reinforcement learning [4]. Huang et al. presented a visual compliance approach for macro peg-and-hole alignment with two high-speed cam-eras and a high-speed 3-DOF active peg [5]. Shen et al. based their assembly trajectory on visual image data and force generation for the shaft and hole [6]. Xia et al. established an elastic contact dynamics model for intra-hole nails based on the compliant contact model and geometric constraints. It is more accurate than traditional rigid dynamic models [7].
However, the assembly process for this device involves flexible O-ring components rather than rigid contacts. Therefore, using assembly force and torque as assembly criteria cannot construct an accurate contact dynamics model. Additionally, the assembly boundary is not easily observable, making visual information unsuitable for assembly conditions.
Regarding the research on the sealing performance of O-rings, Chen et al. studied the performance of single-sided constrained sealing rings [8]. Han analyzed the reciprocating sealing performance of star-shaped seals and O-rings [9]. Lu et al. conducted a simulation analysis of the influence of shape and other parameters on the sealing performance of O-rubber sealing rings [10]. Zhao et al. investigated the impact of surface structure on the sealing performance of rotating combination sealing rings. Zhang et al. analyzed the reciprocating sealing performance of two O-rings [11]. R. J. Windslow explored the viscoelastic model of extrusion damage in elastic sealing rings [12]. Christoph Sieben analyzed assembly force and assembly paths, the assembly force increases and then decreases as the assembly path deepens, eventually stabilizing [13].
Conventional trajectory planning methods are path planning for the global static environment, and local dynamic planning but rely on observable means of the environment, such as path planning methods based on the ant colony algorithm, genetic algorithm, and particle swarm algorithm [14]. Common path planning methods require real-time observation and cannot handle narrow assembly windows. Nowadays, most assembly processes use reinforcement learning for peg-and-hole assembly, typically using force and position as control conditions. However, in this paper, there is high-precision coordination of flexible O-ring materials. Therefore, this project abandons force feedback and uses high-precision position data for assembly process planning and guidance.
DRL, as an emerging technology, is widely applied in various industries. Some researchers have applied DRL to peg-and-hole assembly path planning. Chang et al. treated the assembly robot as an intelligent agent and defined a discrete three-dimensional space as the state space, using each discrete position point and specific x, y, z angles as action states, thus establishing an assembly reinforcement learning environment [15]. Beltran-Hernandez et al. proposed a learning framework for position-controlled robot manipulators to solve contact-rich manipulation tasks [16].
Compared with the general traditional mobile robot path planning, the complexity of the shape of the parts causes the assembly planning process to be more prone to collisions, which is the “narrow channel problem”. In the mobile robot environment, obstacles are relatively sparse, and multiple feasible paths exist, making it relatively easy to find feasible solutions. Traditional path planning can quickly obtain feasible solutions through search-based methods. However, in assembly path planning, as the assembly parts are very close during the assembly process, collisions are more likely to occur. General traditional path planning algorithms find it difficult to search for feasible paths. There are various research directions for assembly path planning, and reinforcement learning-based methods are more suitable for this project [17]. The rest of this paper is structured as follows: in the part of the methodology, the structure of the lateral thrust device and the assembly method discussed in this paper will be introduced. The next section, the data acquisition part, will describe how fundamental data necessary for constructing DRL will be obtained through finite element analysis and initial pose measurements. The experimental section will introduce the constructed experimental platform and conduct feasibility validation. The final comments and results will be given in the results section.

3. Materials and Methodology

3.1. Introduction to the Structure of the Lateral Thrust Device

In this particular configuration of pulse solid rocket motor, the design of the lateral thrust mechanism primarily comprised an inner cylinder, an outer cylinder, and two O-ring seals, as illustrated in Figure 2. To uphold the reliability and accuracy of the system, the inner and outer cylinders of the lateral thrust apparatus were equipped with dual-layer spigots, with O-ring seals installed at the junctions to maintain hermetic integrity within the inner cavity and facilitate the requisite maneuverability of the spacecraft. The maximum deviation value between the inner and outer cylinders was 0.2 mm, and the minimum deviation value was 0 mm. The sum of the deviation values and l was 0.2 mm. Generally, after the initial positioning calibration, the inner and outer cylinders were aligned, and the inner cylinder was clamped with auxiliary fixtures and pressed into the outer cylinder. However, due to the inherent structure and system errors, the repeated assembly process may have easily caused damage to the O-ring between the inner and outer cylinders.
During the assembly process, the complex extrusion forces, friction forces, and other forces between the two O-rings and the inner and outer cylinders were coupled with each other. The assembly force behavior was unclear. The assembly forces during the assembly process were much larger than the forces generated by the deformation of the sealing ring. Therefore, using feedback control based on force could not accurately reflect the assembly conditions in this state.

3.2. Assembly Method

Currently, most of the shaft-hole assemblies involve the assembly of two rigid components, with limited research on assemblies containing flexible components. The assembly process of the inner and outer cylinders of the lateral thrust device can be considered as a shaft-hole assembly problem involving flexible materials. In a typical assembly process, the inner and outer cylinders are directly assembled after shaft-hole alignment, which often leads to damage to O-rings. O-ring damage is shown in Figure 3. To address this assembly process, assembly trajectory planning was introduced to actively adjust the assembly path, avoiding damage to the O-rings.
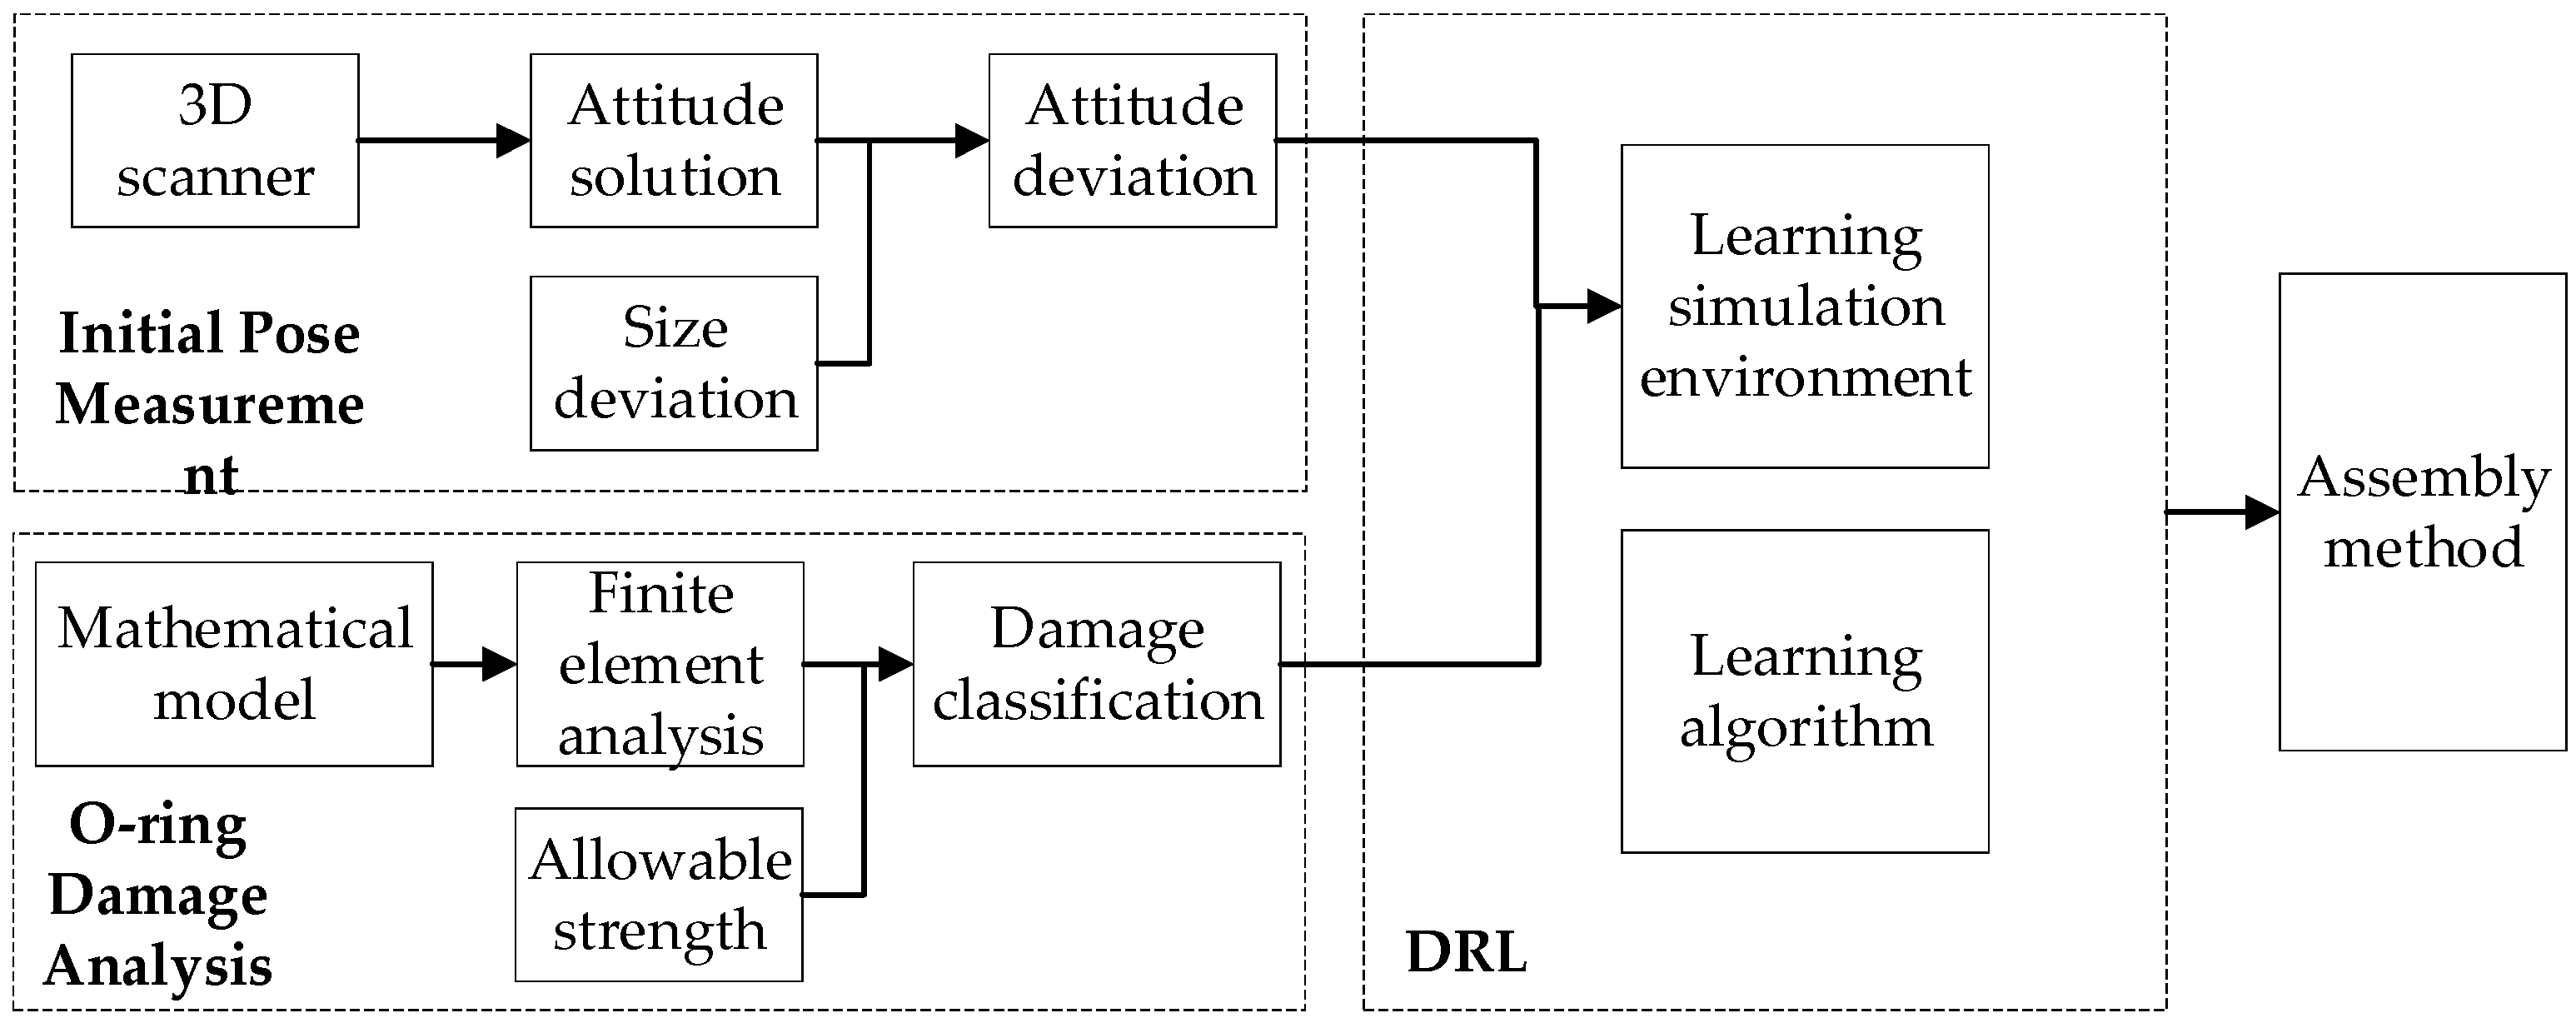
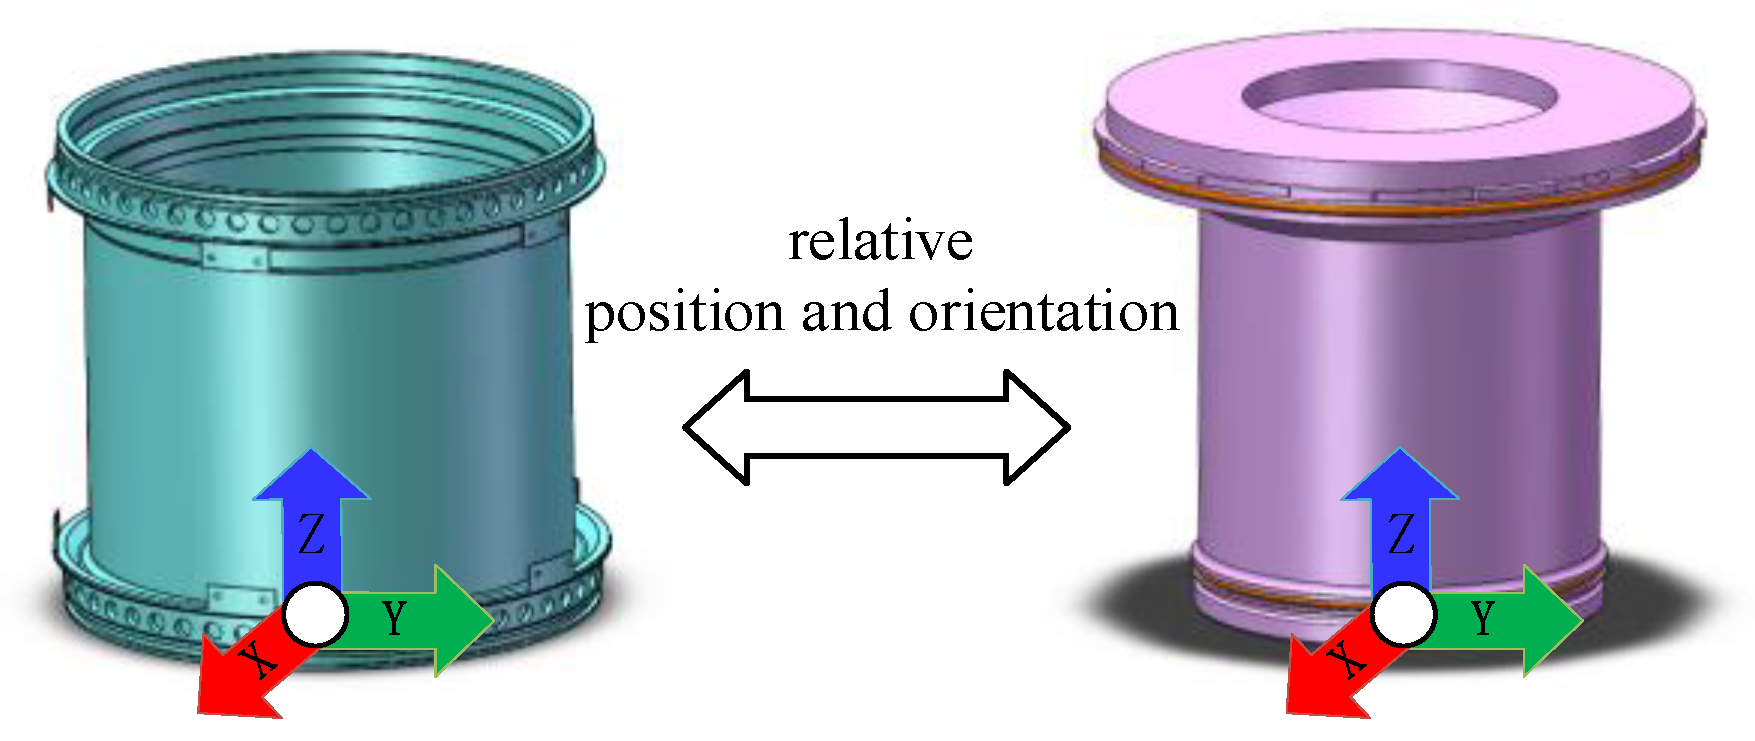
In this study, DRL was employed for assembly path planning. A reward function was defined based on the O-ring assembly damage data obtained from finite element analysis. The initial positions and orientations of the inner and outer cylinders, collected multiple times using a 3D scanning device, were set as the initial parameters of the state space, and a DRL model was constructed. Assembly paths were then determined based on different initial relative positions and orientations of the inner and outer cylinders. The assembly method is shown in Figure 4.

4. Data Acquisition

4.1. O-Ring Damage Analysis

4.1.1. Theoretical Model

Based on the constitutive model and mathematical model of the O-ring, as well as finite element simulation, analysis was performed. Many scholars both domestically and internationally have already demonstrated the accuracy and effectiveness of finite element software. ABAQUS(2022) finite element analysis software was used to simulate and analyze the stress conditions of the O-ring during the assembly process of the inner and outer cylinders.
In the study, rubber material was generally considered to be incompressible and exhibited highly nonlinear behavior, belonging to hyperelastic materials. ABAQUS offers various material models to represent hyperelastic materials, including the Mooney–Rivlin model, Yeoh model, NeoHookean, etc. The Mooney–Rivlin model and Yeoh model are two relatively simple and accurate models to characterize the hyperelastic material characteristics of rubber [18].
In this paper, the widely used Mooney–Rivlin model was employed, and its constitutive relationship was generally represented by the strain energy density function W. The multi-term Mooney–Rivlin constitutive model is expressed as follows:
W = i + j = 1 N C i j ( I i 3 ) i ( I j 3 ) j
The strain energy density function was denoted as W, and Ii and Ij are the invariants of the strain tensor. Cij are material constants. The simplified expression is as follows:
W ( I 1 , I 2 ) = C 10 ( I 1 3 ) + C 01 ( I 2 3 )
Nitrile rubber was selected for the O-ring, and the finite element parameters could be obtained through uniaxial tensile experiments. The parameters in this study were C10 = 1.879 MPa, C01 = 0.47 MPa [19].
For the ideal assembly process, the O-ring is a axisymmetric structure. Therefore, when performing finite element simulation calculations of the O-ring using software, it can be simplified as a two-dimensional axisymmetric model [20].

4.1.2. Establishment of Finite Element Model

First, the assembly process of the O-ring was modeled and simulated. The material of the inner and outer cylinders was defined as steel, with an elastic modulus of 2.1 × 10⁵ MPa, a Poisson’s ratio of 0.3, and a density of 7800 kg/m3. The density of the rubber was 1200 kg/m3. The assembly simulation process was defined, starting with the application of prescribed displacements and adjusting the assembly deviation values to simulate the influence of deviations on the assembly. The simulation of the O-ring assembly process assumed the following:
(1)
The inner and outer cylinders were composed of rigid bodies;
(2)
The rubber material was isotropic and approximately incompressible;
(3)
Geometric nonlinearity effects were considered.
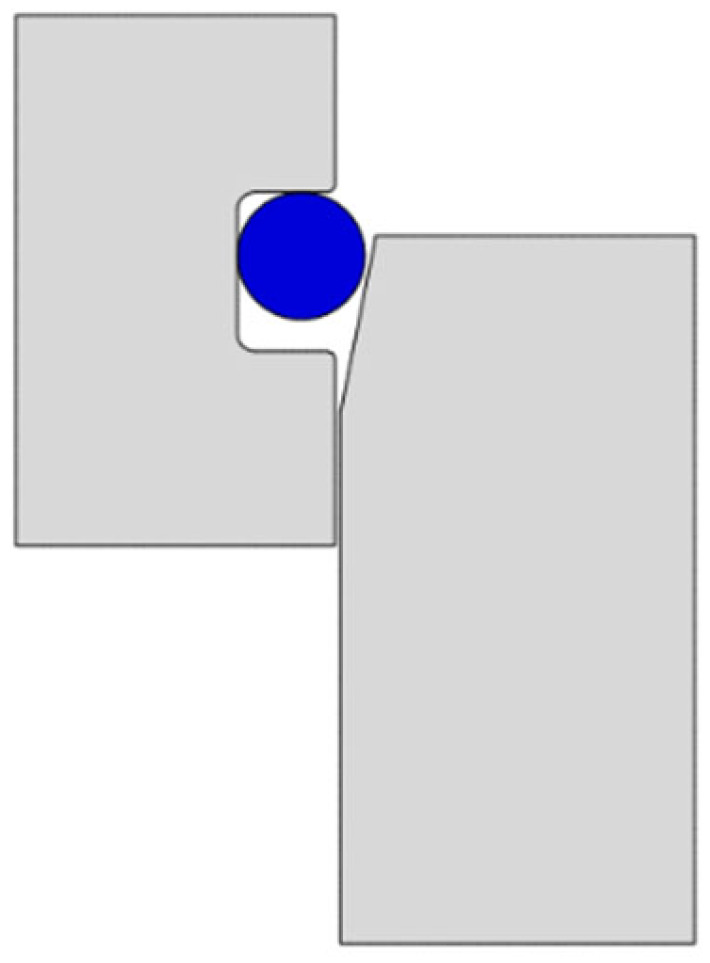
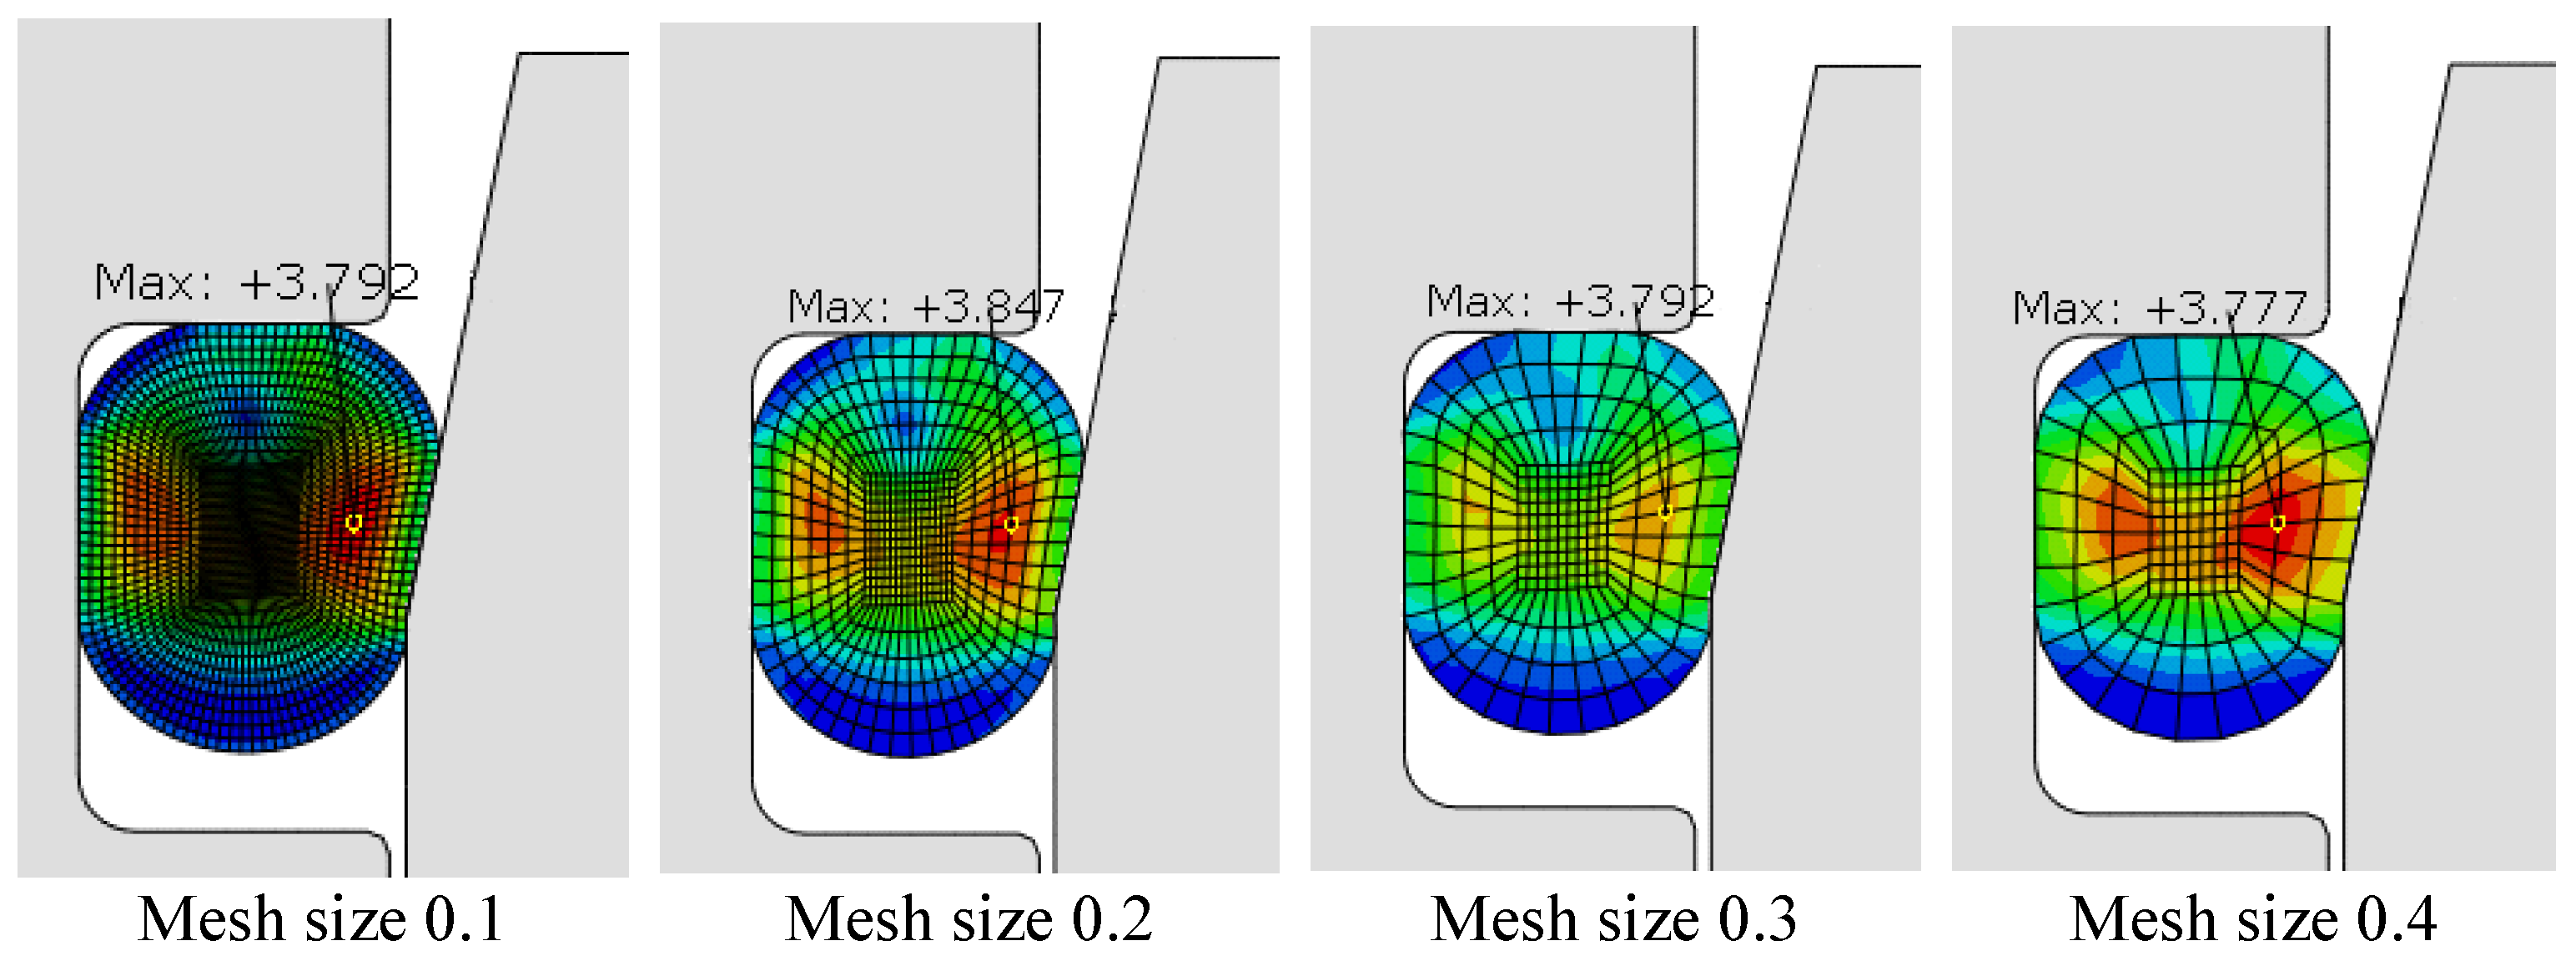
In the axisymmetric model, the mesh refinement level of the simulation software and the stress–strain relationship were analyzed. A Simulation Diagram of the O-Ring is shown in Figure 5. The adaptive meshing feature of the simulation software was used with different seed densities to divide the O-ring mesh into different levels of refinement. The maximum stress for different mesh sizes is shown in Figure 6. It can be observed that as the mesh was refined, the variation in the maximum contact stress was not significant. Therefore, the results obtained from the initial mesh division are reliable. In order to ensure the minimum value of the error and improve the calculation efficiency, the mesh size was selected as 0.3 mm. The grid division is shown in Figure 7. The grids adopted for the uneccentric and eccentric two-dimensional models in the following research will be consistent with the grids adopted this time.
The simulation analysis process was divided into several parts:
(1)
Ideal assembly process. The sealing structure of the inner and outer cylinders was considered axisymmetric and treated as rigid bodies. The O-ring was assumed to be defect-free and installed in a completely consistent state along the circumferential direction. The stress distribution of the O-ring under different assembly conditions was obtained through simulation. During the assembly process, axial displacement was applied to simulate the pre-assembly process of the O-ring, aligning with the actual ideal assembly process.
(2)
General assembly process. The eccentricity value was periodically adjusted until it exceeded the stress limit of the O-ring, reaching the maximum eccentricity value. This was performed to simulate the general assembly process of the O-ring and the situation where the O-ring is damaged due to stress.

4.1.3. Eccentric Assembly Parameter Analysis

The assembly process of the sealing ring is influenced by various factors. Parametric simulation analysis was conducted on the structural parameters of the O-ring, friction coefficient, and assembly sliding speed, to obtain the degree of influence of each parameter on the assembly process of the inner and outer cylinders. For ease of comparative analysis between models, all computed results were the time-varying data of the maximum shear stress location on the sealing ring.
During the assembly process, the sealing ring was positioned in the inner cylinder sealing groove. The inner cylinder was pushed parallel to the outer cylinder in the axial direction. As the inner cylinder entered the chamber of the sealing surface, the sealing ring underwent compression and deformation. After the sealing ring was fully seated on the sealing surface, the inner cylinder continues to move in the original direction until it reaches the installation position. The simulation process is shown in Figure 8.
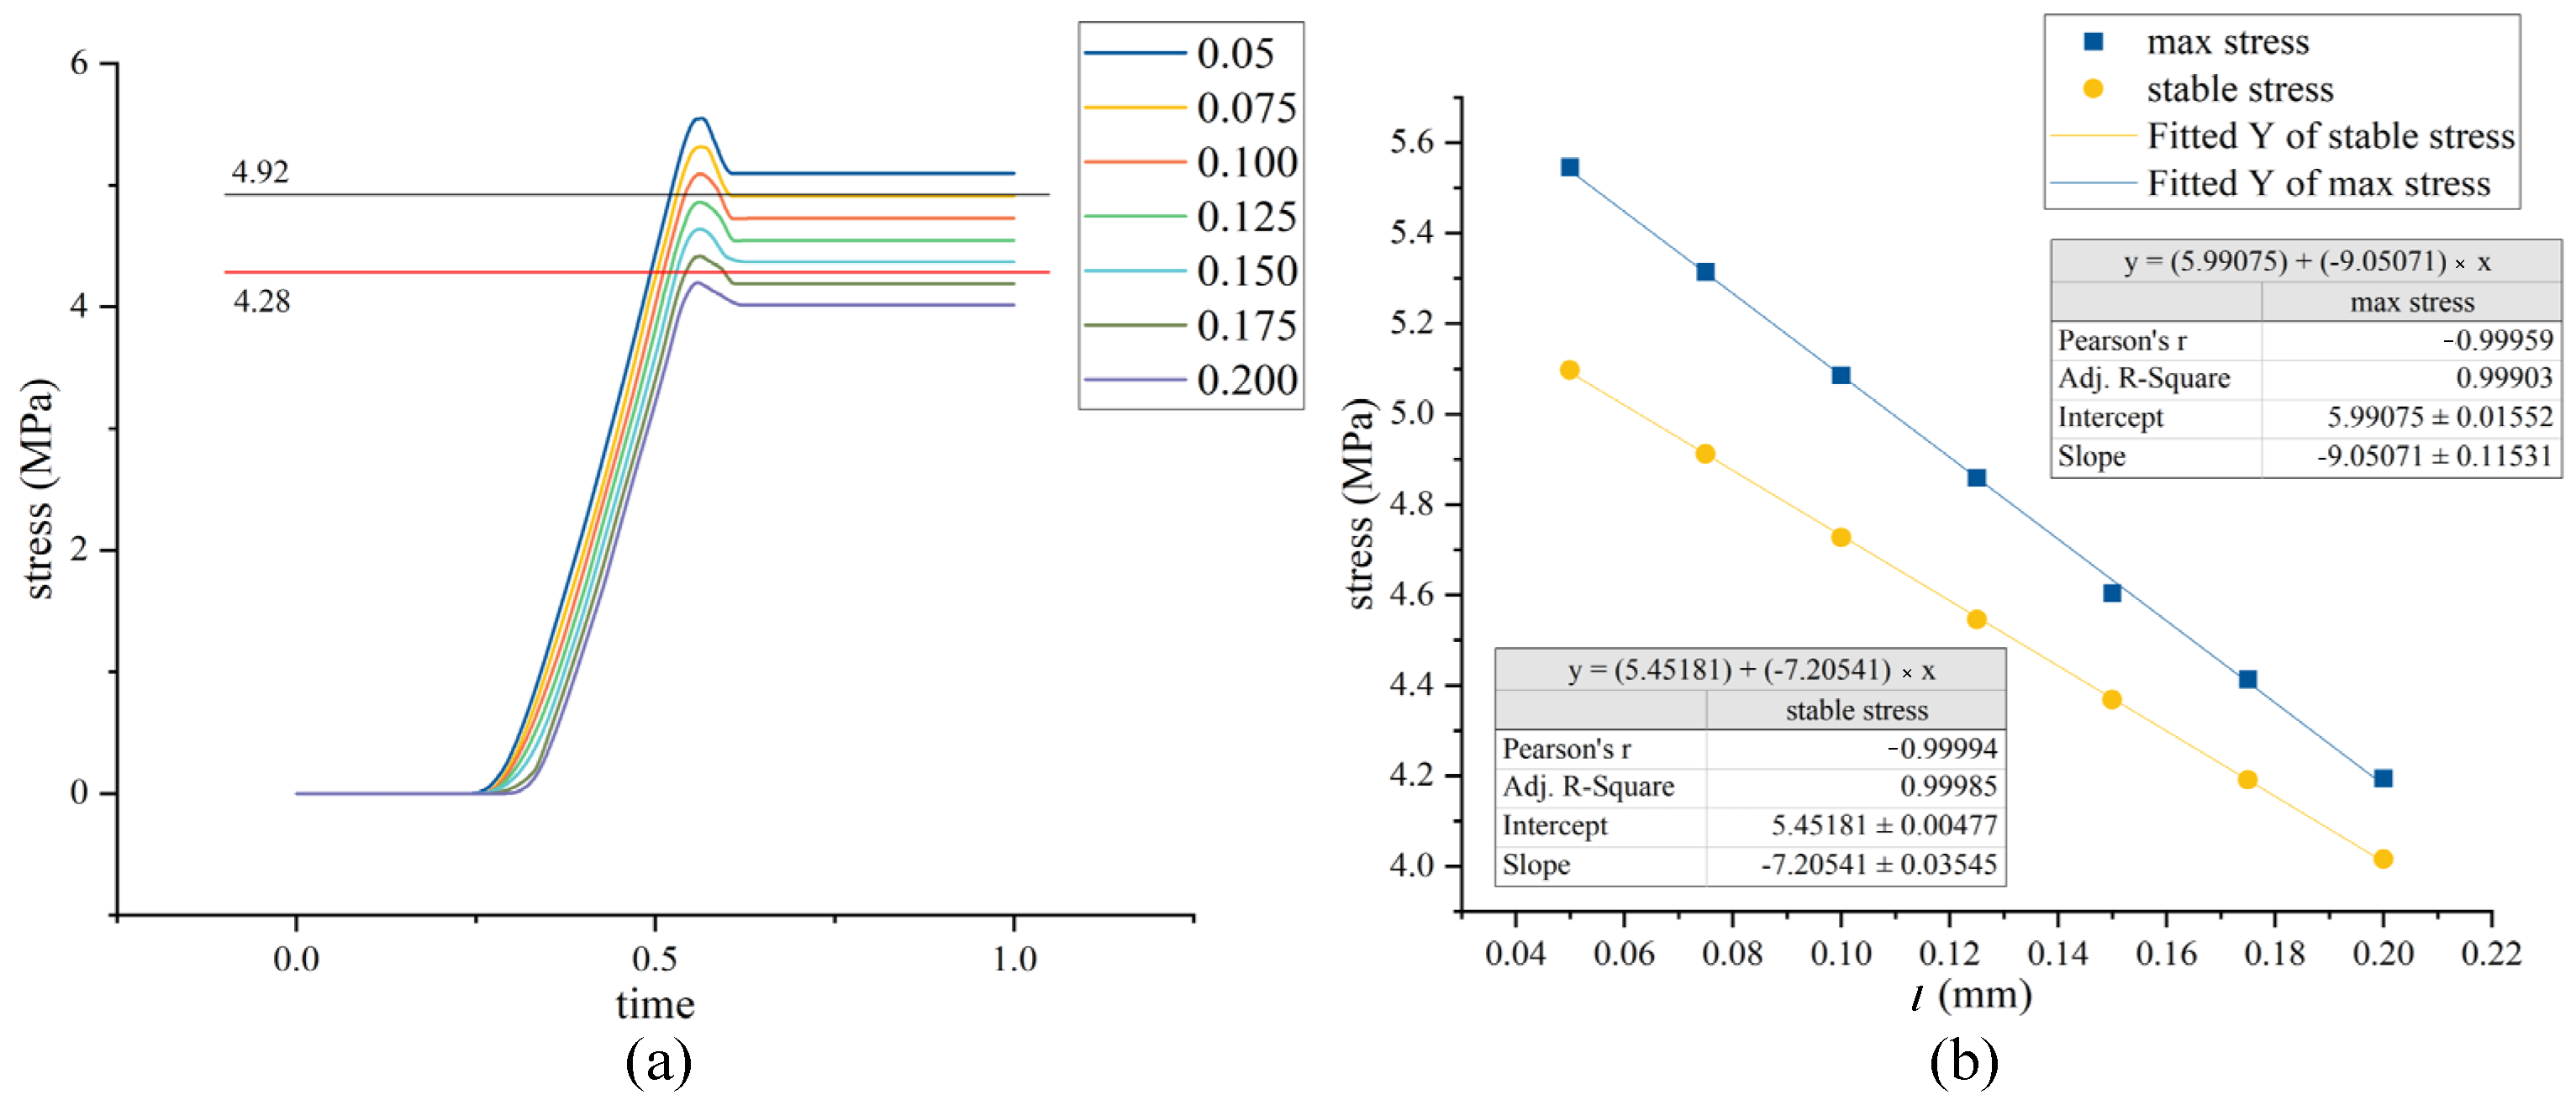
According to the strength calculations for O-rings in the reference literature, the shear strength follows a normal distribution [21], and the factory-provided parameter manual specifies τ = 4.6 × 10⁶ Mpa. To better align with expectations, we assumed that the shear strength of the O-ring followed a normal distribution (μτ = 4.6 × 10⁶, στ = 3.2 × 10⁵). This information can be used as a reference in conjunction with the model results. Therefore, in this study, a stress greater than 4.3 × 10⁶ Mpa was considered as failure. By simulating the assembly l of the O-ring between the inner and outer cylinders, the value range was 0.05 mm–0.20 mm, and a series of stress curves were obtained. According to the normal distribution, when the stress value of the O-ring was greater than 4.92 × 10⁶ Mpa, there is an 84.1344% probability of damage, so we can consider it to have been damaged. Due to the linear relationship between stress value and l, we can also assume that the probability of damage was linearly distributed with the stress value when the stress value was less than 4.92 × 10⁶ Mpa. The relationship between the assembly process and the stress of different l values is shown in Figure 9a. The maximum stress value and stable stress value both have a linear relationship with l, which is shown in Figure 9b. The sum of the deviation values-db and l is 0.2 mm. Therefore, the damage of O-ring is related to the deviation value. So, there exists a linear relationship between db and assembly stress. Subsequently, we established a reward function for deep reinforcement learning based on the range value of db.

4.2. Initial Assembly Pose Measurement Analysis

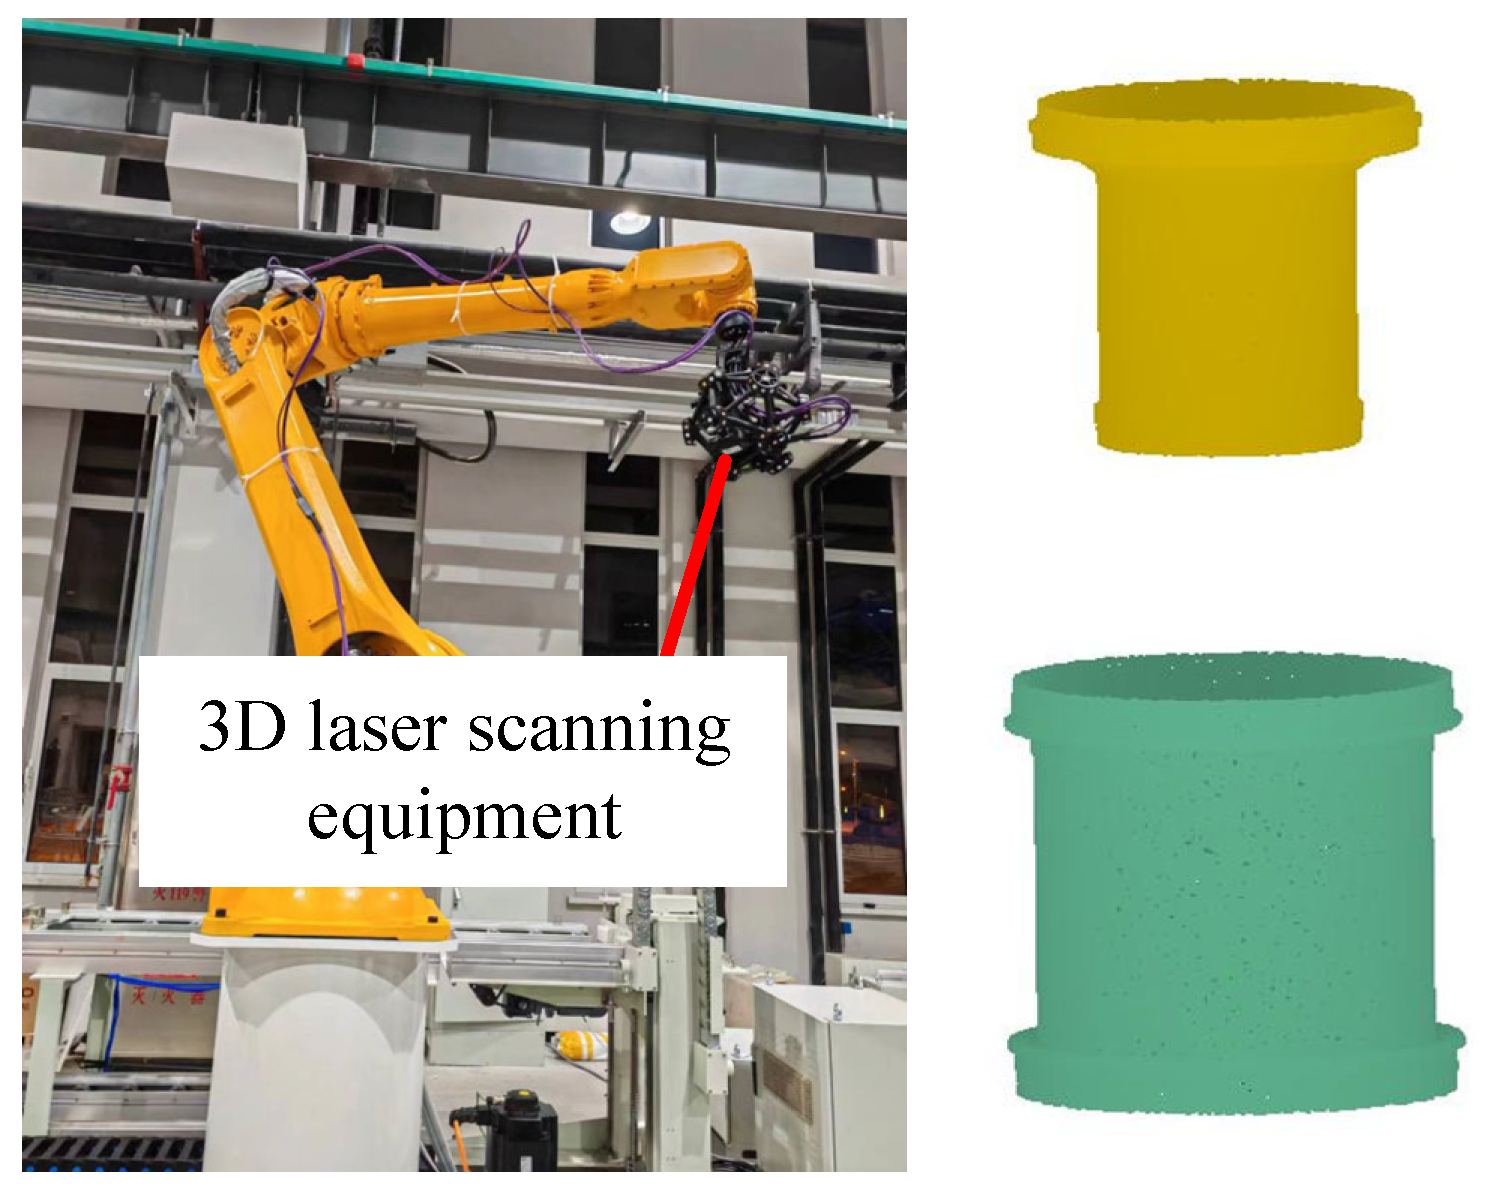
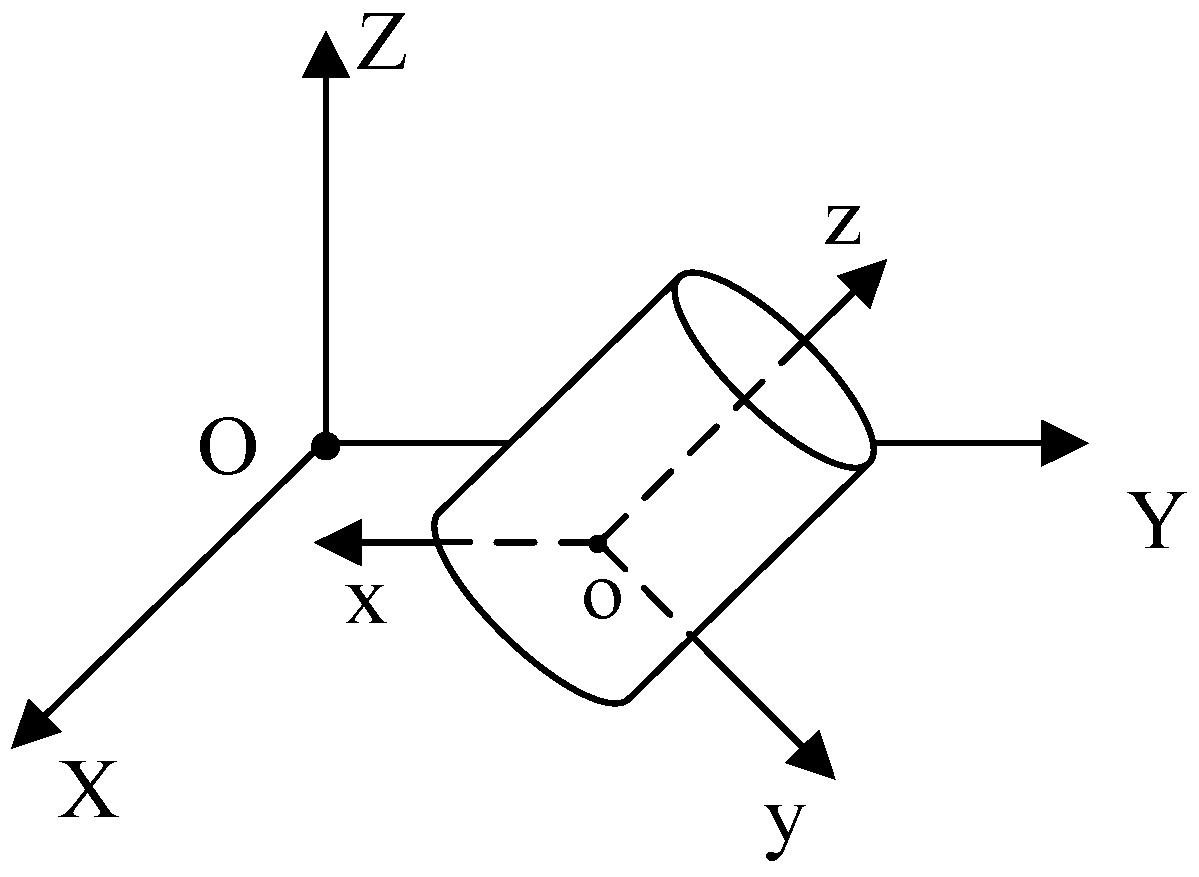
Due to the precision of assembly and the influence of auxiliary fixtures and assembly equipment, the relative spatial posture of the inner and outer cylinders during assembly docking was random. Since spatial orientation errors have randomness, 3D laser scanning equipment was used to directly measure the spatial orientation of the inner and outer cylinders. A point cloud map of the inner and outer cylinders is shown in Figure 10. When docking the assembly, the relative spatial orientation of the inner and outer cylinders was random. Therefore, to determine the orientation information of the inner and outer cylinders in space, it was necessary to first determine the extraction of the spatial coordinate information of the inner and outer cylinders. The surface features involved in this device can be classified as cylindrical features, so the collected data can be fitted to cylinders. Based on the transformation relationship between the measurement coordinate system and the cylindrical coordinate system, as well as the cylinder radius, the orientation of the cylinder can be determined [22]. The relationship between the measuring coordinate system and the cylindrical coordinate system is shown in Figure 11.
Let the measurement coordinate system be denoted as C = [x y z]T, and the cylindrical coordinate system as C′ = [x′ y′ z′]T. The transformation between the two coordinate systems can be expressed as follows:
C = X 0 + M C
X0 = [x0 y0 z0]T represents the translation between the two coordinate systems, M = M(α)M(β)M(γ) represents the rotation about the three axes, and the rotation about the Z-axis of the cylinder can be ignored.
We measured and statistically analyzed the initial errors in the assembly. We obtained the range of initial assembly errors. We simplified the inner and outer cylinders as cylindrical bodies, representing the errors as da and θ, as shown in Figure 12.
We performed fitting to obtain the final axial vectors and coordinates of the inner and outer cylinders. This allowed for the calculation of the spatial angular orientation error, θ, between the inner and outer cylinders. The maximum deviation, db, could be calculated by projecting it onto the mating surface:
d a = ( x i x 0 ) 2 + ( y i y 0 ) 2
d b = d a + d × sin θ
The assembly posture deviation range obtained from multiple measurements is shown in Table 1.
Based on the measurement results, the parameter values ranged from 0 to 0.15 for the deviation and from 0 to 0.1° for the angular orientation deviation in the initial assembly state. These ranges can be used to set the initial assembly posture. This data support can be utilized in subsequent simulations and assembly path planning.

5. Assembly Path Planning Based on DRL

5.1. Learning Algorithm

Learning algorithms serve as the brain of reinforcement learning, collecting environmental states and making learning decisions based on reward values. Ultimately, they train an intelligent agent model that approximates optimal decision-making. In simpler terms, it is a strategy model that ensures the output of the best actions in different environmental states. In this paper, the deep reinforcement learning algorithm was used for training, resulting in an intelligent agent model capable of outputting the optimal assembly path. The combination of deep learning and reinforcement learning is a good autonomous study method [23,24].
It is worth noting that the actions output by the intelligent agent during training are not fixed for each environmental state. Therefore, after training the intelligent agent, we generated assembly paths, analyzed the output paths, eliminated paths that could not complete the assembly (i.e., those exceeding the maximum allowable deviation or not reaching the assembly target position), and made selections from the remaining paths.
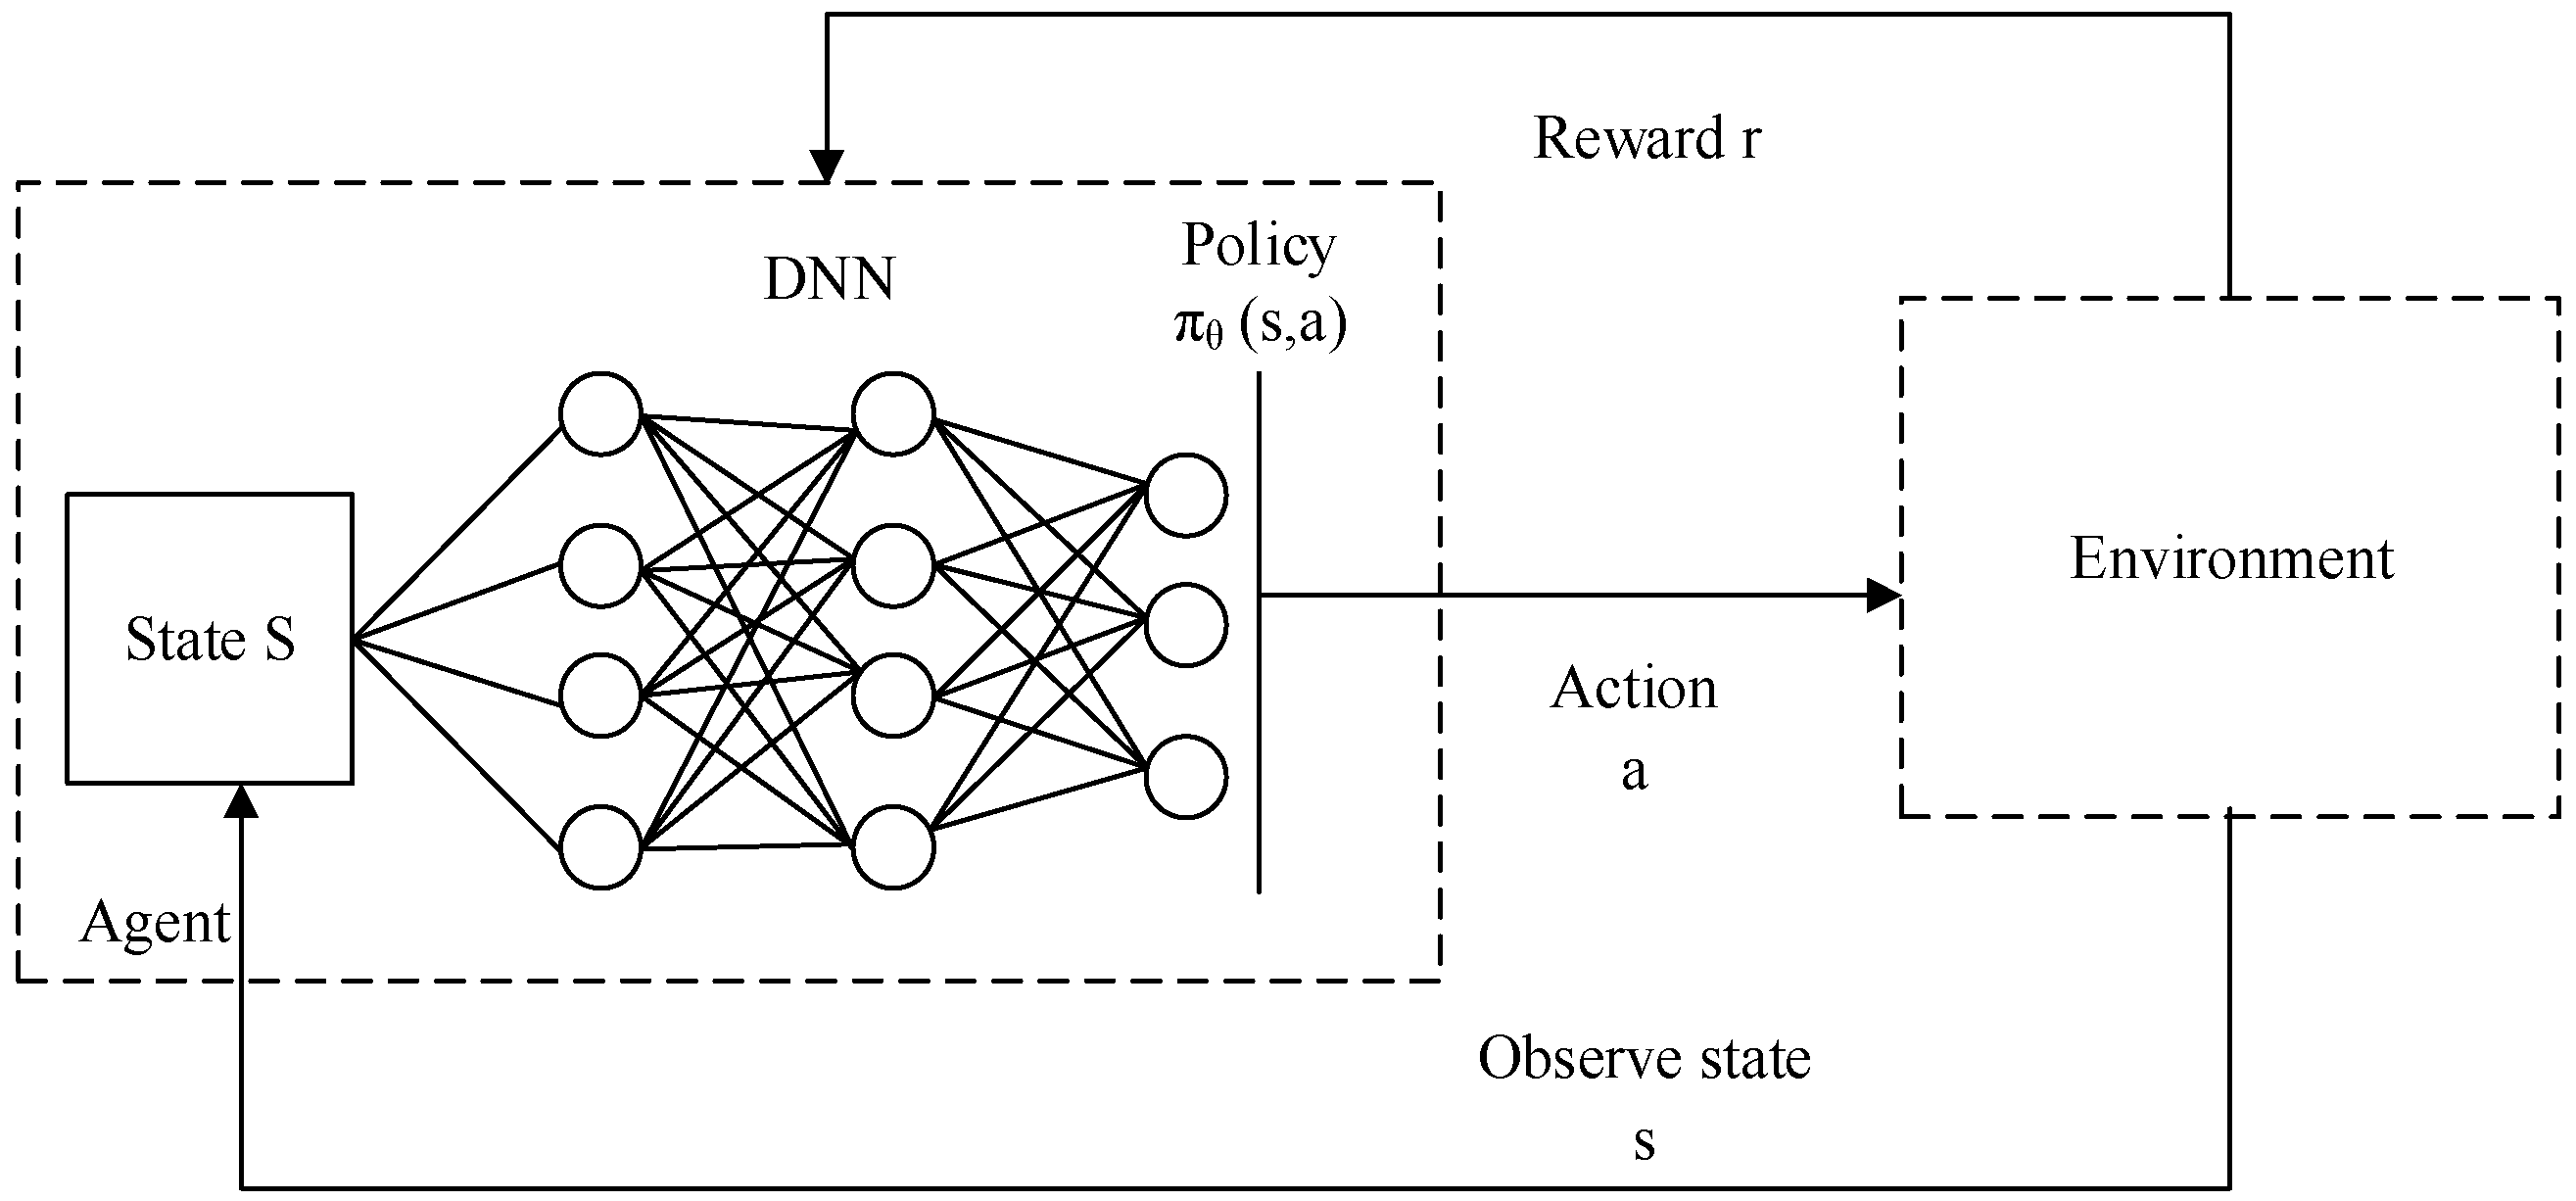
Deep Q-Learning (DQN) combined the perceptual capabilities of deep learning with the decision-making capabilities of reinforcement learning. By interacting with the environment, it used a deep neural network to extract abstract representations of data and then performs reinforcement learning based on these representations to optimize decision-making strategies. DQN not only has the strong feature learning capabilities of deep learning but also the strong decision-making capabilities of reinforcement learning, giving it tremendous potential [25]. The DQN status update is shown in Figure 13.
DQN is an end-to-end reinforcement learning algorithm that uses a deep neural network (DNN) to map the relationship between actions and states, similar to the Q-table in Q-Learning. DNNs such as CNNs, stacked sparse autoencoders, and RNNs can learn abstract representations directly from raw data. The DQN agent must interact with the environment through a series of observations, actions, rewards, similar to the tasks faced by Q-learning agents. A deep neural network was used here to approximate the optimal Q function [26].
Here, Q(s, a; θ) represents the Q-value of the convolutional neural network, where θ denotes the weight parameters of the convolutional neural network. The iterative formula used in updating the Q-function values using the stochastic gradient descent algorithm is as follows:
Q ( S t , A t ) = Q ( S t , A t ) + Q ( S t , A t + 1 ) + α [ R t + 1 + γ m a x Q ( S t + 1 , a ) Q ( S t , A t ) ]
The formula of ε-greedy strategy and reward generator R(s, a, s′) is as follows:
a i = a , i f   random   number < ε arg max Q ( s , a ) , other
R ( s , a , s ) = r , right 0 , wrong
Among them, 0 < ε < 1 was used to weigh the degree to which the agent explored and utilized the environment during the learning process.
DQN algorithms tend to overestimate Q-values, but Double Q-Learning (DDQN) addresses this issue by decoupling the action selection and evaluation. In Double Q-Learning, there are two value functions: one is used for action selection (the policy for the current state), and the other is used to evaluate the value of the current state.
The idea behind DDQN is to mitigate the overestimation bias that can occur in traditional Q-Learning methods. In a standard Q-Learning algorithm, the maximum Q-value is often chosen during action selection, which can lead to an overestimation of the true value. In Double Q-Learning, instead of relying on a single value function, two separate value functions are employed [27].
By using two value functions and alternating their roles, DDQN can help mitigate the overestimation problem and provide more reliable estimations of the true Q-values, leading to improved decision-making in reinforcement learning tasks. The DDQN status update is shown in Figure 14. Our approach was based on dueling DDQN.

5.2. Setting Up the Learning Environment

Through the analysis conducted earlier, the data collected by a laser 3D scanner was set as the initial data for the environmental state. Based on the stress relationships obtained through simulation, a reward function was defined to guide the training process. Ultimately, a simulation environment for deep reinforcement learning was constructed. The algorithm mentioned above was employed to train an intelligent agent model within this environment, capable of outputting assembly paths.
This article built the environment using the commonly used gym toolkit in reinforcement learning. The simulation environment for DRL was constructed based on the previous analysis of assembly and simulation calculations for damage evaluation and assembly status. Following the environment architecture in gym, the implementation was performed using Python programming. The initial state of the environment was randomly initialized to simulate assembly errors. Subsequently, assembly actions were executed until the assembly is completed, and the reward is accumulated. The basic flow of the program is illustrated in Figure 15.
The design of various elements in the DRL model is as follows:
(1)
Environment State (S): The design of the original features of the DRL environment state is crucial. The schematic diagram of the state space is shown in Figure 16. In this study, the design of the original state aimed to fully capture the states that lead to assembly quality issues during the assembly process. The relative positions between the inner and outer cylinders served as the state environment. Based on the previous analysis of assembly deviations, the various deviation ranges present in the initial assembly were used as randomly selected ranges for initialization. These ranges were then superimposed to form the initial state of the environment, reproducing the deviation issues that affect assembly quality.
(2)
Action Space (A): Actions are the choices made by the agent, and the state is updated based on the chosen actions. In this study, the motion in the X, Y, and Z directions constituted the action space. Since the inner and outer cylinders were an axisymmetric model, we only needed to set the deviation and action on the YOZ plane, and the minimum precision value was used as the discrete action value.
(3)
Reward (R): The reward is the feedback obtained by the agent after performing an action, guiding the agent’s learning process. At each time step, the reward obtained by the agent for taking action A in state S was denoted as R. Different from the sparse reward function, this paper added a linear reward value between reaching the target point and exceeding the assembly range. This part of the reward value was set based on the linear relationship between db obtained from simulation and assembly stress.
R = Z , reach   destination d b k Z , d b < d b max Z , d b > d b max 0 , other
(4)
Policy (π): The policy is the action strategy specified to explore the environment thoroughly. It combines random actions with the actions taken by the agent to determine the final appropriate action. An ε-greedy strategy was employed as the action policy for selecting actions.
A = random   a ε arg max Q ( s , a ) 1 ε
In an ε-greedy strategy, the agent chooses the action with the highest estimated Q-value with a probability of (1 − ε), where ε is a small value representing exploration. However, with a probability of ε, the agent selects a random action to promote exploration and avoid getting stuck in suboptimal actions. This combination of exploitation (choosing the best action) and exploration (taking random actions) helps the agent learn and improve its performance over time.
Both the DQN and DDQN algorithms used in this study could accomplish assembly planning. However, DDQN demonstrated better stability and convergence. There were opportunities for optimization in the initial stages of training, where many ineffective exploration steps were taken. The setting of rewards, construction of the environment space, and algorithms could all be further improved. The DQN and DDQN training effect is shown in Figure 17. The horizontal axis represents training time, and the vertical axis represents reward value.

5.3. Analyzing Training Results

Analyzing the trained intelligent agent model, we modified the random initial values for environmental states by selecting 10 sets of values from the collected state table. The model was then used to generate assembly paths. If the model consistently produced paths that exceed the maximum allowable deviation or fail to reach the assembly target position, we considered the model unstable and in need of further training.
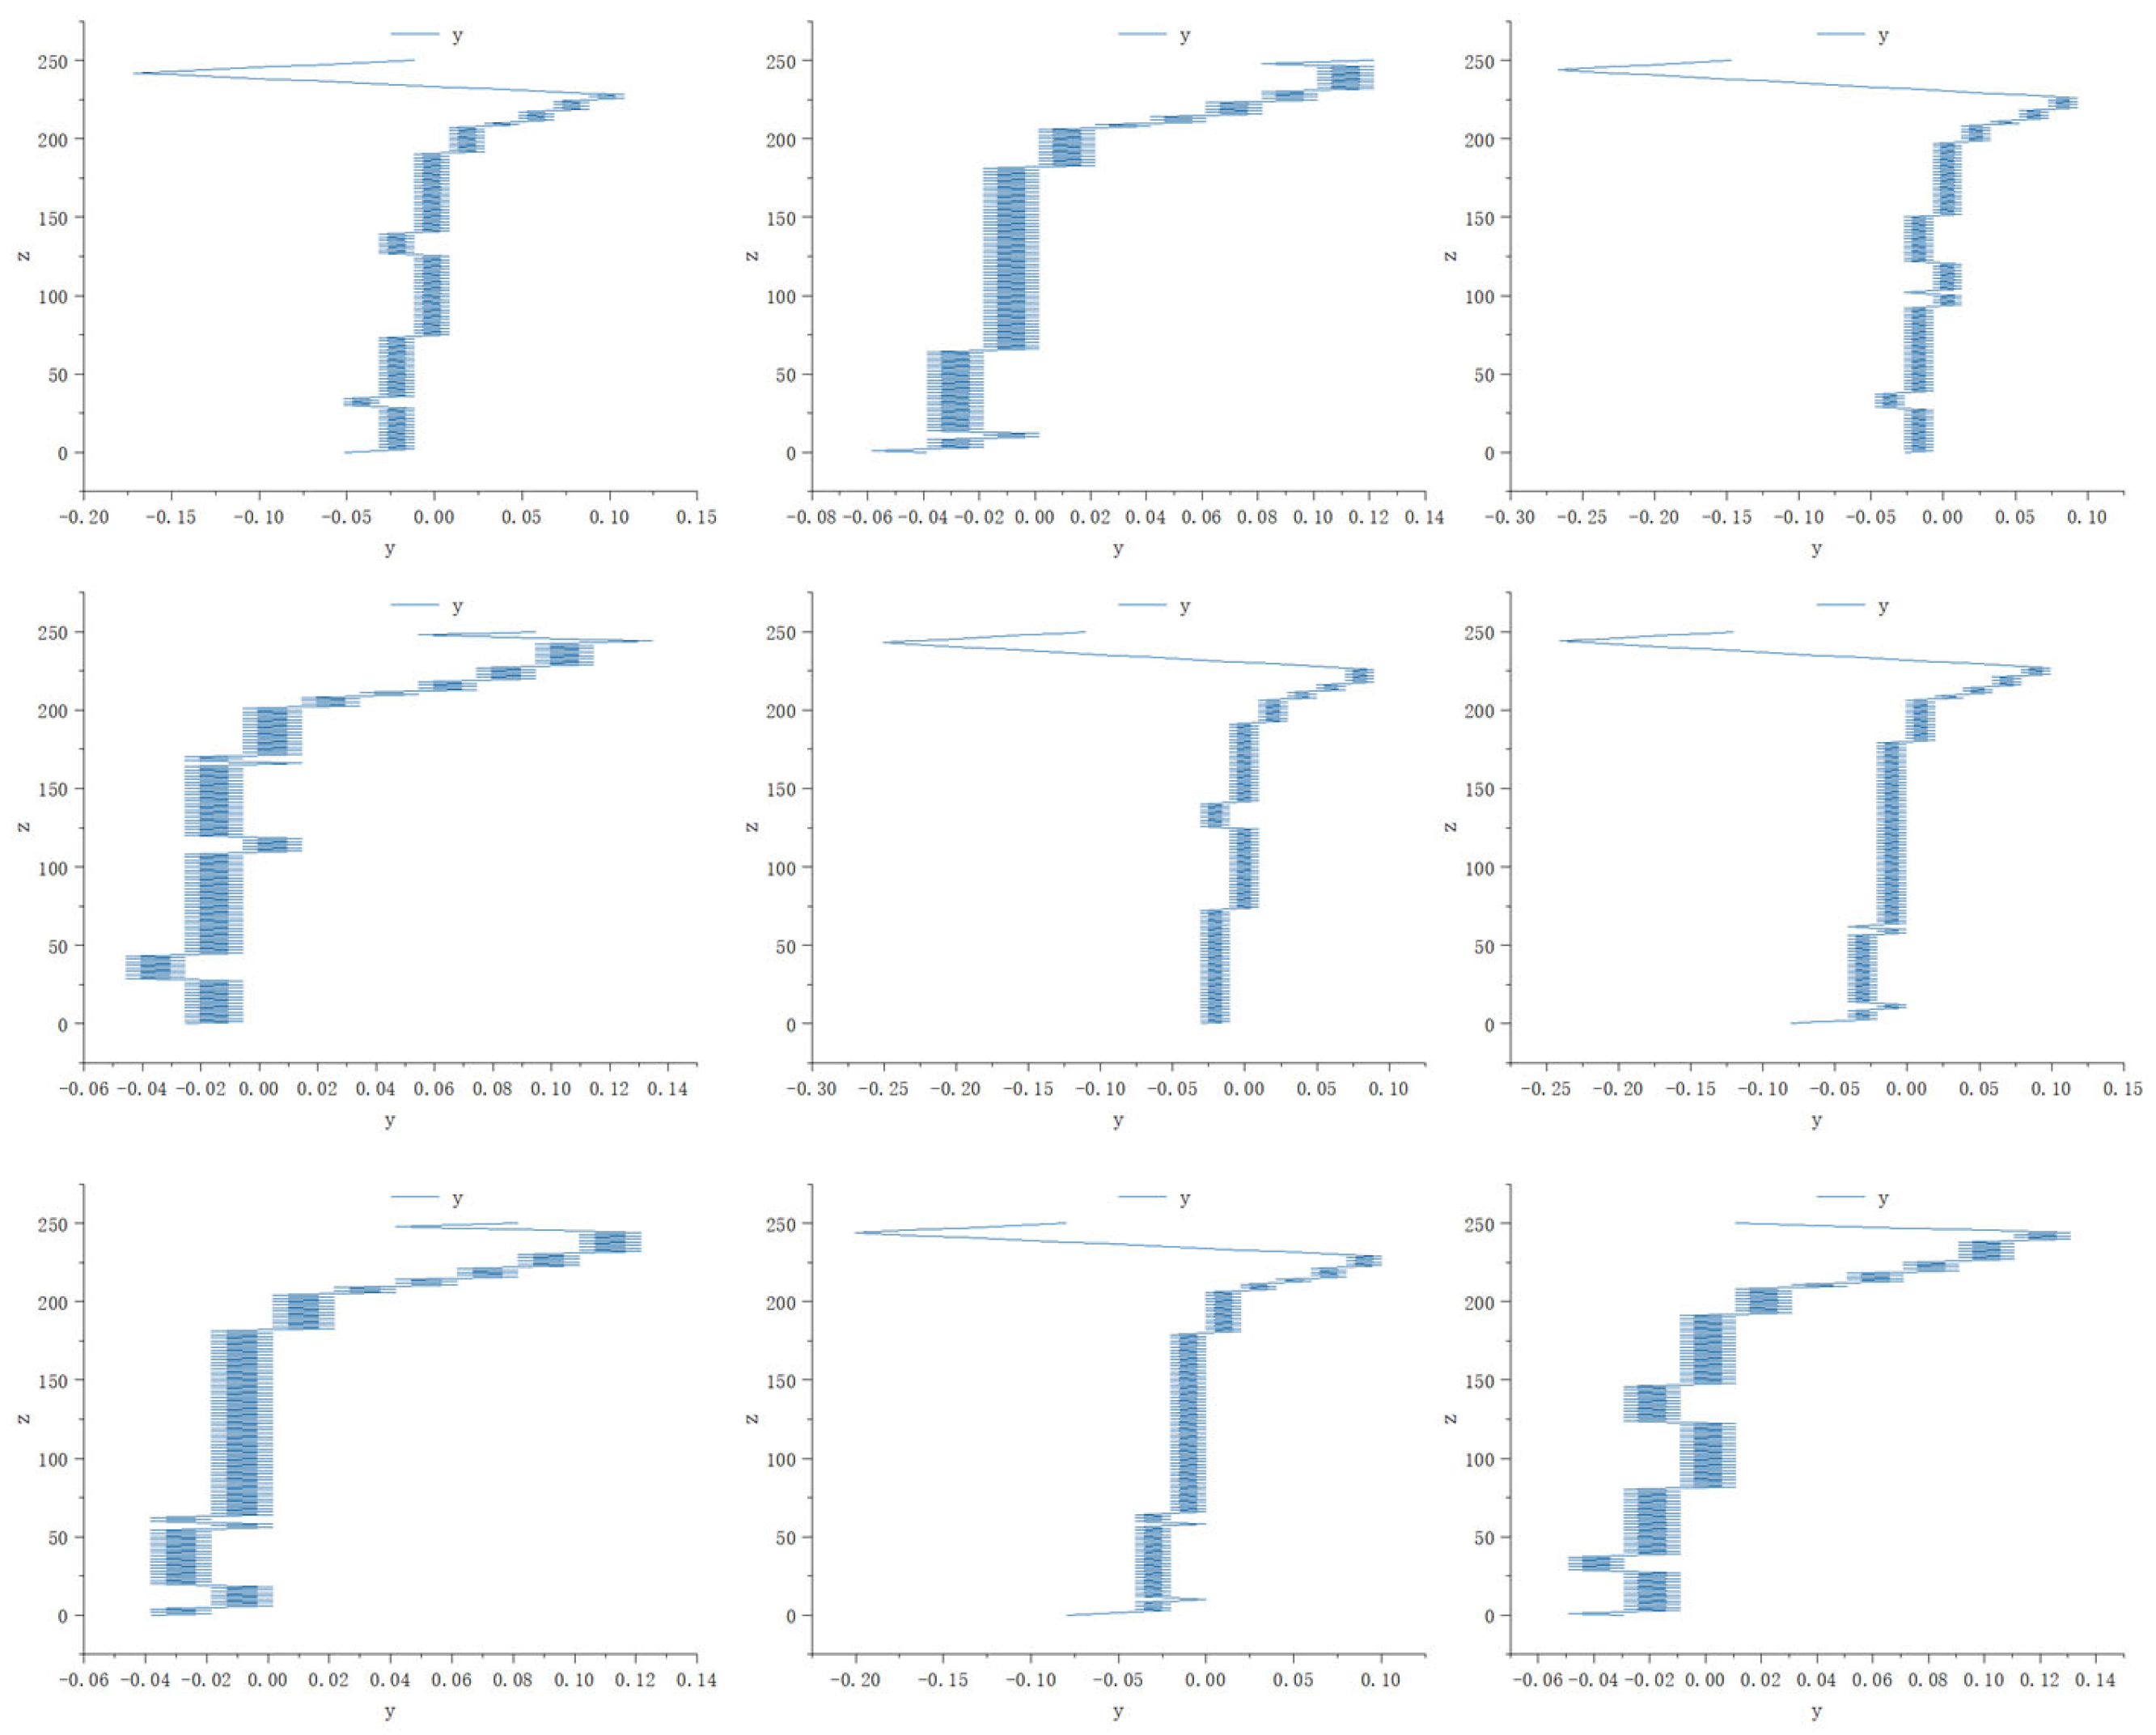
We used the center of the inner cylinder as a feature point to analyze the assembly paths generated by the model, as shown in Figure 18. When the assembly was halfway completed, the inner and outer cylinders entered the pre-contact stage. Therefore, as long as the path did not exceed the maximum allowable deviation of 0.1 mm during this stage, it was acceptable. The early movement of the path represented the exploration phase of reinforcement learning, while the later stages were constrained by the reward function to return to the ideal assembly path.
The qualification rate of the assembly paths was statistically analyzed and is presented in Figure 19 and Table 2.
It can be observed that the trained model was very stable. Therefore, this method is a feasible assembly approach.

6. Experiment and Analysis

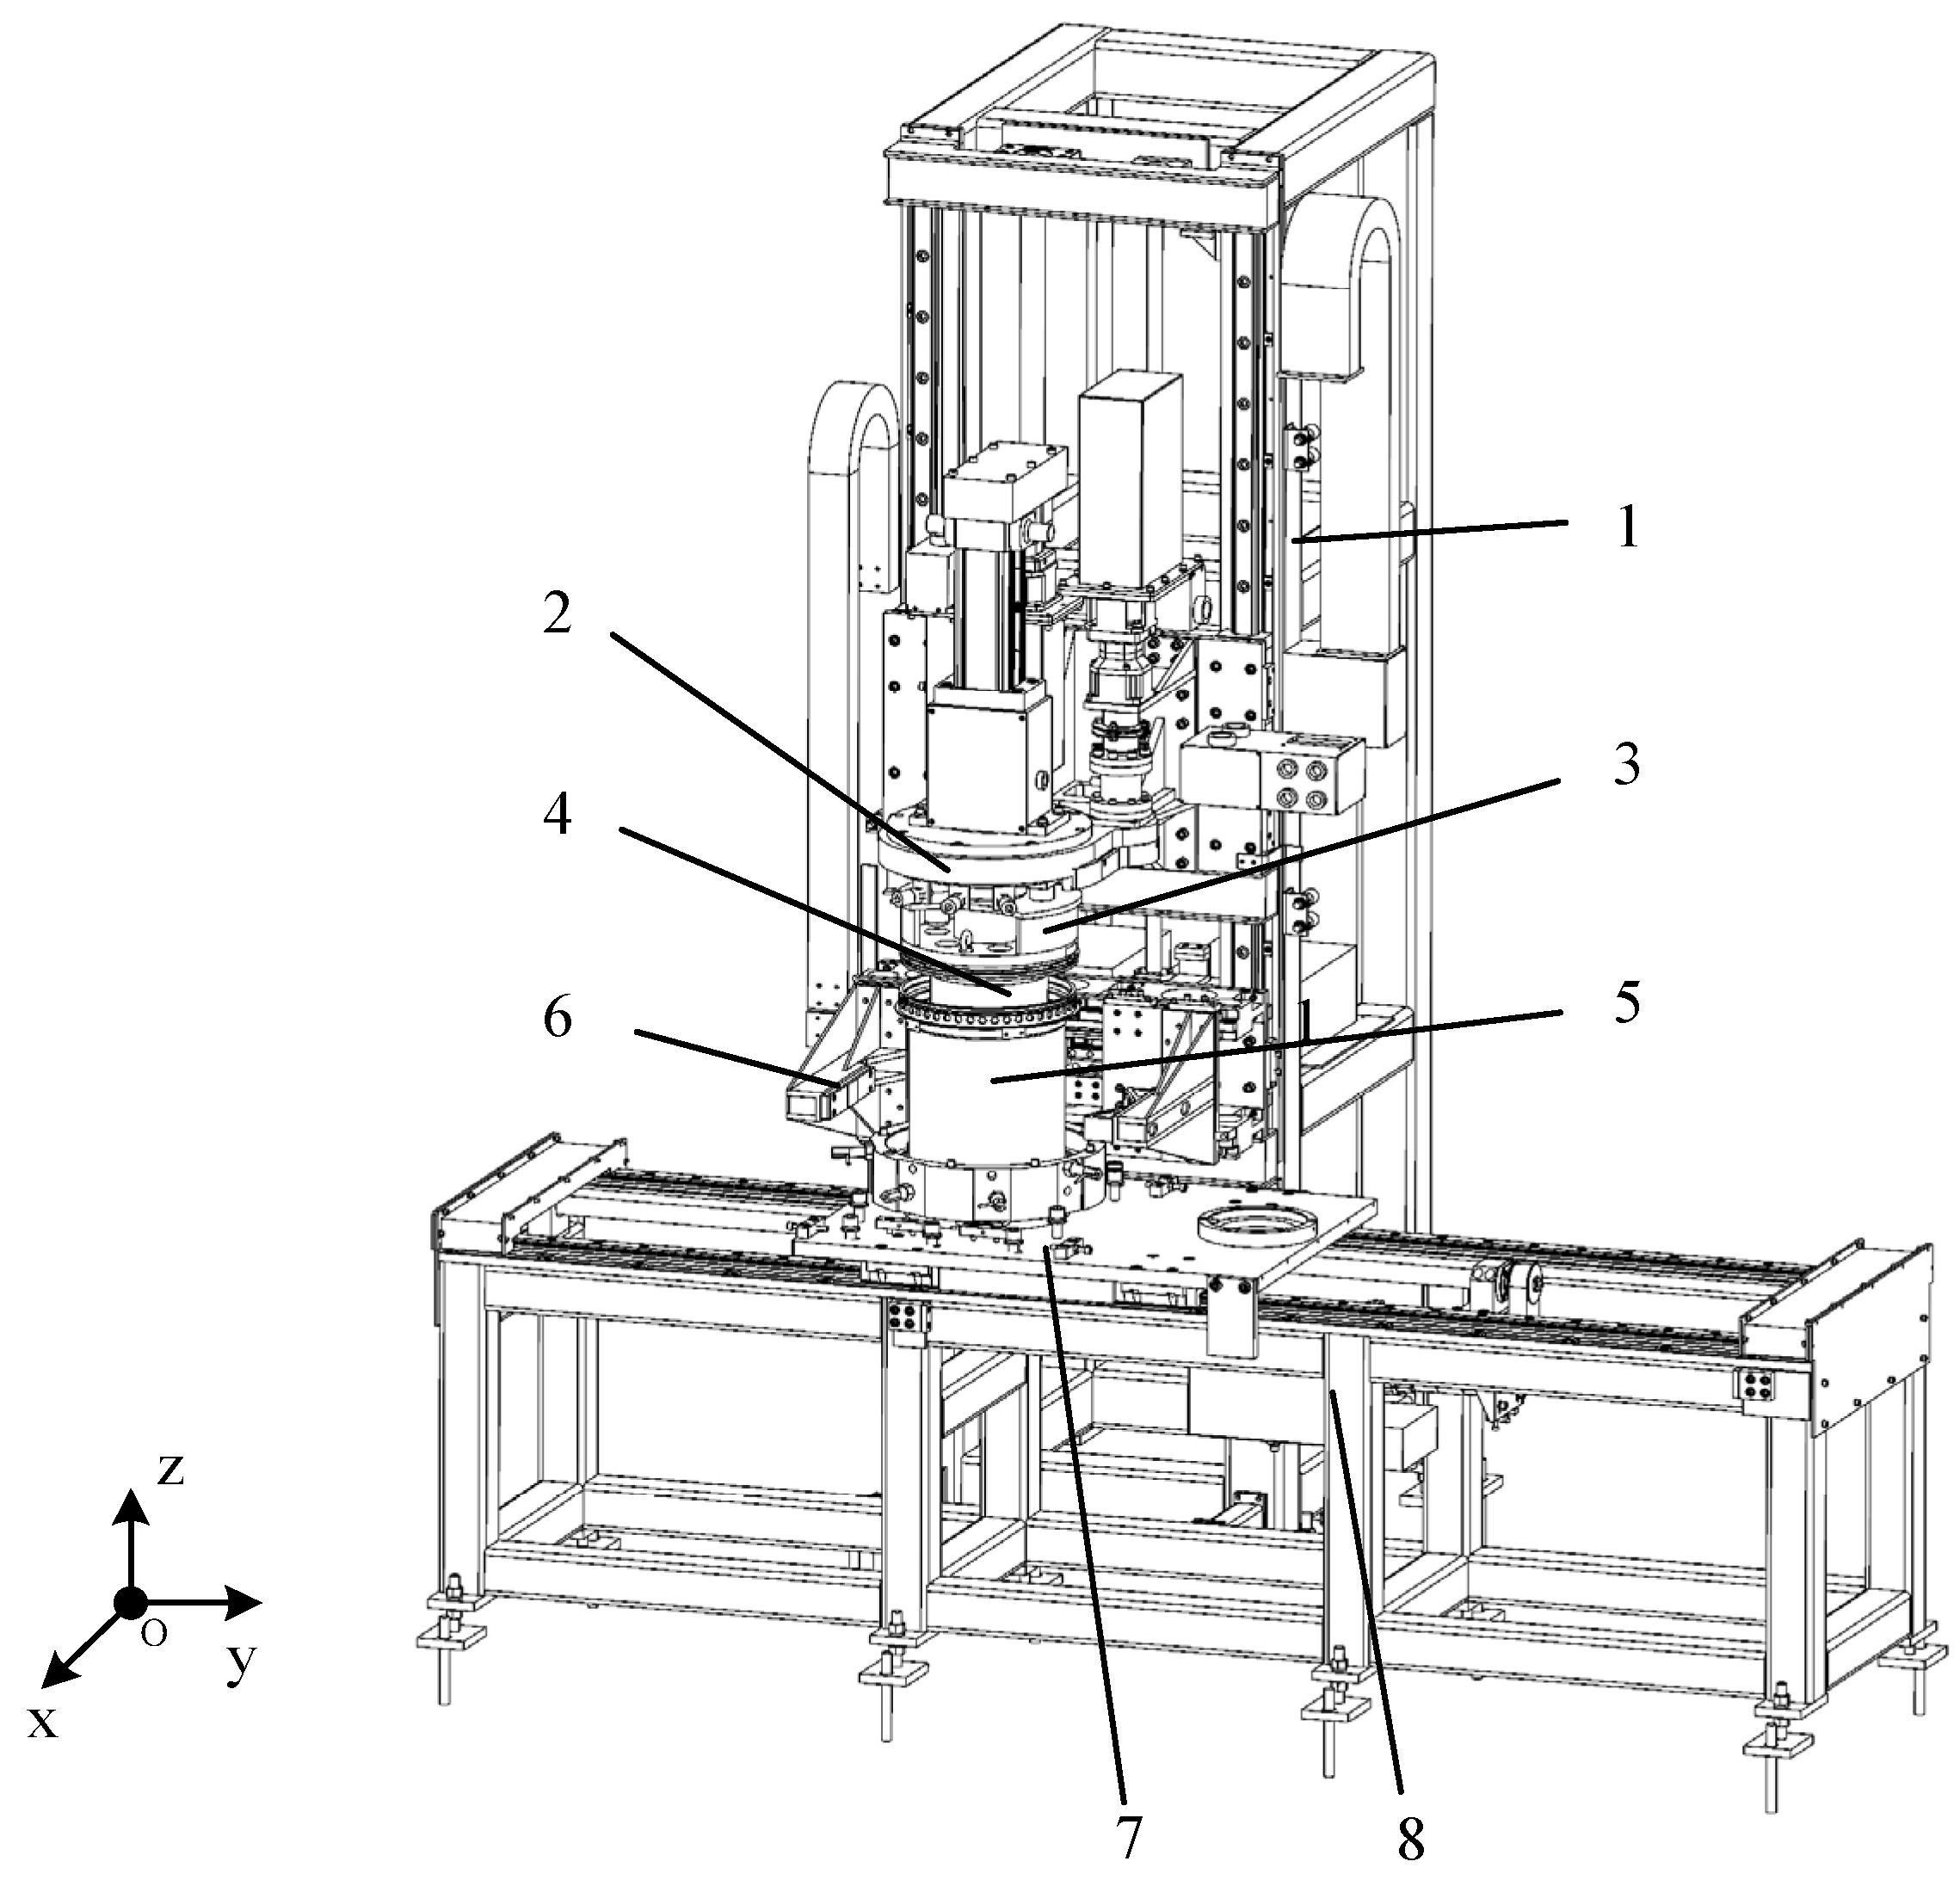
To validate the feasibility of the assembly method in the YOZ plane, we constructed an assembly experimental platform. The experimental platform is shown in Figure 20 The experimental platform consisted of an outer cylinder support platform and an inner cylinder assembly platform. The outer cylinder support platform was composed of a load-bearing frame and a support plate, while the inner cylinder assembly platform consisted of an assembly frame, mechanical grippers, and a precision assembly head. The support plate was driven by threaded rod guides and had freedom of movement in the y-axis direction, and the precision assembly head also had a small y-axis directional displacement, achieving the precision required by the assembly method.
Assembly experiment procedure: We aligned the inner ring with the outer ring on the experimental platform. We initially aligned the inner ring with the partially assembled state, and then pressed the inner ring down into the outer ring.
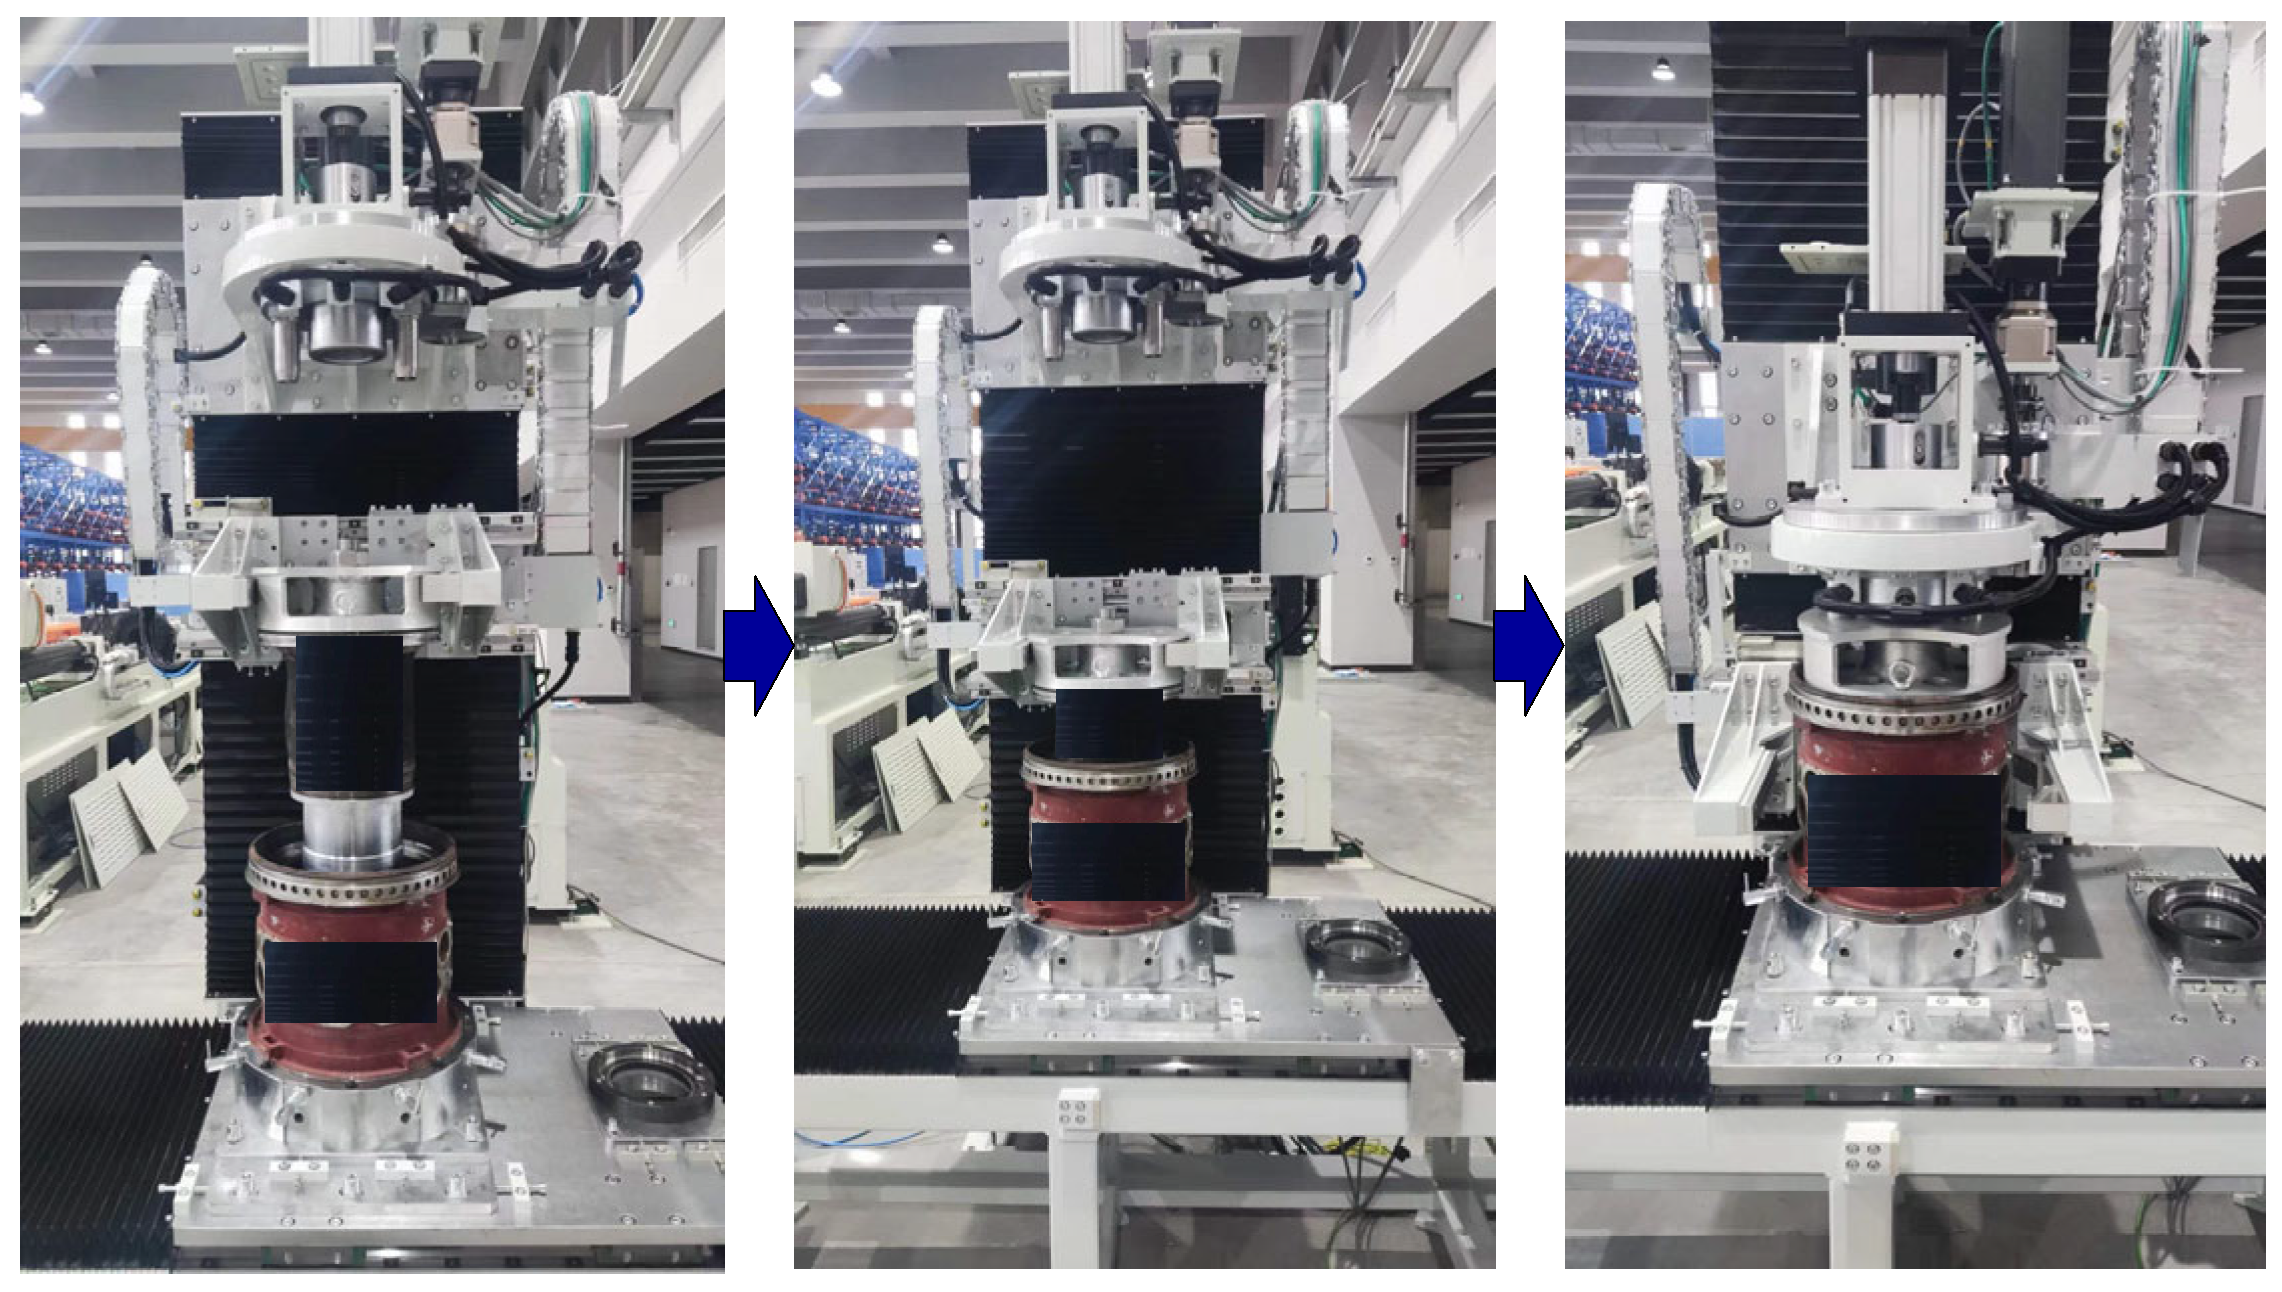
Experimental procedure: During the assembly process, the first step was to align the inner and outer cylinders on the experimental platform. The mechanical grippers preliminarily aligned the inner cylinder with the outer cylinder and remained in an incomplete assembly state. Due to factors such as experimental platform errors, there may have been angular and positional deviations within a certain range between the inner and outer cylinders. The measured initial position and posture deviations were input into the pre-trained model. Then, the precision assembly head and the support plate worked together to move into position following the path generated by the model, ultimately completing the assembly.
The assembly experiment is shown in Figure 21.
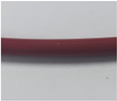
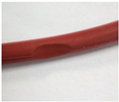
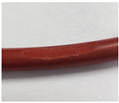
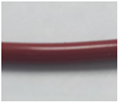
The validation on the experimental platform demonstrated the feasibility and effectiveness of the assembly method proposed in this article. After conducting 10 assembly experiments, direct assembly resulted in varying degrees of damage in five attempts, while the assembly method described in this article only incurred damage in one attempt and the damage was relatively minor. This method has proven to be more effective in mitigating O-ring damage during the assembly process compared to direct assembly. The experimental results are shown in Table 3.

7. Conclusions

This article presented a new assembly method for the lateral thrust device of a pulse solid rocket motor, based on the study of the assembly process. It utilized techniques such as finite element analysis and DRL to address the assembly of inner and outer cylinders with flexible components. This method controlled the position state using deep reinforcement learning, solving the problem of O-ring damage during the lateral force inner and outer cylinder assembly process and obtaining a feasible assembly path. The following conclusions were drawn from the analysis:
(1)
In precision assembly processes with flexible media, the initial posture deviation between the assembled objects affects the assembly quality;
(2)
O-ring damage is related to the compression value, and it can be determined whether the O-ring has reached the required stress value by evaluating the deviation value;
(3)
Using DRL algorithms to plan the assembly path for guiding the assembly is a feasible method, resulting in viable assembly paths that effectively guide the assembly operation.
In the future, an in-depth analysis of assembly speed parameters will be conducted to enhance the current assembly process and improve its success rate. The deep reinforcement learning algorithm and the constructed learning environment can be further optimized to make the action process and environmental state closer to actual assembly, to comprehensively validate the effectiveness and discover issues. This study only conducted assembly verification in the YOZ plane, and further increasing the platform’s degrees of freedom for comprehensive validation could improve assembly accuracy.

Author Contributions

Conceptualization, G.L. and S.L.; methodology, G.L. and S.L.; software, G.L.; validation, G.L. and S.L.; formal analysis, S.L. and X.Z.; investigation, G.L.; resources, S.L.; data curation, X.Z.; writing—original draft preparation, G.L.; writing—review and editing, X.Z.; supervision, S.L.; project administration, X.Z.; funding acquisition, S.L. All authors have read and agreed to the published version of the manuscript.

Funding

This research received no external funding.

Data Availability Statement

The data presented in this study are available on request from the corresponding author. The data are not publicly available due to intellectual property protection.

Conflicts of Interest

The authors declare no conflicts of interest.

References

  1. Han, Z.; Da, W.U.; Xudong, W.; Rugen, W. Numerical Simulation of Lateral Jet of Micro Pulse Solid Rocket Motor. J. Proj. Guid. 2016, 6, 92–96. (In Chinese) [Google Scholar] [CrossRef]
  2. Jiwei, L.; Junwei, C.; Guorui, W.; Zeyuan, Z. Parameter Analysis of Assembling Rubber O Ring Based on Finite Element. Aero Weapon. 2017, 6, 72–76. (In Chinese) [Google Scholar] [CrossRef]
  3. Dietrich, F.; Buchholz, D.; Wobbe, F.; Sowinski, F.; Wahl, F.M. On Contact Models for Assembly Tasks: Experimental Investigation beyond the Peg-in-Hole Problem on the Example of Force-Torque Maps. In Proceedings of the 2010 IEEE/RSJ International Conference on Intelligent Robots and Systems, Taipei, Taiwan, 18–22 October 2010. [Google Scholar]
  4. Thomas, G.; Chien, M.; Tamar, A.; Ojea, J.A.; Abbeel, P. Learning Robotic Assembly from CAD. In Proceedings of the 2018 IEEE International Conference on Robotics and Automation (ICRA), Brisbane, QLD, Australia, 21–25 May 2018; pp. 3524–3531. [Google Scholar]
  5. Huang, S.; Murakami, K.; Yamakawa, Y.; Senoo, T.; Ishikawa, M. Fast Peg-and-Hole Alignment Using Visual Compliance. In Proceedings of the 2013 IEEE/RSJ International Conference on Intelligent Robots and Systems, Tokyo, Japan, 3–7 November 2013; IEEE: Piscataway, NJ, USA, 2013; pp. 286–292. [Google Scholar]
  6. Shen, Y.; Jia, Q.; Wang, R.; Huang, Z.; Chen, G. Learning-Based Visual Servoing for High-Precision Peg-in-Hole Assembly. Actuators 2023, 12, 144. [Google Scholar] [CrossRef]
  7. Xia, Y.; Yin, Y.; Chen, Z. Dynamic Analysis for Peg-in-Hole Assembly with Contact Deformation. Int. J. Adv. Manuf. Technol. 2006, 30, 118–128. [Google Scholar] [CrossRef]
  8. Chen, Z.; Gao, Y.; Dong, R.; Wu, B.; Li, J. Finite Element Analysis of Sealing Characteristics of the Rubber O-Ring for a Mechanical Seal. J. Sichuan Univ. Eng. Sci. Ed. 2011, 43, 234–239. [Google Scholar]
  9. Chuanjun, H. Seal Performance Analysis of a Star Sealing Ring in Reciprocating Seal. Lubr. Eng. 2012, 37, 28–32. [Google Scholar]
  10. Tingting, L.U.; Weimin, W.; Lifang, C. A Study of the Performance of an O-Ring Seal with Viscoelasticity. J. Beijing Univ. Chem. Technol. Sci. Ed. 2014, 6, 93–97. [Google Scholar]
  11. Zhang, Z.; Sha, B.; Wang, C.; Yan, T. Analysis of the Double-Sealing Performance of O-Ring in Reciprocating Movement Based on Abaqus. Guti Huojian Jishu J. Solid Rocket. Technol. 2019, 42, 85–91. [Google Scholar]
  12. Windslow, R.J.; Busfield, J.J.C. Viscoelastic Modeling of Extrusion Damage in Elastomer Seals. Soft Mater. 2019, 17, 228–240. [Google Scholar] [CrossRef]
  13. Sieben, C.; Reinhart, G. Development of a Force-Path Prediction Model for the Assembly Process of o-Ring Type Seals. Procedia CIRP 2014, 23, 223–228. [Google Scholar] [CrossRef]
  14. Hassan, S.; Yoon, J. Haptic Assisted Aircraft Optimal Assembly Path Planning Scheme Based on Swarming and Artificial Potential Field Approach. Adv. Eng. Softw. 2014, 69, 18–25. [Google Scholar] [CrossRef]
  15. Chang, W.C.; Andini, D.P.; Pham, V.T. An Implementation of Reinforcement Learning in Assembly Path Planning Based on 3D Point Clouds. In Proceedings of the 2018 International Automatic Control Conference (CACS), Taoyuan, Taiwan, 4–7 November 2018. [Google Scholar]
  16. Beltran-Hernandez, C.C.; Petit, D.; Ramirez-Alpizar, I.G.; Harada, K. Variable Compliance Control for Robotic Peg-in-Hole Assembly: A Deep-Reinforcement-Learning Approach. Appl. Sci. 2020, 10, 6923. [Google Scholar] [CrossRef]
  17. Chen, J.P.; Zheng, M.H. A Survey of Robot Manipulation Behavior Research Based on Deep Reinforcement Learning. Robot 2022, 44, 236–256. [Google Scholar]
  18. Dong, X.; Duan, Z. Comparative Study on the Sealing Performance of Packer Rubber Based on Elastic and Hyperelastic Analyses Using Various Constitutive Models. Mater. Res. Express 2022, 9, 075301. [Google Scholar] [CrossRef]
  19. Guo, C.; Haiser, H.; Haas, W.; Lechner, G. Analysis of Elastomeric O-Ring Seals Using the Finite Element Method. Mech. Sci. Technol. 2000, 19, 740–744. [Google Scholar]
  20. Chen, Z.; Liu, T.; Li, J. The Effect of the O-Ring on the End Face Deformation of Mechanical Seals Based on Numerical Simulation. Tribol. Int. 2016, 97, 278–287. [Google Scholar] [CrossRef]
  21. Wu, G.-P.; Song, B.-F.; Cui, W.-M. Reliability Analysis for O-Ring Seals with Shear Failure. Mach. Des. Manuf. 2009, 8, 125–127. (In Chinese) [Google Scholar]
  22. Xiao, T.; Quanhai, L. Fitting of Spatial Cylindrical Surface Based on 3D Coordinate Transformation. Geotech. Investig. Surv. 2014, 42, 79–82. [Google Scholar]
  23. Cui, L.; Wang, X.; Zhang, Y. Reinforcement Learning-Based Asymptotic Cooperative Tracking of a Class Multi-Agent Dynamic Systems Using Neural Networks. Neurocomputing 2016, 171, 220–229. [Google Scholar] [CrossRef]
  24. Kober, J.; Bagnell, J.A.; Peters, J. Reinforcement Learning in Robotics: A Survey. Int. J. Robot. Res. 2013, 32, 1238–1274. [Google Scholar] [CrossRef]
  25. Wei, Q.; Song, R.; Zhang, P.; Wu, Z.; Huang, R.; Qin, C.; Li, J.L.; Lan, X. Path Planning of Mobile Robot in Unknown Dynamic Continuous Environment Using Reward-modified deepQ-network. Optim. Control Appl. Methods 2023, 44, 1570. [Google Scholar] [CrossRef]
  26. Fan, J.; Wang, Z.; Xie, Y.; Yang, Z. A Theoretical Analysis of Deep Q-Learning. In Proceedings of the Learning for Dynamics and Control—PMLR, Online, 31 July 2020; pp. 486–489. [Google Scholar]
  27. van Hasselt, H.; Guez, A.; Silver, D. Deep Reinforcement Learning with Double Q-Learning. In Proceedings of the AAAI Conference on Artificial Intelligence, Phoenix, AZ, USA, 12–17 February 2016; Volume 30. [Google Scholar] [CrossRef]
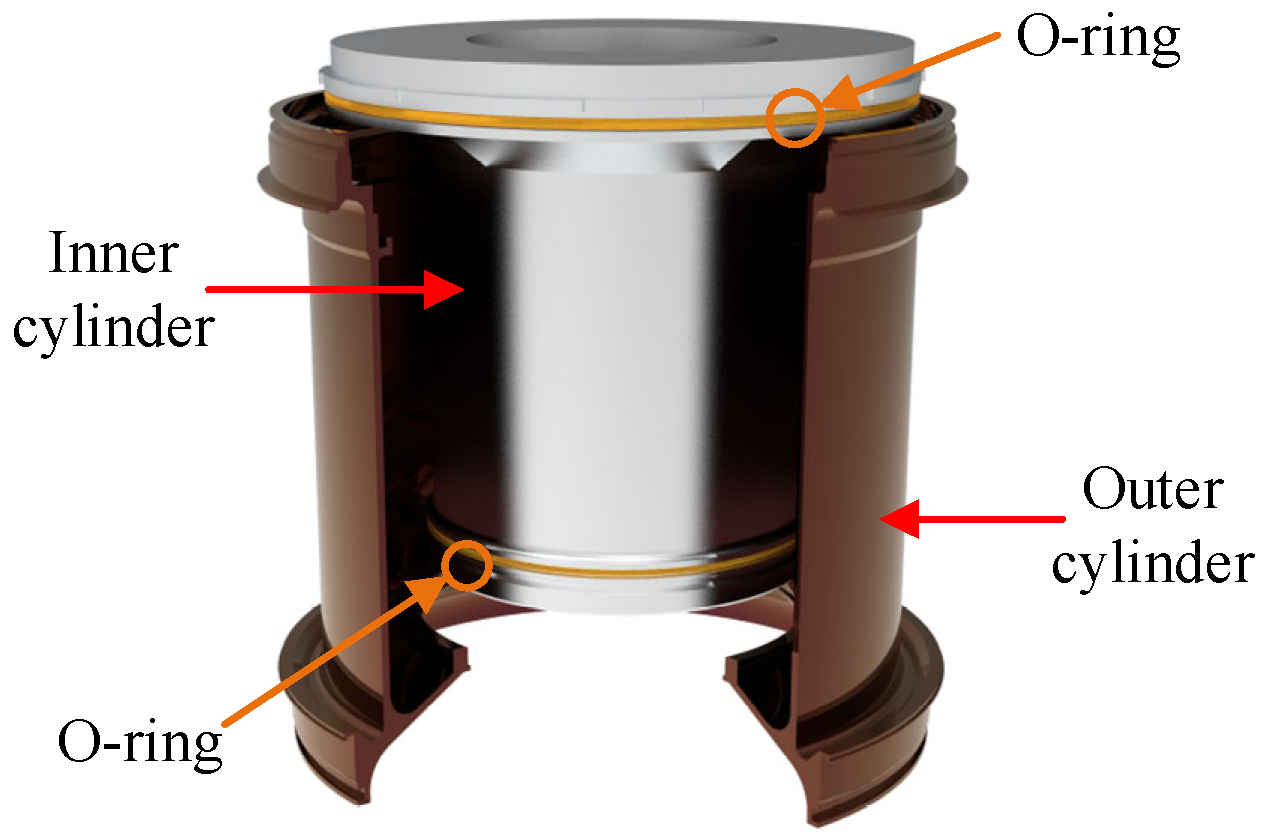
Figure 1. Lateral thrust device.
Machines 12 00287 g001
Figure 2. Lateral thrust device structure.
Machines 12 00287 g002
Figure 3. O-ring damage (this is a schematic diagram and a real damage diagram, with the red circle representing the damaged area and pointing to an enlarged view of the damage).
Machines 12 00287 g003
Figure 4. Assembly path planning based on DRL.
Machines 12 00287 g004
Figure 5. Simulation Diagram of O-Ring (the bule circle is an o-ring).
Machines 12 00287 g005
Figure 6. Mesh size.
Machines 12 00287 g006
Figure 7. Schematic diagram of mesh division.
Machines 12 00287 g007
Figure 8. O-ring simulation.
Machines 12 00287 g008
Figure 9. Assembly stress curve. (a) Assembly stress with different assembly parameters; (b) The relationship between assembly parameters and assembly stress.
Machines 12 00287 g009
Figure 10. Point cloud map of inner and outer cylinders.
Machines 12 00287 g010
Figure 11. Measuring coordinate system and cylindrical coordinate system.
Machines 12 00287 g011
Figure 12. Assembly position and orientation deviation.
Machines 12 00287 g012
Figure 13. DQN status update.
Machines 12 00287 g013
Figure 14. DDQN status update.
Machines 12 00287 g014
Figure 15. DRL flowchart.
Machines 12 00287 g015
Figure 16. State space.
Machines 12 00287 g016
Figure 17. DQN and DDQN training effect (the blue line is DDQN; the other is DQN).
Machines 12 00287 g017
Figure 18. Assembly path schematic diagram (The blue line represents the path, and the red box represents the assembly interval).
Machines 12 00287 g018
Figure 19. Assembly path.
Machines 12 00287 g019
Figure 20. Assembly experiment diagram (1—assembly frame; 2—precision assembly head; 3—inner cylinder auxiliary fixture; 4—inner cylinder; 5—outer cylinder; 6—mechanical gripper; 7—support plate; 8—carrying frame).
Machines 12 00287 g020
Figure 21. Assembly experiment diagram.
Machines 12 00287 g021
Table 1. Position and orientation deviation.
Numberda (mm)θ (°)Numberda (mm)θ (°)
10.1490.1110.1330.1
20.090.05120.0470.05
30.0550.07130.0450.05
40.0680.06140.0180.01
50.0220.02150.0350.02
60.0410.03160.0560.06
70.0170.01170.0480.05
80.0330.02180.0380.03
90.0950.07190.0670.07
100.0870.06200.0450.05
Table 2. Assembly path maximum deviation.
NO.123456789
maximum deviation
(mm)
0.0510.0580.0470.0450.0300.0810.0380.0800.049
Table 3. Assembly method comparison experiment.
No.Direct AssemblyMethod in This Paper
1Machines 12 00287 i001Machines 12 00287 i002
damageintact O-ring
2Machines 12 00287 i003Machines 12 00287 i004
damageintact O-ring
3Machines 12 00287 i005Machines 12 00287 i006
damageintact O-ring
4Machines 12 00287 i007Machines 12 00287 i008
damageminor damage
5Machines 12 00287 i009Machines 12 00287 i010
damageintact O-ring
Disclaimer/Publisher’s Note: The statements, opinions and data contained in all publications are solely those of the individual author(s) and contributor(s) and not of MDPI and/or the editor(s). MDPI and/or the editor(s) disclaim responsibility for any injury to people or property resulting from any ideas, methods, instructions or products referred to in the content.