1. Introduction
Currently, uncrewed aircraft systems or unmanned aerial vehicles (UAVs) are becoming increasingly popular. Despite the ongoing development of artificial intelligence, and automatic and automated control systems, as well as the improvement in information and technical systems, solving a number of problems requires the participation of a human operator in controlling the UAV. For example, a human operator is required to carry out a safe landing of a UAV if the probability of its crash increases due to the failure of one of its elements. It should be noted that currently “multiple operator–multiple UAV” systems (multiple operators—multiple UAVs) are becoming increasingly popular [
1,
2,
3]. The works [
4,
5] provide overviews of automatic UAVs. In such systems, a separate UAV at different times can be under the control of different pilot operators and each pilot operator can be involved in the control of different UAVs during its work [
6,
7]. In [
8,
9], the task of increasing the efficiency of the ergatic system and evaluating the operator’s condition when performing various tasks was not evaluated. A similar task was set in [
10] but it was not the condition of the operator that was assessed; the somewhat more detailed road situation was reported to him. A similar approach is typical for a significant part of other works [
11,
12]. The solutions considered by the authors, such as eye movement tracking and the brain–computer interface, are related only to attention control, but not to the distribution of tasks between the operator and the technical part of the ergatic system. Many researchers emphasize that switching the operator-pilot from controlling one UAV, located in certain conditions, to another UAV, the specifics of the external environment of which require a change in the dominance of psychological processes, such as sensory–perceptual, motor and intellectual, cause stress in the operator-pilot. Another cause of stress is the transition from monotomy and underutilization of the operator-pilot to his full workload. Stressful conditions for a human operator lead to a decrease in the productivity of information processing by the operator-technologist, which leads to a decrease in the reliability indicators of the entire ergatical system, which includes a UAV automated control system and operator-technologists [
13,
14]. Reliability in technology is understood as a property that characterizes the ability of a system to maintain its state over time (for example, serviceable, operational, inoperative, etc.).
The purpose of this work is to develop a method for increasing the efficiency of the operator-pilot of an unmanned aerial vehicle and increasing the reliability of the ergatic control system of the UAV.
2. Materials and Methods
2.1. Operator-Pilot Performance Efficiency
The “productivity” of information processing in ergatic systems, which is discussed above, is one of the indicators of the effectiveness of the activity of a human operator. The effectiveness of a human operator is a property that characterizes the accuracy of his control decisions and the time it takes to make them. The accuracy of control decisions is determined by the ratio of the achieved result (by one or another criterion, for example, by a criterion that takes into account energy costs when executing commands of a human operator) to the maximum achievable or pre-planned result. However, the traditional approach quite often considers the effectiveness of the ergatic system while ignoring or minimizing the role of the operator’s state [
15,
16,
17]. At the same time, it is obvious that there are certain limits to the efficiency of operator activities, beyond which they begin to yield to control systems based on AI. The reverse is true. There are modes of operation of the ergatic system in which the automatic control system loses to the human operator. The activity of a human operator can be represented by a sequence of actions performed when controlling a UAV [
18]. The action of the operator-pilot is understood as an element of activity aimed at performing the current task of controlling the UAV [
19]. A decrease in the efficiency of the human operator can cause accidents in ergatic systems. Therefore, one of the ways to reduce accident rates in ergatic systems is to increase the efficiency of operators (pilot operators, process operators, etc.). In the case of the presented model, we consider a situation where the operator’s effectiveness depends on the strength of the incentive (i.e., the information received). In this case, the state of the operator himself changes, which serves as commands for switching to various system control modes. Within the framework of the model under consideration, the remaining parameters, for example, operator experience, task parameters, the UAV itself, etc., are considered independent of the operator’s state and are not taken into account in the model. In other words, the difference between the behavior of the ergatic system under different psychophysiological states of the operator is considered, all other characteristics being equal. The time it takes for the operator-pilot to make a control decision is called the latent time of actions when controlling the UAV [
20]. The latent time of action (LTA) of a human operator (operator-pilot) when controlling a UAV is the time interval from the moment it receives information from the senses until the moment a control decision is made. Let us express the efficiency of the operator-pilot’s labor activity as follows:
where
is the value of the efficiency value of the labor activity of the operator-pilot of the ergatic system at the moment of time
t (dimensionless quantity).
is the probability that the control action of the pilot operator at a moment in time will be erroneous.
is assessment of the value of the latent time of the operator-pilot’s actions when controlling the UAV at time
t, s.
Without loss of generality, we will assume that the pilot operator, being in any of his functional states (FSs), does not commit erroneous actions (
), since he has a sufficient level of qualifications to perform his job. Then, we will evaluate the effectiveness of work activity
based on an analysis of the time it takes to develop a control decision or its latent time of action (LTA):
2.2. Assessment of the Functional State of the Pilot Operator
One of the ways to obtain an assessment of the FS of a human operator (operator-pilot, operator-technologist) is to analyze his biomedical signals, such as (1) bioelectrical activity of the human brain; (2) activity of changing the optical orientation of the human eyeball [
21]; (3) electrical activity of human skin [
22]; (4) human heart rate variability (HRV) [
23], etc. The disadvantages of using EEG are the low ergonomics of the devices and the relatively small number of highly informative signs of the condition. The dynamics of eye movement, including measurements of pupil diameter, reflects the operator’s distribution of attention but is not informative enough to assess the general condition. The electrical activity of the skin is sensitive to the condition of the operator’s skin. Heart rate variability allows you to assess the user’s functional stress, which is an integral indicator [
24] and thus provides insight into the operator’s current state. Human heart beats can be recorded either with an electrocardiograph or with a heart rate monitor attached either to a finger or to the wrist, or to the chest, etc. In most cases, the cost of electroencephalographs is slightly higher than the cost of heart rate monitors. Changing the level of illumination in the room in which the human operator is located affects the number of time intervals during which tracking the “orientation of the optical axis of the eyeball” of a person is impossible but has virtually no effect on the accuracy of recording a person’s heartbeats. Therefore, to obtain an assessment of the efficiency of the operator-pilot’s work, in this work we will perform a medical analysis of his (the operator-pilot’s) FS through digital processing of his HRV recording. Recording the pulse (or heartbeat) of the operator-pilot can be carried out continuously throughout his entire working day without causing him great inconvenience, and the proposed method for assessing the functional state will make it possible to obtain a continuous assessment of changes in the functional state of the human operator, an assessment of the effectiveness of his activities and an assessment of the latent time of his actions (
). Forecasting FS will improve the reliability and emergency safety of ergatic systems due to the fact that the system will be able to determine in advance that the available actions (
) will not be enough to successfully transfer the ergatic system from a pre-failure (pre-emergency) state to a state of normal operation and launch the appropriate safety system mechanisms in advance to prevent an accident.
2.3. Method for Constructing a Psychophysiological Portrait (PP) of HRV of a Human Operator
HRV is a series of time intervals between two consecutive heart beats (Equation (
3)). Often, a heartbeat is determined by the R wave on an ECG and the interval between adjacent heartbeats is called the RR interval. In this case, HRV is represented by a series of RR intervals:
where
A is a series of heart rate variability (or a series of RR intervals).
is RR interval value (time between two consecutive heart beats), s.
is number of RR intervals in the row
A.
To analyze heart rate variability (HRV), statistical and spectral indicators of HRV are calculated. Calculation of statistical indicators of HRV is carried out over a series of NN intervals. A series of NN intervals is a discrete derivative of the series of heart rate variability.
Let us define the FS of a human operator as a vector of statistical and spectral HRV indicators:
where
is
j-th FS of the
h-th human operator.
is
k-th element
.
is serial number of the operator-technologist.
is serial number of the FS of the
h-th human operator.
2.4. Classification of the Functional State of a Human Operator of an Unmanned Aerial Vehicle
When solving the problem of increasing the reliability and emergency safety of an ergatic system, it is necessary to take into account that the human operator, in the process of performing his work, may be in a state of “functional tension” (or incapacitated state) and also work in conditions of a shortage of time available for making control decisions [
25,
26,
27]. To differentiate these states, we will classify the FS of a human operator using an automated control system for unmanned aerial vehicles [
28,
29]. Let us include in this classification the state of a human operator when working in real working conditions and when working on a simulator, since the use of training systems containing simulators is a generally accepted way to improve the skills of operator-pilots of ergatic systems [
30,
31,
32,
33,
34,
35]. We will classify the FS of the human operator of the ergatic system under consideration (performing automated control of the UAV) using a nominal scale, the list of elements of which is given in
Table 1.
2.5. Psychophysiological Portrait of a Human Operator Based on Heart Rate Variability Signals
The functional state of a person generalizes the degree of activity of his regulatory systems. Let us determine the PP of a human operator based on HRV signals for the functional state as a vector from the ranges of values of the spectral and statistical characteristics of HRV:
where
is the PP of the human operator based on HRV signals for the FS state. state is designation of the FS of the human operator.
is range of
k permissible values of the human operator
h and FS parameter state.
is a variety of psychophysiological portraits that correspond to the functional state of the human operator
h.
2.6. Determining the State of the Human Operator
In Equation (
5), the psychophysiological portrait of HRV FS of a human operator is defined as an area in the hyperspace of spectral and statistical characteristics of HRV. This area is specified by accumulated statistical data (points in hyperspace) about the values of HRV indicators of a human operator when he is in the considered FS state.
For all considered states of the human operator, except for the incapacitated state, we will construct a PP. We will determine the FS of a human operator as follows:
Let us determine whether the human operator is in a disabled state (or a state of functional tension). We will assume that the human operator is in an incapacitated state (SS) if the point in hyperspace that describes the current FS of the human operator does not belong to any of the areas of the FS of the able-bodied FSs (NS,PS,WS) of the human operator. We will perform a shutdown if the human operator is inoperative.
Let us find out which of the able-bodied (NS,PS,WS) FSs of the human operator his current FS best corresponds to. This is a clustering task (there are 3 clusters and it is necessary to determine which cluster the current state of the operator belongs to). Methods for solving the clustering problem are centroid classification, weighted k-nearest neighbors algorithm, etc.
2.7. Sequence of Information Processes When Controlling a UAV in Automated Mode
Let us assume that the ergatic system is in a pre-failure state and its transfer to normal functioning occurs in an automated mode. Let us consider the sequence of data transfer processes in this case: (1) the information collection system sends the UAV ACS (automated control system for unmanned aerial vehicles) and the human operator the values of the ergatic system indicators; (2) The UAV ACS informs the human operator activity monitoring system about the UAV’s transition to a pre-failure state and sends an alarm signal to the human operator; (3) the human operator spends time developing a control decision (this time is called the latent time of the human operator’s actions) and sends commands to the manual control system; (4) the manual control system sends control signals to the UAV, executing the commands of the human operator. Taking into account this sequence of information transfer processes, we will draw up a diagram of the time intervals of information processing processes that occur when the UAV is transferred from a pre-failure state to a state of normal operation (
Figure 1).
In
Figure 1a, the required time is less than the available time; therefore, the transfer of the UAV to a state of normal operation can be performed in an automated mode, that is, with the participation of a human operator in the process of controlling the UAV. In
Figure 1b, the required time is greater than the available time; therefore, the transfer of the UAV ACS to a state of normal operation must be performed in automatic mode.
is the value of the response time of the measuring (the measuring device allows you to obtain an estimate of the value of the X observed parameter) device (the time that will pass from the moment the measurement begins until the moment the measuring device makes an estimate of the value of the measured parameter and transmits it to the information collection system), s.
is time for executing user commands by the manual control system, s. It is determined by the time interval from the receipt of the operator’s command until the completion of execution of this command by the manual control system.
X is assessment of the value of the observed parameter of the UAV ACS, by which its (UAV ACS) state is determined, nominal units.
is the nominal value of the observed parameter of the UAV ACS or the value, the excess of which X means the transition of the UAV ACS to a pre-failure state, nominal units.
is critical value of the observed parameter of the UAV ACS; nominal units the UAV ACS has entered the limit state if X exceeds .
is the moment of transition of the UAV automated control system to the pre-failure state, s.
is the moment of transition of the UAV ACS to the limit state, s.
2.8. Dependence of the Efficiency of the Operator-Pilot on His Functional State and Deviations of the UAV ACS Parameters from Their Nominal Values
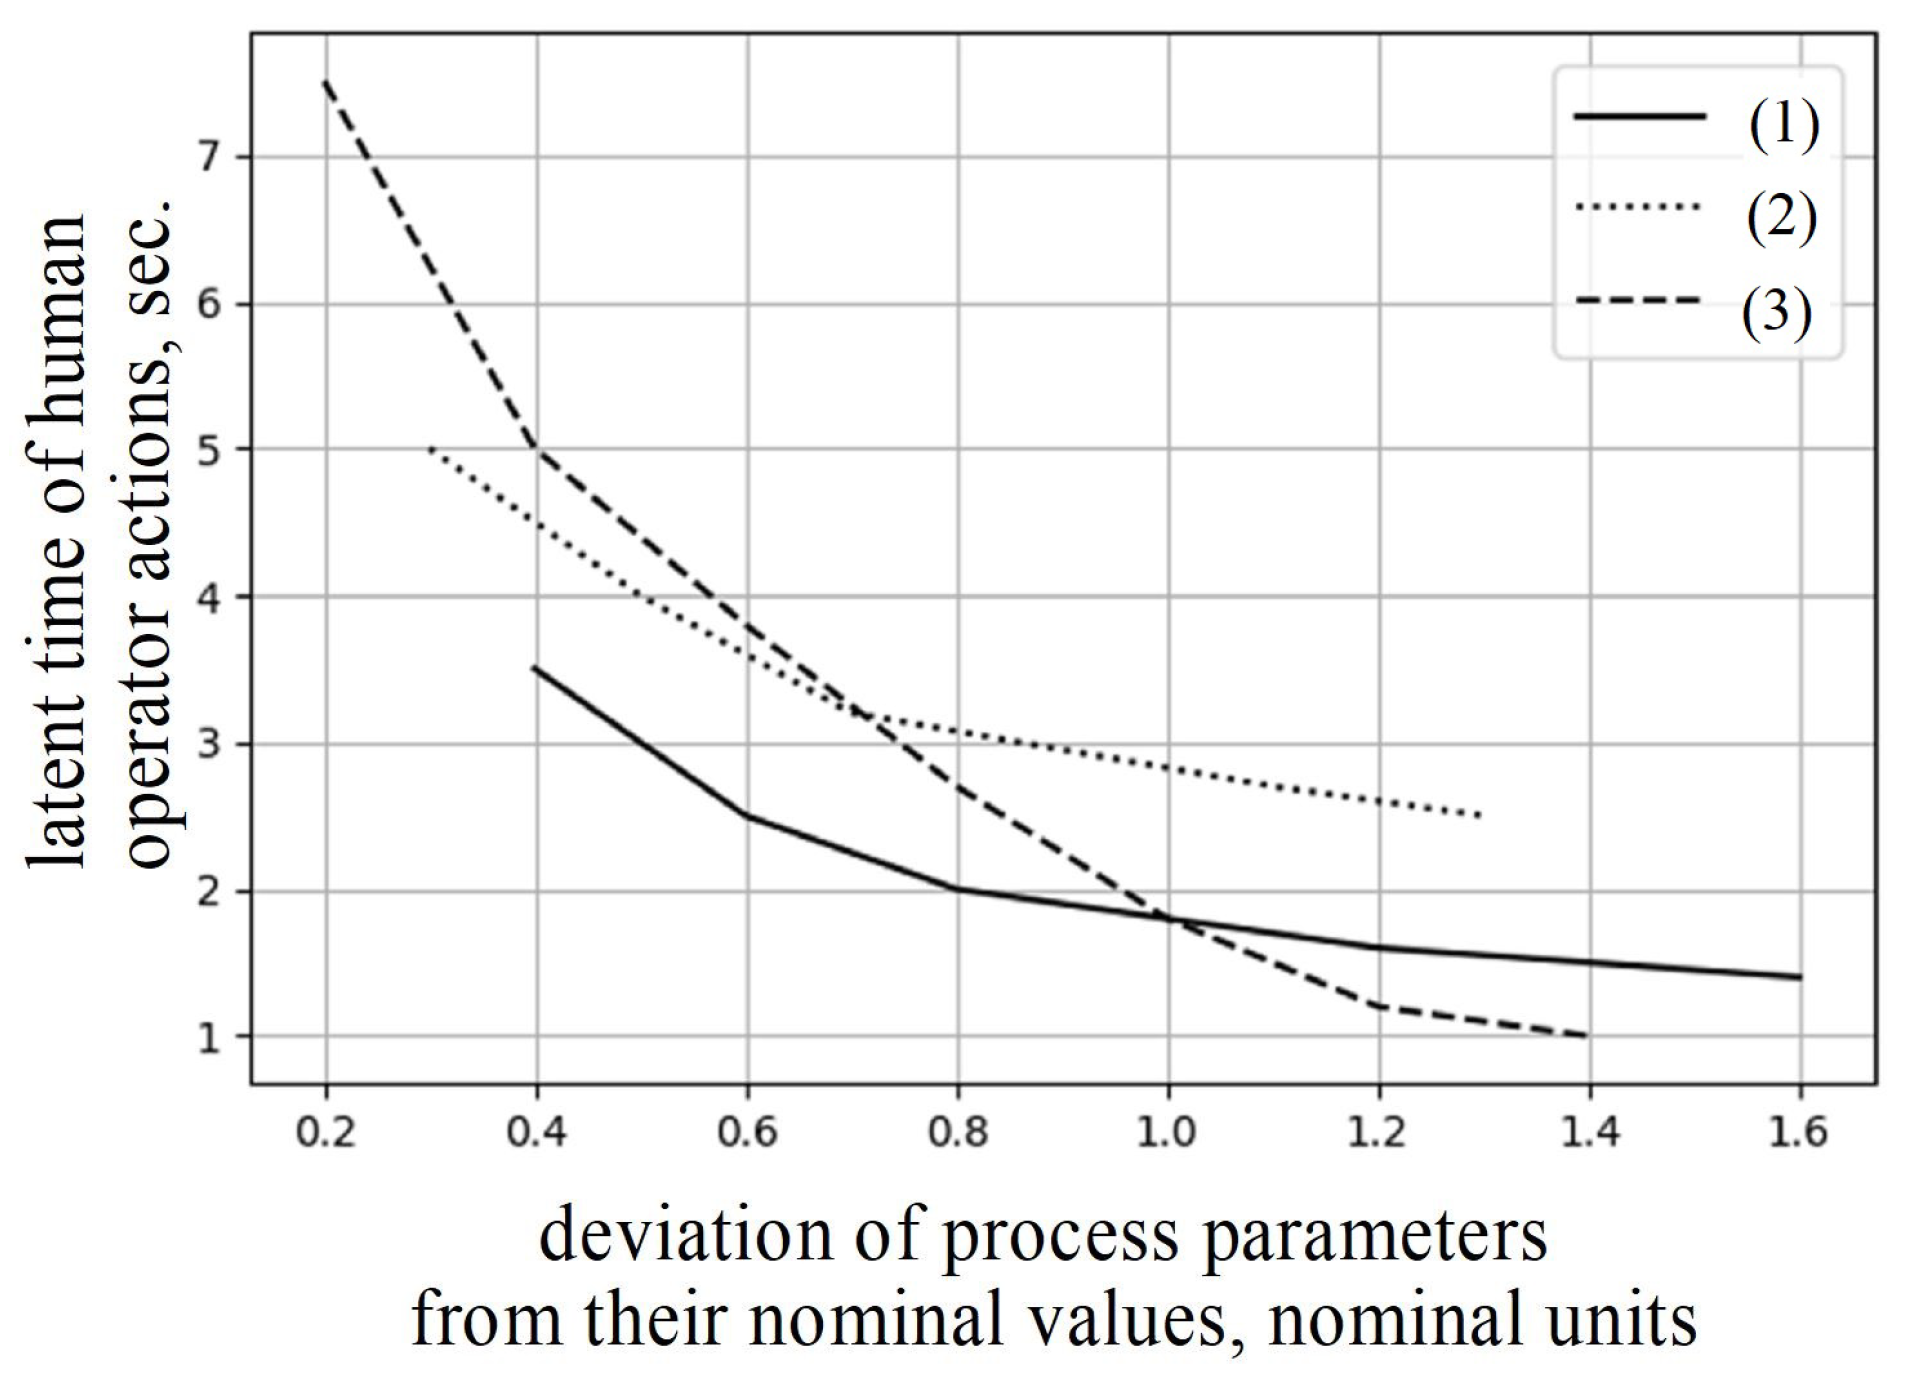
Let us consider the “force–duration” law (or the law of changes in the speed of information processing in biological systems when varying the quantitative indicators of information received for processing, for example, the frequency or intensity of light) [
36]. This law shows that an increase in the magnitude of a stimulus (or irritant) entails a decrease in the response time of biological tissues to this stimulus (irritant). As a stimulus, we will consider the deviation of the values of the ergatic system indicators from their nominal values. In general, information about the state of the UAV, which is available to the operator, is in the aspect of engineering psychology and psychophysiology—a stimulus for his higher nervous activity. The model considers the “strength of stimulus” in physiology and it is necessary to take physiology into account in the design of any ergatic system; it has been proven that the stronger the stimulus, the shorter the latent response time of the system. But up to a certain level. Therefore, an obstacle is also a variant of a stimulus. And if this stimulus is assessed by the operator as strong, then the reaction time to the interference will decrease.
According to the “force–duration” law, the response time should depend inversely on the magnitude of the stimulus; in this case, the stimulus is the current (
X) value of the observed parameter of the UAV ACS and the rate of its change (
).
Table 2 shows the sequence of statements when drawing up a formula for estimating the latent time of actions of the operator-pilot of the UAV automated control system.
Table 2.
Sequence of statements when drawing up a formula for calculating an estimate of the latent time of the operator-pilot’s actions from deviations of the UAV parameters from their nominal values.
Table 2.
Sequence of statements when drawing up a formula for calculating an estimate of the latent time of the operator-pilot’s actions from deviations of the UAV parameters from their nominal values.
| Statement | A Comment |
|---|
| (1) The function must be decreasing and convex downward. | According to the force–duration law (Figure 2). |
| (2) The domains of determination of the parameters of the function and are specified by the conditions of the ergatic system. | The first argument is not (the deviation of the parameter value from the threshold value), but X, since is a constant. |
| (3) Area of value . | and are minimum and maximum values of the latent time of human operator actions (constants; determined experimentally), s. |
| (4) Construct a function in the form of a product of three functions:
, , . b is a decreasing function, and c is decreasing and convex downward. To bring the range of values of the product of these functions to , the final dependence takes the form . | is coefficient of reduction (nominal units/s) to a dimensionless quantity, numerically equal to 1 (s/nominal units). |
Thus, the formula for estimating the latent time of actions takes the form (
Figure 3 shows a graph of this function):
Considering the time interval diagram shown in
Figure 1, the condition for the need to transfer the UAV ACS to a state of normal operation will take the form:
is the time interval after which the system will either go into an emergency state or an accident will occur. In the general case, we consider a situation where, at each moment of time, with an acceptable level of ACS, the UAV can be described by a function, among the values of the derivatives of which, only the first derivative can take a non-zero value:
where
is the rate of change of the observed parameter in the vicinity of the moment of measurement of the parameter, nominal units/s.
Let us combine the time intervals of the considered process of bringing the system from a pre-emergency state to a state of normal operation that does not relate to a human operator:
Let us substitute Equations (
7), (
9) and (
10) into Equation (
8):
Failure to satisfy condition (
11) means that
is not enough for the human operator to develop a control decision and for the actuator of the manual control system to carry it out. In this case, it can be argued that the UAV will go into a limit state until the execution of the control command of the human operator is completed. Therefore, failure to satisfy condition (
11) may cause the UAV ACS to switch to automatic control mode. Based on the fact that condition (
11) is always true, if the technological process is in a state of normal operation (
), then failure to fulfill condition (
11) is possible only if the UAV ACS is in a pre-failure state. Consequently, failure to fulfill condition (
11) means not just a transition of the automated process control system to automatic control mode but an emergency stop of the UAV automated control system. An emergency stop is necessary to avoid the UAV going into a limiting (dangerous) state. During an emergency stop, the UAV goes into an inoperable state and, to restore its functionality (transfer to a state of normal operation), it is necessary to perform some restoration work. Knowing the ranges of parameter values that are included in (
11), it is possible, by conducting a simulation of the transfer of the UAV ACS from a pre-failure state to a state of normal operation, to obtain an estimate of the probability that, with the UAV ACS under the control of a given operator-pilot, he will stop the UAV ACS if it (ACS UAV) goes into a pre-failure state. The values of such probabilities calculated for various operators can be used to rank people for the position of operator-pilots (it is more advisable to choose an operator-pilot for whom the probability of stopping the UAV ACS when a pre-emergency condition occurs is the least) [
37,
38].
2.9. Ergatic Control System for Unmanned Aerial Vehicles
Let us draw up a diagram of information flows in the ergatic control system for unmanned aerial vehicles (
Figure 4). We will consider the interaction of 4 elements: (1) supervisor; (2) operator-pilot; (3) automated control system for unmanned aerial vehicles; (4) unmanned aerial vehicle. A system with one leader, multiple pilot operators, one automated UAV control system and multiple unmanned aerial vehicles is considered. The leader, pilot operators and unmanned aerial vehicles do not interact with each other, but exchange information only through an automated control system.
The leader determines the set of tasks that need to be performed based on operational data on the workload and functional states of pilot operators and the states of unmanned aerial vehicles. The automated control system selects the UAV to perform the task and also assigns an operator-pilot to control the UAV in an automated manner if necessary. The UAV can perform the task either in an automatic mode (without control commands from the pilot operator) or in an automated mode (with the participation of the pilot operator in controlling the UAV).
We will select a model for predicting the efficiency of the labor activity of a human operator of an ACS UAV (automated control system for unmanned aerial vehicles). Predicting the FS will improve the reliability and emergency safety of the ergatic system due to the fact that the system will be able to determine in advance what will not be enough to successfully transfer the UAV ACS from a pre-failure (pre-emergency) state to a state of normal operation and launch the appropriate safety system mechanisms in advance to prevent an accident from occurring. Let us select a model for predicting the effectiveness of the work activity of the operator-pilot.
Making a forecast of a person’s HRV—forecasting the time series of his cardiac intervals. A recording of a person’s HRV signal can be obtained using various monitoring and diagnostic equipment, such as an electrocardiograph or a heart rate monitor. The output of most such equipment is some kind of digital signal. Further, without loss of generality, from the entire variety of monitoring and diagnostic equipment, we will consider heart rate monitors, since digital signals from the majority of monitoring and diagnostic equipment that can be used to receive an HRV signal contain an assessment of related biomedical processes. An electrocardiograph records the intensity of the electric field that is formed during the functioning of the human heart and is called a cardiogram. The heart rate monitor produces a signal called a pulsogram. Pulsogram is a recording of an assessment of changes in blood volume in the vessels of a certain area of the human body. Contraction of the human heart causes an increase in the level of electric field strength and blood volume in human vessels in the vicinity of the time of this contraction. The time points of the pulse wave peaks in the recording signal received from the heart rate monitor or the “teeth” (for example, r-waves) on the electrocardiogram can be considered the time points of heart contraction. Then, HRV is a time series between time intervals between successive pulse wave peaks or between successive r-waves on a cardiogram.
Signals from most heart rate monitors (and cardiographs) may contain so-called “artifacts”. “Artifacts” represent interference in the recording of a pulsogram (or cardiogram). This interference can “distort” the signal so much that pulse wave peak detection algorithms will produce “false positive” and “false negative” results. In other words, the HRV series of a human operator, which is calculated by this algorithm, may contain unnecessary values in the time series and some cardiac intervals may be missing in it. Therefore, it is required that the accuracy of the forecast compiled by this mathematical model decreases as little as possible in the presence of both excess and absence of some elements of a number of HRVs of the human operator (operator-pilot). To assess the accuracy of the forecasts, the most commonly used are the mean absolute percentage error (MAPE) and the root mean square error (RMSE).
Time series forecasting is performed using the following mathematical models: (1) regression and autoregressive; (2) neural network; (3) Markov chains; (4) decision trees; etc. [
34]. Each of these models has its own advantages and disadvantages over other models. In this work, we will analyze the results of forecasting time series using a linear regression model, a multilayer perceptron and a neural network with long short-term memory (LSTM) nodes.
3. Results and Discussions
The experiments were conducted in a closed room, where HRV indicators were recorded during the control process of the ergatic system. A cardiograph with a discrediting frequency of 1 kHz and a 24-bit ADC was used to collect data. Sequences of RR intervals representing heart rate variability were constructed from the obtained ECG curves. To conduct the investigation, we obtain a database of HRV records of 50 of both sexes aged from 18 to 60 without diseases of the cardiovascular system. The database contains one HRV record for each person. The recordings range in length from 70,000 to 150,000 cardiac intervals. From each HRV record, we select 30,000 consecutive cardiointervals for the training set and 30,000 consecutive cardiointervals for the test set. The set of cardiointervals that are included in the training set does not intersect with the set of cardiointervals from the test set. A quadcopter was used as a UAV for indoor flight with a stabilization system. The weight of the quadcopter was 210 grams; it had four two-blade propellers in individual fairings. Control was via Wi-Fi channel. All 50 participants controlled the ergatic system while sitting in a chair in a comfortable position. Records from one user and several control series were combined into one sequence. A similar approach has been tested for controlling a self-propelled chassis [
39,
40,
41,
42].
To investigate the influence of the presence of “false positive” and “false negative” heartbeat detection results in the training sample on the prediction results, a set of a certain number of training samples is formed: (1) 10 samples simulating the presence of “false negative” heartbeat detection results (from 10 to 1% in steps of 1%); (2) training sample without any changes; and (3) 10 samples simulating the presence of “false positive” heartbeat detection results (from 1 to 10% in 1% increments). Samples with “false negative” results of detecting heart beats are formed by removing a certain number of randomly selected cardiac intervals and samples with “false positive” results are formed by copying a certain proportion of arbitrary cardiac intervals to arbitrary positions of a series of HRV training samples. Each model is trained using only one test set. Thus, when working with one signal, (1) 21 training samples and one test sample are formed; (2) 63 models for forecasting are compiled—three models (linear regression, multilayer perceptron and neural network with LSTM nodes) for each training sample; (3) for each of these models, a set of forecasts is compiled using a test sample and the forecast accuracy metric is calculated. A set of MAPE and RMSE is used as a metric for forecasting accuracy. The following points are used from the results of one of our past works: (1) the epoch of analysis of all models is 30 cardiointervals; (2) the model produces a forecast for 1 cardiointerval; the forecast for a larger number of cardiointervals is calculated recurrently; (3) forecasts are made for 30 cardiointervals.
It should be noted that, before the formation of training and test samples, the HRV signals were subjected to two transformations: (1) removal of the high-frequency component of the HRV signal (HF, from 0.15 to 0.4 Hz); (2) linear mapping of the range of values so that it becomes equal to the segment [0, 1]. Fluctuations in HF HRV are associated with human breathing, which can be voluntarily controlled by it. It has been experimentally established that more accurate forecasts are achieved after removing HF HRV. HF HRV is removed using a moving average. The linear mapping of the range of values is dictated by the need to improve the accuracy of floating point calculations in forecasting models.
Figure 5 shows the algorithm for calculating the forecasting results. The forecasting results are combined according to the method of forming the training set (for example, the training set is formed by removing 3% of cardiac intervals or adding 7%) and the 25th, 50th and 75th percentiles of their MAPE and RMSE are calculated (
Figure 6). That is, each point on the graph is a percentile calculated based on the results of predicting 150 (three (linear regression, multilayer perceptron and neural network with LSTM nodes) for each of 50 HRV signals) out of 3150 (3 × 21 × 50) models.
We will also conduct an investigation of the dependence of prediction accuracy on the number of points in the training set.
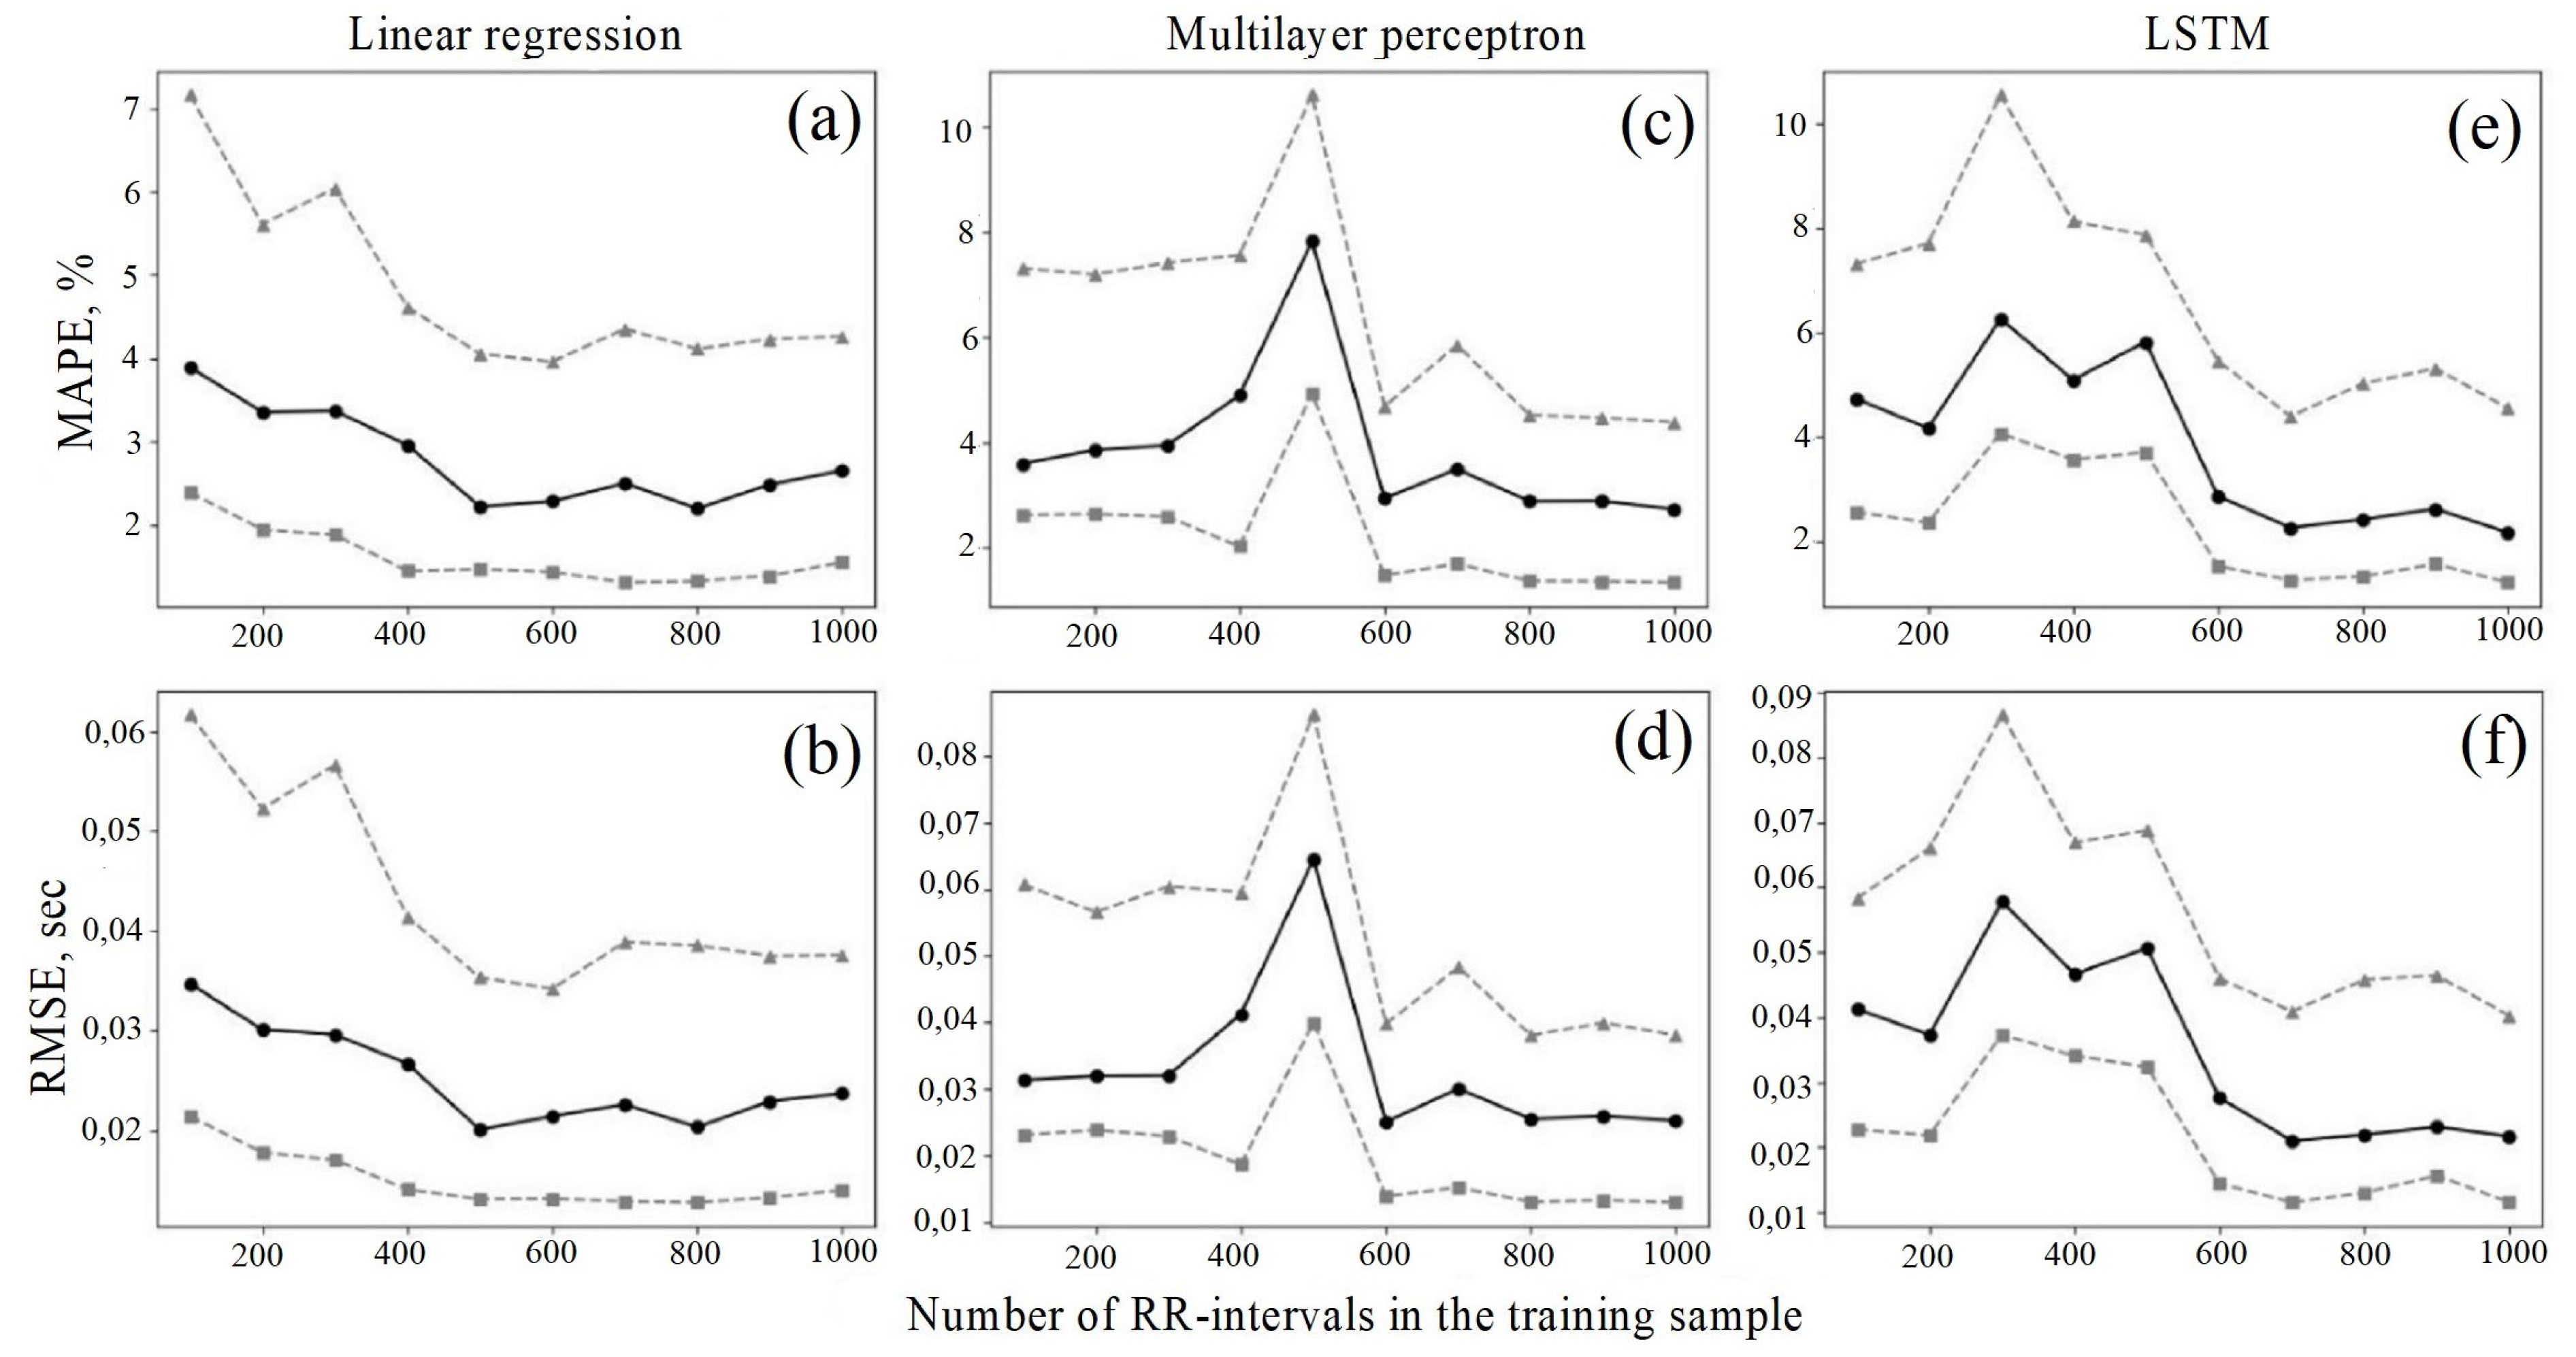
Figure 6 shows graphs of the dependence of prediction errors (MAPE and RMSE) on the number of points in the training set. The number of points in the training set varied from 100 to 1000 in increments of 100 cardiac intervals. The number of training epochs is 1000. Cross-validation was carried out when identifying models. The graphs are plotted for three classes of models—linear regression, multilayer perceptron and neural network with LSTM nodes. Each graph has three curves—the upper quantile, the lower quantile and the median. For all three models, the MAPE value does not exceed 4% if the size of the training sample is more than 700 cardiac intervals.
Figure 7 shows graphs of the dependence of prediction errors (MAPE and RMSE) on the number of points in the training set. The number of training epochs is 10,000. Cross-validation was not performed. The number of points in the training set varied from 100 to 1000 in steps of 100 cardiac intervals. The value of the prediction error (MAPE) does not exceed 3% for the models under consideration if the size of the training sample is more than 600 cardiac intervals.
Figure 7 shows that the peak of prediction errors, except for the shortest sequences, falls in the region of 500–700 cardiac intervals. This phenomenon has two reasons. The first is the presence of fluctuations in the so-called VLF and ULF range of HRV. Being low-frequency components of HRV, they form a trend, the definition of which, depending on its characteristics, is not always possible, which affects the accuracy of the forecast. The second reason is the specified epoch. The analysis is a 10 min flight on a UAV, which in most cases requires the pilot to perform any active actions. The presence of these actions, i.e., reactions in response to a stimulus, leads to the appearance of HRV patterns that differ from the “background” ones, which affects the accuracy of the forecast. Increasing the duration of analysis allows you to include these phenomena in the training sequence and thereby eliminate errors in the system when they occur.
Figure 8 shows graphs of the dependence of prediction errors on the number of points in the training set. No cross-validation was performed. The number of training epochs is 10,000. The size of the training sample varies from 1000 to 10,000 in increments of 1000 cardiac intervals. For a linear regression network and a neural network with LSTM nodes, the median MAPE does not exceed 4%.
Figure 9 shows graphs of the dependence of HRV prediction errors on the proportion of “false positive” or “false negative” results for determining heart beats. When using neural networks with LSTM neurons, the prediction accuracy does not depend on “false positive” and “false negative” results of detecting heart beats in the training set, if they are no more than 9%.
Based on
Figure 9, it can be seen that both linear regression and the multilayer perceptron as a whole are sensitive to the proportion of HRV detection errors, i.e., the quality of the input parameters of the series. This is all the more significant a result because, in the course of its activity, the UAV operator can make sharp and high-amplitude movements, which will affect HRV registration and contain interference. Thus, it is obvious that, for the high-quality operation of the algorithm, it is necessary to combine both LSTM approaches, which give a low number of false positive solutions, and multilayer perceptrons, which give a lower number of false negative solutions.
The distribution studied by the authors in this work on the basis of their own experimental data allows the ergatic system to flexibly respond to the current state of the operator, which it distinguishes better from systems [
8,
9,
11,
12] implemented both for improving only the technical part of the system, and on the basis of systems that control the operator’s attention but do not provide a change in the system’s ability to accept commands generated by the operator. Based on the investigation of the influence of the accuracy of the forecasts made, the following results were obtained: (1) it is necessary to remove the HF component of HRV; (2) the minimum size of the training sample to obtain MAPE < 4% is 600 cardiointervals; (3) there is no need to carry out cross-validation with 10,000 epochs of training a linear regression model, a multilayer perceptron or a neural network with LSTM neurons; (4) MAPE of prediction when using neural networks with LSTM neurons does not exceed 4% if the training sample contains no more than 9% of “false positive” or “false negative” heartbeat detections.
4. Conclusions
To increase the reliability of the UAV automated control system, it is proposed to build a decision support system. This system continuously monitors changes in the FS (functional state) of the human pilot of the unmanned aerial vehicle and selects the control mode of the unmanned aerial vehicle (automatic or automated). The proposed system should increase reliability (increase uptime due to reduced probability of failure) and emergency safety (reduce the probability of failure leading to a dangerous state).
As a result of the analysis of the constructed state diagram of the ergatic system, the indicators of reliability ( is the probability of recovery of the technological process from a pre-failure state to an operational one) and emergency safety ( is the probability of the transition of the ergatic system from a pre-failure state to the limit state) were determined. A block diagram of a decision support system (DSS) is presented to improve the reliability and emergency safety of ergatic systems. The proposed DSS selects the control mode for the ergatic system (automatic or automated). The choice of mode depends on the relationship between the time available () for transferring the technological process to an operational state and the necessary () time intervals, as well as on . The assessment consists of parameters that are determined by the terms of the technological process. calculated using a psychophysiological characteristics of a human operator and a forecast of changes in the functional state of a human operator.
To increase reliability, this work involves predicting the work efficiency of the operator-pilot. To predict the efficiency of the operator-pilot, it was decided to make a HRV forecast. Based on the fact that signals from control and diagnostic equipment that can be used to calculate HRV inevitably contain noise at the current level of technology development, it was decided to investigation the change in forecast accuracy in the presence of so-called “false positive” and “false negative” results in a series of HRV detecting heart beats. It has been determined that at least 600 cardiac intervals are required to obtain a MAPE < 4%. It has been established that it is not necessary to carry out cross-validation for 10,000 epochs of training a linear regression model, a multilayer perceptron or a neural network with LSTM neurons. No significant reduction in forecasting accuracy (in the presence of up to 10% “false positive” or up to 10% “false negative” results of heartbeat detection) was found when using the models under consideration and more accurate forecasts are made using a neural network model with LSTM nodes.


