Article

Optimal Torque Control of the Launching Process with AMT Clutch for Heavy-Duty Vehicles

by
Xiaohu Geng
*,
Weidong Liu
,
Xiangyu Liu
,
Guanzheng Wen
,
Maohan Xue
and
Jie Wang
State Key Lab Automot Simulat & Control, Jilin University, Changchun 130025, China
*
Author to whom correspondence should be addressed.
Machines 2024, 12(6), 363; https://doi.org/10.3390/machines12060363
Submission received: 29 March 2024 / Revised: 16 May 2024 / Accepted: 21 May 2024 / Published: 23 May 2024
(This article belongs to the Section Vehicle Engineering)

Abstract

:
When launching a heavy-duty vehicle, torque and position control during automatic clutch engagement is critical, and the driver’s intention to launch and changes in the vehicle’s launching resistance make clutch control more complex. This paper analyses the automatic engagement process of automated mechanical transmission (AMT) clutches and proposes an optimal control of the clutch torque for launching heavy-duty vehicles. Firstly, a fuzzy neural network (FNN)-based vehicle launching states recognition (LSR) system is designed for distinguishing the driver’s launching intention and the vehicle’s launching equivalent moment of resistance. Secondly, jerk, friction work, and launching reserve power are taken as the performance indexes for clutch torque optimization, the weight coefficients of each performance index are adjusted according to the LSR results, and the optimal clutch torque is solved by using the minimum value principle based on the shooting method. Finally, simulations and tests are conducted to validate the strategy of optimizing clutch torque, and the impact of torque optimization on the position change during the engagement process is analyzed. The results indicate that under different driver’s intentions, vehicle masses, and road gradient conditions, the jerk, friction work, and slipping time of heavy vehicles during the launching process are improved by applying the optimization strategy.

1. Introduction

The optimal control of clutch torque is essential during the launching of vehicles equipped with automatic clutches [1]. Outstanding techniques for optimizing clutch torque control can enhance launching dynamics, economy, and ride comfort, while also prolonging the lifespan of significant driveline components [2,3]. This area of research is currently of great interest in automobile transmission studies.
Currently, the optimal control of clutch launching torque is based on friction work and jerk as performance indicators. The performance function is solved using the principle of minimal values [4], dynamic programming [5], linear quadratic regulation [6], and intelligent algorithm optimization [7,8]. Furthermore, the driver’s intention [9,10], engine torque and speed [11], clutch slipping speed [12], and clutch engagement time [8] are taken into account in the optimization process to finally obtain the optimal clutch engagement law. Xu et al. [13] propose a DCT vehicle driver’s launching intention recognition strategy based on a long short-term memory (LSTM) neural network and multi-sensor data fusion to improve clutch launching performance. Feng et al. [14] propose a dual clutch transmission launching control strategy based on pseudo-spectral optimization and data-driven control to respond to time-varying launching intentions, reduce friction and jerk, and improve launching quality. To accurately control the torque of the vehicle, positional closed-loop control [15,16] is generally used via an actuator, or torque control can be used directly [17,18]. Guo et al. [19] propose a combined pressure feedback controller based on a PID algorithm to control the clutch torque to follow a reference torque trajectory. Feng et al. [20] propose a real-time clutch target engagement trajectory planning strategy based on a gradient boosting decision tree. In [21], a linear parameter variation controller and a gain scheduling model predictive controller are designed to improve the clutch torque control accuracy. Ding et al. [22] propose an observer-based adaptive dynamic sliding mode control strategy to overcome the clutch position external perturbations during tracking to improve clutch torque control accuracy.
Differences in clutch system parameters, vehicle states, and road conditions all affect clutch launching torque control for vehicles equipped with AMT [17]. In the process of optimizing clutch launching torque, some researchers consider vehicle information and the external environment as disturbances and reduce their uncertainty by designing an optimization controller that improves clutch engagement performance [23]. In [24], an adaptive optimal control algorithm based on the linear quadratic regulator (LQR) theory is designed to estimate the error caused by changes in vehicle parameters using a reduced-order observer of the driveline, so that the optimal control law can engage the clutch quickly and smoothly when the operating conditions of the driveline change. Gao et al. [25] propose a secondary output regulator to handle time-varying disturbances and estimate unmeasurable disturbances with a disturbance observer to reduce the uncertainty of the clutch system and the effect of external environmental disturbances on the optimal control of the launching process. In [26], a state-dependent autoregressive model with exogenous variables (SD-ARX) is proposed to describe the dynamic characteristics of the clutch launching process, to improve the robustness under launching conditions and to optimize the clutch launching torque. Hong et al. [27] propose an optimal controller based on a higher order disturbance observer for the continuous time-varying disturbances in dry clutch systems, which ensures a fast and smooth clutch slipping process without large speed or torque fluctuations.
Currently, vehicle loads and road gradient variations are considered as perturbations when concerning the optimization and control of clutch torque in passenger cars [24,25]. However, heavy-duty vehicles have high power and heavy loads, so the clutch must with-stand the large driving torque from the engine output and the large feedback resistance torque from the vehicle drive when engaging [28]. Firstly, heavy-duty vehicles carry different masses of cargo each time they are transported, which means that when the vehicle is launching, the clutch torque needs to overcome different vehicle inertia and rolling resistance [29,30]. Secondly, heavy-duty vehicles usually travel on roads with different gradients, such as mountainous and hilly areas, and launching on different road gradients requires clutch torque to overcome different ramp resistance [31]. Therefore, it is not negligible that the variation of vehicle load and road gradient has a great influence on the launching resistance [32]. However, the current papers investigating clutch torque control during heavy-duty vehicle launching are rarely taking the driver’s launching intention, road gradient, and vehicle mass into account.
The main contribution of this paper is to consider the effects of the driver’s intention, vehicle load, and road gradient on clutch torque during the launching process of a heavy-duty vehicle. Vehicle load and road gradient are converted into equivalent launching resistance. A fuzzy neural network (FNN) is used to identify the driver’s intention and the equivalent launching resistance torque of the vehicle. The results of the vehicle launching states recognition (LSR) are used to adjust the weight factors of the performance function. Jerk, friction work, and launching reserve power are used as performance indicators for clutch launching torque optimization. The optimized launching torque for the clutch is achieved by resolving the performance function through the minimum value principle, based on the method of shooting. Based on the clutch diaphragm spring characteristics, the optimized torque obtained for the clutch launching process is converted into the engagement position, thus controlling the pneumatic actuator to achieve clutch engagement. This clutch torque optimization control strategy guarantees that heavy-duty vehicles have enough power to launch with a full load or on an incline, while minimizing jerk and friction work and enhancing their launching performance.
The structure of this paper is as follows: Section 2 presents an introduction to automatic clutch systems for heavy-duty vehicles and an analysis of the launching process. Section 3 designs a fuzzy neural network (FNN)-based vehicle launching states recognition (LSR) system for distinguishing the driver’s launching intention and the vehicle’s launching equivalent moment of resistance. Section 4 considers jerk, friction work, and launching reserve power as key performance indicators for optimizing clutch torque; weight coefficients for each indicator are adjusted based on the LSR results, and the performance function is solved using the minimum value principle based on the shooting method. Section 5 conducts simulations and vehicle tests to validate the clutch torque optimization strategy and observe the effect of torque on the clutch engagement position, and the results of the tests are analyzed and discussed.

2. Launching Process Analysis of Heavy-Duty Vehicles

2.1. Vehicle Launching Clutch Dynamics Analysis

The vehicle driveline is a continuous and complex system, and the whole system can be regarded as a multi-rigid body system. All components are considered as concentrated masses and damping, and partial component elastic properties are neglected in order to reduce vibration and shock [33]. The study focuses on modeling the dynamics of the engine, clutch, AMT, and the whole vehicle. The torque generated by the engine is transmitted to the drive wheels through the clutch, AMT, and driveshaft [34]. In order to realize the automatic control of clutch engagement and disengagement, an electronically controlled pneumatic clutch system is designed, which mainly consists of a push-type diaphragm spring clutch, a single-acting cylinder, four pneumatic solenoid valves, a displacement sensor, and a control unit [35]. A schematic diagram of the heavy-duty vehicle powertrain and automatic clutch system is shown in Figure 1.
For heavy commercial vehicles, the dynamics of the clutch engagement process (in Figure 2) during the launching phase is analyzed as follows:
(1)
Clutch empty stroke stage
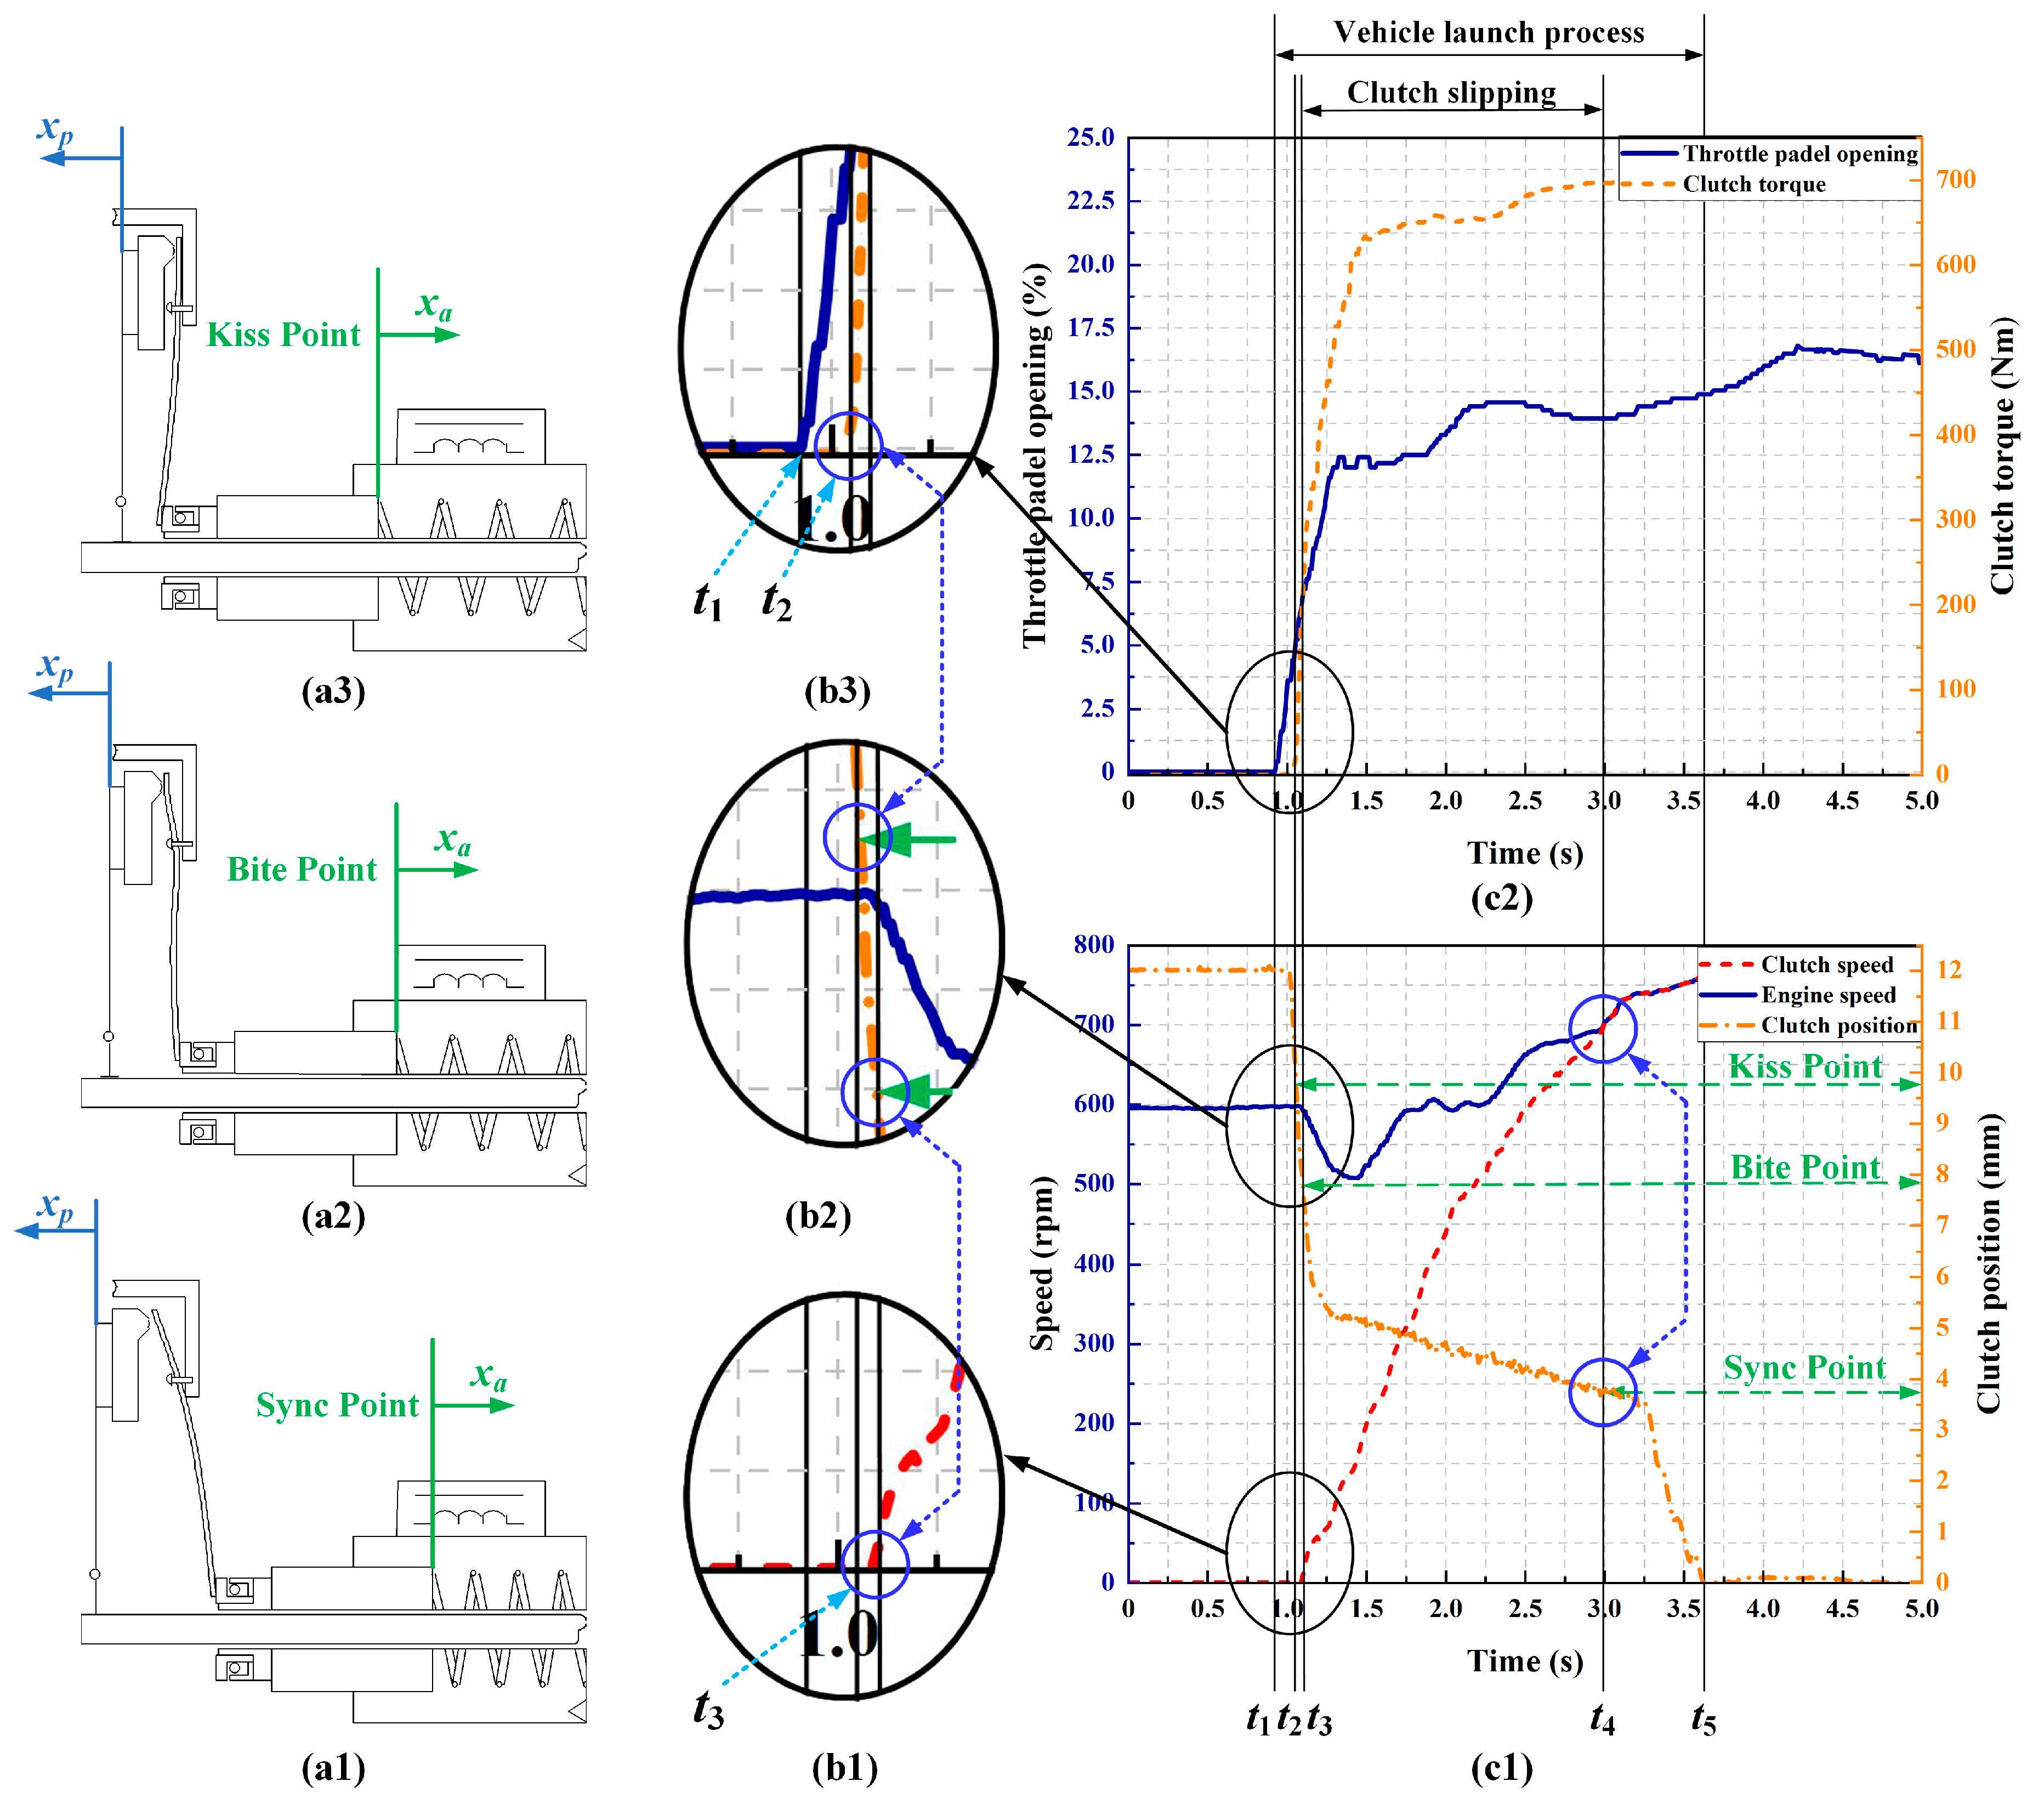
The phase from time point t1 to time point t2 is used to eliminate the empty stroke phase of the clutch pressure plate. During this process, the torque transmitted by the clutch is zero (Mcf = 0).
(2)
Clutch slipping stage
During the phase from time point t2 to time point t3, the clutch transfer torque gradually increases. At time point t3, the vehicle begins to move. From time point t3 to time point t4, the clutch speed gradually increases until it is in line with the engine speed. Therefore, from time point t2 to t4, as the displacement of the pneumatic actuator increases, the AMT clutch enters the slipping friction phase, and the dynamic equation of the engine and clutch active part can be expressed as follows:
J e q ω ˙ e n g = M e n g M c f b e q ω e n g J e q = J e n g + J f w + J c a b e q   = b e n g + b f w + b c a
where ωeng is the engine output angular velocity, Meng is the engine output torque, Mcf is the clutch friction torque, Jeq and beq are the equivalent rotational inertia and damping coefficient of the rotating parts at the engine and the active part of the clutch, Jeng, Jfw, and Jca are the rotational inertia of the engine, the flywheel, and the active part of the clutch, and beng, bfw, and bca are the damping coefficients of the engine, the flywheel, and the active part of the clutch.
The dynamic model of the driveline can be expressed as follows:
J c s ω ˙ c f = M c f b c t ( ω c f ω t ) k c t ( θ c θ t )
J d l ω ˙ t = b c t ( ω c f ω t ) + k c t ( θ c θ t ) 1 i g i 0 k t w ( θ t i g i 0 θ w ) + b t w ( ω t i g i 0 ω w )
J w ω ˙ w = k t w ( θ t i g i 0 θ w ) + b t w ( ω t i g i 0 ω w ) b w ω w M w
where ωcf, ωt, and ωw are the angular velocity of the clutch friction plate, the transmission input shaft, and the wheel, Mcf is the clutch friction torque, Mw is the equivalent drag torque at the wheels of the driving vehicle, θc, θt, and θw are the angular displacement of the passive part of the clutch, the transmission input shaft, and the wheel, Jcs and Jw are rotational inertia of the passive part of the clutch and the wheel, Jdl is the equivalent rotational inertia of the driveline, Jdl = Jt + Js + J0, Jt, Js, and J0 are the moment of inertia of the transmission, driveshaft, and differential assembly, kct and ktw are the equivalent elastic stiffness coefficients of the clutch and transmission, bct and btw are the equivalent damping coefficients of the clutch and transmission, bw is the damping coefficient of the wheel, ig is the transmission ratio, and i0 is the final drive ratio.
When calculating the derivative of the angular velocity, assuming that the shaft of the driveline is rigid, it is obtained that ω ˙ c = ω ˙ t = i g i 0 ω ˙ w . Equations (2)–(4) can be rewritten as follows:
J v ω ˙ c f = M c f M v b v ω c f ( 1 1 i g i 0 ) k t w ( θ t i g i 0 θ w ) + b t w ( ω t i g i 0 ω w )
where Jv = Jcs + Jdl + Jw/igi0, which indicates the equivalent rotation inertia of the driveline transmission mechanism, Mv is the equivalent load torque of the whole vehicle resistance at the input of the AMT, Mv = Mw/igi0, bv is the equivalent damping coefficients at the input of the AMT, bv = bw/igi0.
From Equation (5), it can be seen that the elasticity and damping of the driveline produce a certain amount of disturbance to the rotation of the driven part of the clutch, which can be characterized as a specific amount of disturbance in the model of the controlled system.
The amount of disturbance caused by driveline elasticity and damping during clutch engagement is as follows:
d t w = ( 1 i g i 0 i g i 0 ) k t w ( θ t i g i 0 θ w ) + b t w ( ω t i g i 0 ω w )
Therefore, the dynamics of the clutch during slipping can be expressed as follows:
J e q ω ˙ e n g = M e n g M c f b e q ω e n g J v ω ˙ c f = M c f M v b v ω c f + d t w
The equivalent load torque of the whole vehicle resistance at the input of the AMT can be expressed as follows:
M v = 1 i g i o M w = r w i g i o ( m g f cos θ + m g sin θ + 1 2 C D A ρ u a 2 )
where m is the mass of the vehicle, g is the acceleration of gravity, f is the rolling resistance coefficient, θ is the slope of the road surface, CD is the coefficient of air resistance, A is the windward area of the vehicle, ρ is the air density, ua is the vehicle traveling speed, and rw is the rolling radius of the wheels.
(3)
Clutch synchronization stage
During the phase from time point t4 to time point t5, when the speeds of the engine and clutch are synchronized, the torque output from the engine can be transferred to the AMT without loss. The dynamic equations can be expressed as follows:
( J e q + J v ) ω ˙ c f = M e n g M v ( b e q + b v ) ω c f ω e n g = ω c f
After the clutch is engaged, the vehicle enters a stable driving state. The clutch system has no friction loss, and the engine and AMT are considered to be consolidated.

2.2. Vehicle Launching Clutch Engagement Displacement Change

The vehicle launching process begins when the driver presses the throttle pedal (time point t1) and ends when the clutch is fully engaged (time point t5), as shown in Figure 2. During the launching process of a heavy-duty vehicle, the automatic clutch system will control the clutch transfer torque in real time according to the change of the throttle pedal and vehicle status.
The analysis of clutch engagement displacement variation during the launching process of a heavy-duty vehicle is shown in Figure 2.
(1)
Time point t1
The driver begins to press the throttle pedal, as shown in Figure 2(b3). The clutch separate vertex has the active–passive portion in a fully disengaged state.
(2)
Time point t2
The clutch begins to slip at the contact point (Kiss Point), and starts to transfer torque (in Figure 2(b2,b3)). And the transfer torque is too little to keep the vehicle moving. The position of the clutch actuator is shown in Figure 2(a3).
(3)
Time point t3
This is the clutch minimum vehicle movement point (Bite Point); as the engagement displacement increases, the transfer torque increases, making the vehicle begin to move (in Figure 2(b1,b2)). The position of the clutch actuator is shown in Figure 2(a2).
(4)
Time point t4
During the clutch speed synchronization point (Sync Point), the engine speed and the clutch speed are the same (in Figure 2(c1)), and the slipping friction phase is over. The position of the clutch actuator is shown in Figure 2(a1).
(5)
Time point t5
At the point of full engagement, the active pressure plate is fully pressed against the driven friction plate, and the clutch is capable of transmitting the maximum torque.

2.3. Relationship between Clutch Torque and Displacement

As shown in Figure 1, the magnitude of the clutch torque Mcf is directly related to the pressure plate stroke xp, whereas the variation of the clutch pressure plate stroke xp is realized by the displacement xa of the actuator. The sensor collects the value of displacement xa in real time and feeds it back to the control unit. In turn, the control unit controls the displacement xa by means of a pneumatic solenoid valve group. Therefore, the automatic clutch system achieves the transmission of clutch torque Mcf by controlling the actuator displacement xa.
According to the analysis of the squeezing and friction mechanism between the flywheel, friction plate, and pressure plate during clutch engagement, the relationship between the clutch torque Mcf and displacement xp can be expressed as follows:
M c f = Z μ R e F p ( x p )
where Z is the number of friction surfaces, μ is the coefficient of friction, Re is the equivalent radius of the friction plate, and Fp(xp) is the clutch pressure force.
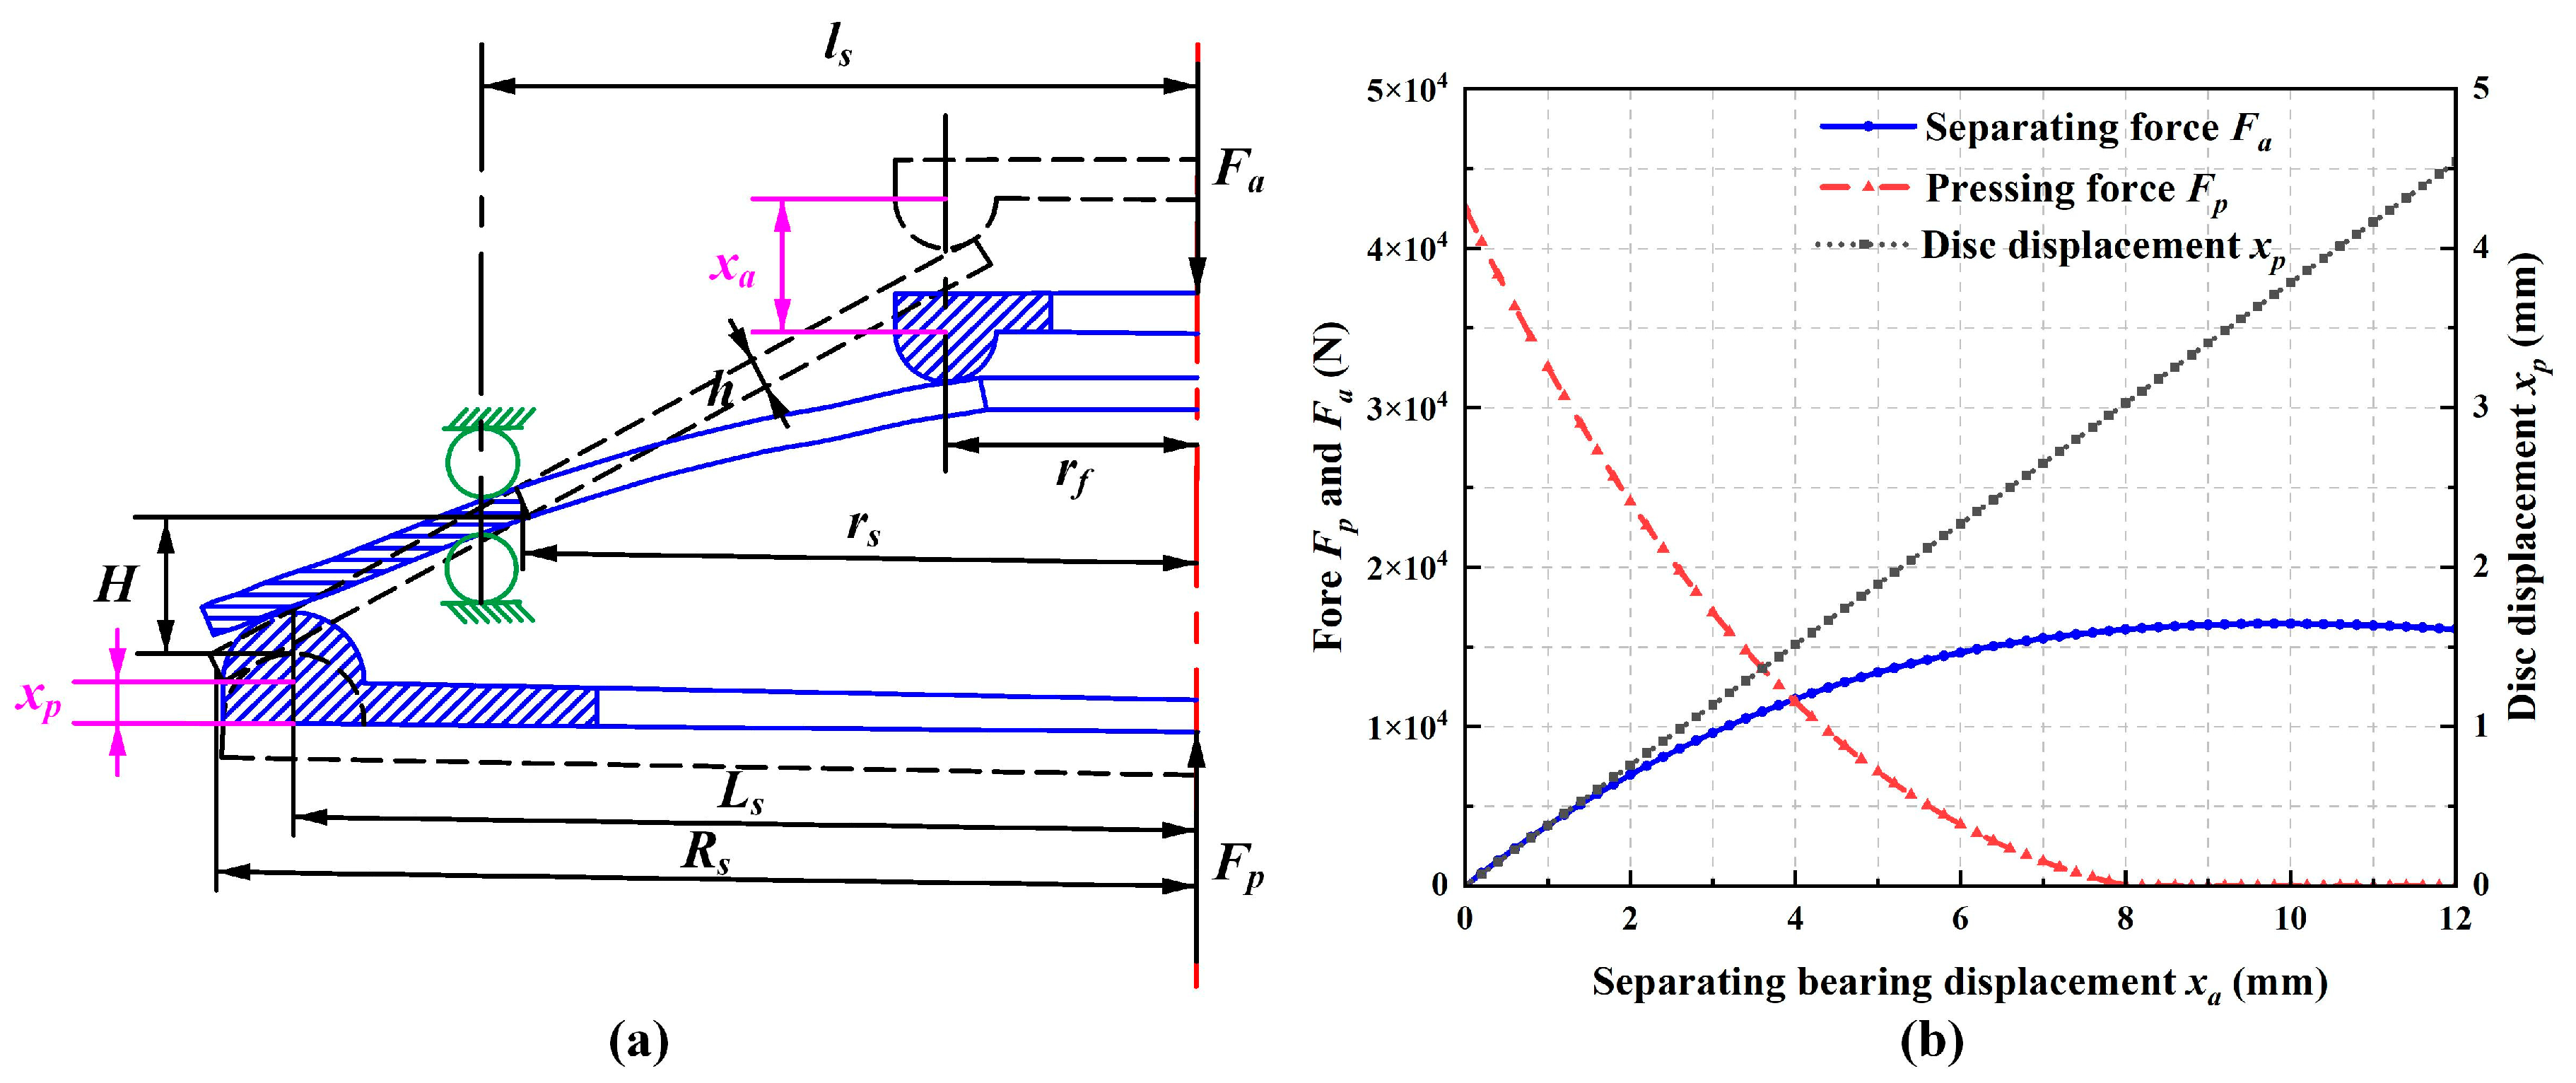
In the case of automatic diaphragm spring clutches, the load and displacement variation characteristics of the diaphragm spring are analyzed to obtain the pressure force Fp and displacement xa of the clutch actuator. The variation of load and displacement of the clutch diaphragm spring during operation is shown in Figure 3.
It can be seen from Figure 3a that, in the process of clutch disengagement, the separation force Fa acting on the small end of the diaphragm spring at the loading radius rf causes the diaphragm spring to continue to be pressurized with the front support ring at the middle as the pivot point, and the pressure force Fp of the large end of the diaphragm spring on the pressure plate decreases gradually. The clutch engagement process is reversed, and the relationship between the Fp and the displacement stroke xp can be expressed as follows [36]:
Δ F p = π E h ln ( R s r s ) 6 ( 1 μ s ) 2 ( L s l s ) 2 Δ x p ( H R s r s L s l s Δ x p ) ( H 1 2 R s r s L s l s Δ x p ) + h 2
The simplification of Equation (6) can be expressed as follows:
Δ F p = a Δ x p 3 + b Δ x p 2 + c Δ x p
where a, b, and c are expressed as follows:
a = π E h ( R s r s ) 2 ln ( R s r s ) 12 ( 1 μ s ) 2 ( L s l s ) 4 b = π E H h ( R s r s ) ln ( R s r s ) 4 ( 1 μ s ) 2 ( L s l s ) 3 c = π E h ( H 2 + h 2 ) ln ( R s r s ) 6 ( 1 μ s ) 2 ( L s l s ) 2
where E is the modulus of elasticity of the material, μs is the Poisson’s ratio of the material, H is the height of the inner truncated cone of the disc spring portion of the free state of the diaphragm spring, h is the thickness of the diaphragm spring steel plate, Rs and rs are the radius of the large and small ends of the disc spring portion of the free state, and Ls and ls are the radius of the loading point of the compression disk and the loading point of the support ring.
Substituting the parameters of the components in Table 1 into Equation (8), the values of a, b, and c are obtained as follows:
a = 3.841 × 10 2 ,   b = 5.992 × 10 3 ,   c = 2.866 × 10 4
Through Equations (5) and (7), xp is obtained as follows:
Δ x a = l s r f L s l s Δ x p = l s r f L s l s f ( Δ F p ) = l s r f Z μ R e ( L s l s ) f ( Δ M c f )
The diaphragm spring load displacement characteristic curve can be obtained as shown in Figure 3b. When the clutch launching torque is obtained, the clutch can be controlled by translating the torque into the engagement position through Equation (6), as shown in Figure 4.
The clutch system uses a pneumatic actuator to control the trajectory of the clutch engagement target. Compressed air enters and flows out of the air cavity through the control of the valve group, and pneumatic pressure is formed in the cylinder working cavity to act on the piston, so that the piston generates thrust. The movement of the piston is fed back to the control unit through the displacement sensor. The control unit calculates the control variable values according to the control program and controls the action of the solenoid valve, thus changing the air pressure in the cylinder working chamber and pushing the cylinder piston to realize the clutch engagement and disengagement process. This constitutes a closed-loop control system. To analyze the thermodynamic processes in a single-acting cylinder cavity, a cavity thermodynamic model is developed.
Assuming that the thermodynamic process is an iso-thermal process, and the gas is an ideal gas, and the pressure–temperature distribution in the cavity is uniform. At the same time, the internal and external leakage of the cylinder can be neglected, and the kinetic and potential energy of the gas can be ignored. The differential equations of pressure in the cylinder cavity are established according to the equation of the state of the ideal gas; the equation of the continuity of the mass and the first law of thermodynamics can be expressed as follows:
p ˙ = K R T q m A ( L 0 + y ) K p y ˙ L 0 + y
where p is the cylinder pressure, qm is the gas mass flow rate into the gas chamber, A is the effective cross-sectional area in the cylinder, L0 is the initial position of the piston, y is the piston displacement, y = xa, K is the specific heat ratio adiabatic index, R is the gas constant, and T is the temperature of the air in the cylinder.
In order to further describe the mass flow rate of gas flow through the switching valve port, the international standard ISO 6358 [37], based on the contraction of the nozzle model, is used to express the flow characteristics of the port [38], which is used to characterize the flow characteristics of the pneumatic components with the acoustic velocity of the flow conductor and the critical pressure ratio. We set the valve port of the upstream absolute pressure strength of Pu, which remains stable, and the downstream absolute pressure strength of Pd; then, the mass flow rate through the port of the high-speed switching valve and the relationship of the up-downstream hydrostatic pressure ratio can be expressed as follows:
q ˙ m = D S max p u T u 2 K T R ( K 1 ) p d p u 2 K p d p u K + 1 K C r < p d p u < 1 D S max p u T u K T R 2 K + 1 K + 1 K 1 0 < p d p u < C r
where D is the PWM signal duty cycle, Smax is the maximum effective cross-sectional area of the valve port, and Cr is the critical pressure ratio. The equation of motion of the load is obtained from Newton’s second law as follows:
p A + F s p F f F a = m a y ¨
where Fsp is the spring force on the piston, Ff is the friction force in the cylinder, ma is the mass of the piston, Fa is the load force acting on the cylinder extension rod, which is equal to the clutch separating force in Figure 3. The friction force is F f = b f y ˙ , where bf is the friction coefficient of the cylinder wall and piston. And the spring force is F s p = k s p y , where ksp is the spring factor. Therefore, the pneumatic actuator and the third order equation of the state for the displacement of the system can be expressed as follows:
y = K R T q m m a ( L 0 + y ) A K p y ˙ m a ( L 0 + y ) + k s p m a y ˙ b s m a y ¨ F ˙ a m a

3. Launching States Recognition (LSR) for Clutch Torque

3.1. Driver’s Launching Intention Recognition

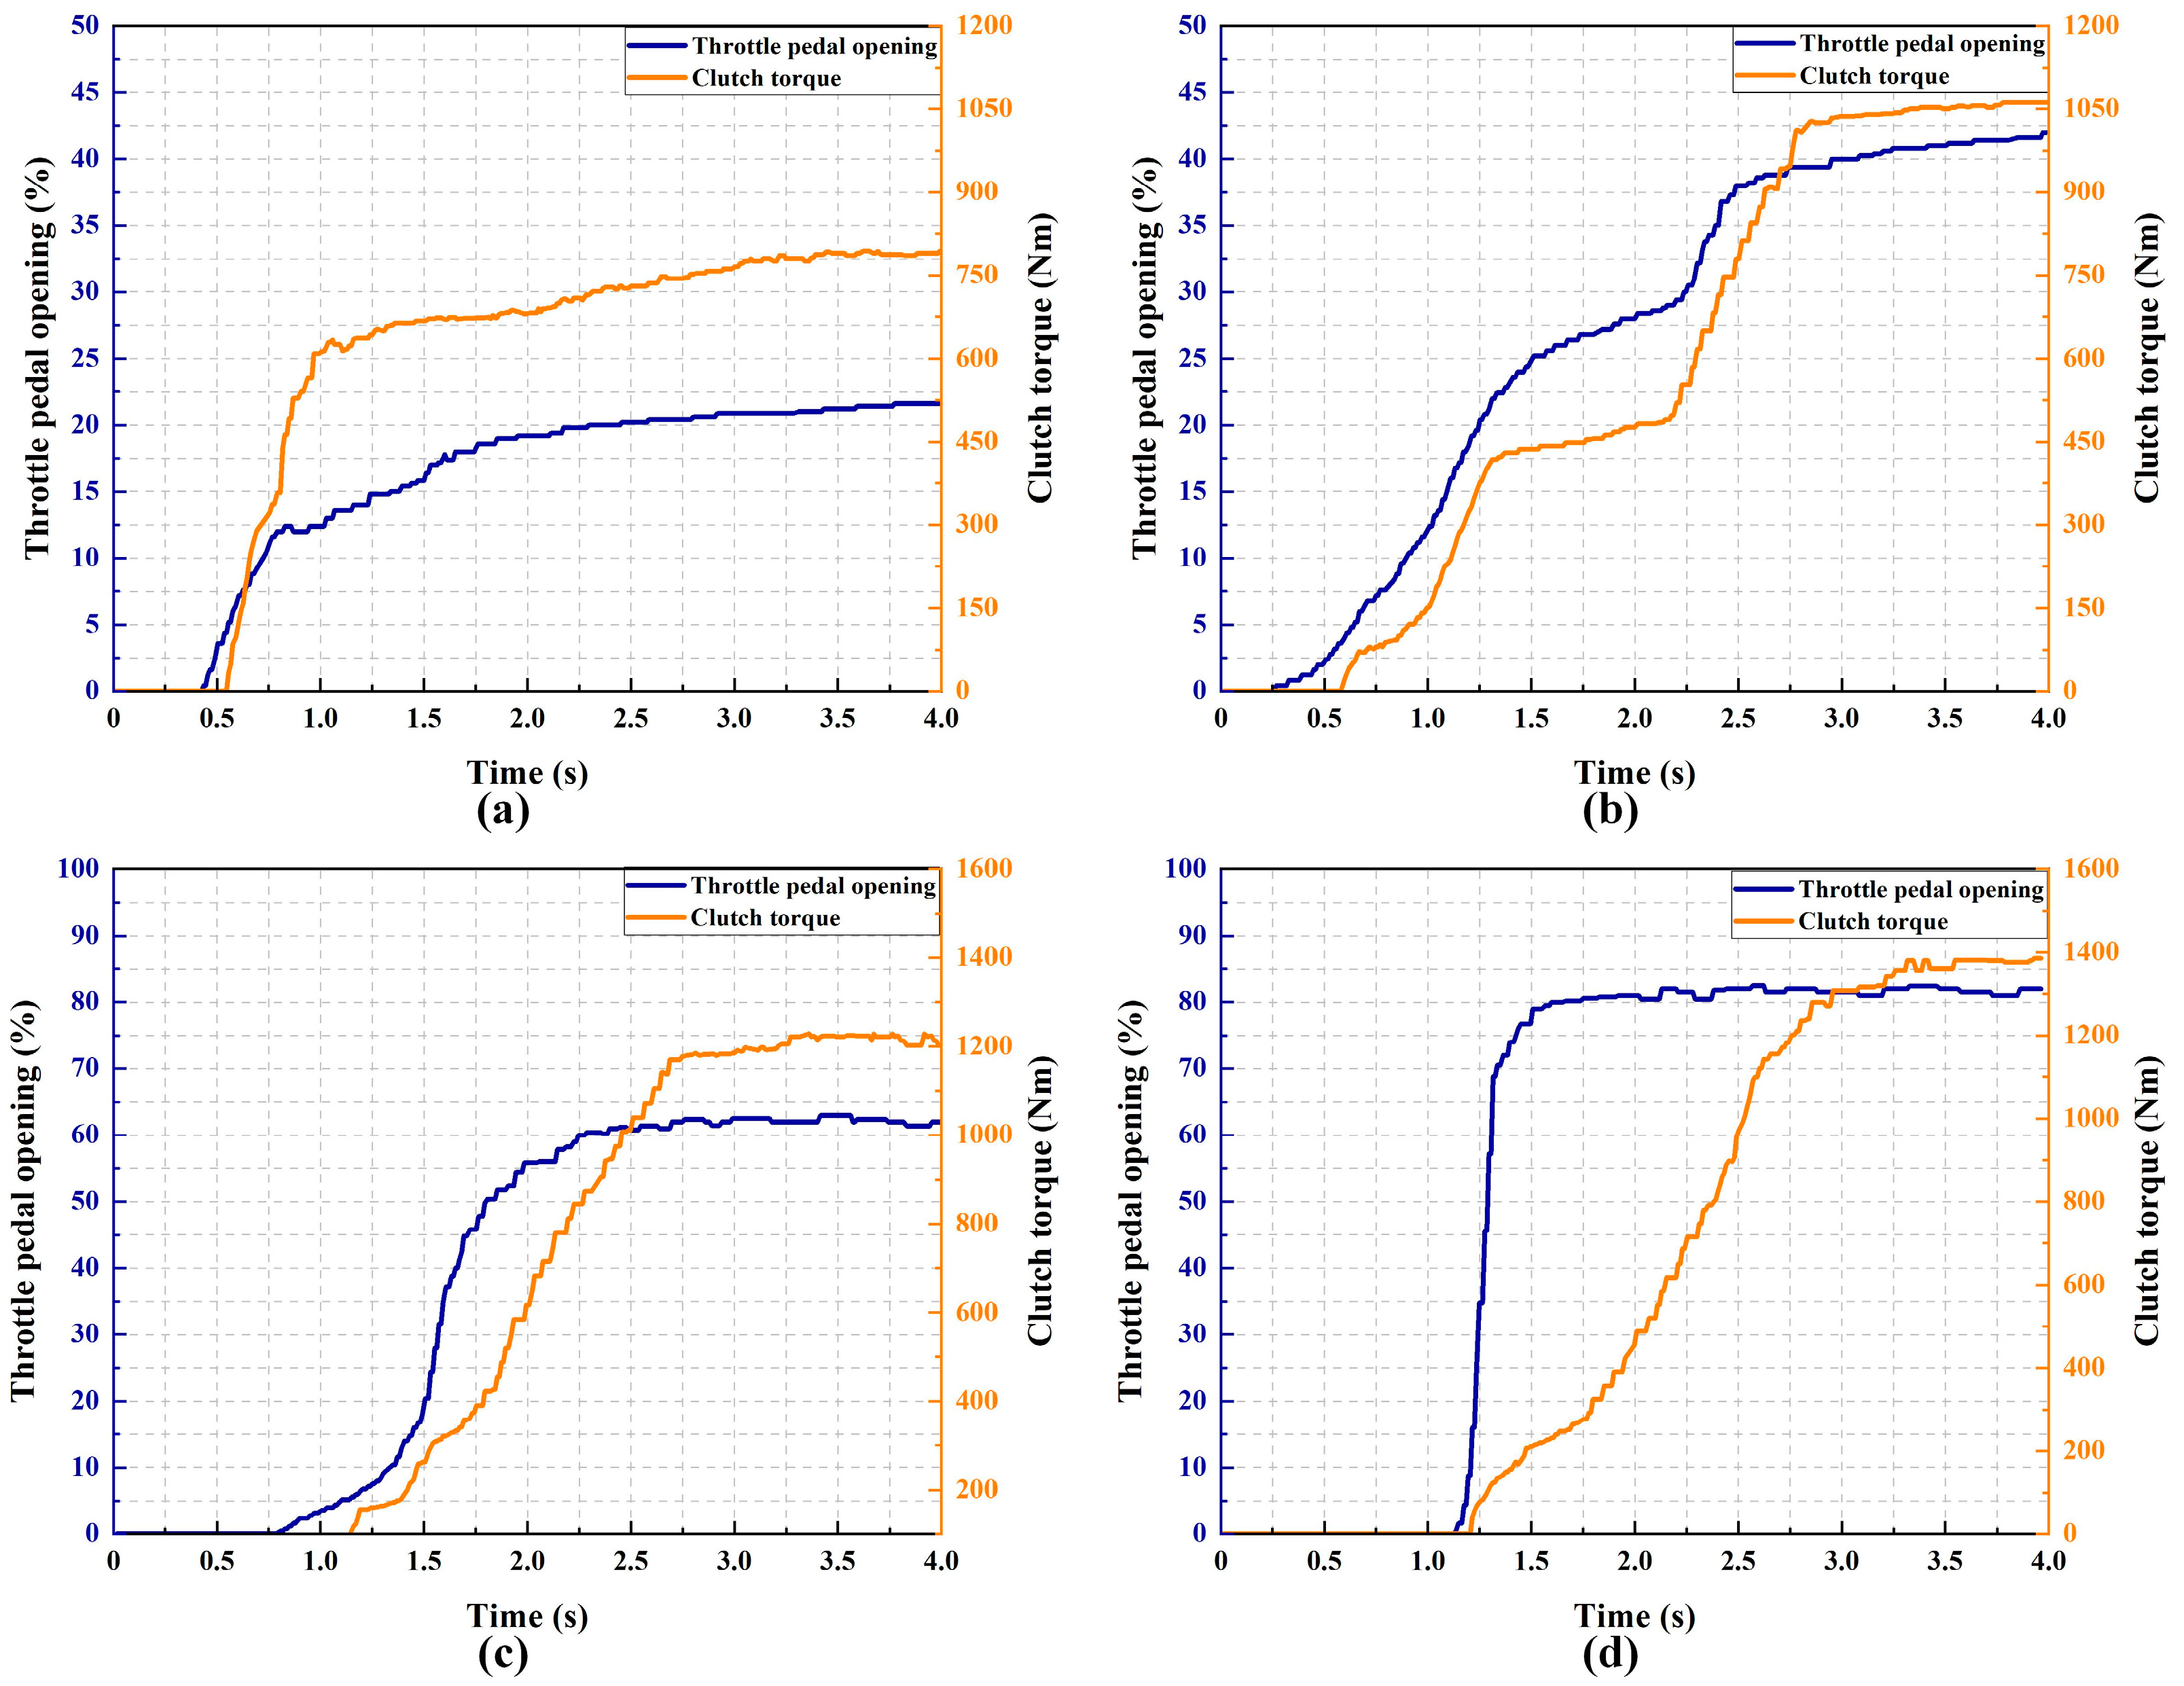
For AMT heavy-duty vehicles, the driver’s intention to launch is detected by the driver’s operation of the throttle pedal. As a general rule, the more open the throttle pedal is, the greater level of power required by the driver from the vehicle. According to [39], the driver’s launching intention to commence driving is classified into three modes: slow, medium, and fast. A small-throttle slow-speed launching process is shown in Figure 5a, which corresponds to a stable clutch torque of 750 Nm at 20% throttle pedal opening. As shown in Figure 5b,c for a medium-throttle medium-speed launching, the corresponding clutch steady torque is 1050 Nm and 1200 Nm at 40% and 60% throttle pedal opening. As shown in Figure 5d for a large-throttle fast-speed launching, the steady torque of the clutch is 1400 Nm at 80% throttle pedal opening. There are significant differences in the change in throttle pedal opening for different launching intentions. It is difficult to provide a precise equation for this change. In this paper, a fuzzy neural network (FNN)-based launching states recognition (LSR) system is designed to recognize the driver’s intention to launch.
(1)
Fuzzy domain division of throttle pedal opening and definition of fuzzy subset
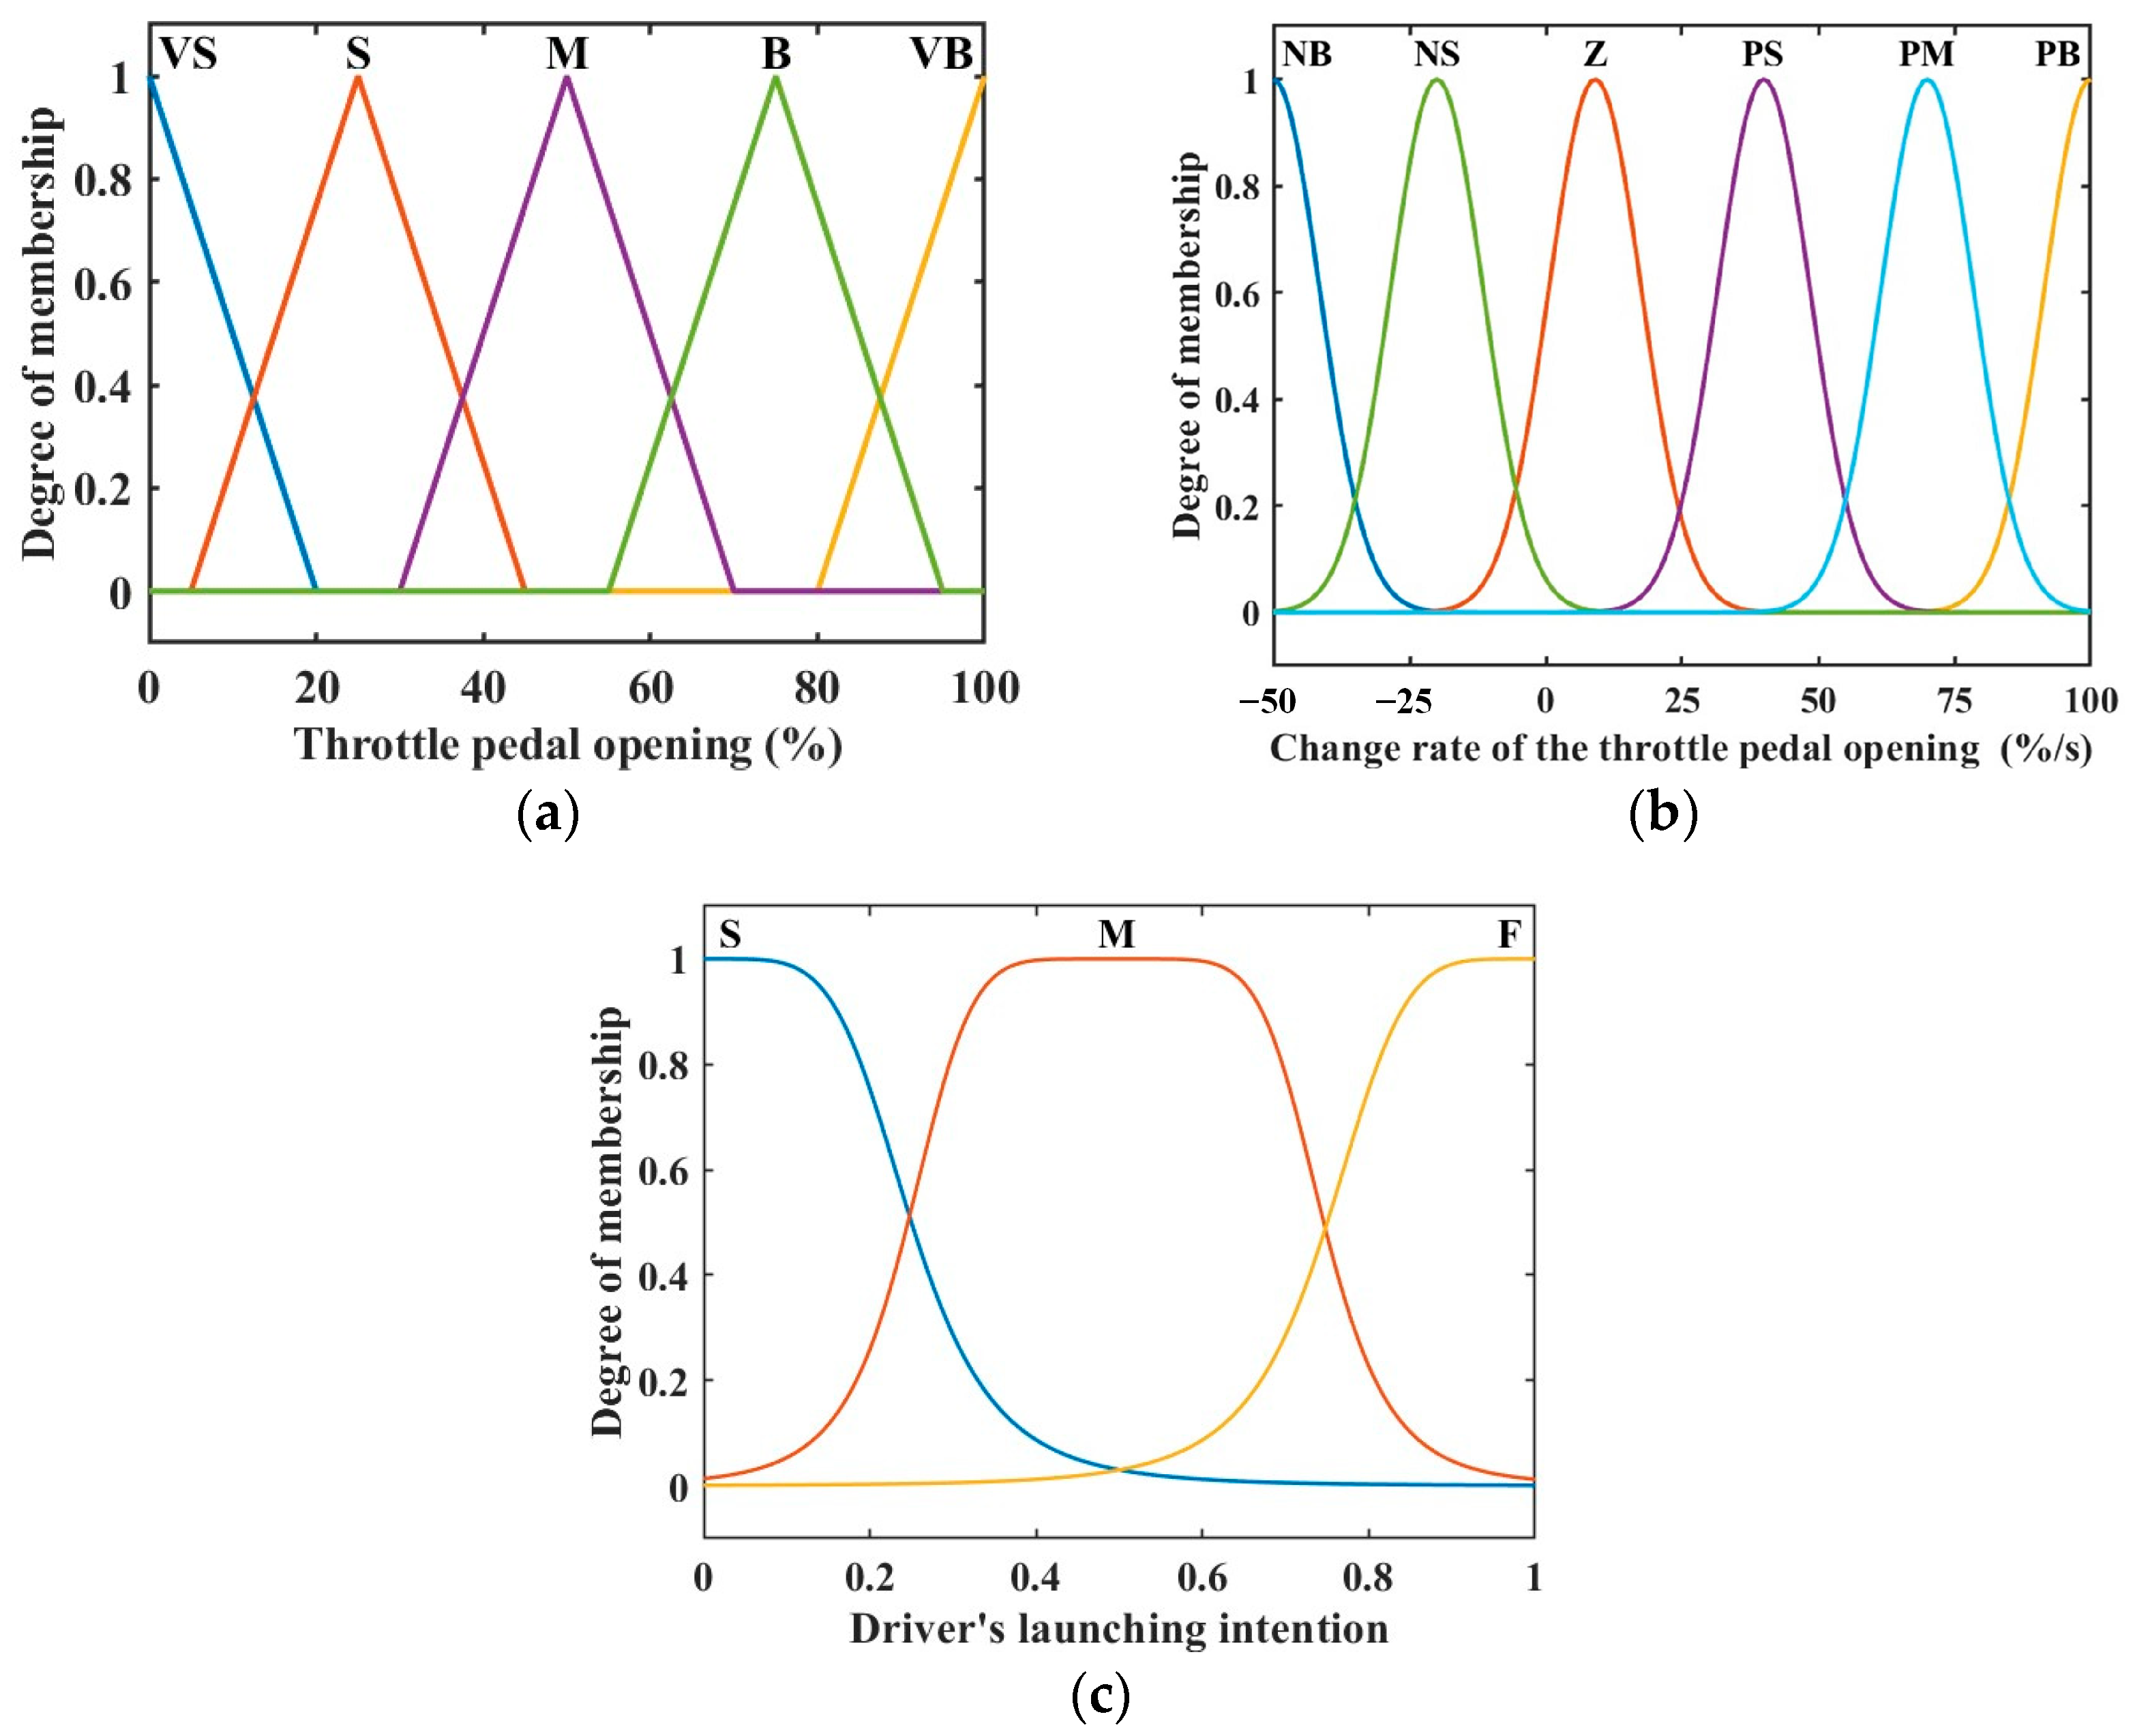
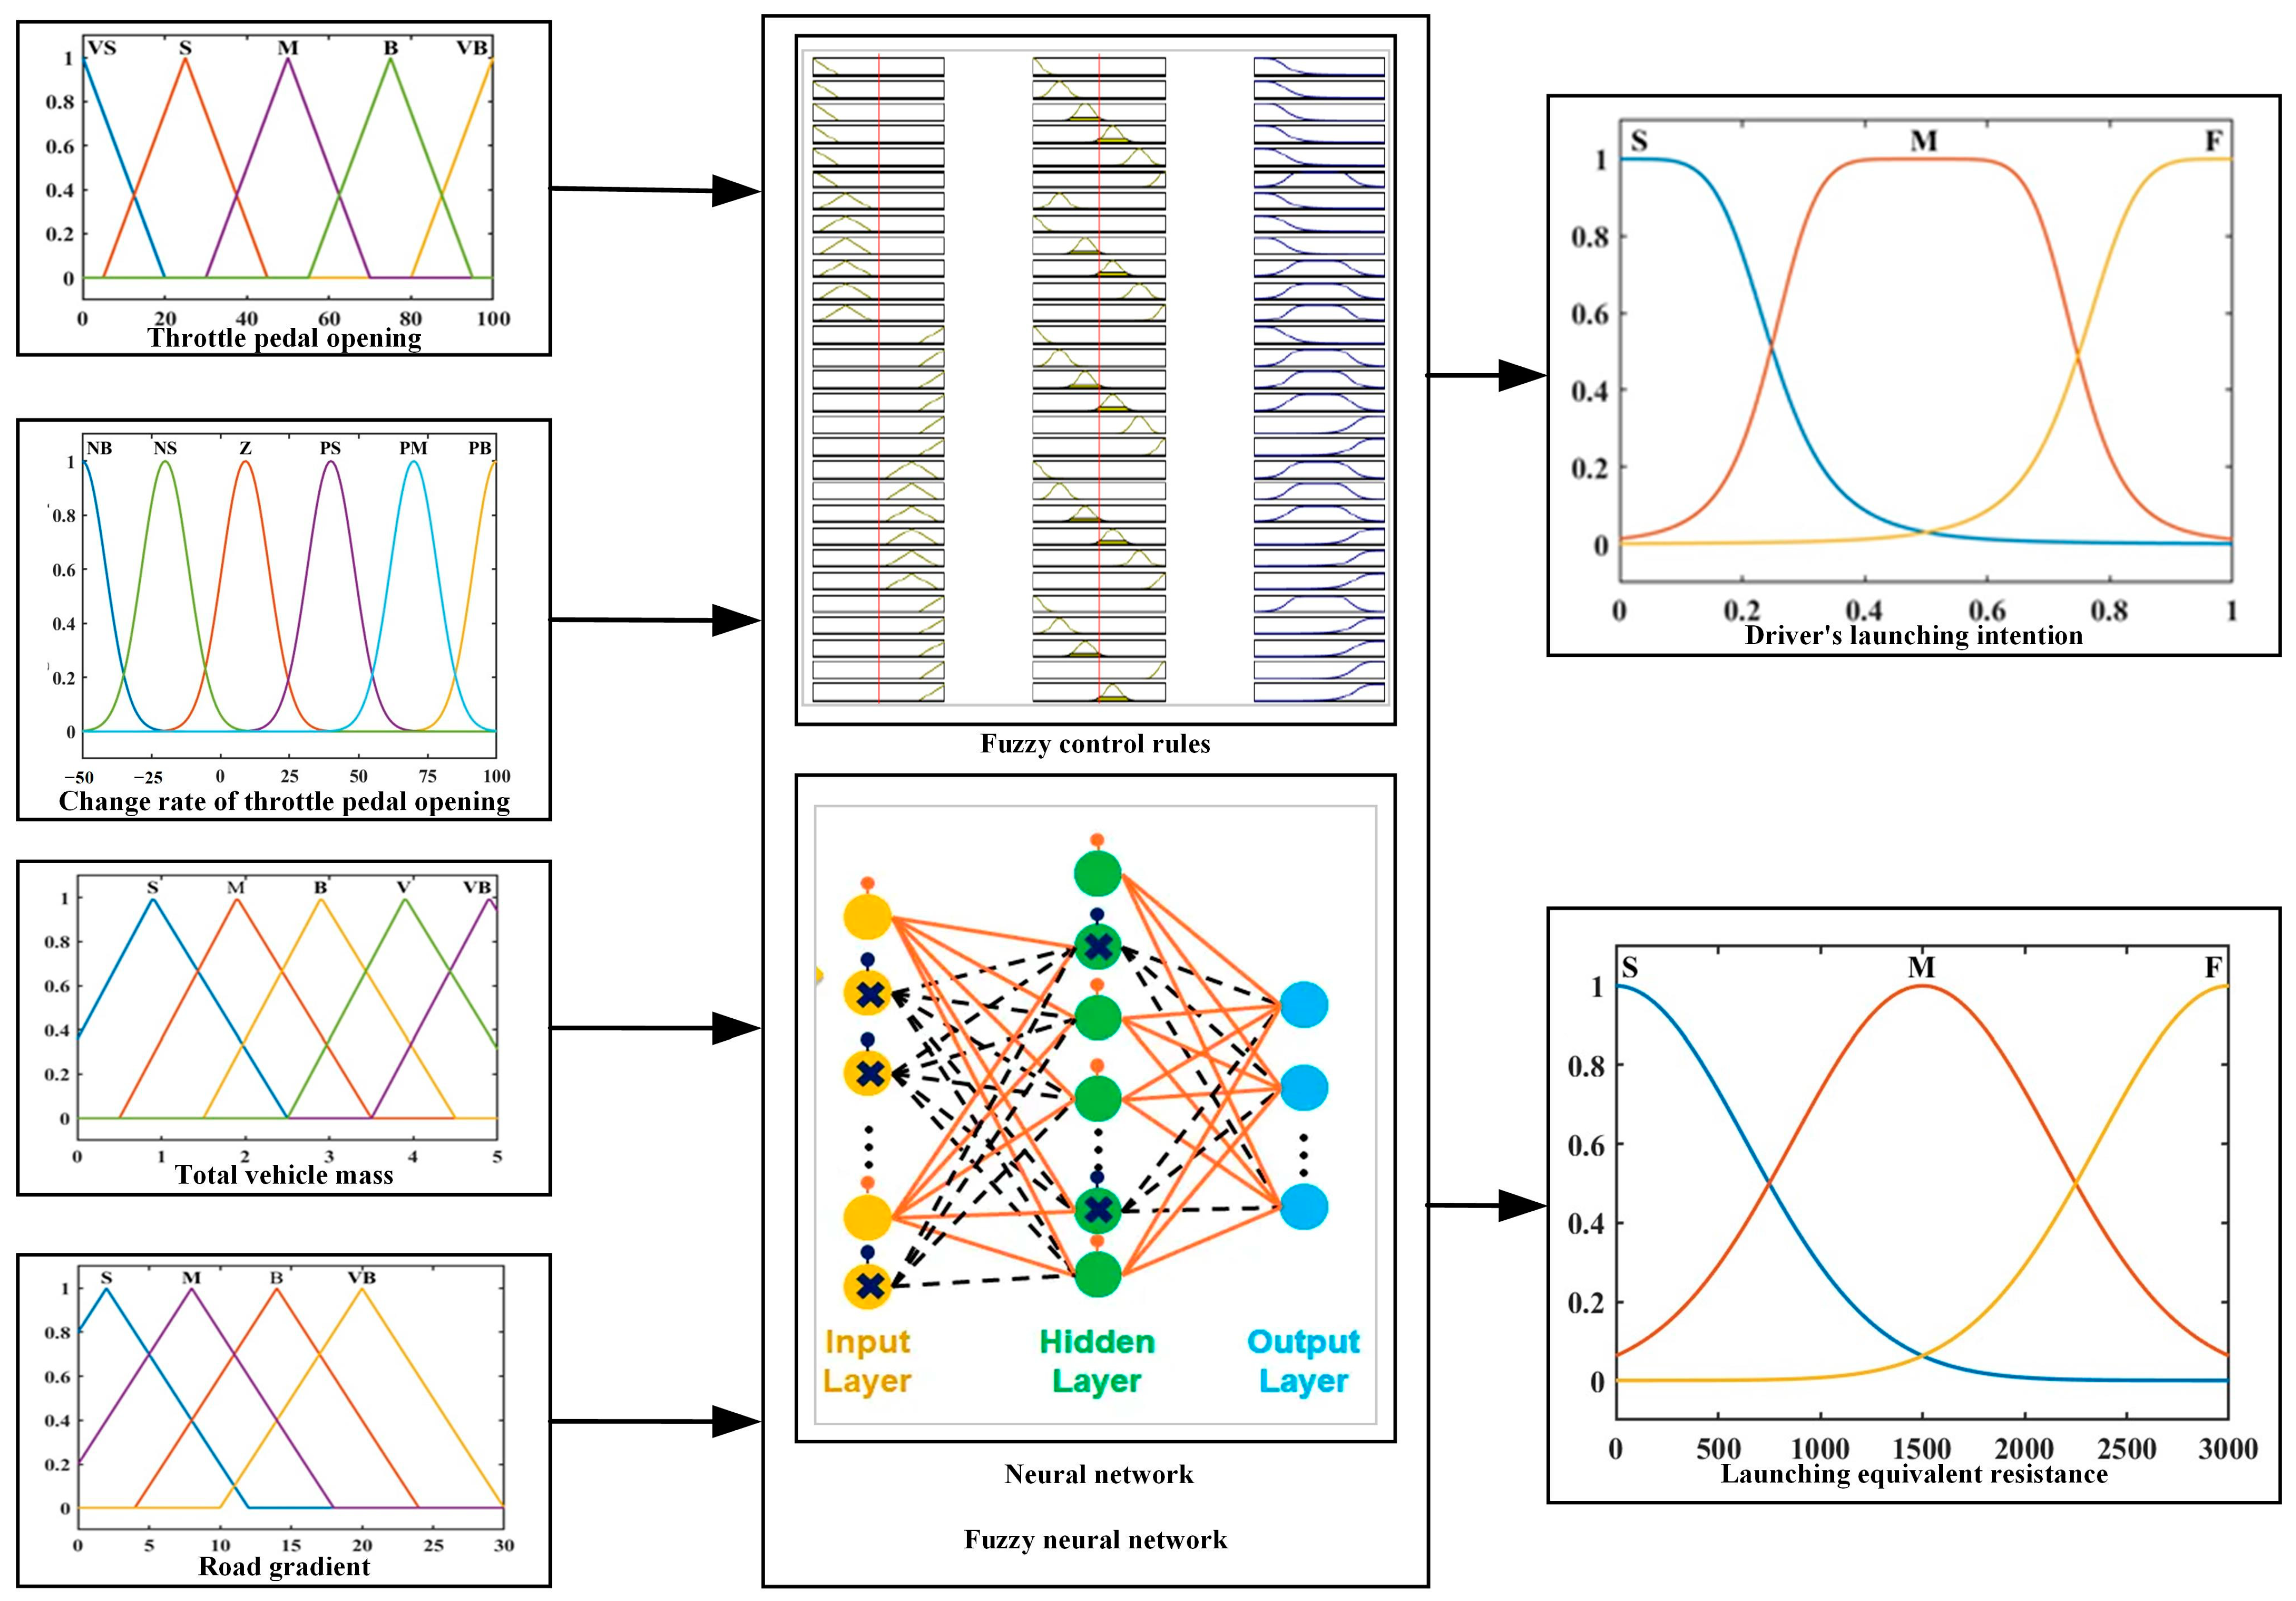
During the launching process, the domain of the throttle pedal opening α is [0, 100], and the corresponding fuzzy subset is defined as {VS, S, M, B, VB} based on the driver’s demand for the launching driving force. VS, S, M, B, and VB represent the throttle pedal opening as very small, small, medium, large, and very large, respectively, as shown in Figure 6a.
(2)
Fuzzy domain division and fuzzy subset definition for change rate of throttle pedal opening
Considering the actual launching conditions without considering the driver’s error operation, the domain of the throttle pedal opening change rate α ˙ is defined as [−50, 100]. The corresponding fuzzy subset is defined as {NB, NS, Z, PS, PM, PB} according to the driver’s demand for the launching speed. NB, NS, Z, PS, PM, and PB represent the change rate of the throttle pedal opening to be negative large, negative small, zero, positive small, positive medium, and positive large, respectively, as shown in Figure 6b.
(3)
Driver’s launching intentions fuzzy domain delineation and fuzzy subset definition
The domain of driver’s launching intention D is defined as [0, 1], and the corresponding fuzzy subset is defined as {S, M, F}, with S, M, and F representing the driver’s launching intention for slow launch intention, medium launch intention, and fast launch intention, respectively, as shown in Figure 6c.
A fuzzy control rule base for detecting the driver’s launching intention is developed based on actual driving experience, as shown in Table 2. Throttle opening and opening change rate reflect the driver’s launching power demand and launching speed demand, respectively.

3.2. Launching Equivalent Resistance Recognition

The estimated values of heavy-duty vehicle mass m [40] and road slope θ [31] are calculated as shown in Equations (20) and (21).
m = M c f i g i 0 r w J v a r w 2 1 2 C D A ρ u a 2 a + g f cos θ + g sin θ
θ = tan 1 1 f cos 1 M c f i g i 0 m r w 1 2 m C D A ρ u a 2 a J w m r w 2 a g 1 + f 2
where a is the vehicle acceleration. The acceleration of the vehicle at different moments can be expressed as follows:
a t = u a , t u a , t d d Δ T
where ua,t is the vehicle speed before moment t, ua,t−d is the vehicle speed before the t-d moment, d is the number of delay time cycles, and ΔT is the sample time.
There are significant differences in the power requirements of heavy-duty vehicles when launching under different load or ramp conditions. Especially when launching on a heavily loaded ramp, the vehicle needs sufficient power to overcome the large equivalent resistance. This presents a significant challenge for achieving the optimal control of the clutch launching torque. The equivalent moment of resistance for heavy-duty vehicles launching under different loads and ramps is shown in Figure 7. At a standstill, the equivalent moment of resistance is at 250 Nm for an unladen vehicle, 750 Nm for a half-loaded vehicle, and 1250 Nm for a fully loaded 20% ramp condition. Consequently, differences in the launching equivalent resisting moment due to the vehicle load and road gradient also have an effect on the clutch torque control. In this paper, a fuzzy neural network (FNN)-based launching states recognition (LSR) system is designed for identifying the vehicle launching equivalent moment of resistance.
(1)
Total vehicle mass fuzzy domain delineation and fuzzy subset definition
During the launching process, the domain of the whole vehicle mass m is [0, 49,000], and the corresponding fuzzy subset is defined as {VS, S, M, B, V, VB}. VS, S, M, B, and VB represent the whole vehicle mass m as very small, small, medium, large, and very large, respectively, as shown in Figure 8a.
(2)
Road gradient fuzzy domain delineation and fuzzy subset definition
Considering the actual starting conditions, the domain of the road gradient θ is [0, 30], and the corresponding fuzzy subset is defined as {S, M, B, VB}. S, M, B, and VB represent the road gradient θ as small, medium, large, and very large, respectively, as shown in Figure 8b.
(3)
Launching equivalent resistance fuzzy domain division and fuzzy subset definition
The fuzzy domain of launching equivalent resistance R is defined as [0, 3000], and the corresponding fuzzy subset is defined as {S, M, F}, with S, M, and F representing the launching equivalent resistance for a small resistance, a medium resistance, and a large resistance, respectively, as shown in Figure 8c.
A fuzzy control rule base for launching equivalent resistance identification is developed based on the actual mass and road gradient, as shown in Table 3. The mass and road gradient reflect the launching resistance that the vehicle needs to overcome to launch, respectively.

3.3. Fuzzy Neural Network-Based Launching States Recognition

During the launching process of a heavy-duty vehicle, the clutch transmits a torque that meets the driver’s launching intentions while providing sufficient power to ensure that the vehicle launches under loaded or ramped conditions. Therefore, the optimization of the clutch engagement torque should take into account the driver’s intention to launch and the equivalent resistance torque in launching.
Due to the subjectivity of the driver and the uncertainty of driving conditions, it is difficult to simplify the driver’s launching intentions and the degree of launching difficulty into precise mathematical equations. The fuzzy neural network is a technology that combines the powerful structural knowledge representation ability of fuzzy logic inference with the powerful self-learning ability of a neural network, which has the characteristics of high robustness, high learning, and high self-adaptability [41]. Therefore, a fuzzy neural network (FNN)-based launching states recognition (LSR) system for heavy-duty vehicles is designed to discriminate the driver’s launching intention and the launching equivalent resistance torque, as shown in Figure 9.
The input variable ξ = [ξ1, ξ2, ξ3, ξ4] T, and each component ξi is a fuzzy linguistic variable.
ξ = ξ 1 , ξ 2 , ξ 3 , ξ 4 T = α , α ˙ , m , θ T T ( ξ i ) = A i 1 , A i 2 , , A i m i ( i = 1 , 2 , , n )
where Aij (j = 1, 2, …, mi) is the jth linguistic variable of ξi and n = 4, which is a fuzzy set defined on the argument domain Uξ, α is the throttle pedal opening, m is the vehicle launching mass, and θ is the road slope.
The output variable ϕ = [ϕ1, ϕ2]T is also a fuzzy linguistic variable. ϕ1 indicates the driver’s intention to launch, and ϕ2 indicates the equivalent resistance torque in launching the vehicle.
T ( ϕ i ) = B i 1 , B i 2 , , B i m i ( i = 1 , 2 , , r )
where Bi j (j = 1, 2, …, mi) is the jth linguistic variable of ϕi and r = 2, which is a fuzzy set defined on the argument domain Uϕ.
The affiliation function is expressed using a Gaussian function as follows:
μ i j = μ A i j ( ξ i ) = e ( ξ i c i j ) 2 σ i j 2
where cij and σij (i = 1, 2, …,n, j = 1, 2, …, mi) are the center value and width of the affiliation function.
The essence of the FNN is a multilayer feed-forward network, where the number of fuzzy partitions of each input component is determined, and the parameters to be learned are mainly the connection weight wij (i = 1, 2, j = 1, 2, …, m) in the last layer, and the center value cij and width σij (i = 1,2,…,n, j = 1, 2, …, mi) of the affiliation function in the second layer.
The jth node of the qth layer in the general neuron is described as follows:
f ( q ) = i = 1 n q 1 w j i ( q ) ξ i ( q 1 ) ξ j ( q ) = g ( q ) ( f ( q ) ) = 1 1 + e μ f ( q )
For the FNN of Figure 9, the input and output functions of the neuron nodes have a more specialized form. The first layer is the input layer. The individual nodes of this layer are directly connected to the components of the input vector and transmit the input value ξ to the next layer.
f i ( 1 ) = ξ i ( 0 ) = ξ i ,   ξ i ( 1 ) = g i ( 1 ) = f i ( 1 ) ( i = 1 , 2 , , n )
Each node in the second layer represents a linguistic variable value, such as NB, PS, etc. It serves to compute the affiliation function μi j of each input component belonging to the fuzzy set of each linguistic variable value.
f i j ( 2 ) = ( ξ i ( 1 ) c i j ) 2 σ i j 2 ξ i j ( 2 ) = μ i j = g i j ( 2 ) = e f i j ( 2 ) = e ( ξ i ( 1 ) c i j ) 2 σ i j 2 ( i = 1 , 2 , , n ; j = 1 , 2 , , m i )
Each node in the third layer represents a fuzzy rule, which is used to match the antecedents of the fuzzy rules and calculate the applicability of each rule.
f j ( 3 ) = min ξ 1 i 1 ( 2 ) , ξ 2 i 2 ( 2 ) , , ξ n i n ( 2 ) = min μ 1 i 1 , μ 2 i 2 , , μ n i n ξ j ( 3 ) = α j = g j ( 3 ) = f j ( 3 ) ( j = 1 , 2 , , m ; m = i = 1 n m i )
For a given input, only those linguistic variable values in the vicinity of the input point have large affiliation values, and those far from the input point have small affiliations. When the degree of affiliation is small (e.g., less than 0.05), the approximation is taken as 0.
The fourth layer implements the normalization calculation.
f j ( 4 ) = ξ j ( 3 ) / i = 1 m ξ i ( 3 ) = α j / i = 1 m α i ξ j ( 4 ) = α ¯ j = g j ( 4 ) = f j ( 4 ) ( j = 1 , 2 , , m )
The fifth layer is the output layer and what it implements is the clarity calculation.
f i ( 5 ) = j = 1 m w i j ξ j ( 4 ) = j = 1 m w i j α ¯ j ,     ξ j ( 5 ) = ϕ i = g i ( 5 ) = f i ( 5 ) ( i = 1 , 2 )
Let the error cost function be taken as follows:
E = 1 2 i = 1 r ( t i ϕ i ) 2
where ti and ϕi represent the expected output and actual output, respectively. The first-order gradient search is used to regulate wij, cij and σij.
δ i ( 5 ) = E f i ( 5 ) = t i ϕ i
E w i j = E f i ( 5 ) f i ( 5 ) w i j = δ i ( 5 ) ξ j ( 4 ) = ( t i ϕ i ) α ¯ i
δ j ( 4 ) = E f j ( 4 ) = i = 1 2 E f i ( 5 ) f i ( 5 ) g j ( 4 ) g j ( 4 ) f j ( 4 ) = i = 1 2 δ i ( 5 ) w i j
δ j ( 3 ) = E f j ( 3 ) = i = 1 2 E f j ( 4 ) f j ( 4 ) g j ( 3 ) g j ( 3 ) f j ( 3 ) = δ j ( 4 ) i = 1 i j m ξ i ( 3 ) / ( i = 1 m ξ i ( 3 ) ) 2 = δ j ( 4 ) i = 1 i j m α i / ( i = 1 m α i ) 2
δ i j ( 2 ) = E f i j ( 2 ) = k = 1 m E f k ( 3 ) f k ( 3 ) g i j ( 2 ) g i j ( 2 ) f i j ( 2 ) = k = 1 m δ k ( 3 ) s i j e f i j ( 2 ) = k = 1 m δ k ( 3 ) s i j e ( ξ i c i j ) 2 σ i j 2
when f(3) employs small operations.
s i j = f k ( 3 ) g i j ( 2 ) = f k ( 3 ) μ i j = 1 g i j ( 2 ) = μ i j   s i j = f k ( 3 ) g i j ( 2 ) = f k ( 3 ) μ i j = 0 g i j ( 2 ) μ i j
when f(3) employs multiplication operations.
s i j = f k ( 3 ) g i j ( 2 ) = f k ( 3 ) μ i j = j = 1 j i n μ j i j g i j ( 2 ) = μ i j   s i j = f k ( 3 ) g i j ( 2 ) = f k ( 3 ) μ i j = 0 g i j ( 2 ) μ i j
This leads to the required first-order gradient as follows:
E c i j = E f i j ( 2 ) f i j ( 2 ) c i j = δ i j ( 2 ) 2 ( ξ i c i j ) σ i j 2 E σ i j = E f i j ( 2 ) f i j ( 2 ) σ i j = δ i j ( 2 ) 2 ( ξ i c i j ) 2 σ i j 3
Using first-order gradient search to regulate wij, cij and σij.
w i j ( k + 1 ) = w i j ( k ) β E w i j ( i = 1 , 2 , , r   ; j = 1 , 2 , , m ) c i j ( k + 1 ) = c i j ( k ) β E c i j ( i = 1 , 2 , , n   ; j = 1 , 2 , , m i ) σ i j ( k + 1 ) = σ i j ( k ) β E σ i j ( i = 1 , 2 , , n   ; j = 1 , 2 , , m i )
where β > 0 is the learning rate.
A fuzzy neural network (FNN)-based launching states recognition (LSR) system is used to recognize the driver’s launching intention and the launching equivalent resistance moment, as shown in Figure 10. Moreover, the driver’s launching intention is categorized as slow, medium, and fast, and the vehicle’s launching equivalent resistance is categorized as small, medium, and large.
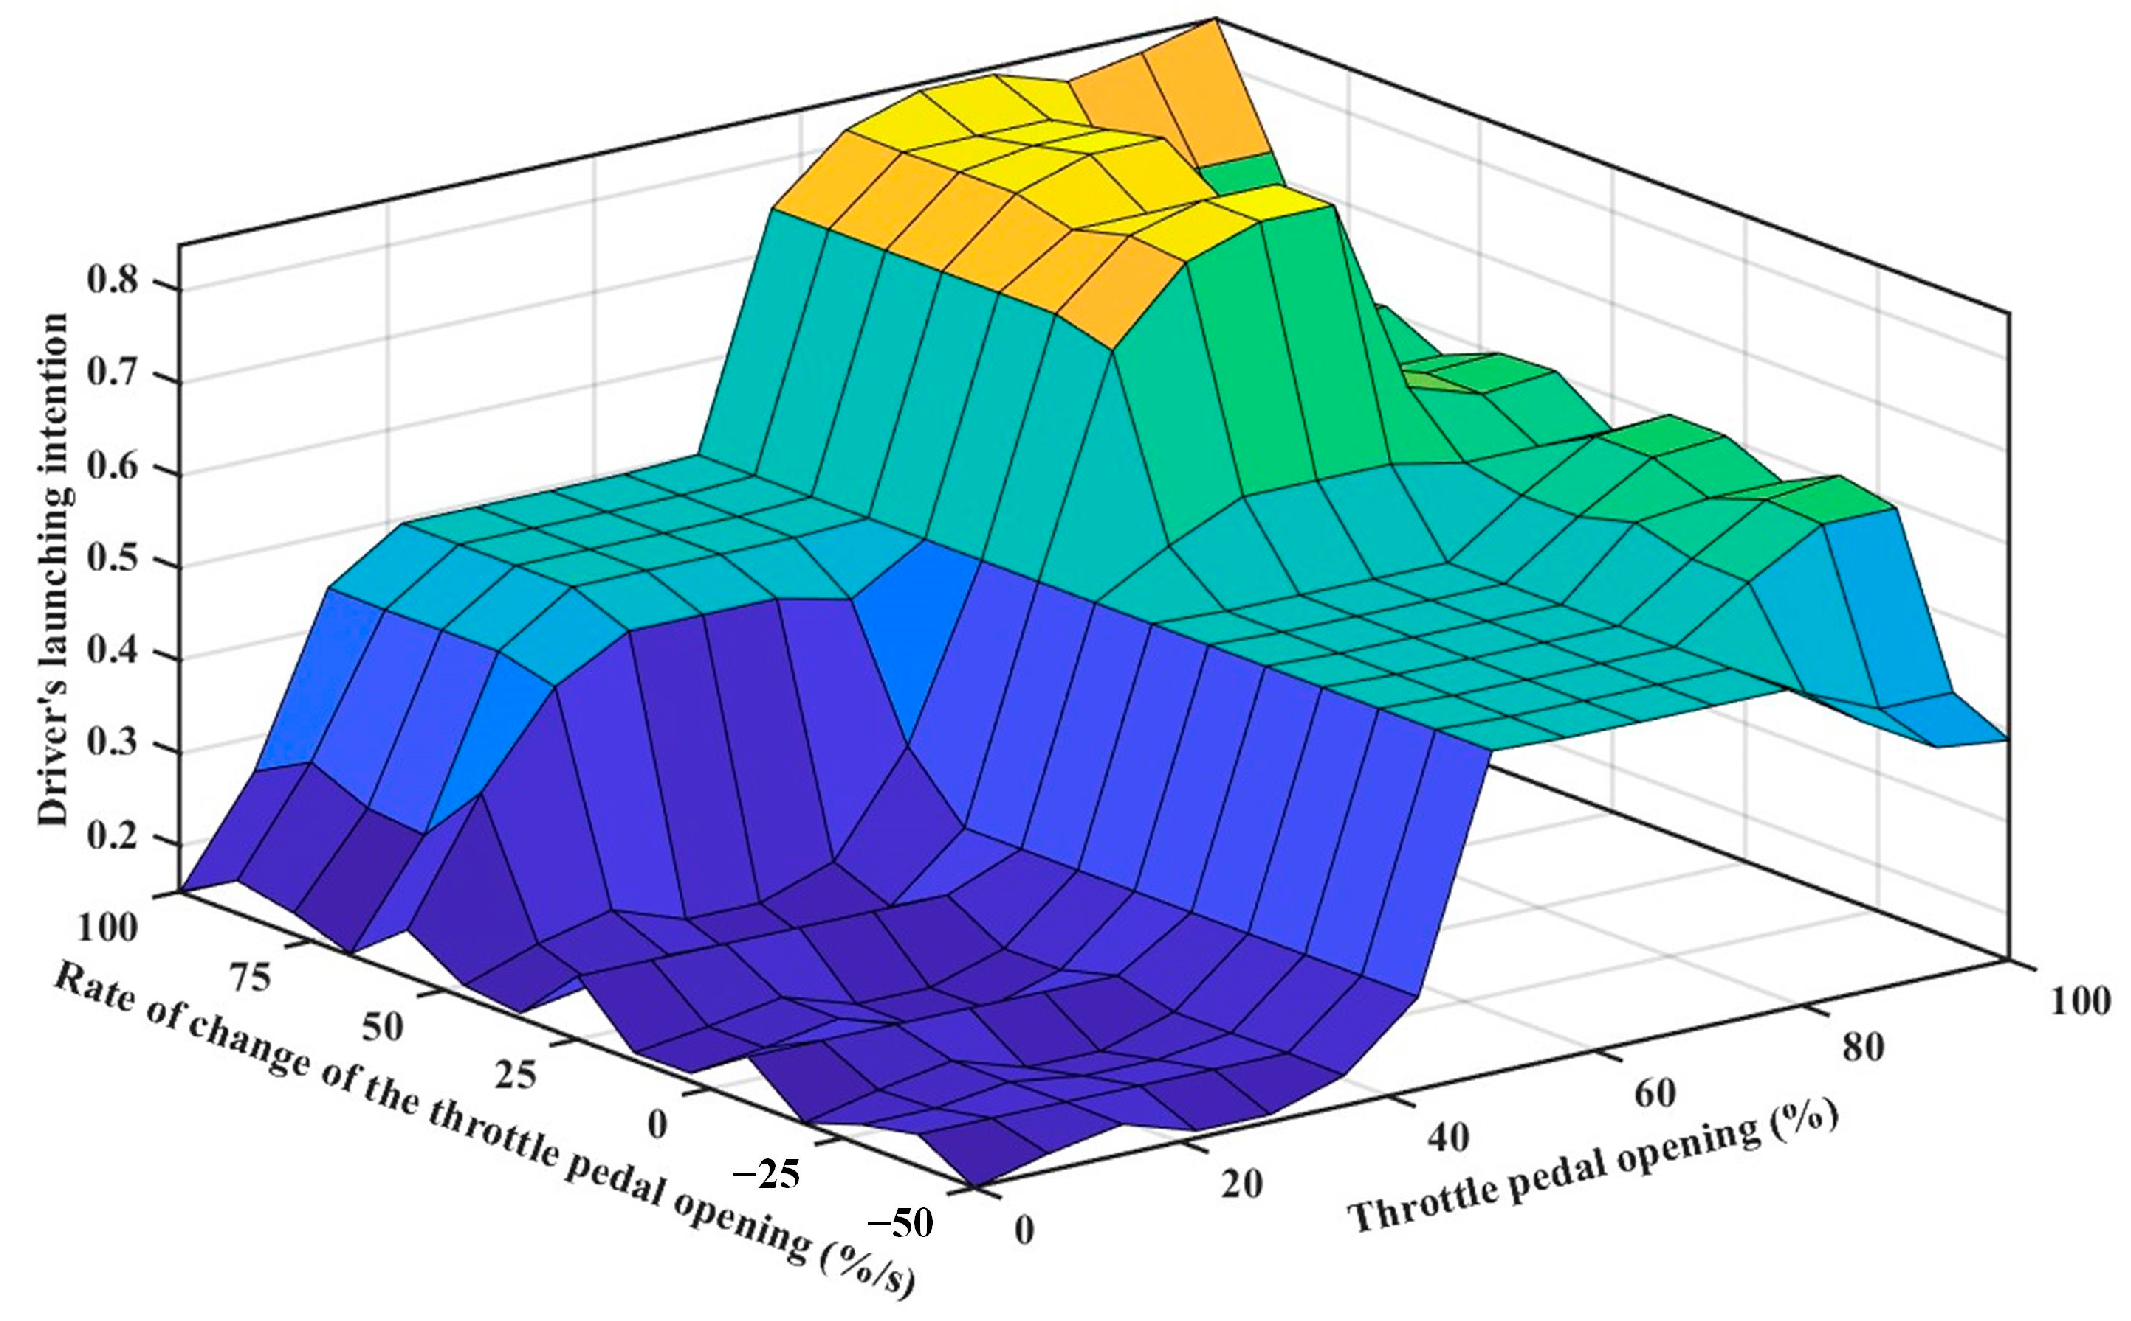
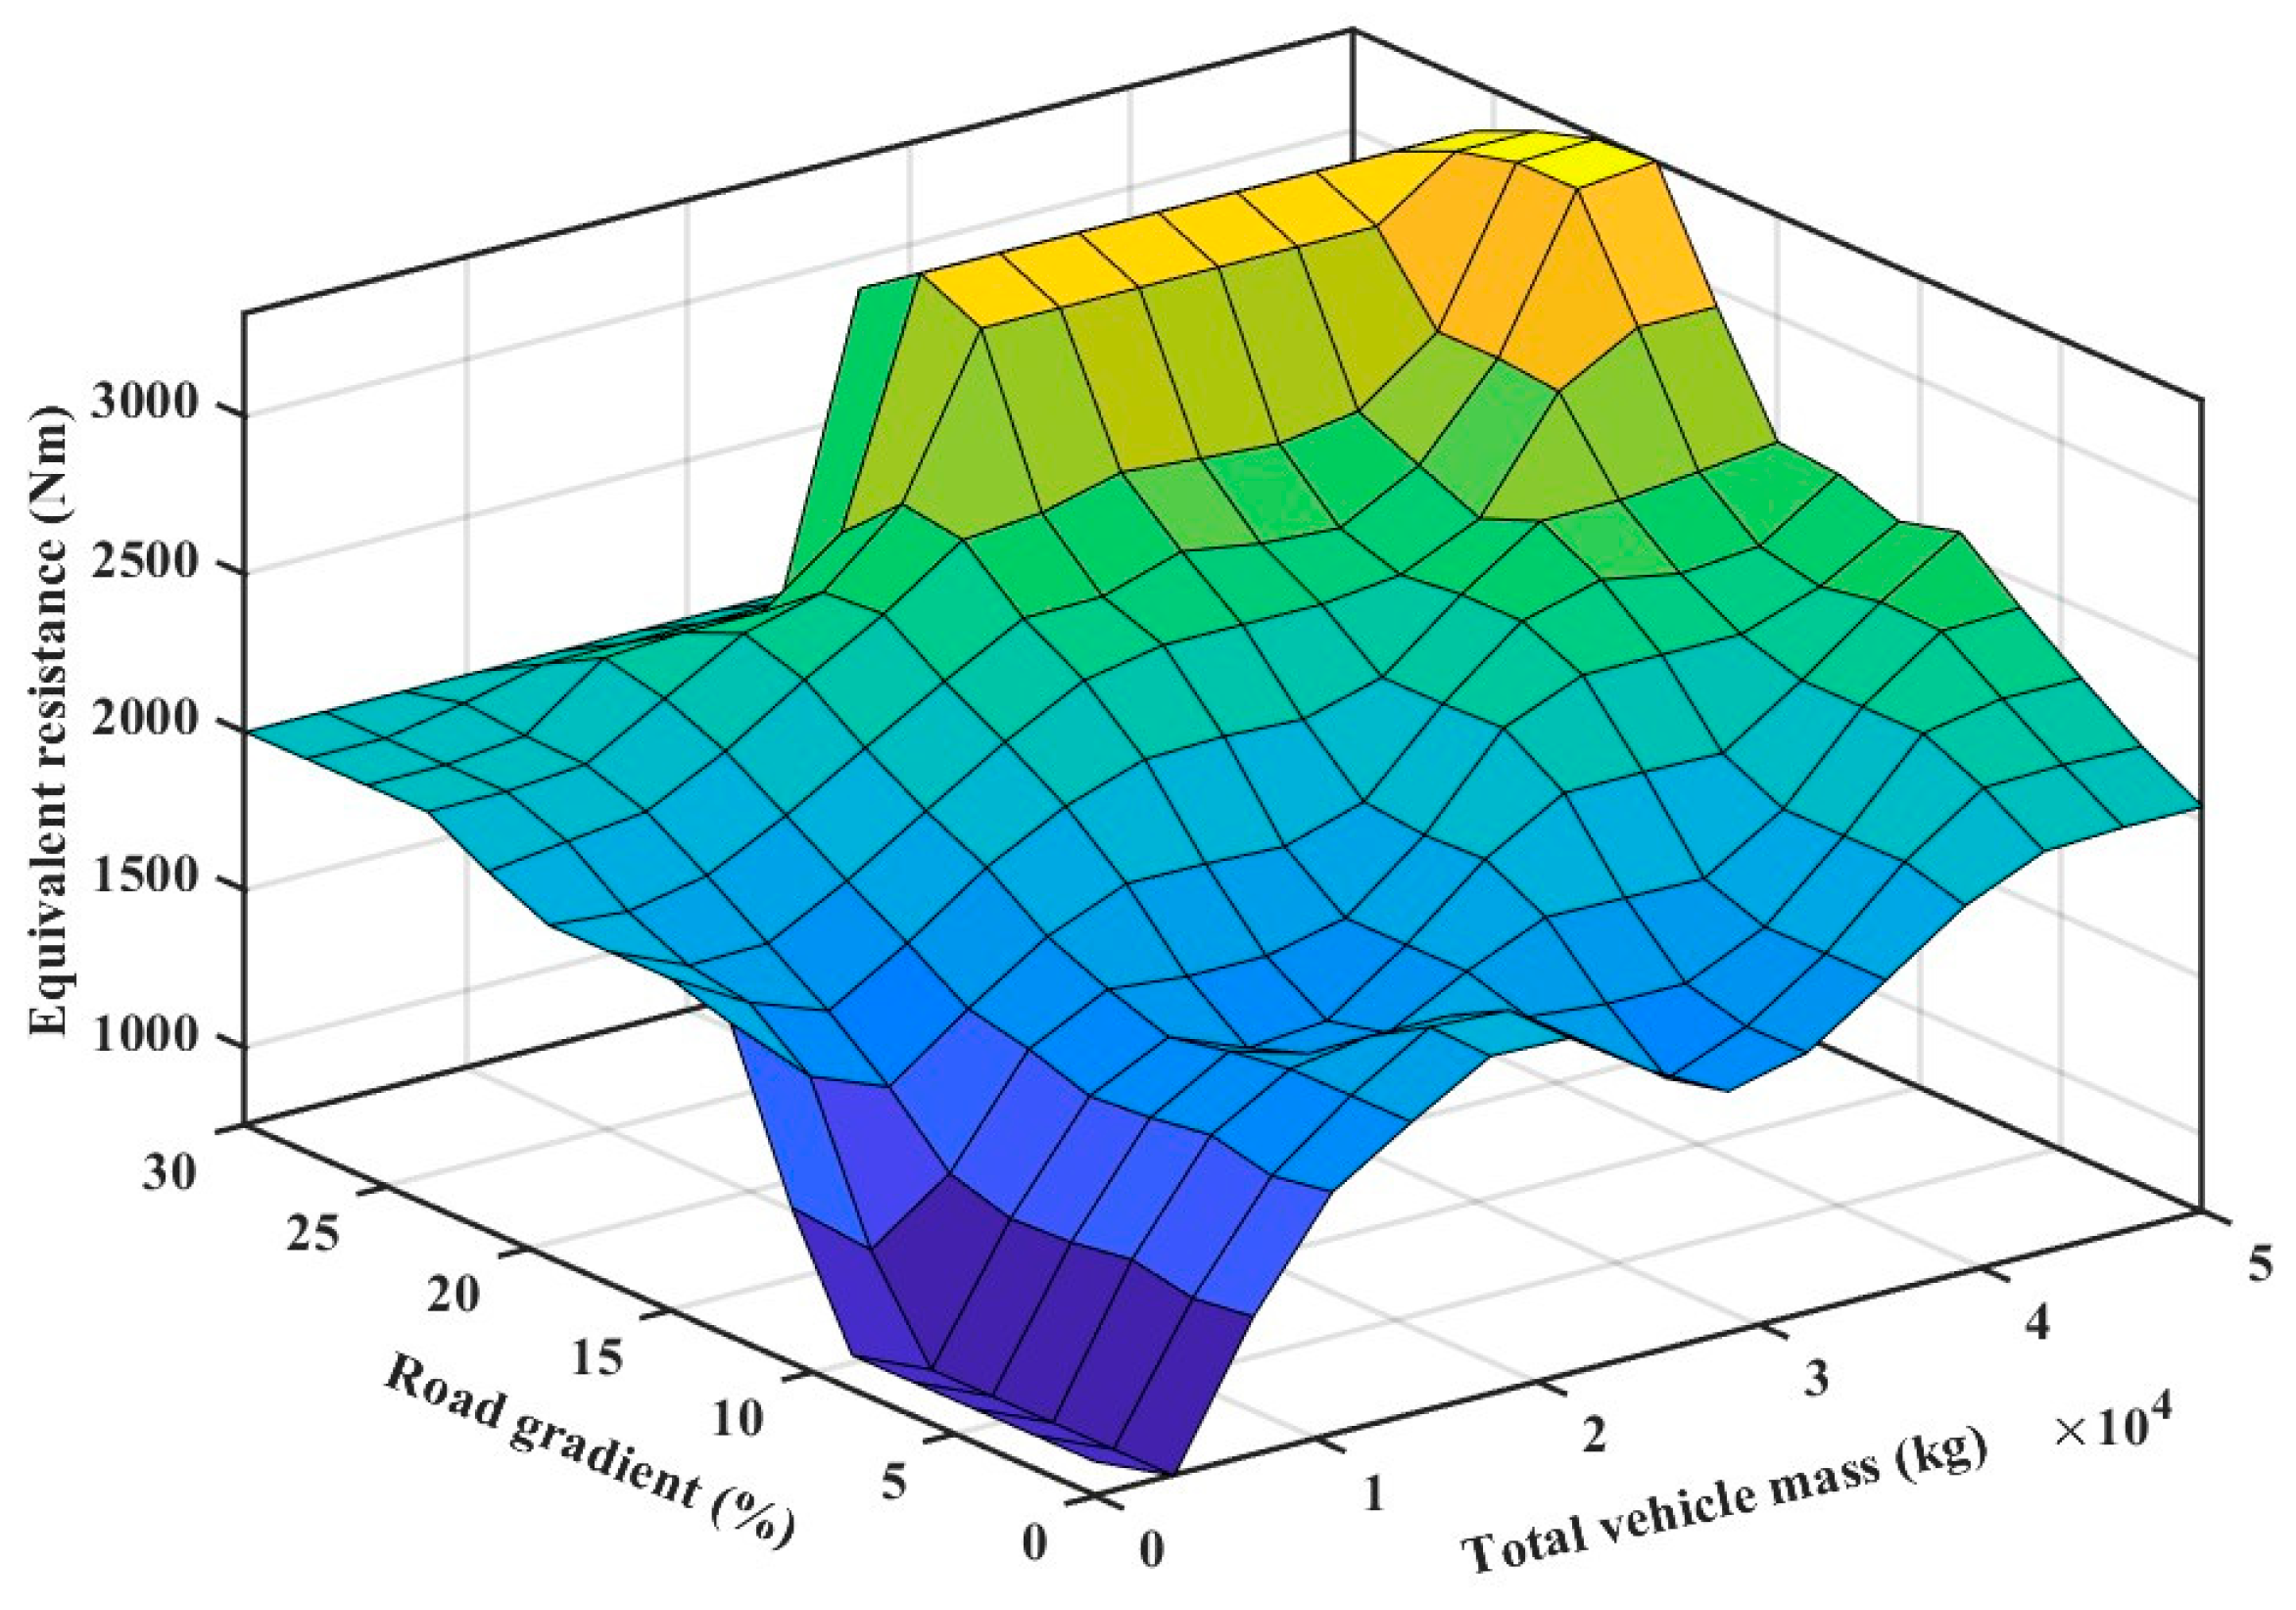
The fuzzy rule surfaces for the driver’s launching intention and the launching equivalent resistance identification are shown in Figure 11 and Figure 12.

4. Optimum Clutch Torque Control for Launching

4.1. Performance Evaluation Indexes

The jerk j of the vehicle during launching is j = d a / d t = d u ˙ a / d t . At the same time, the jerk j is caused by the continuous variation of the clutch transfer torque, which can also be written as follows:
j = d a d t = r w M ˙ c f i g i 0 J v
where j is proportional to the derivative of the torque transmitted by the clutch.
The friction work W produced by the slipping of the clutch pressure plate and friction plate can be described as follows [42]:
W = t 0 t f M c f ( ω e n g ω c f ) d t
where t0 is the point in time when the clutch begins to slip, tf is the point in time when the active and passive parts of the clutch are synchronized. From Figure 2(c1), it can be seen that t0 = t2 and tf = t4.
When the vehicle is in the heavy load or hill climbing launch, the driver has to increase the throttle pedal opening, so that the launching reserve power of the engine plays an important role in ensuring power output. Therefore, when the vehicle launches, the greater the engine output reserve power, the better the launching dynamics. The launching reserve power can be described as follows:
P R = M e n g ω e n g ( M v m g i θ ) ω c f
where iθ is the vehicle launching road gradient, iθ = sin θ.

4.2. Description of the Launching Optimal Control Problem

The engine speed ωeng, the clutch slip speed ωcf, the clutch transmission torque Mcf, and the vehicle equivalent resistance Mv are selected as state variables x:
x = [ x 1 , x 2 , x 3 , x 4 ] T = [ ω e n g , ω c f , M c f , M v ] T
The engine torque Meng and the rate of clutch transfer torque Mcf are selected as control variables u:
u = [ u 1 , u 2 ] T = [ M e n g , M ˙ c f ] T
The state space equation for the clutch slipping dynamics can be expressed as follows:
x ˙ = f ( x , u , t ) = A x + B u + d
The matrices A, B, and the disturbance value d in the state equation can be expressed as follows:
A = b e q J e q 0 1 J e q 0 0 b v J v 1 J v 1 J v 0 0 0 0 0 C D A ρ r w 3 100 i g 3 i 0 3 0 0 B = 1 J e q 0 0 0 0 1 0 0 d = 0 d t w 0 0
A disturbance observer is designed to observe d for the disturbances generated by the elasticity and damping of the transmission system on the clutch engagement.
Before designing the observer, we need to set the auxiliary variables as follows:
z = d ^ Q x
where d ^ =   [ 0   d ^ t w   0   0 ] is the estimated value of disturbance d, and Q is the observation coefficient. Then, the differential equation for this auxiliary variable is z ˙ = d ^ Q x ˙ .
The error between the true and observed values of the disturbance is d ~ = d d ^ . According to the basic approach of observer design, the differential of the disturbance is taken as d ^ ˙ = Q ( d d ^ ) . Then, the differentiation of the error between the true value of the disturbance and the observed value is d ~ ˙ = d ˙ d ^ ˙ = d ˙ Q ( d d ^ ) . The change of d is slow compared to the dynamic properties of the observer, d ˙ = 0 , and thus, d ~ ˙ can be expressed as follows:
d ˜ ˙ d ^ ˙ = Q ( d d ^ ) = Q d ˜
The differentiation of the auxiliary variable z can be expressed as follows:
z ˙ = d ^ ˙ Q x ˙ = Q ( d d ^ ) Q ( A x + B u + d ) = Q ( A x + B u ) Q d ^
The nonlinear convergence exponential observer for elastic and damped disturbances in the transmission system is designed as follows:
z ˙ = Q ( A x + B u ) Q d ^ d ^ = z + Q x
The designed observer is then subjected to a stability proof. The differentiation of the auxiliary variable is z ˙ = Q A x + B u Q z + Q x . Since it is assumed that d ˙ = 0 , the differentiation of the error between the true and observed values of the disturbance is d ~ ˙ = d ^ ˙ = z ˙ Q x ˙ . The differentiation of the error is simplified as follows:
d ˜ ˙ = z ˙ Q x ˙ = ( Q ( A x + B u ) Q ( z + Q x ) ) Q x ˙ = Q ( A x + B u ) + Q ( z + Q x ) Q x ˙ = Q ( d ^ d ) = Q d ˜
Equation (53) is a linear differential equation, and the solution of this differential equation can be characterized as follows:
d ˜ ( t ) = d ˜ ( t 0 ) exp ( Q t )
where d ~ ( t 0 ) is the initial error of observation. Equation (54) is a nonlinear observer with exponential convergence, and the convergence accuracy depends on the observed coefficients Q. Compared to other observers with asymptotic convergence, it guarantees that the estimate d ^ converges to the actual value d in finite time.
The state space equation based on the perturbation observation can be expressed as follows:
x ˙ = f ( x , u , t ) = A x + B u + d ^
In the process of clutch launch slipping, it is necessary to improve the smoothness of the vehicle launching, reduce the energy loss associated with power transmission, and at the same time ensure that the launch acceleration and climbing ability of commercial vehicles under a heavy load are not compromised. Therefore, the slipping friction work W, the square of the jerk intensity j, and the square of the launching reserve power reciprocal PR in the launching process is taken as the optimization objective J:
J = t 0 t f L ( x , u , t ) d t = t 0 t f Q 1 W + Q 2 j 2 + Q 3 ( 1 P R ) 2 d t = t 0 t f Q 1 x 3 ( x 1 x 2 ) + Q 2 ( r w u 2 i g i 0 J v ) 2 + Q 3 ( 1 u 1 x 1 ( x 4 m g i θ ) x 2 ) 2 d t
where Q1, Q2 and Q3 are weight coefficients. By selecting different weight coefficients, different optimization control variables u can be obtained.

4.3. Shooting Method for Solving Launch Optimal Control Problems

Introducing Lagrange multiplier vectors λ = [λ1, λ2, λ3, λ4]T for the launch optimal control problem, the generalized goal generalized functions Ja are constructed:
J a = t 0 t f L ( x , u , t ) + λ T ( f ( x , u , t ) x ˙ ) d t
The Hamilton function H (x, u, λ, t) is obtained according to the minimum value principle:
H = L ( x , u , t ) + λ T f ( x , u , t ) = Q 1 x 3 ( x 1 x 2 ) + Q 2 ( r w u 2 i g i 0 J v ) 2 + Q 3 ( 1 u 1 x 1 ( x 4 m g i θ ) x 2 ) 2       + λ 1 ( A 11 x 1 + A 12 x 3 + B 11 u 1 ) + λ 2 ( A 22 x 2 + A 23 x 3 + A 24 x 4 + d ^ ) + λ 3 u 2 + λ 4 x 2
According to the minimum value principle, the optimal control variable and optimal trajectory should meet the following prerequisites: the state equation, co-state equation, control conditions, boundary conditions, constraints, and transversality condition.
(1)
State equation:
x ˙ ( t ) = f [ x ( t ) , u ( t ) , t ]
(2)
Co-state equation:
λ ˙ 1 = H x 1 = Q 1 x 3 + Q 3 ( u 1 x 1 x 4 x 2 + m g i θ x 2 ) 3 u 1 + λ 1 A 11 λ ˙ 2 = H x 2 = ( Q 1 x 3 + Q 3 ( u 1 x 1 x 4 x 2 + m g i θ x 2 ) 3 ( m g i θ x 4 ) + λ 2 A 22 + λ 4 ) λ ˙ 3 = H x 3 = ( Q 1 ( x 1 x 2 ) + λ 1 A 12 + λ 2 A 23 ) λ ˙ 4 = H x 4 = ( Q 3 ( u 1 x 1 x 4 x 2 m g i θ x 2 ) 3 x 2 + λ 2 A 24 )
(3)
Control equation:
H u 1 = Q 3 ( u 1 x 1 x 4 x 2 + m g i θ x 2 ) 3 x 1 + λ 1 B 11 = 0 H u 2 = 2 Q 2 r i g i 0 J v u 2 + λ 3 = 0
(4)
Boundary conditions:
The initial edge value condition x[t0] is introduced at the initial moment t0 as follows:
x [ t 0 ] = [ x 1 ( t 0 ) , x 2 ( t 0 ) , x 3 ( t 0 ) , x 4 ( t 0 ) ] T = [ ω e n g ( t 0 ) , ω c f ( t 0 ) , M c f ( t 0 ) , M v ( t 0 ) ] T = [ ω e n g , i d l e ,   0 ,   0 ,   M v , s t a t i c ] T
where ωeng,idle is the initial rotational speed of the engine at an idling condition, and Mv,static is the initial equivalent resistance when the vehicle is stationary.
The end edge value condition x[tf] is introduced at the end moment tf as follows:
x 1 ( t f ) = x 2 ( t f ) = ω e n g , s y n
where ωeng,syn is the rotational speed of the engine when the clutch is synchronized.
(5)
Constraints:
ω e n g , min < x 1 < ω e n g , max M e n g , min < u 1 < M e n g , max 0 < x 2 < ω e n g 0 < x 3 < M c f , max M v , s t a t i c < x 4 < M v , max  
(6)
Transversality condition:
L ( x ( t f ) , u ( t f ) ) + λ ( t f ) T f ( x ( t f ) , u ( t f ) ) = 0 L ( x ( t 0 ) , u ( t 0 ) ) + λ ( t f ) T f ( x ( t 0 ) , u ( t 0 ) ) = 0
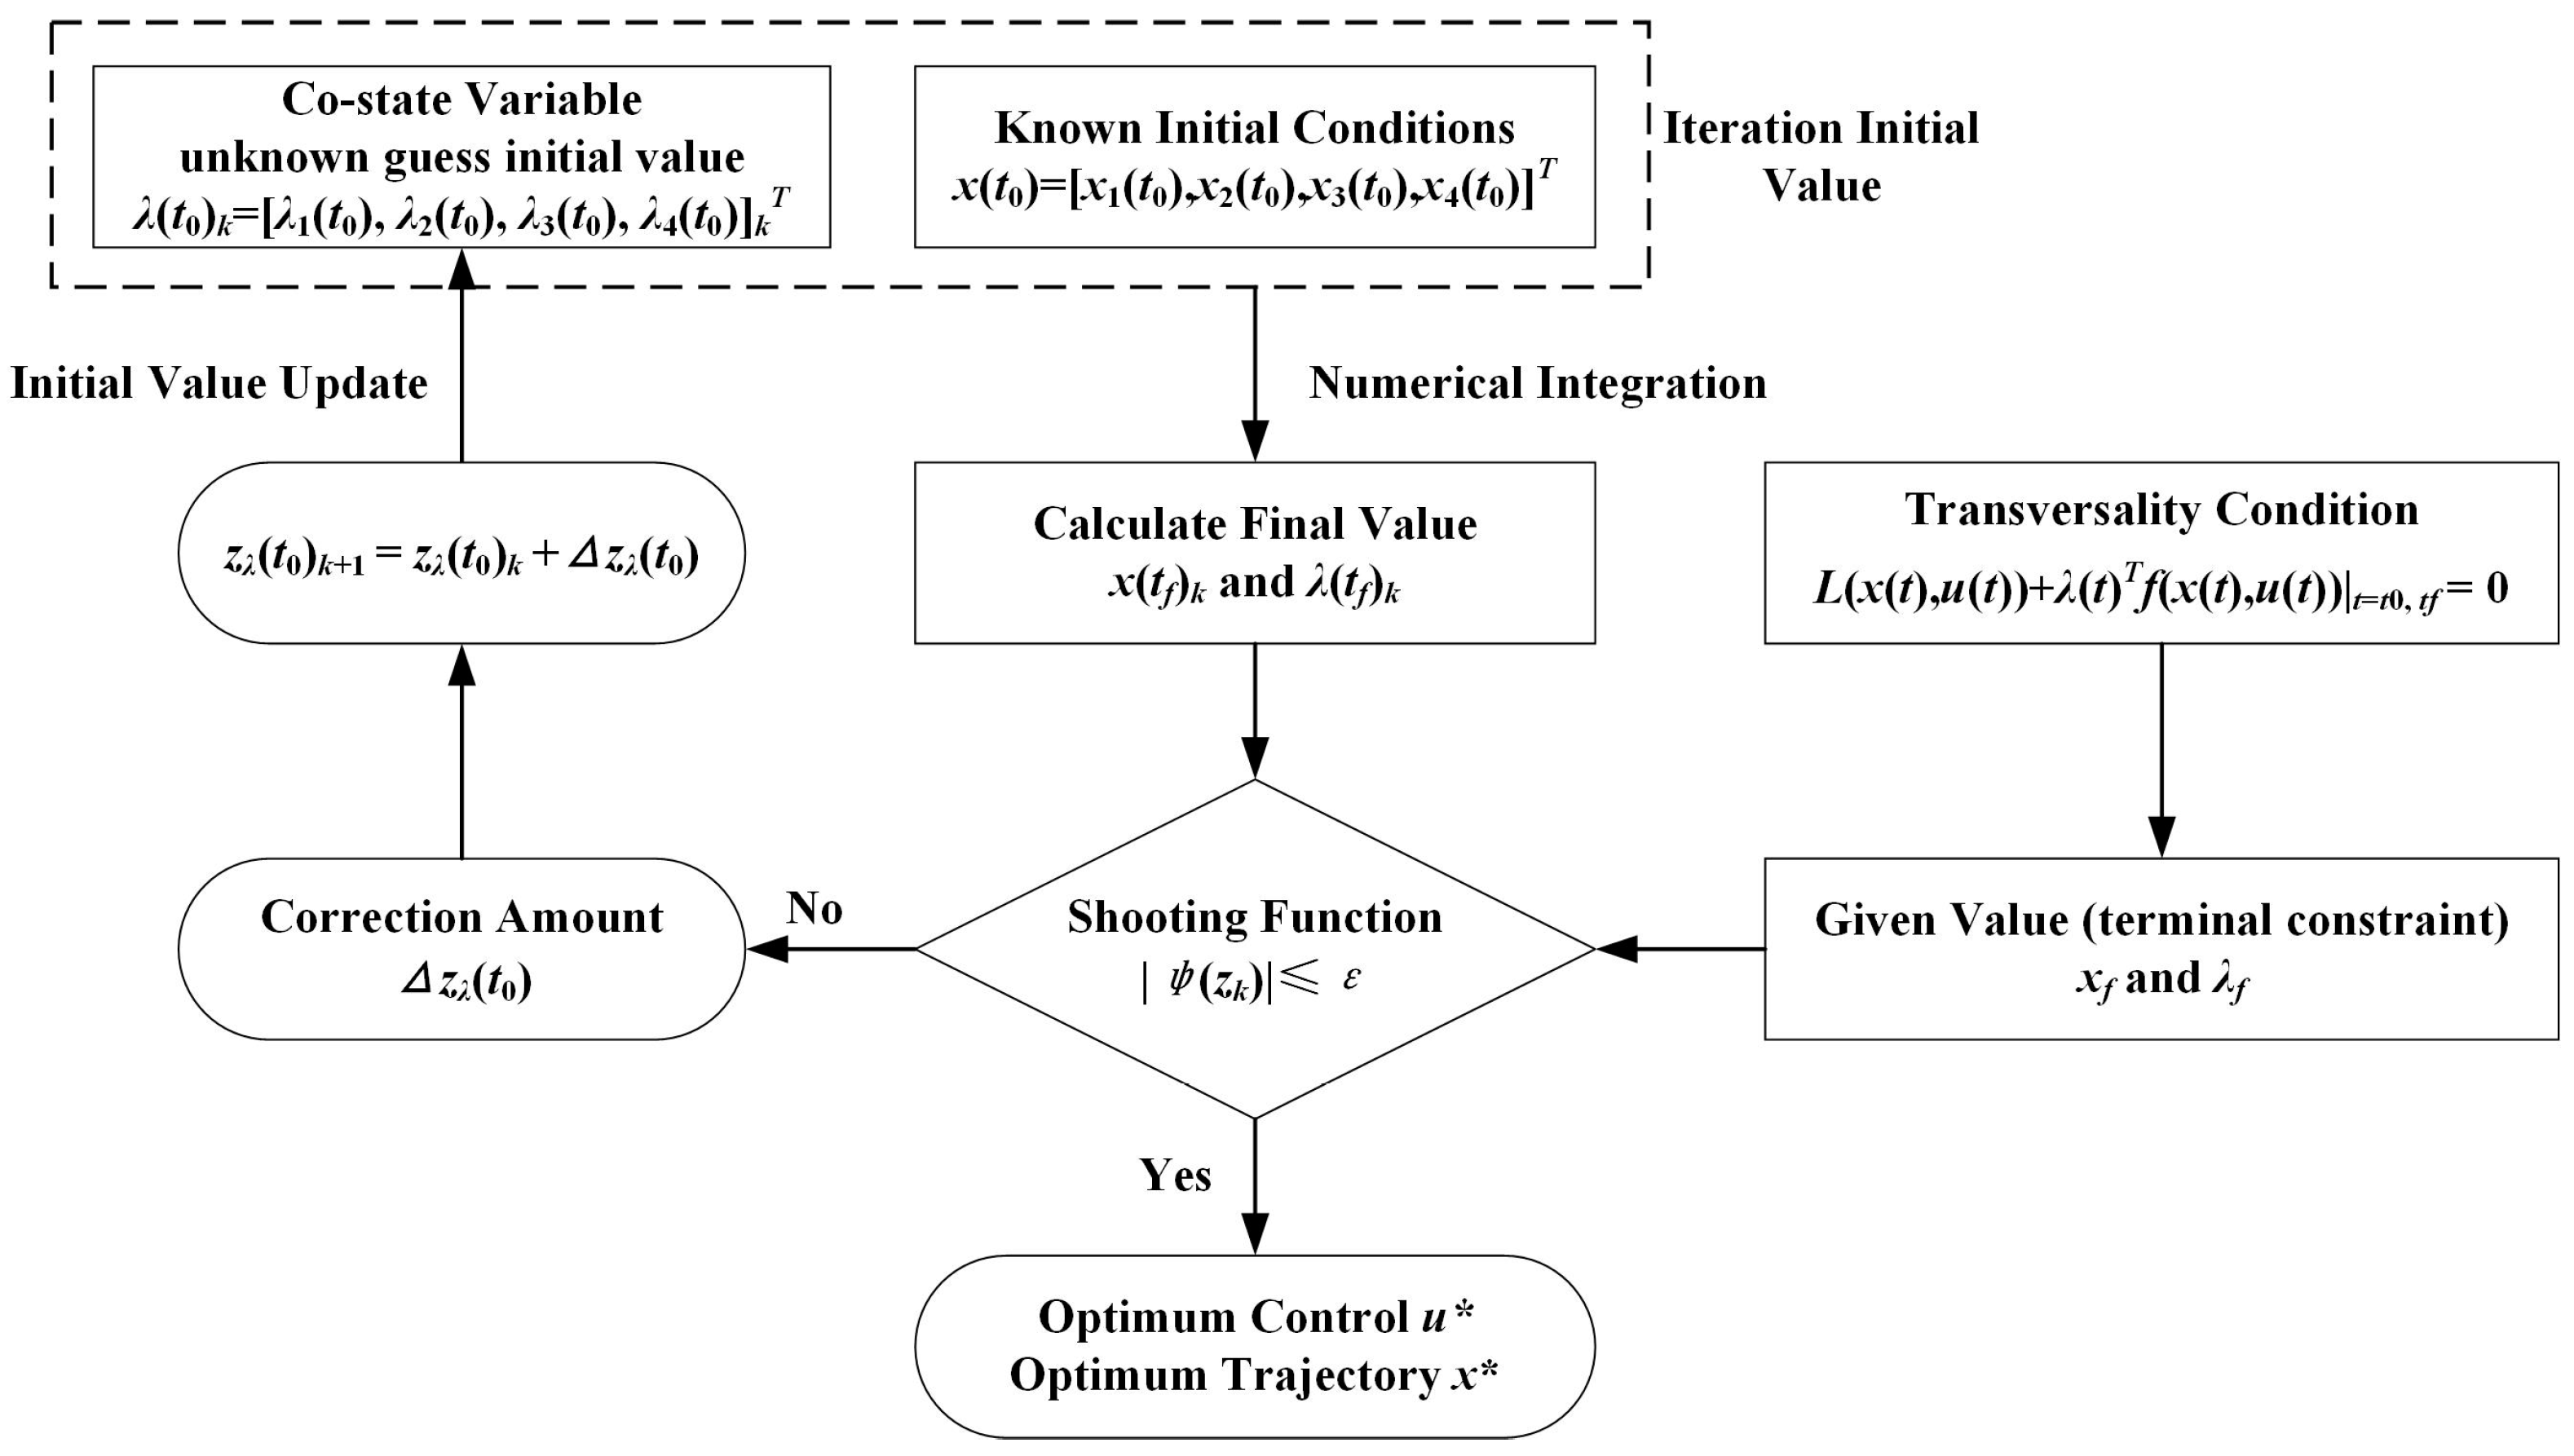
Because of the difficulty in analytically solving the co-state equation, the numerical method offers the benefits of simplicity, versatility, and increased accuracy in calculations [43]. Therefore, the process of carrying out the numerical solution of the marginal value problem for a system of differential equations based on the shooting method is shown in Figure 13.
The target shooting variables are defined as z = [x, λ]T, which consist of the state variables and their co-state variables. The initial conditions for the variable z(t0) = [x(t0), λ(t0)]T, and the state space can be expressed as follows:
z ˙ = x ˙ λ ˙ = A x + B u + d ^ H x
The target shooting function φ(z) satisfies the terminal constraint as follows:
φ ( z ) = [ z x ( t f ) x f ,   z λ ( t f ) λ f ] T ε
where xf is the trajectory vectors satisfying the terminal constraint, λf is a Lagrange multiplier vector satisfying the terminal constraint, and ε is the permissible error.
In Figure 13, the state variable zx(t0) initial conditions are known; given a set of initial values for co-state variables zλ(t0)k, the value of the shooting function φ(z) is obtained by numerical integration. When the shooting function φ(z) does not satisfy the accuracy requirement, the correction amount Δzλ(t0) is obtained by the appropriate correction method. Then, a new iterative initial value of zλ(t0)k+1 = zλ(t0)k + Δzλ(t0) is again used for integration until the shooting function φ(z) permissible error meets the accuracy requirement, where Δzλ(t0) is usually computed based on the gradient information of the shooting function φ(z).

4.4. Clutch Pneumatic Actuator Control

The clutch engagement target torque is converted via the diaphragm spring into a pneumatic actuator target displacement. A sliding mode control algorithm is used to control the clutch pneumatic actuation system, as shown in Figure 14.
To achieve the controller tracking of the target trajectory, four high-speed switching valves are combined to perform intake and exhaust operations in the cylinder chamber for fast and smooth clutch disengagement and engagement control. The specific switching modes of the pneumatic actuator are as follows [44]:
  • Mode 1 (u = 1): gas enters the working chamber;
  • Mode 2 (u = −1): gas is exhausted from the working chamber;
  • Mode 3 (u = 0): the working chamber is closed.
This switching mode results in the fastest realization of the target requirements of the control; further, the error requirements of the range of the switching valve do not work to extend the life of the valve and reduce noise. After the differentiation of Equation (19), the following Equations (68)–(70) are obtained.
y = f ( y ) + b + ( y ) u = 1 ; f ( y ) b ( y ) u = - 1 ; f ( y ) u = 0 .
f ( y ) = A K p y ˙ m a ( L 0 + y ) + k s p m a y ˙ b s m a y ¨ F ˙ a m a
b + ( y ) = K R T q m , i n m a ( L 0 + y ) b ( y ) = K R T q m , o u t m a ( L 0 + y )
A sliding mode control algorithm is used to control the pneumatic actuation system of the clutch, and the second order sliding mode surface s is defined as follows:
s = 1 λ 2 e ¨ + 2 ζ λ e ˙ + e
where e is the tracking error, e = yyd, yd is the desired position signal, and λ and ζ are the coefficients. Since the system of Equations (68)–(70) is a third-order system, the choice of a second-order sliding mode surface can have a controlling effect on the dynamics of the sliding mode surface through the acceleration and the reference acceleration after its primary differentiation. The Lyapunov function is defined as V = 1/(2 s2) by selecting the control volume u = −sign(s), such that outside the sliding mold surface s satisfies the following:
1 2 d d t s 2 < η | s |
To ensure that the sliding mold surface s is reached in a finite time, η in Equation (72) is a constant greater than zero. To prove that Equation (72) holds, a derivative of s is first taken as follows:
s ˙ = 1 λ 2 e + 2 ζ λ e ¨ + e ˙
When s > 0, from the control rate u = −sign(s), we can see that u = −1. According to Equation (68), we can get y = f y b ( y ) , and bring it into Equation (73), which yields the expression s ˙ = ( f y b y y d + 2 ζ λ e ¨ + λ 2 e ˙ ) / λ 2 . Since b ( y ) is positive, a positive number η can always be found to satisfy s ˙ < η , so s s ˙ < η s ; Equation (72) is proved. When s < 0, the same reasoning is proved.
In order to bring the pneumatic actuator out of the dead-time range faster and to improve the responsiveness of the system, a dead-time value (ε) is added to the sliding mode control rate. After considering the dead-time, a certain amount of steady state error is bound to occur in a very small region near s = 0. Therefore, the control rate after considering the dead-time is as follows:
s > ε , u = s i g n ( s ) s ε , u = 0
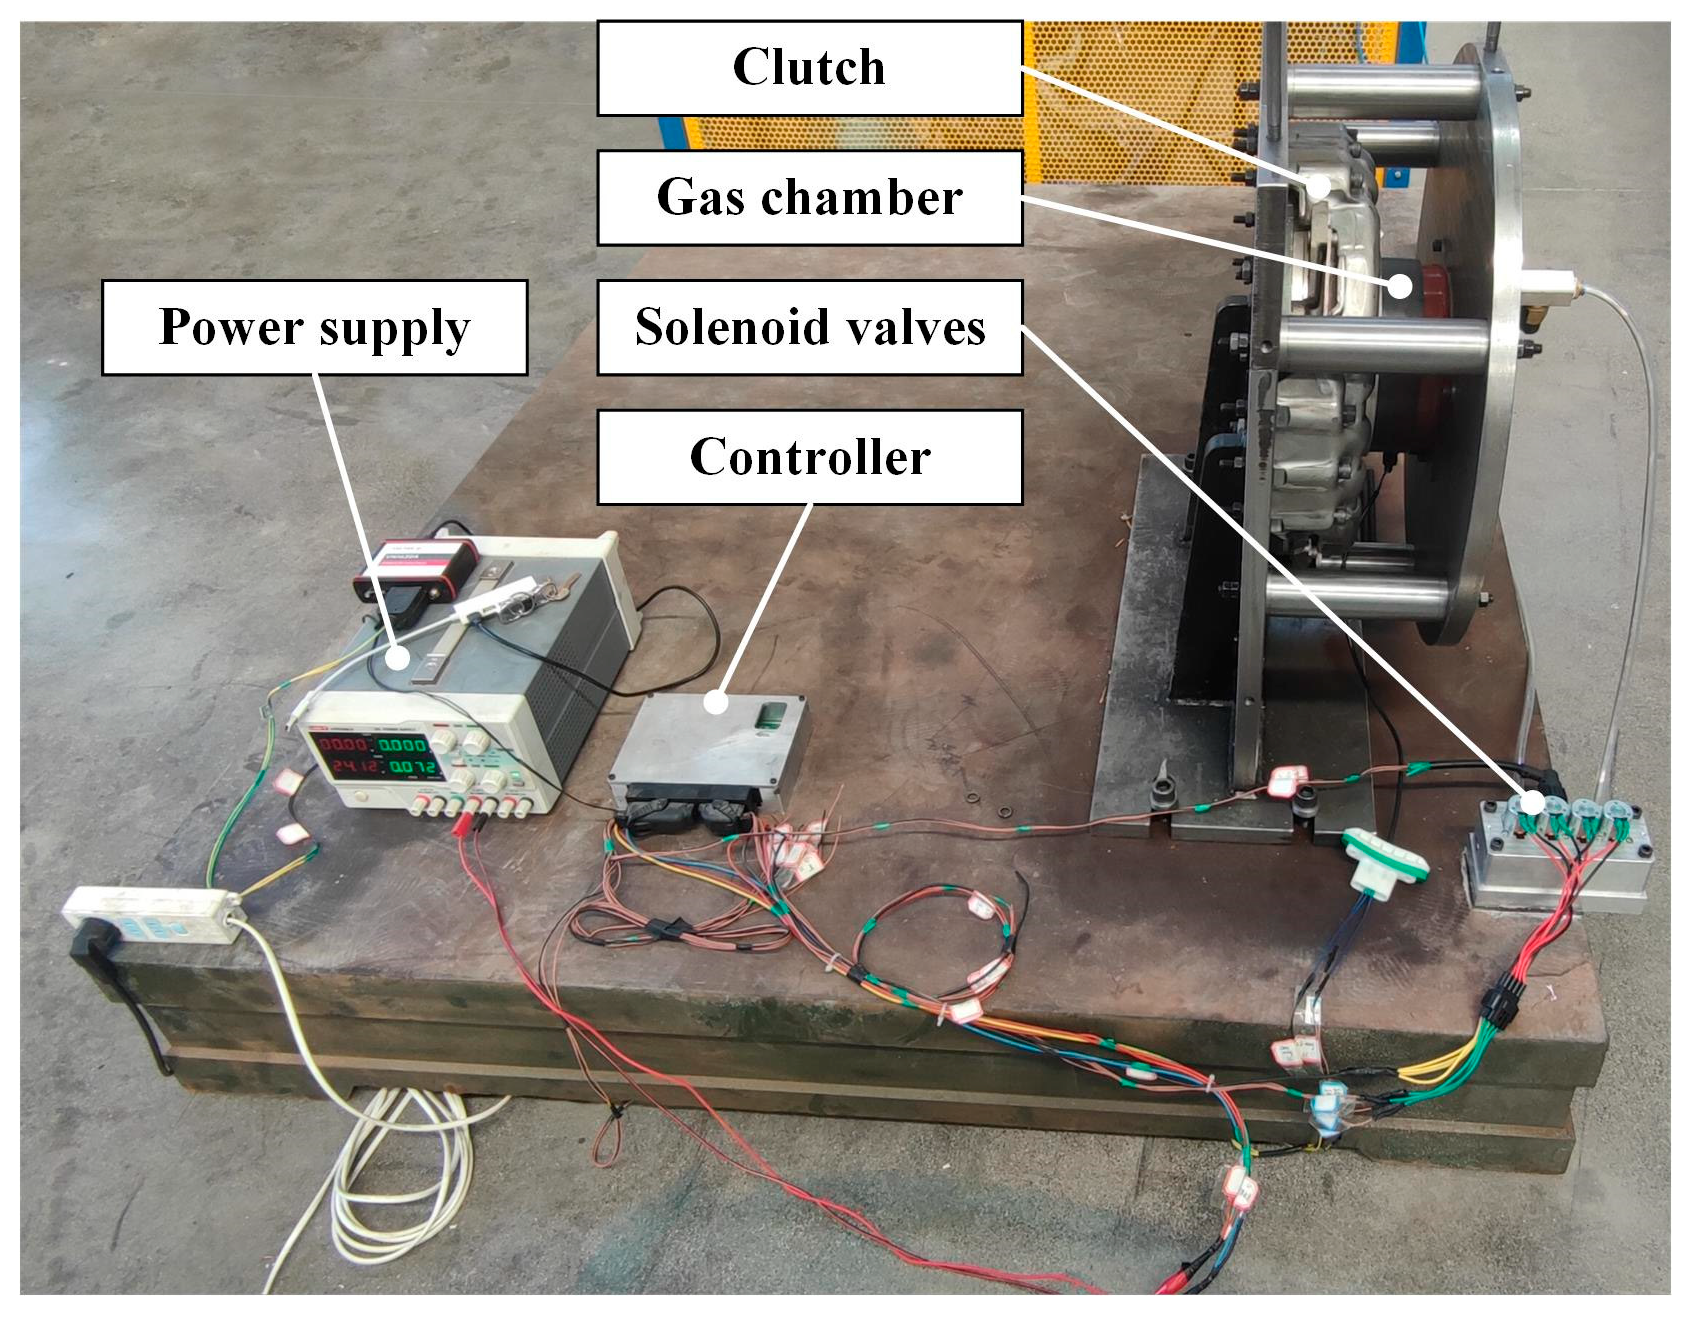
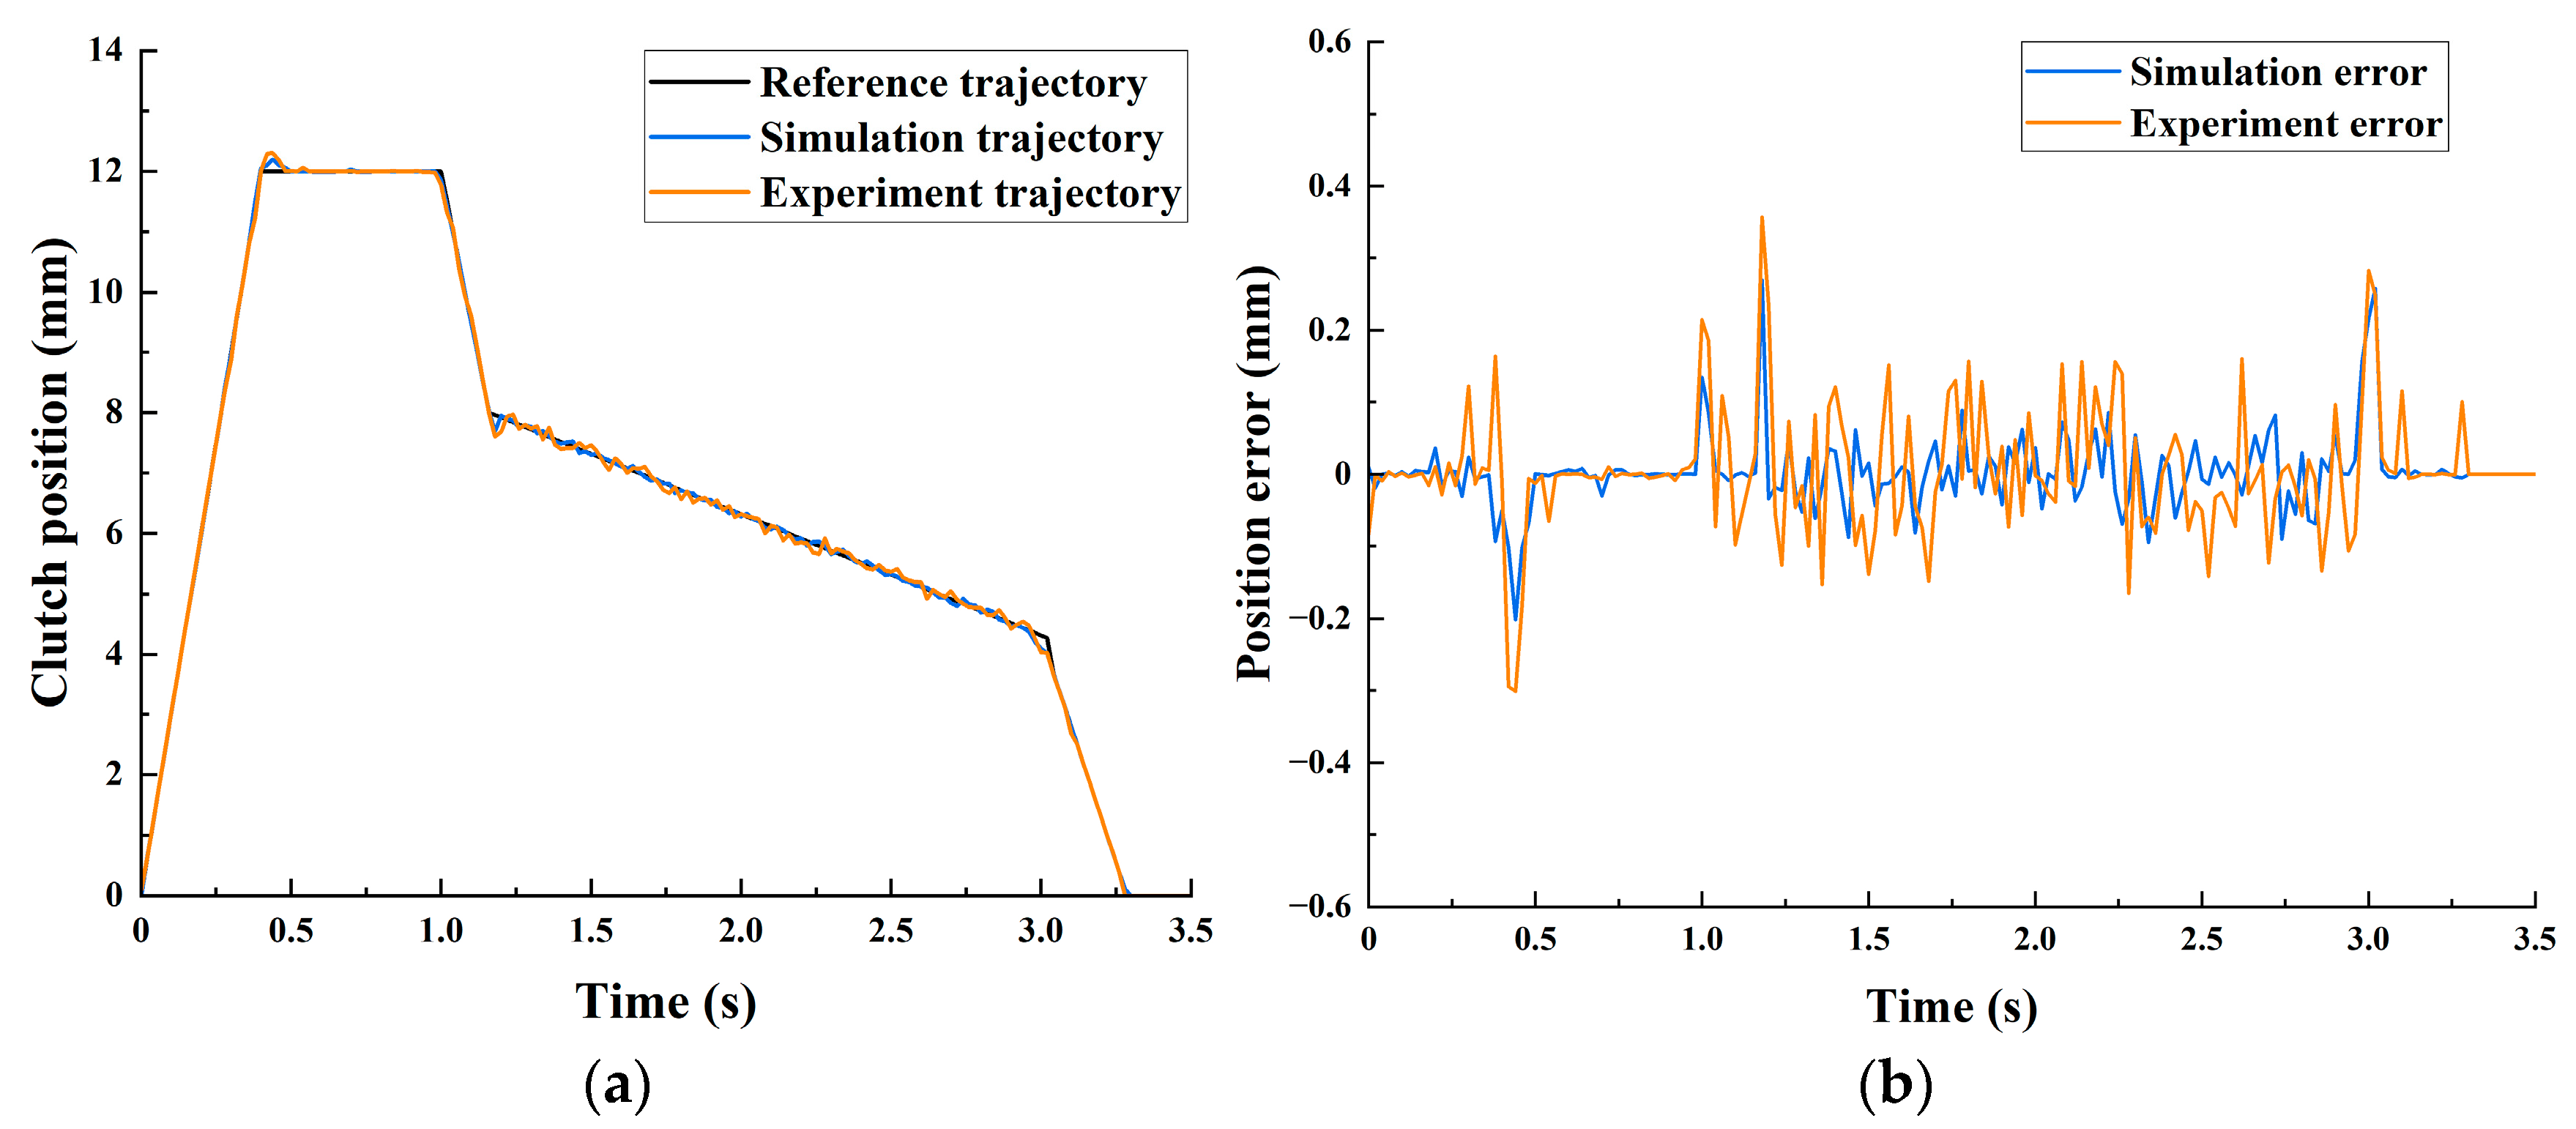
In order to verify the sliding mode control algorithm, the Matlab 2022b simulation and experiment are designed to track the reference trajectory, and the test bench is shown in Figure 15.
The clutch pneumatic actuator system is tested for tracking the reference trajectory. The simulation and experimental results are shown in Figure 16. The results show that the algorithm has good trajectory tracking accuracy and a relatively low steady-state tracking error, which verifies the effectiveness and feasibility of the algorithm.

5. Simulation and Experimental Analysis

In order to verify the effectiveness of the control strategy proposed in this study, the launching test of heavy-duty vehicles is carried out on simulations and real vehicle tests. The main parameters of the heavy-duty vehicle driveline system used in the test are shown in Table 4. Different launching intentions indicate that drivers expect different power requirements, and variations in total vehicle mass and road gradient will result in large differences in launching resistance torque. This is a major challenge for optimum clutch torque control during the vehicle launch process.

5.1. Design of Simulations and Experiments

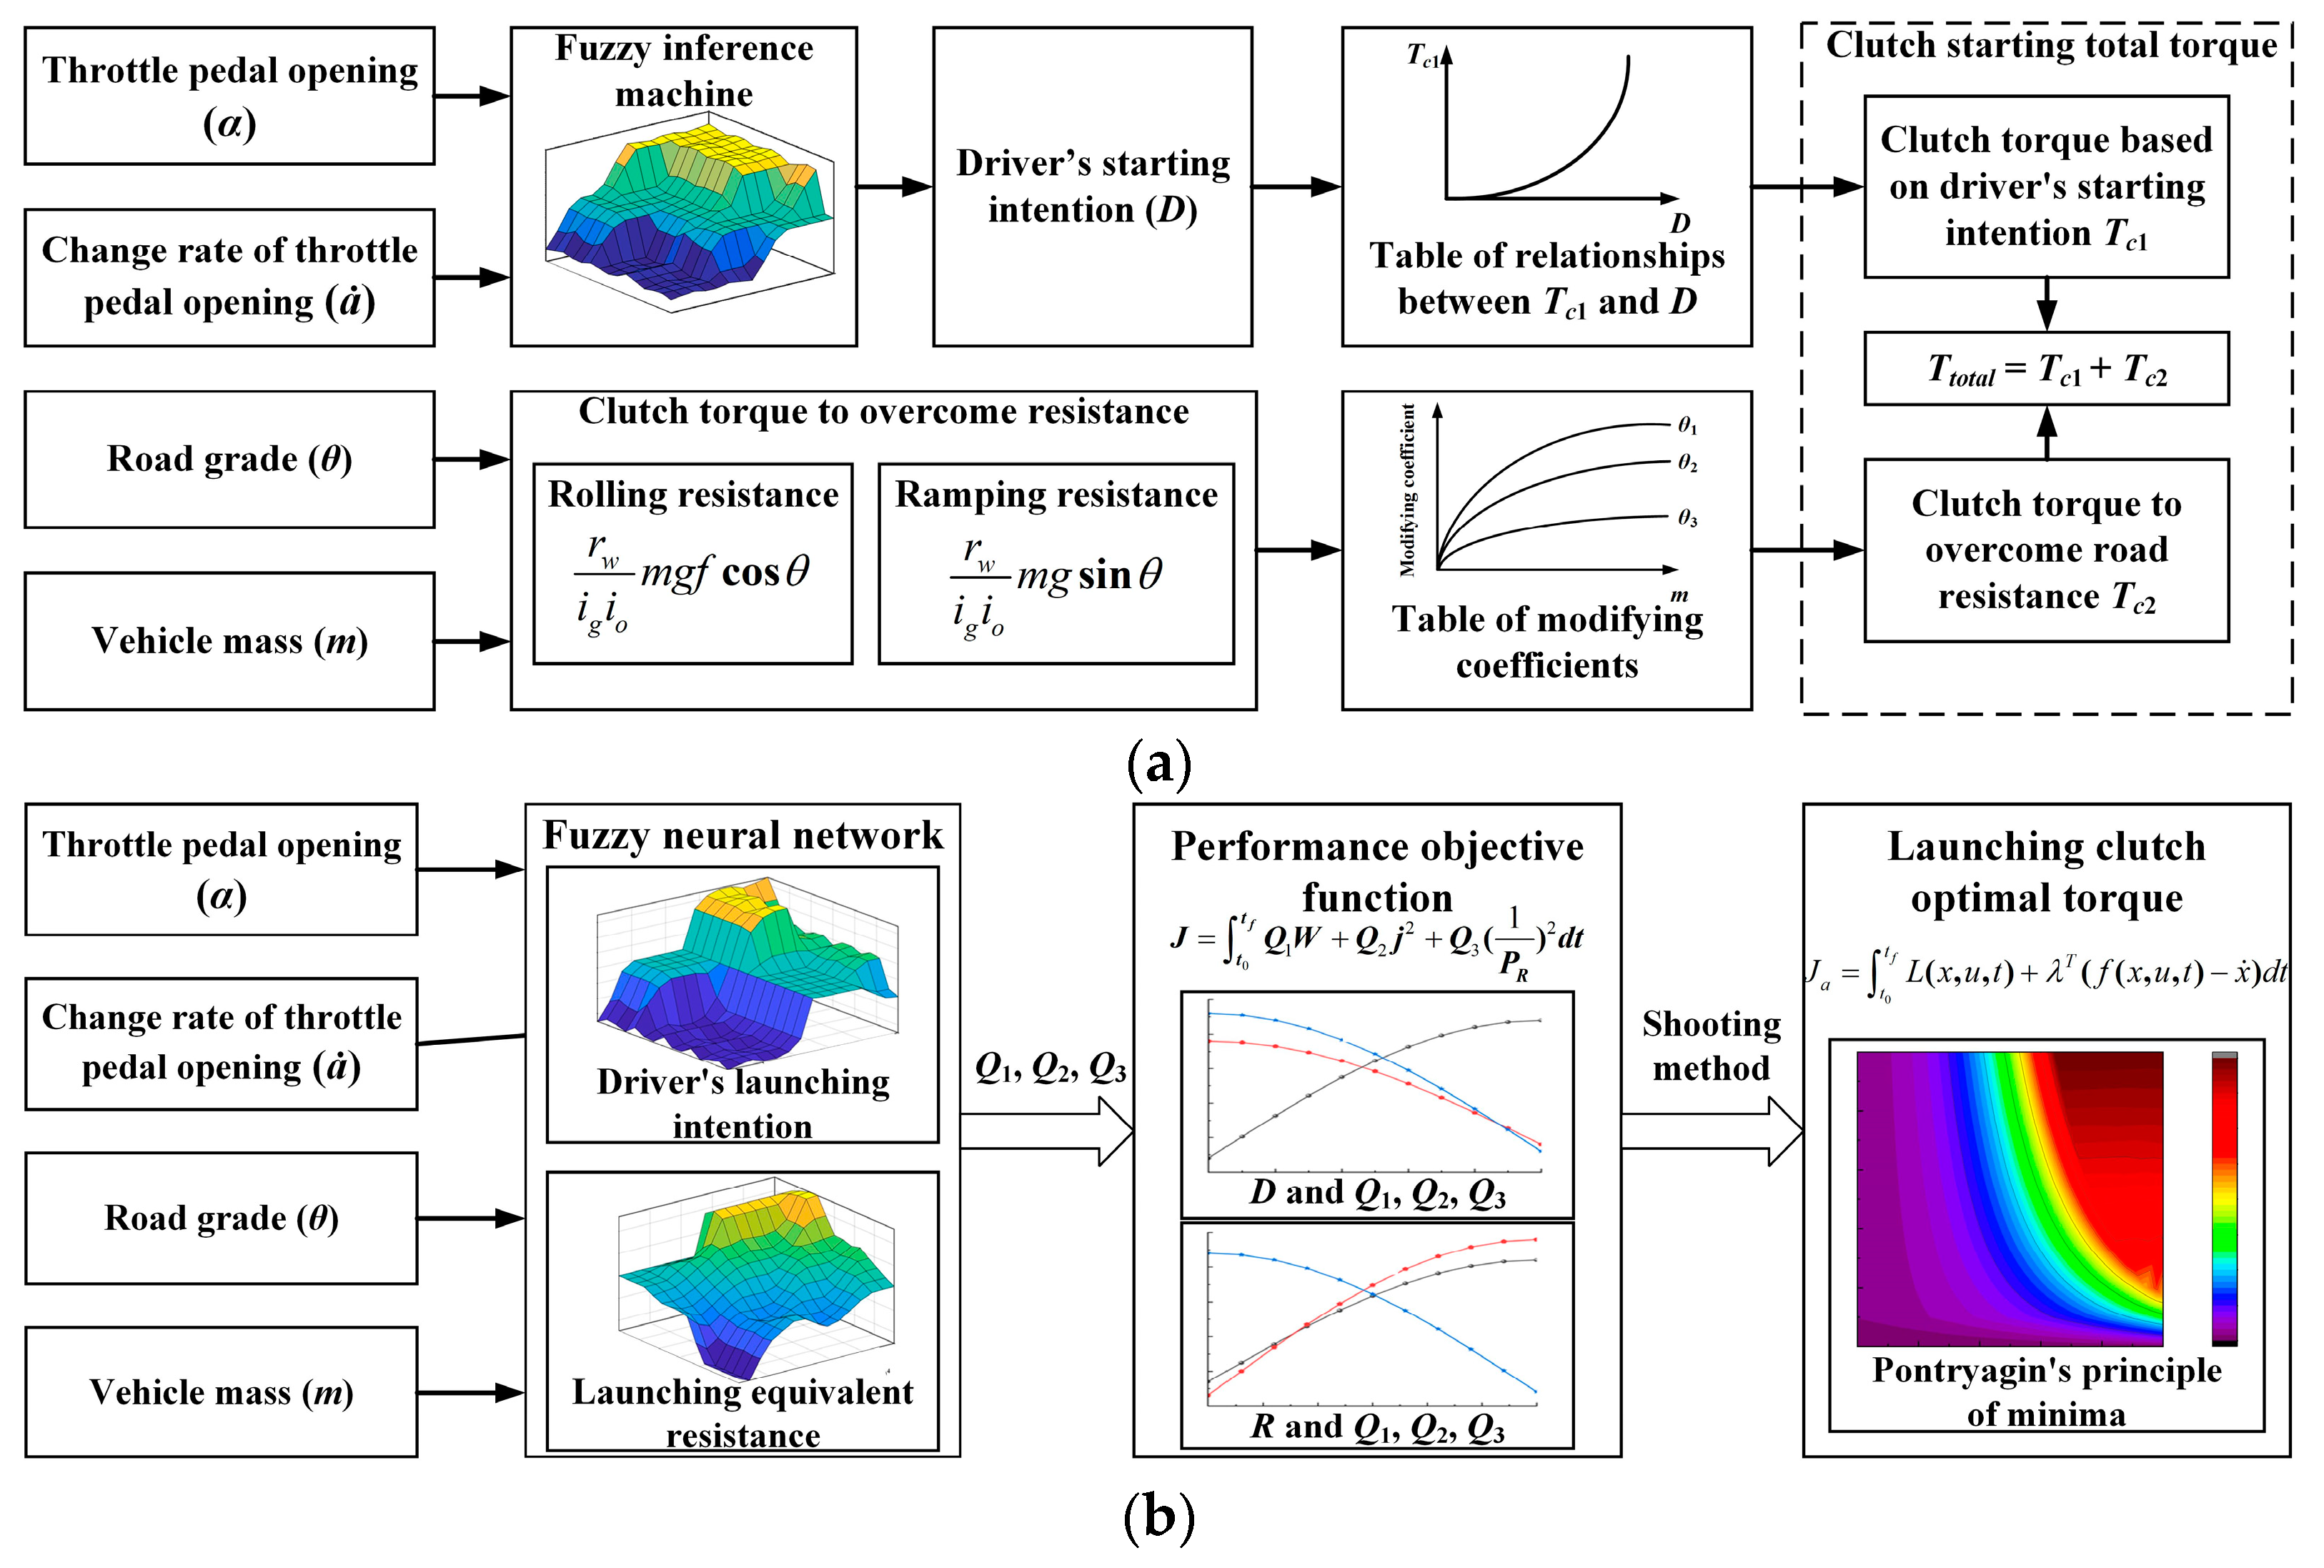
A rule-based launching clutch torque control strategy for a heavy-duty vehicle is shown in Figure 17a. The vehicle launching clutch target torque consists of two parts. The first part is to look up the table of the relationship between D and Tc1 based on the driver’s launching intention D to obtain the clutch target torque Tc1. The table of D versus Tc1 relationships is obtained by calibrating the real vehicle. The second part is to look up the table of correction coefficients based on the rolling resistance and ramp resistance to obtain the target torque Tc2 used to overcome the road resistance. The table of correction coefficients is also obtained by calibrating the real vehicle. With the rule-based clutch torque control, the degree of impact and friction work during the vehicle launching process is large, and launching comfort and smoothness are not effectively improved.
In this paper, a launching state recognition (LSR)-based clutch torque optimal control strategy for heavy-duty vehicle launching is proposed, as shown in Figure 17b. The vehicle load and road grade are converted into launching equivalent resistance. A fuzzy neural network (FNN) is used to recognize the driver’s launching intention and the launching equivalent resistance of the vehicle. The results of vehicle launching state recognition (LSR) are used to adjust the weight factors of the performance function. Jerk, friction work, and launching reserve power are used as performance metrics for the clutch launching torque optimization. Based on the shooting method, the optimal launch torque of the clutch is realized by solving the performance function through the principle of minimization.
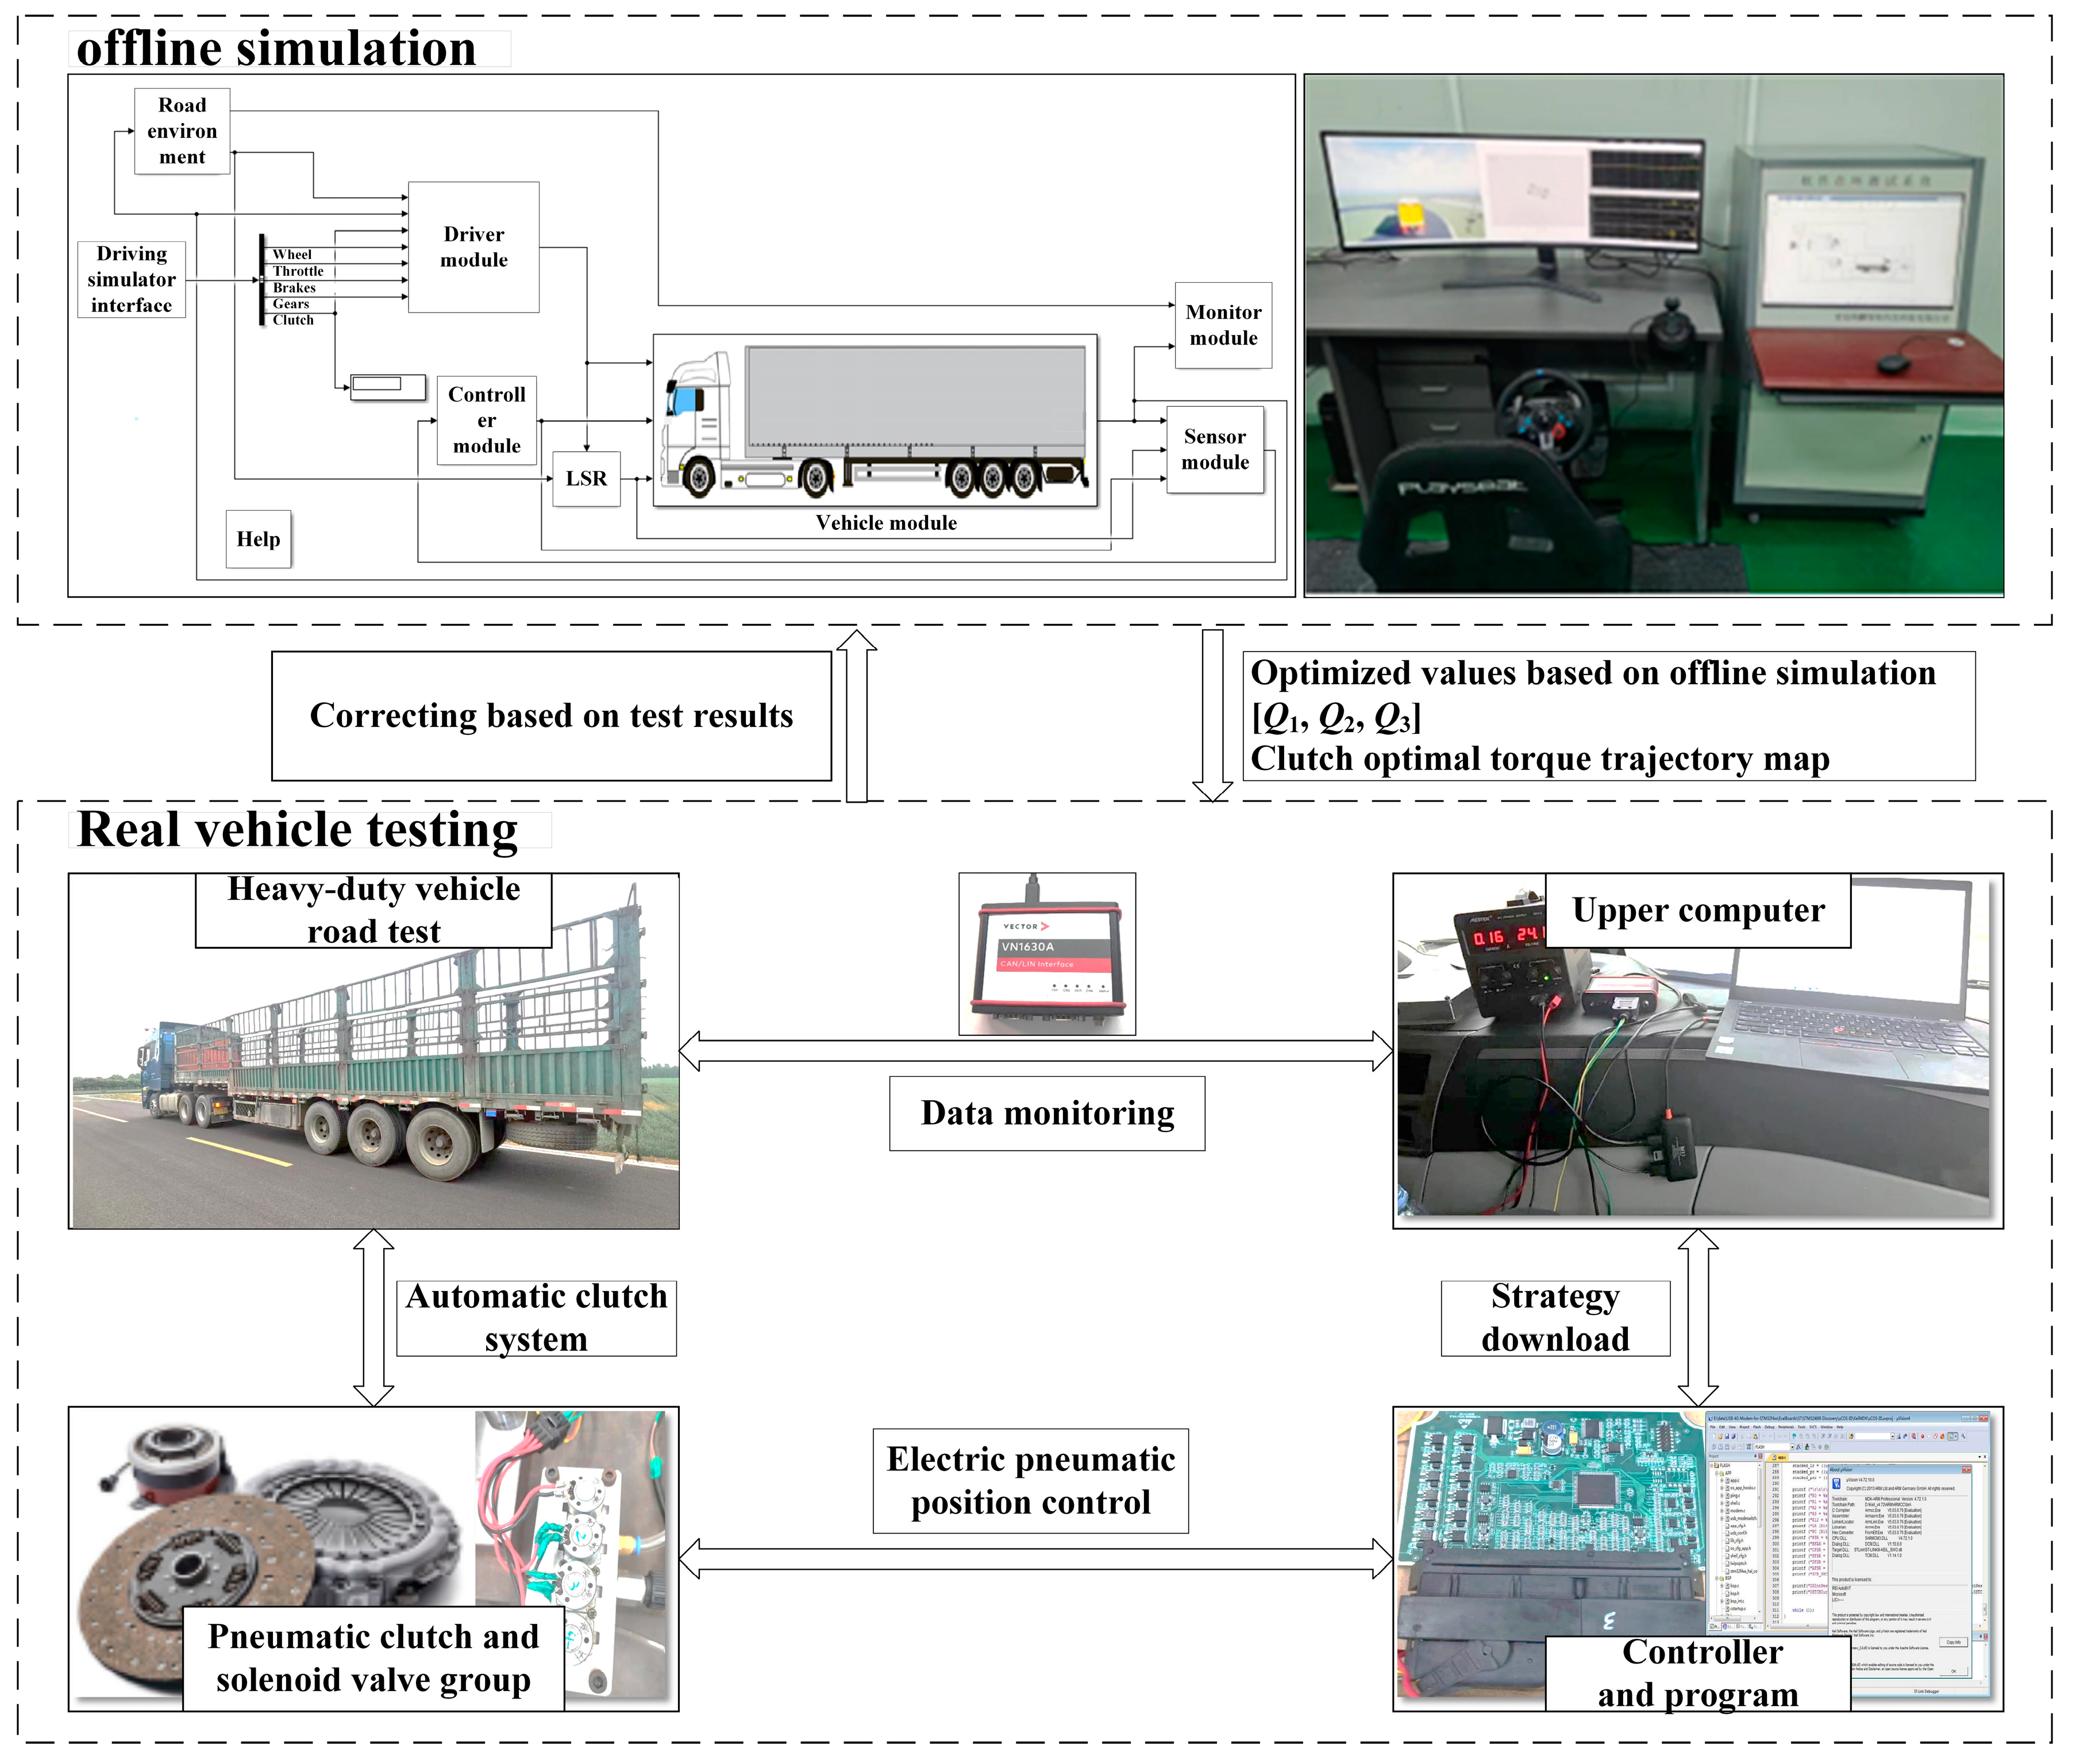
This article adopts a combination of simulation and experimentation to optimize the launching torque of the clutch, as shown in Figure 18. The vehicle system simulation model is built in Matlab/Simulink using a modular modeling approach. A driving simulator operated by the driver provides realistic signal inputs, such as throttle and brake. Firstly, the correspondence between the driver’s launching intention, the equivalent launching resistance, and the weighting coefficients (Q1, Q2, Q3) is searched through simulation offline tests. Secondly, the optimal clutch torque map is solved offline according to the minimization principle and the target shooting method. Finally, the real vehicle test is conducted to correct the optimal clutch torque map. The launching state recognition result (LSR) is defined as follows:
L S R = D D + L R D + D D + L R L R
where D is the driver’s launching intention, and LR is the normalized launching equivalent resistance, L R = R / R m a x .
In this study, a heavy-duty vehicle equipped with an engine, an integrated electronically controlled pneumatic clutch, and an AMT is used as a test platform, as shown in Figure 18. The controller is the carrier of the launching control strategy; it receives signals analyzed from CAN bus and signals collected from sensors, processes and calculates according to the launching control strategy, and then sends out control instructions to the controlled vehicle to achieve the launching process. Based on the CCP communication protocol, CANape can be used to achieve mutual communication between the computer and controller, and the real-time monitoring of vehicle status and signals [45].
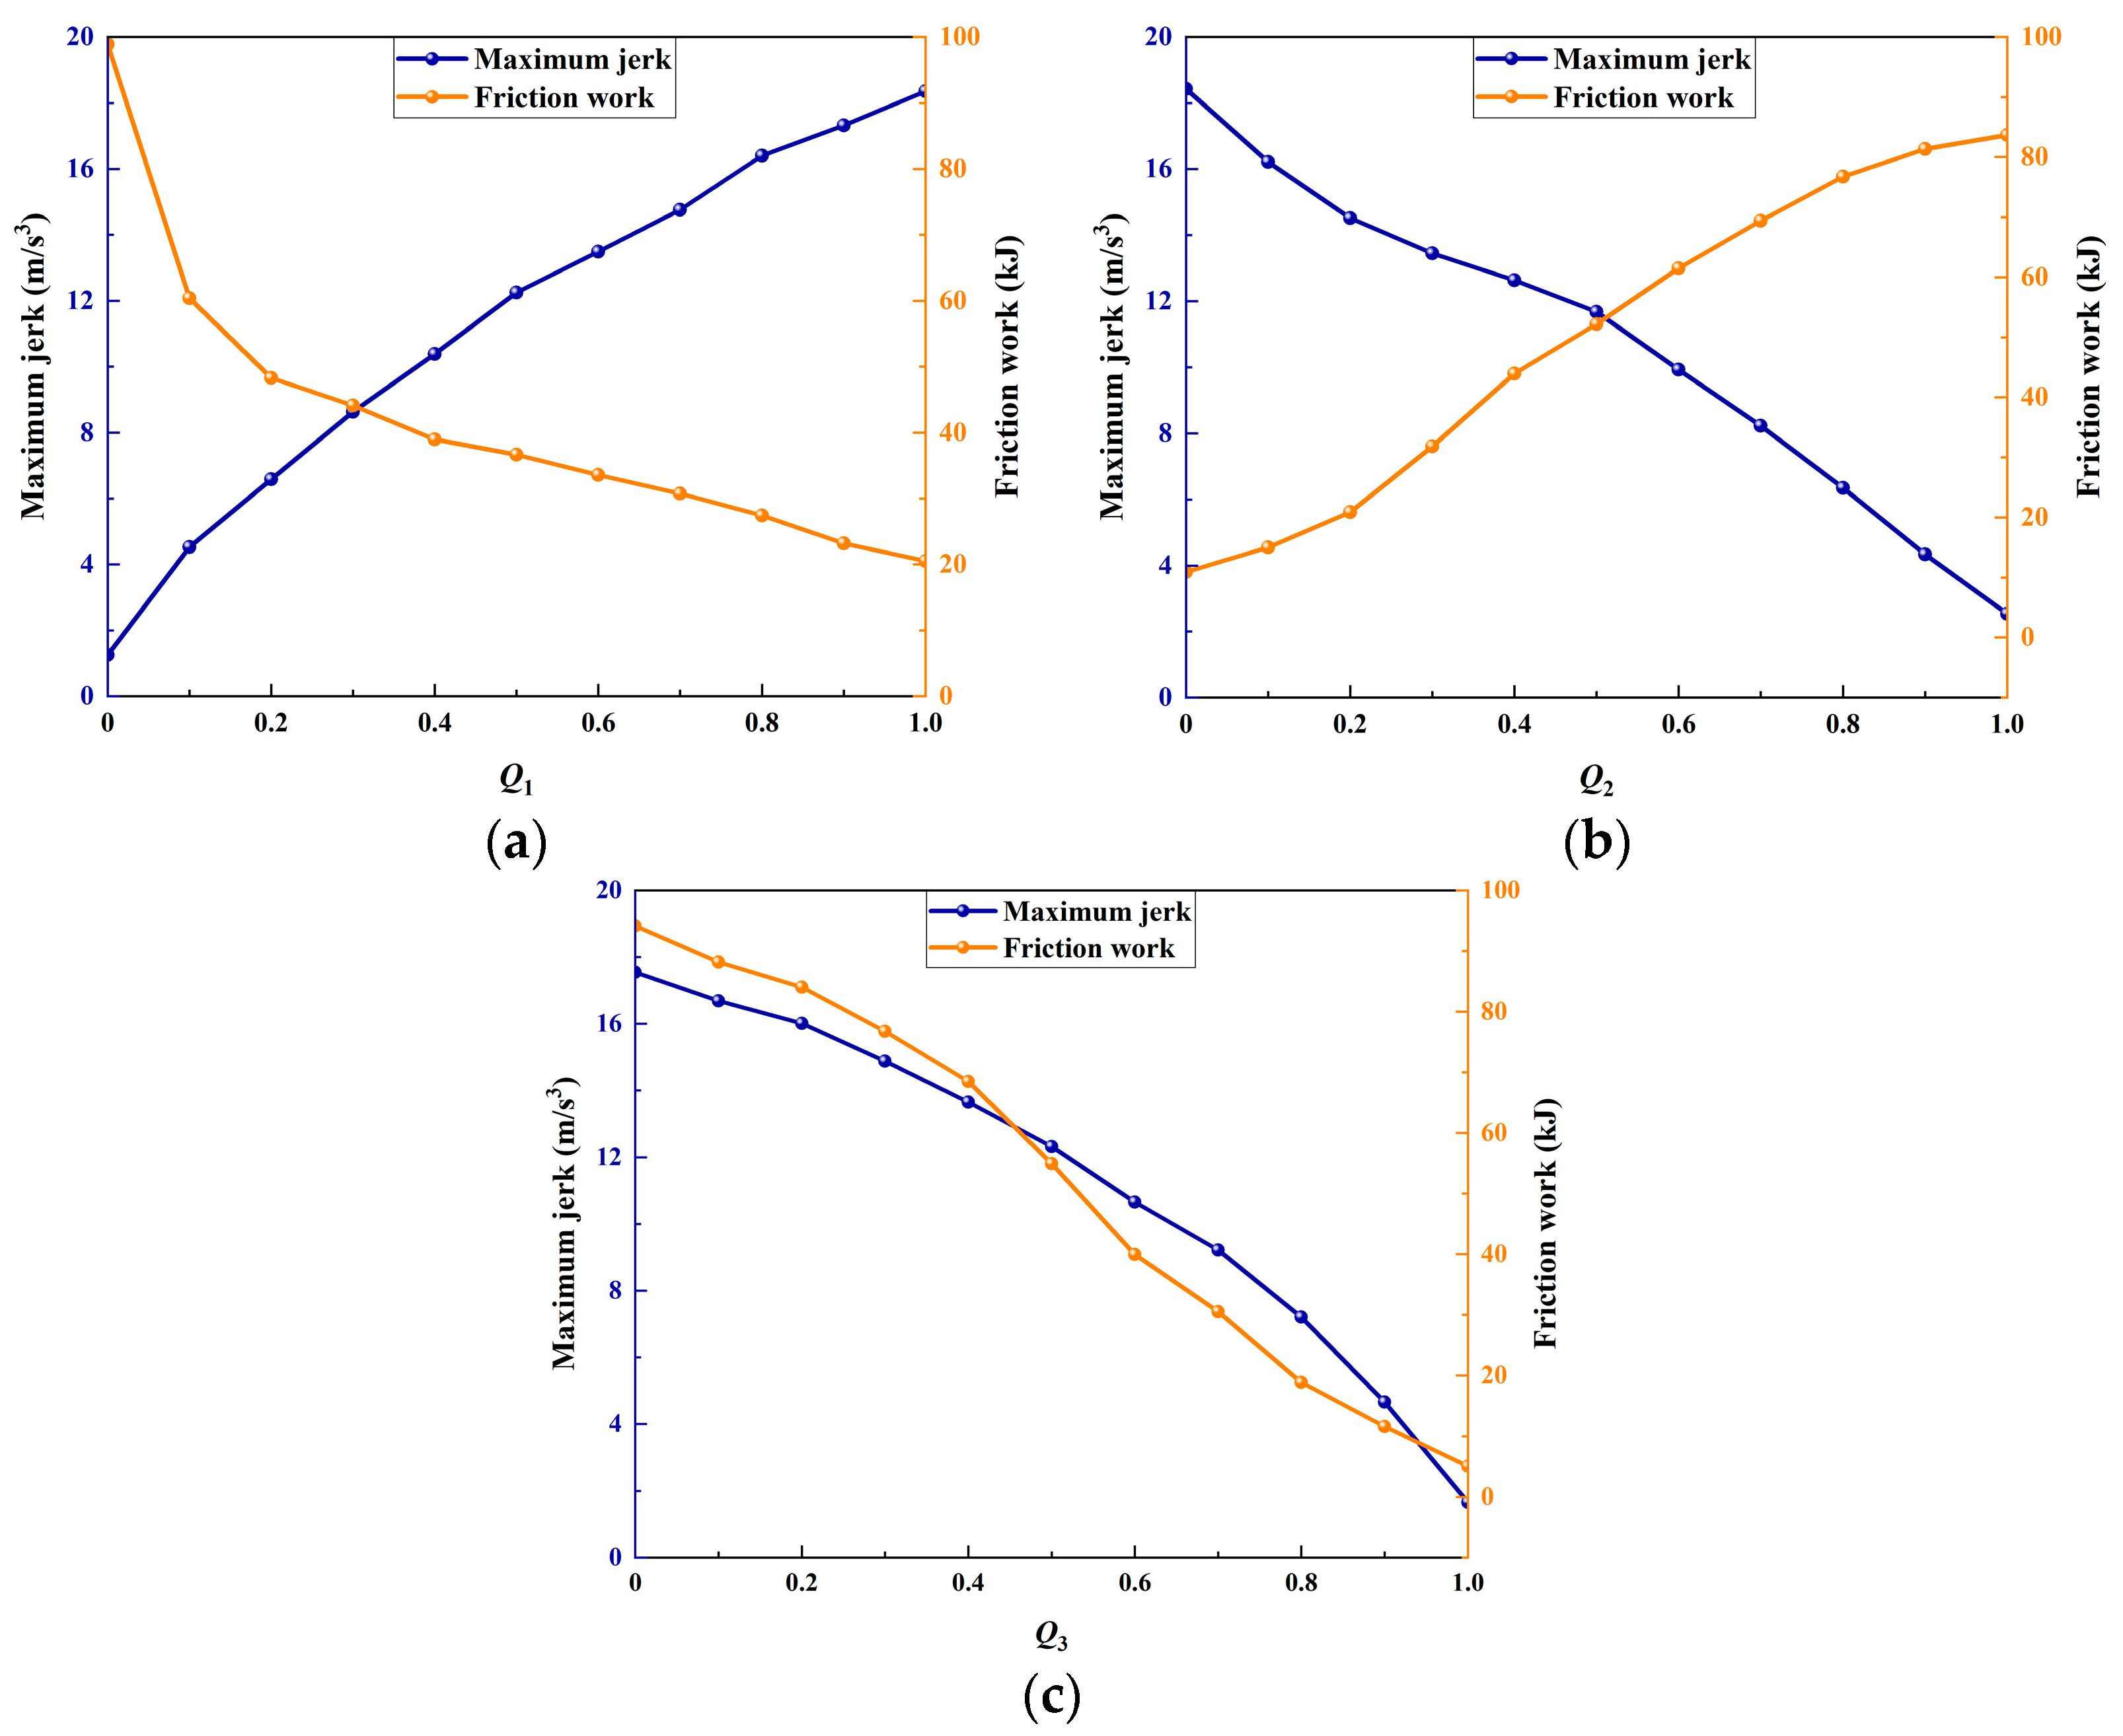
The effect of the weighting coefficients (Q1, Q2, Q3) is simulated in Matlab/Simulink, and the appropriate weighting coefficients are selected for the different driver’s launching intention and the launching equivalent resistance. Different weighting coefficients correspond to different magnitudes of torque, which are transmitted in the clutch slip process, and thus the process of selecting the weighting coefficients achieves the optimal target torque matching under different driver’s launching intentions and the launching equivalent resistance. Among the three evaluation indexes of the clutch launching optimization process, the change of the weighting coefficients Q1, Q2, Q3 affects the friction work and jerk of the launching process. In order to select appropriate weighting coefficients Q1, Q2, Q3 for different driver’s launching intentions and equivalent launching resistance, a great number of Q1, Q2, Q3 scenarios are simulated and statistically analyzed in order to identify the maximum jerk and friction work under different Q1, Q2, Q3 scenarios, as shown in Figure 19.
In the meantime, the correspondence between the driver’s launching intention, the equivalent launching resistance, and Q1, Q2, Q3 is illustrated in Table 5. If the driver wishes to launch the vehicle at a lower speed, it is necessary to increase the weight value of Q2 adequately to accomplish jerk suppression. Conversely, if the driver intends to launch the vehicle at a faster speed, they should increase the weight value of Q1 sufficiently to suppress the friction work. If the equivalent moment of resistance is too large for a vehicle launching under a heavy load or on a ramp, the weight value Q3 needs to be reduced so that there is enough reserve power to ensure that the vehicle launches with sufficient power.
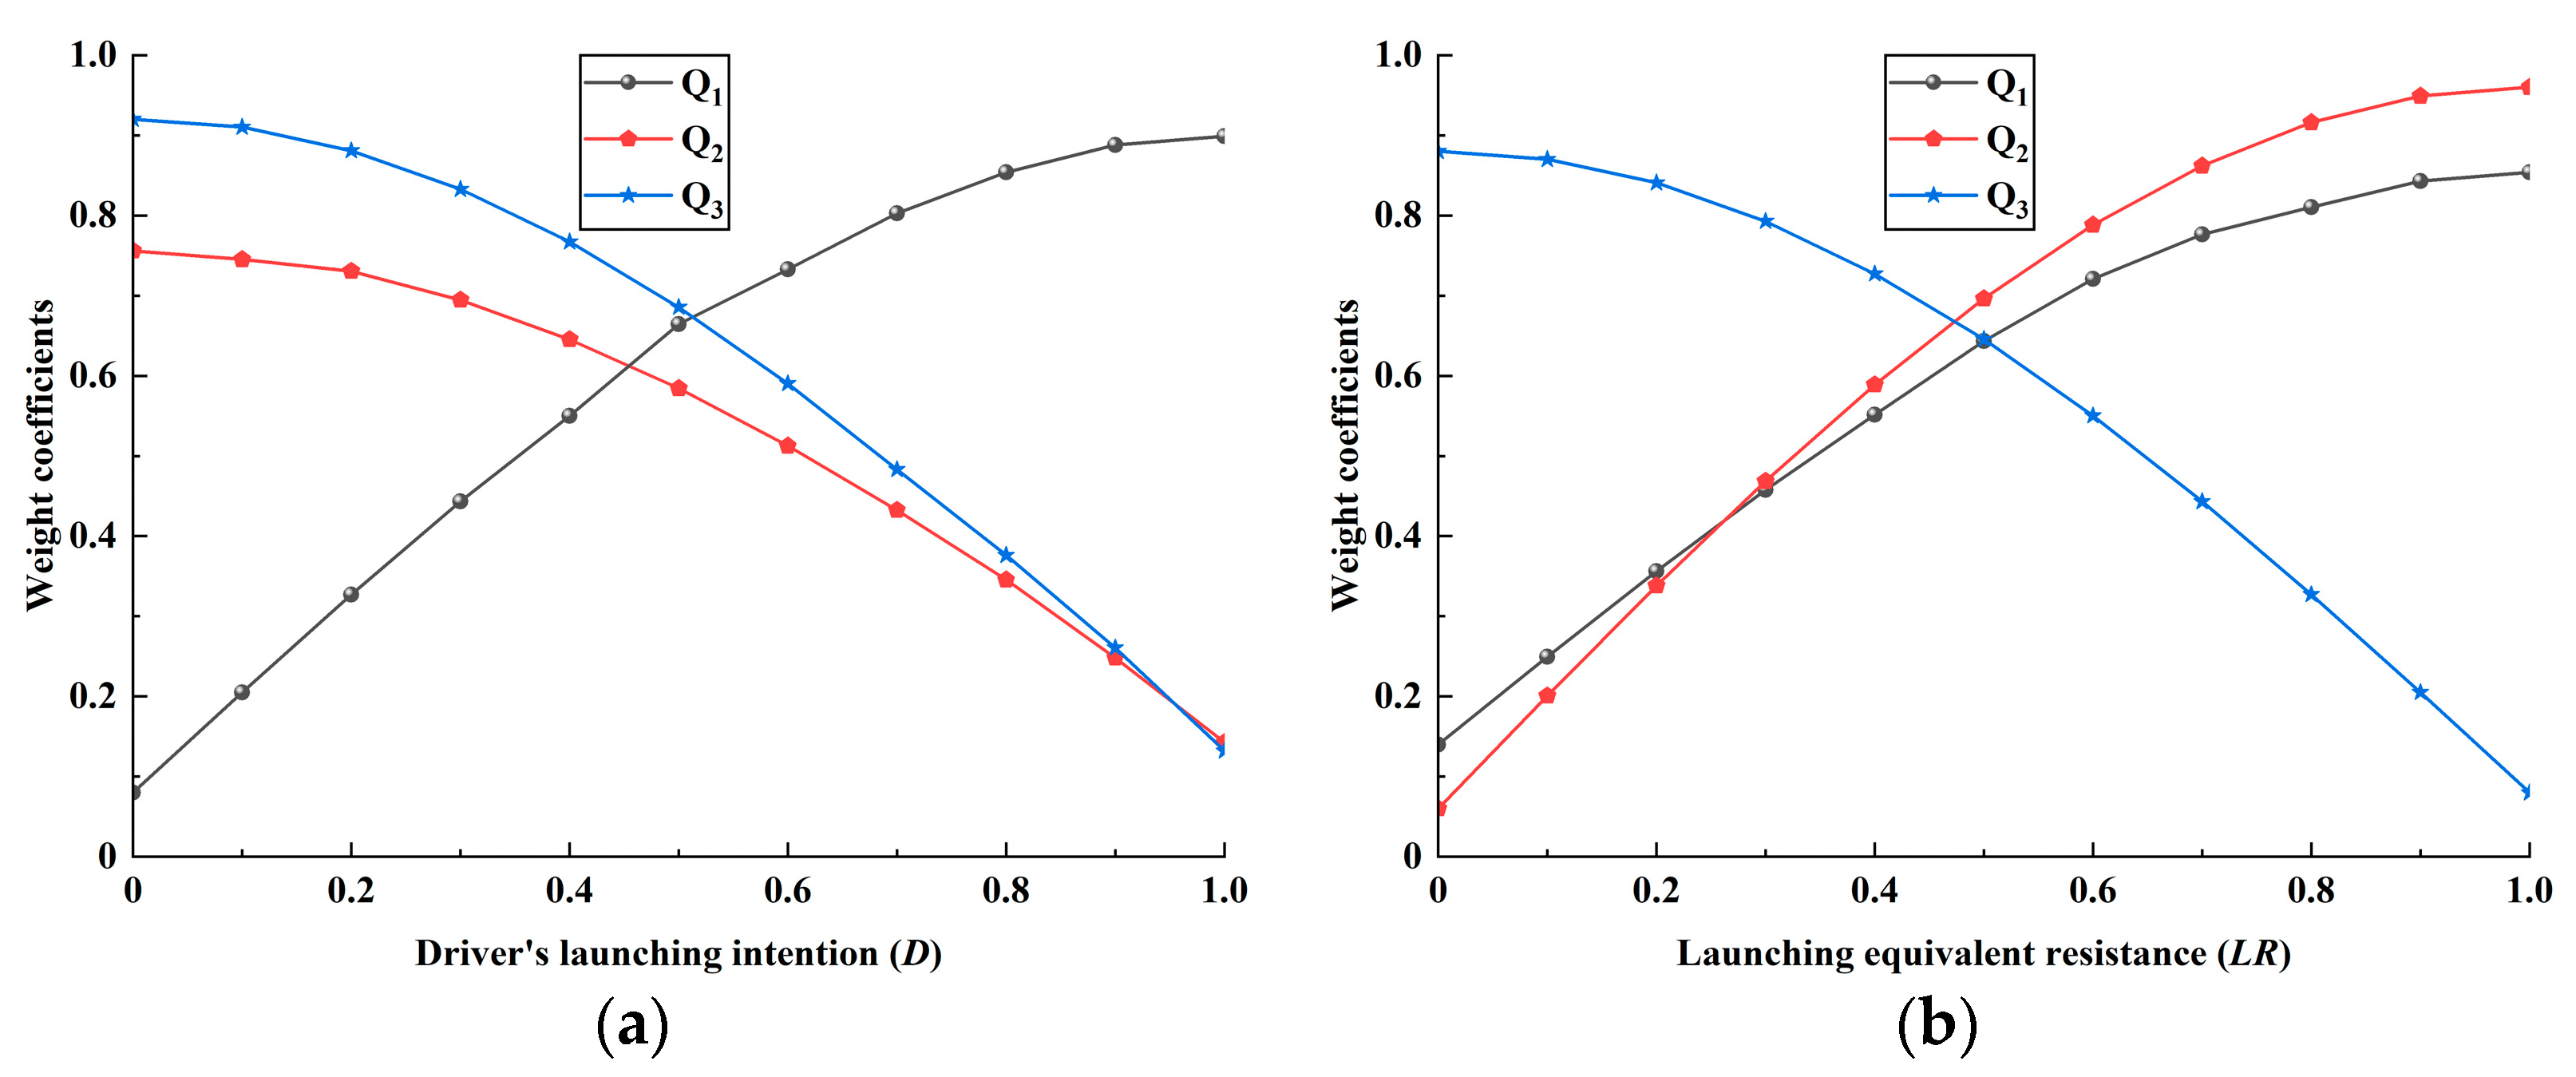
As the driver’s launching intention changes from a slow launch to a fast launch, the weighting factor Q1 needs to increase and the weighting factors Q2 and Q3 need to decrease for suppressing the friction work, as shown in Figure 20a. As the vehicle launching equivalent moment of resistance increases, weighting factors Q1 and Q2 need to increase and weighting factor Q3 needs to decrease for both friction work and shock to be suppressed, as shown in Figure 20b.
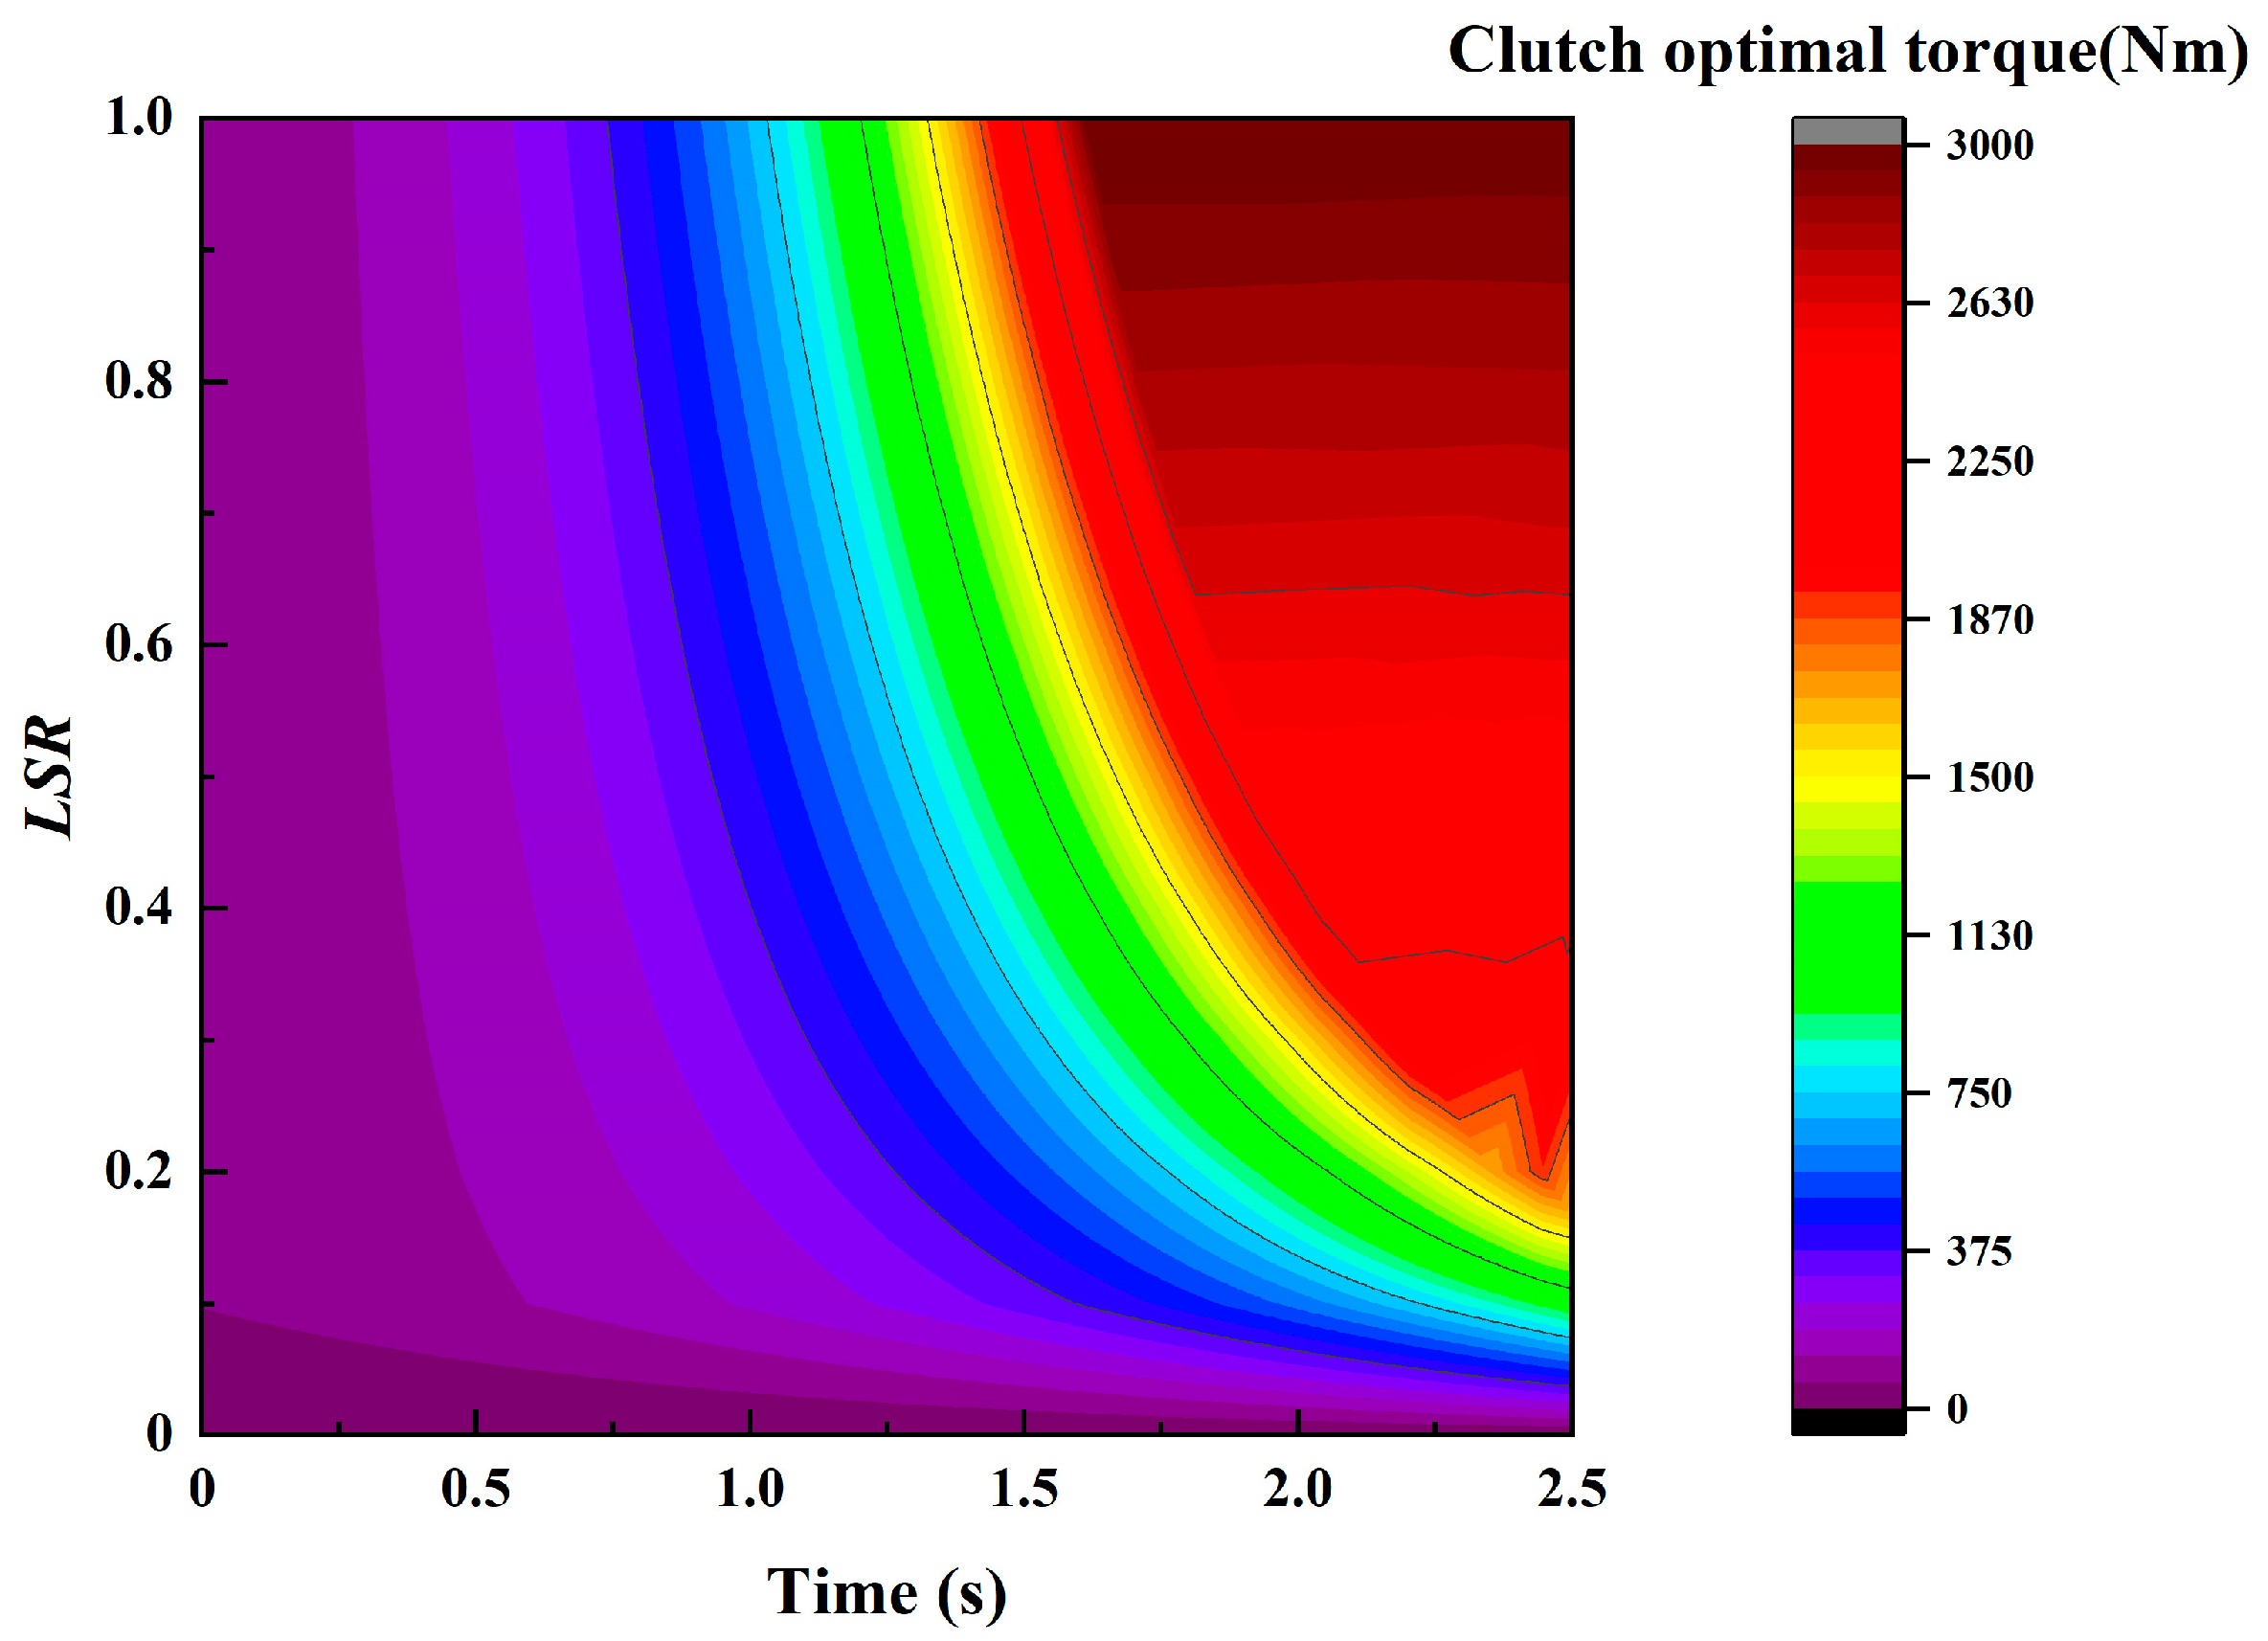
We can identify the weighting coefficients (Q1, Q2, Q3) of the performance metrics (friction work, jerk, and launching reserve power) based on the driver’s launching intentions and launching equivalent resistance according to Figure 20. Then, the optimal clutch torque map (Figure 21) is obtained by solving the performance function based on the minimum value principle. In the vehicle test, the driver’s intention and equivalent launching resistance are first recognized by the FNN, and then the clutch torque map is searched based on the FNN recognition results to obtain the clutch torque.
From Figure 21, we can see that as the value of LSR is larger, the clutch needs to transmit a larger torque in a shorter time. When the value of LSR is below 0.2, in 0 s~2.5 s, the clutch torque is below 1000 Nm. When the value of LSR is above 0.8, in 0 s~1.0 s, the clutch torque is below 1000 Nm, and in 1.0~1.5 s, the clutch torque rises rapidly to 2000 Nm.

5.2. Analysis and Discussion of Results

In this paper, three cases, shown in Table 6, are selected to be analyzed and tested, and the corresponding weighting coefficients are obtained through a large number of parameter configurations and simulation comparisons. The weight coefficient arrays [Q1, Q2, Q3] for cases 1-2, 2-2, and 3-2 are [0.20, 0.25, 0.80], [0.50, 0.46, 0.55], and [0.78, 0.85, 0.30], respectively.
To confirm the feasibility of the clutch launching torque optimization control strategy proposed in this paper, we have chosen three illustrative case scenarios as presented in Table 6. When a heavy-duty vehicle launching test is performed on a flat road with no load, the driver gradually depresses the gas pedal and maintains a small throttle position. Case 1-1 uses the unoptimized control strategy and case 1-2 uses the optimized control strategy proposed in this paper.
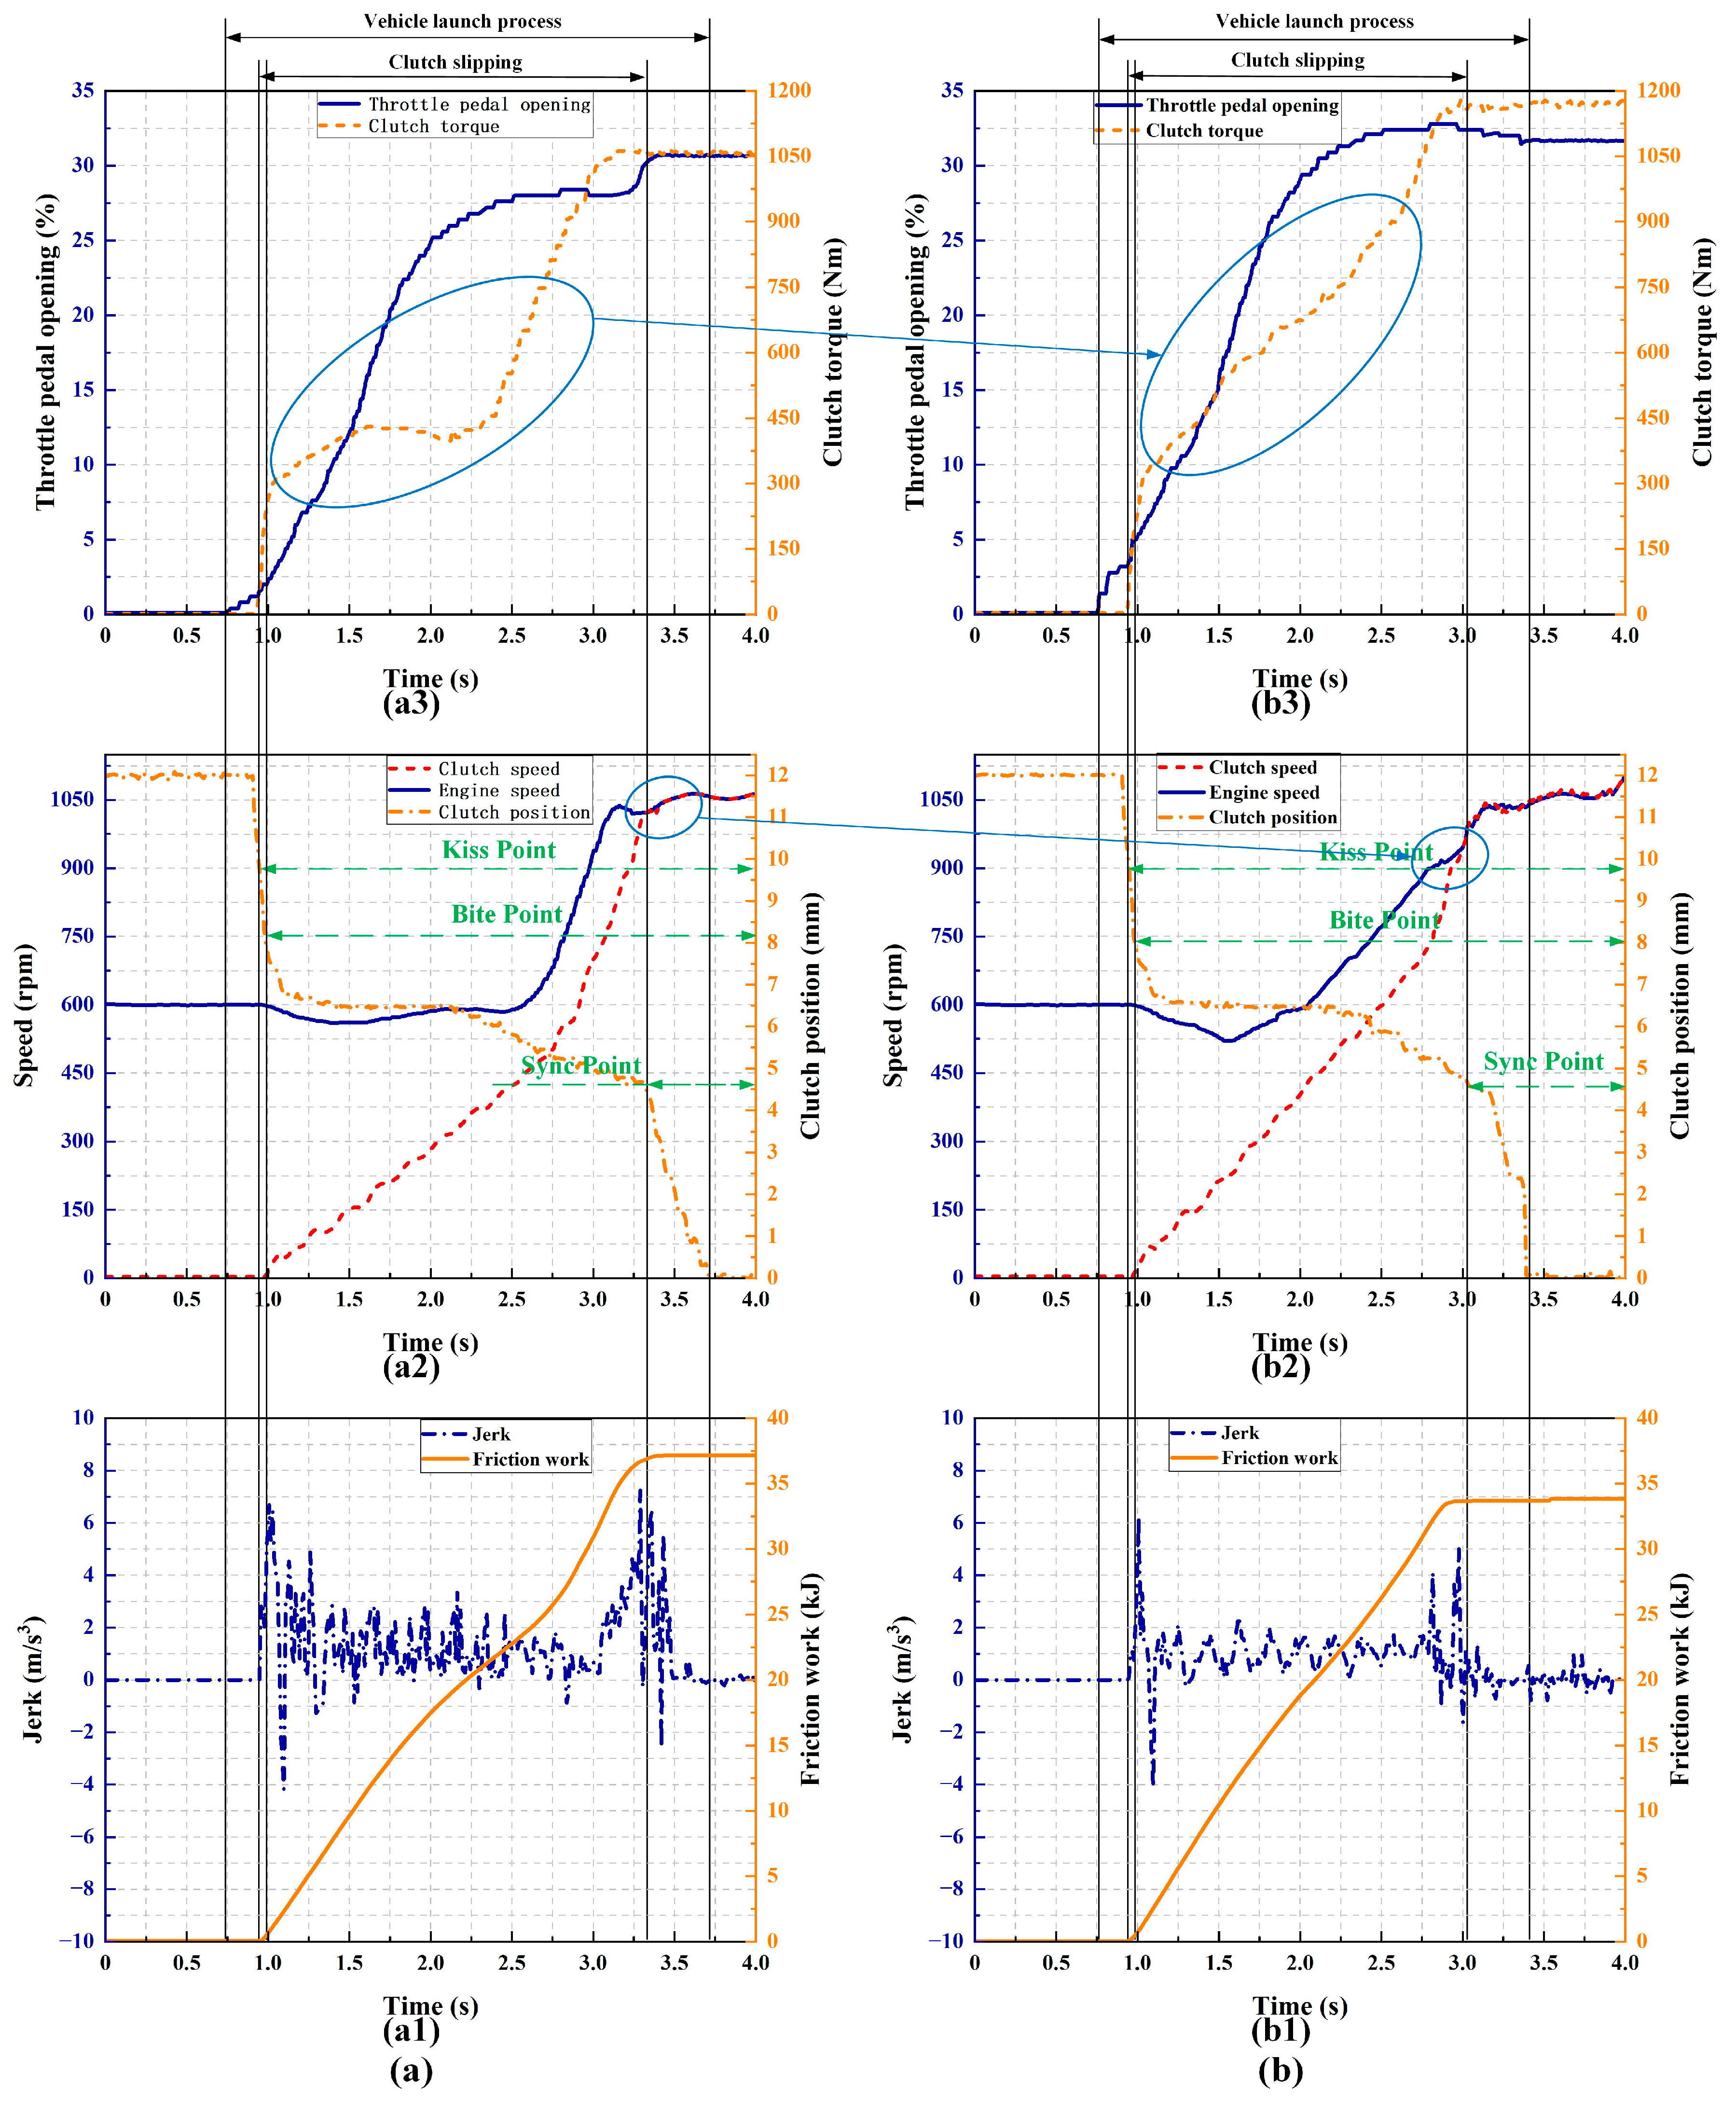
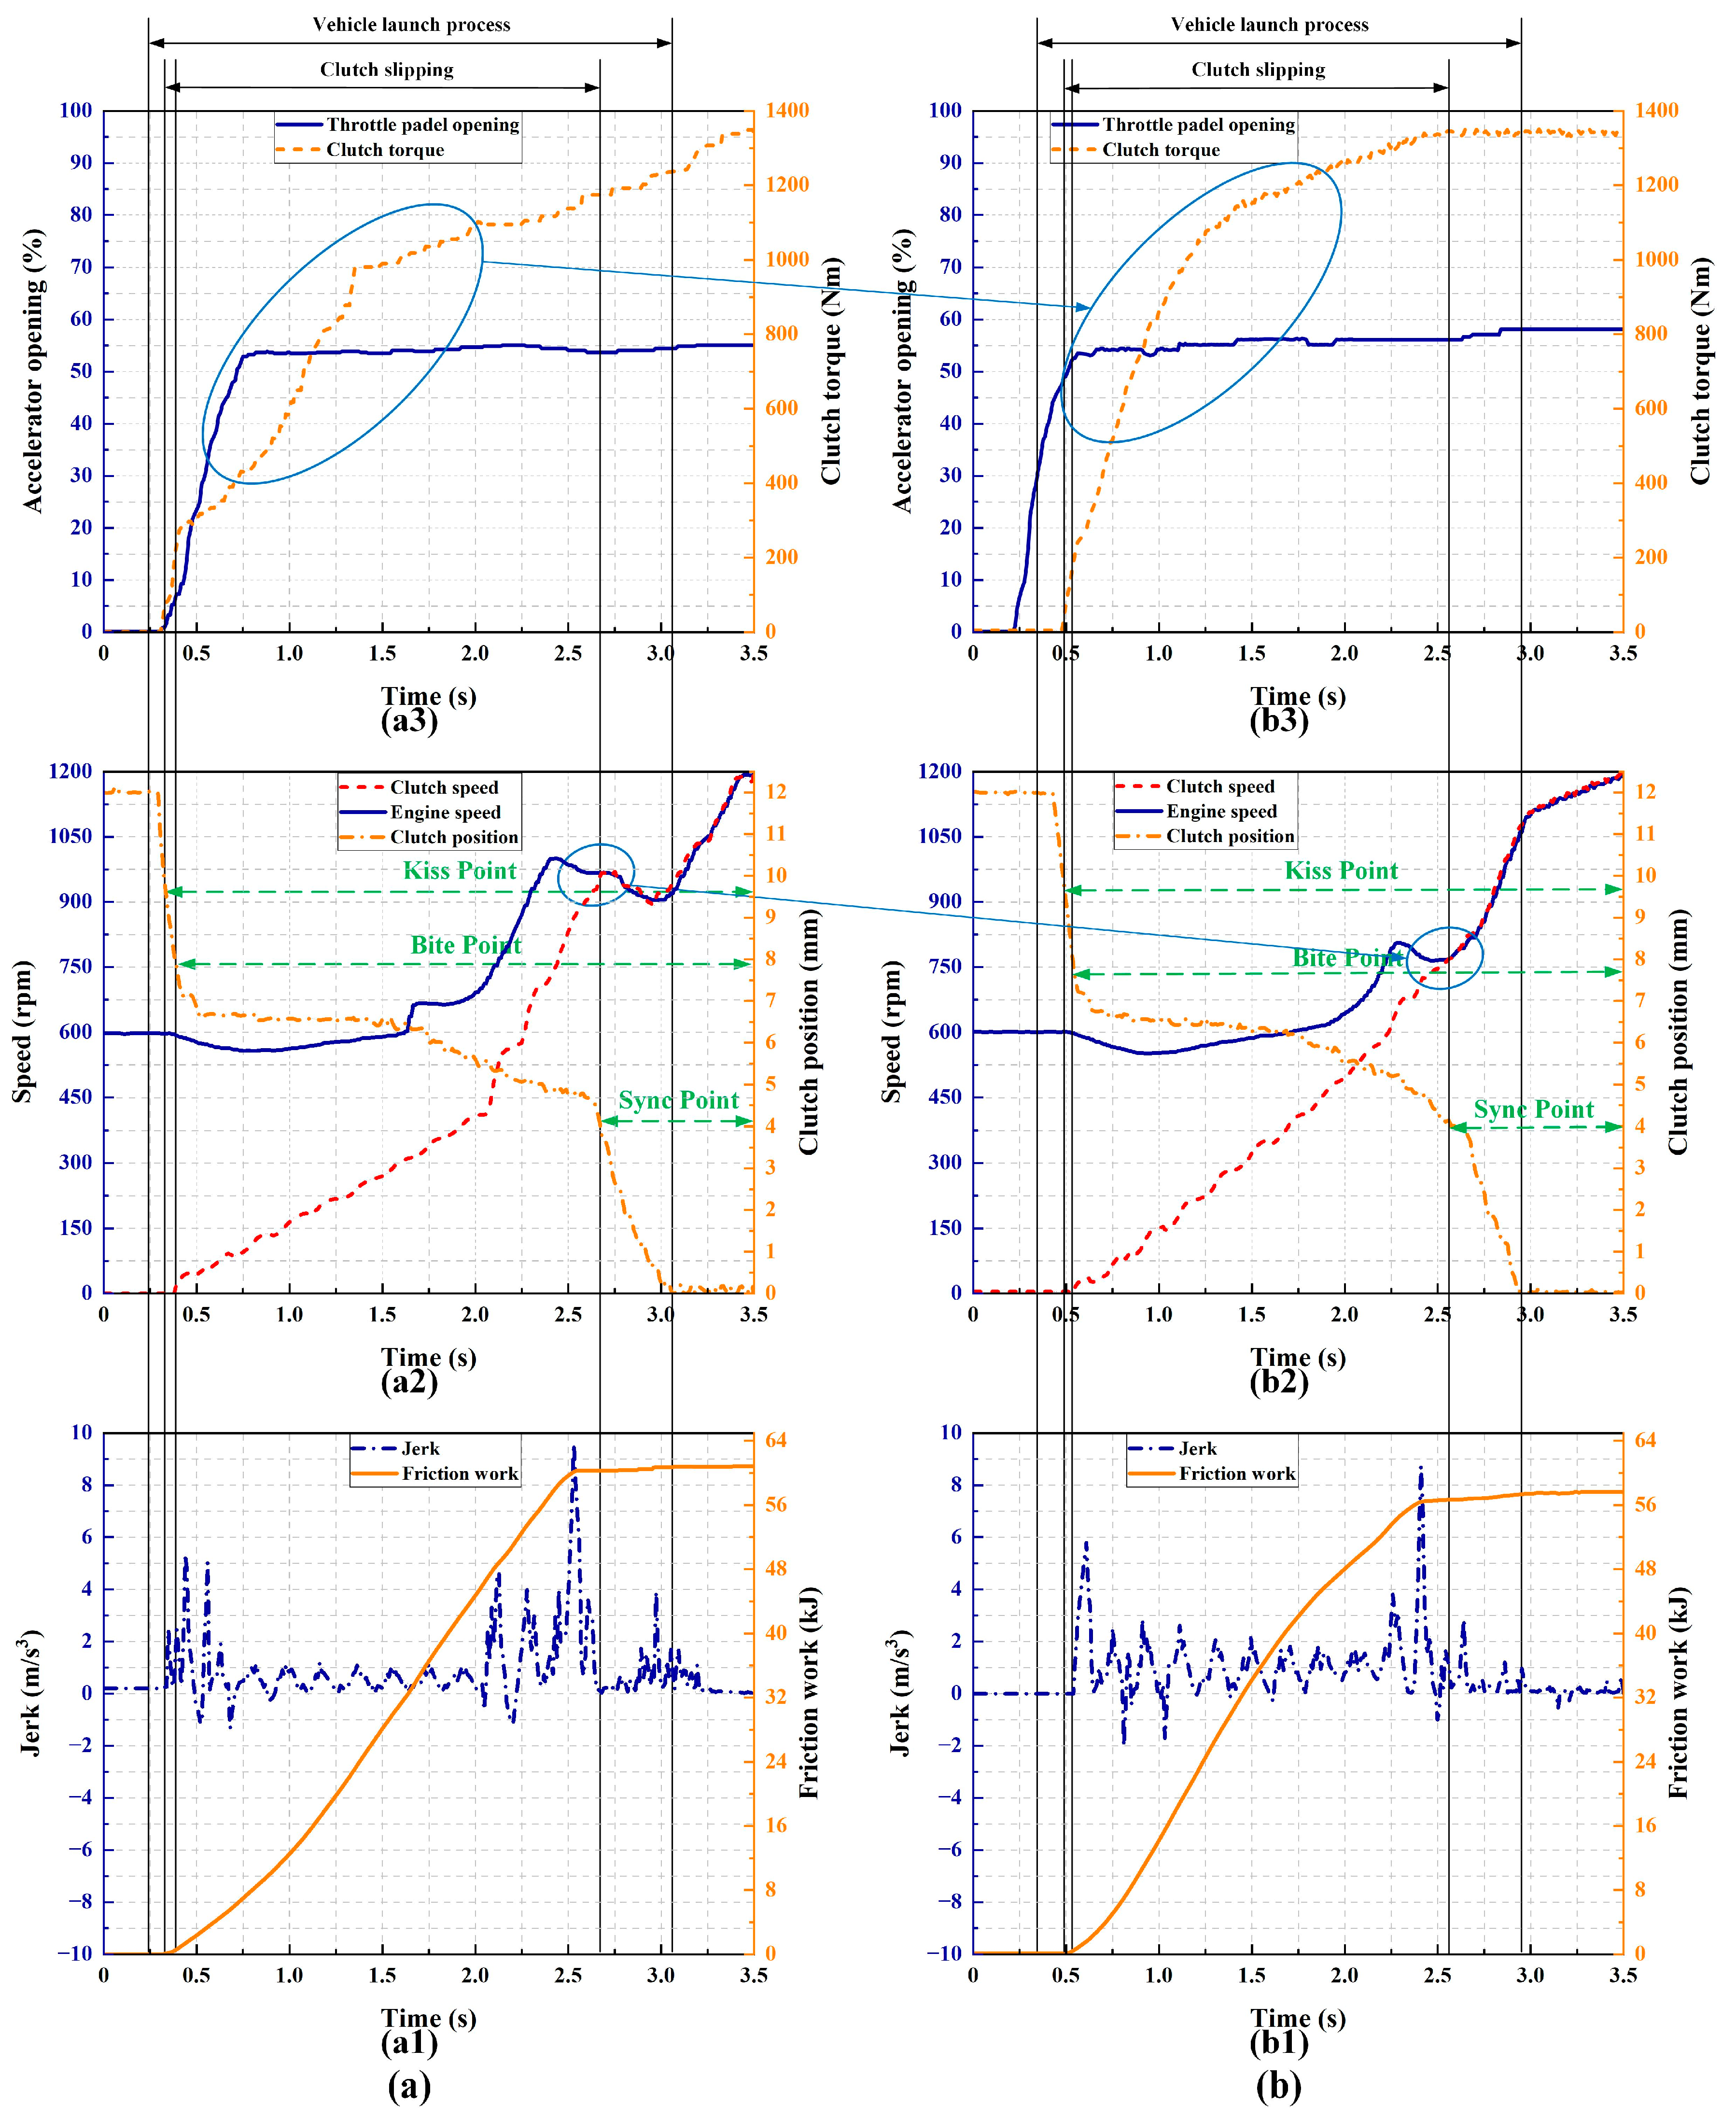
In Figure 22(a3), the driver slowly pushes the throttle pedal from 0% to 30% from 0.75 s to 3.25 s. During time 0.94 s~1.02 s, the clutch torque rises from 0 Nm to 350 Nm too quickly, resulting in a jerk at the Bite Point of 6.685 m/s3 in Figure 22(a1). At 0.94 s, the clutch engagement position is at 9.779 mm (Kiss Point) and the clutch starts to transmit torque. At 1.02 s, the clutch engagement position is at 8.211 mm (Bite Point) and the vehicle starts to gain speed. In Figure 22(a3), the throttle pedal opening continues to increase from 1.02 s to 3.50 s, while the clutch torque remains constant at 400 Nm from 1.02 s to 2.25 s, and the clutch torque increases rapidly from 2.25 s to 3.25 s. The clutch torque does not align with the driver’s launching intention demand, resulting in a rapid increase in engine speed (Figure 22(a2)) between 2.50 s and 3.50 s. This is accompanied by a delayed increase in clutch speed, which prevents the engine speed from being synchronized and results in a delay in the clutch Sync Point position. In Figure 22(a2), the clutch speed and engine speed are synchronized at 3.31 s, and the clutch engagement position is at 4.677 mm (Sync Point). The shock at the point of synchronization is 7.251 m/s3, and the friction work is 37.146 kJ, in Figure 22(a1).
The optimized clutch torque is illustrated in Figure 22(b3). It can be observed that the clutch torque increases gradually with the increase in throttle pedal opening, from 0.91 s to 3.25 s. Furthermore, the clutch torque exhibits a gentle rise without any significant fluctuations. At 0.91 s, the clutch engagement position is at 9.843 mm (Kiss Point) and the clutch starts to transmit torque. At 0.98 s, the clutch engagement position is at 8.106 mm (Bite Point) and the vehicle starts to gain speed. The jerk at the Bite Point is 6.212 m/s3. The clutch speed increases slowly to synchronize with the engine speed from 0.98 s to 3.04 s in Figure 22(b2). The clutch speed and engine speed are synchronized at 3.04 s, and the clutch engagement position is at 4.572 mm (Sync Point). The jerk at the Sync Point is 5.003 m/s3, and the friction work is 37.146 kJ. The jerk in Figure 22(b1) at the Bite Point and Sync Point is significantly smaller than that in Figure 22(a1). At the same time, with the optimized control strategy, the clutch slipping time is reduced from 2.437 s to 2.002 s.
When a heavy-duty vehicle launches at half load and on an 8% slope, the driver presses the throttle at a medium speed and keeps it open. Case 2-1 uses the unoptimized control strategy and case 2-2 uses the optimized control strategy proposed in this paper.
As shown in Figure 23(a3), at 0.25 s~0.75 s, the driver wants to launch at medium speed, and presses the throttle pedal from 0% to 55% quickly. In 0.32 s~0.41 s, the clutch torque rises rapidly from 0 Nm to 300 Nm. In 0.41 s~1.37 s, the clutch torque rises from 300 Nm to 980 Nm, and the clutch torque fluctuates violently during this process. The clutch torque fails to follow the driver’s launching intention well due to the launching equivalent resistance moment caused by the vehicle load. At 0.33 s, the clutch engagement position is at 9.833 mm (Kiss Point) and the clutch starts to transmit torque. At 0.40 s, the clutch engagement position is at 7.807 mm (Bite Point) and the vehicle starts to gain speed. The jerk at the Bite Point is 5.372 m/s3. In Figure 23(a2), the engine speed is basically stable from 0.25 s to 2.00 s, and the engine speed rapidly increases from 675 rpm to 1000 rpm from 2.00 s to 2.41 s, while the clutch speed fails to synchronize with the engine speed in time. In 2.41 s~2.75 s, as the clutch position deepens, the engine speed decreases, and the clutch speed is synchronized with the engine speed. In Figure 23(a2), the clutch speed and engine speed are synchronized at 2.73 s, and the clutch engagement position is at 4.086 mm (Sync Point). At the point of speed synchronization in Figure 23(a1), the jerk reaches 9.588 m/s3, and the friction work is 60.853 kJ.
The optimized clutch torque is shown in Figure 23(b3). In 0.50 s~2.50 s, the clutch torque increases rapidly with the increase in the throttle pedal opening. At 0.50 s~1.15 s, the clutch torque increases from 0 Nm to 100 Nm, and the clutch torque grows smoothly. The clutch torque variation meets the driver’s starting intentions. At 0.49 s, the clutch engagement position is at 9.779 mm (Kiss Point) and the clutch starts to transmit torque. At 0.55 s, the clutch engagement position is at 7.539 mm (Bite Point) and the vehicle starts to gain speed. The jerk at the Bite Point is 5.788 m/s3. In Figure 23(b2), from 0.50 s to 2.65 s, the clutch speed slowly increases to synchronize with the engine speed. During the process of synchronizing, the engine speed increases gradually and does not exceed a maximum of 900 rpm. In Figure 23(b2), the clutch speed and engine speed are synchronized at 2.65 s, and the clutch engagement position is at 3.891 mm (Sync Point). Clutch slipping, the amount of friction work, and the level of jerk are significantly reduced in Figure 23(b1). At the point of speed synchronization, the jerk is 8.726 m/s3, and the friction work is 57.644 kJ.
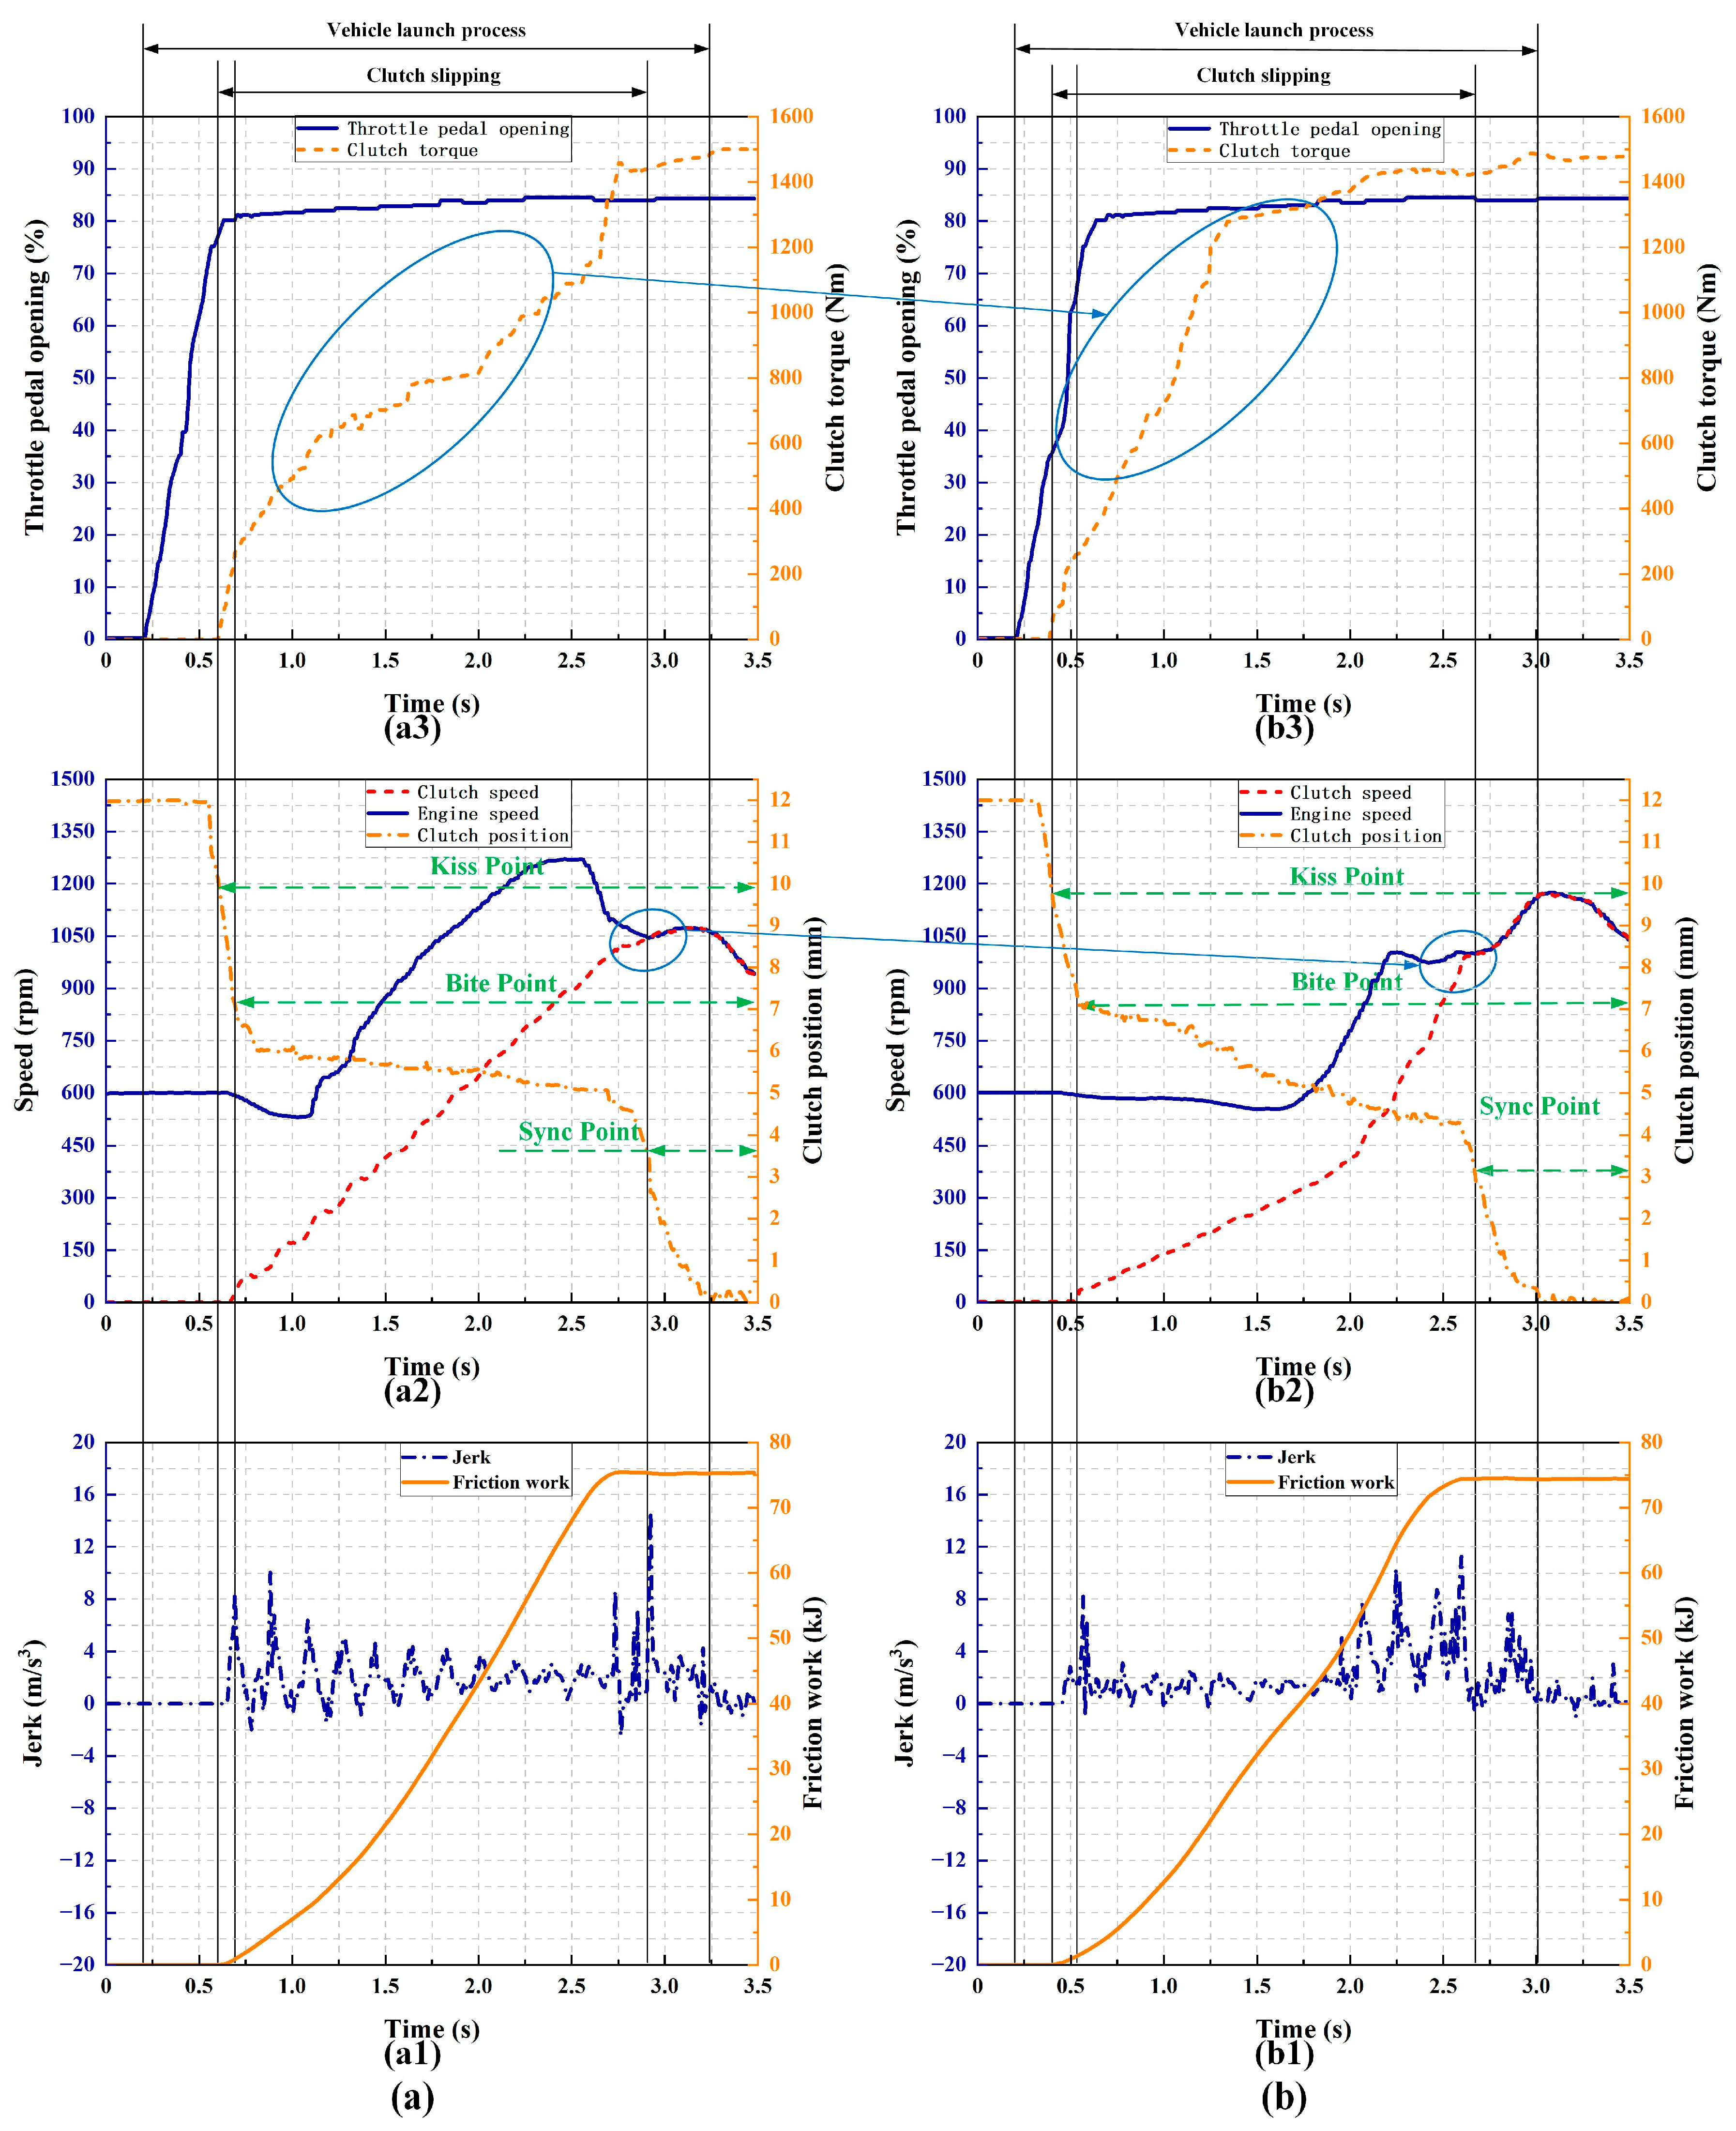
When a heavy-duty vehicle launches at a full load and on an 20% slope, the driver presses the throttle at a quick speed and keeps it open. Case 3-1 uses the unoptimized control strategy and case 3-2 uses the optimized control strategy proposed in this paper.
As shown in Figure 24(a3) at 0.24 s~0.65 s, the driver pushes the throttle pedal quickly from 0% to 80% and keeps the throttle at 80% open from 0.65 s to 3.5 s. The clutch torque rises slowly from 0 Nm to 1400 Nm from 0.62 s to 2.75 s. At 0.62 s, the clutch engagement position is at 9.786 mm (Kiss Point) and the clutch starts to transmit torque. At 0.68 s, the clutch engagement position is at 7.245 mm (Bite Point) and the vehicle starts to gain speed. The jerk at the Bite Point is 8.539 m/s3. In Figure 24(a2), the engine speed rises quickly from 520 rpm to 1275 rpm from 1.10 s to 2.54 s, and the engine speed decreases as the clutch engagement deepens with the increase in the clutch position from 2.54 s to 2.91 s. In Figure 24(a2), the engine is synchronized to the clutch speed at 2.91 s and makes a huge jerk (14.713 m/s3), and the clutch engagement position is at 3.544 mm (Sync Point). In Figure 24(a1), the difference between the engine speed and clutch speed is too large, which causes a large friction work (75.348 kJ).
The optimized clutch torque is shown in Figure 24(b3). In 0.40 s~1.45 s, the clutch torque increases rapidly from 0 Nm to 1300 Nm with the increase in the throttle pedal opening, satisfying the fast driver launching requirements. Due to the launching equivalent moment of resistance being too large, the clutch begins to slip (Kiss Point) at 0.40 s. As the clutch engagement position deepens, the vehicle begins to move (Bite Point) at 0.55 s, and the time interval is long. The Kiss Point is at 9.837 mm and the clutch starts to transmit torque. The Bite Point is at 7.058 mm and the vehicle starts to gain speed. The jerk at the Bite Point is 8.210 m/s3. In Figure 24(b2), the clutch speed increases gradually from 0.55 s to 2.75 s, synchronizing with the engine speed. At the same time, the engine speed fluctuates and decreases during the clutch slipping, with the maximum speed not exceeding 1050 rpm. The clutch speed and engine speed are synchronized at 2.67 s, and the clutch engagement position is at 3.155 mm (Sync Point). The jerk at the Sync Point is 11.254 m/s3, and the friction work is 74.412 kJ.
The friction work, jerk, and clutch synchronization time for each test case are shown in Table 7. Comparing the jerk levels between case 1-1 and case 1-2, the maximum jerk decreased from 7.251 m/s3 to 6.212 m/s3, which is a decrease of 14.33 percent. Comparing the jerk levels between case 2-1 and case 2-2, the maximum jerk decreased from 9.588 m/s3 to 8.726 m/s3, which is a reduction of 8.99 percent. Comparing the jerk levels between case 3-1 and case 3-2, the maximum jerk decreased from 14.713 m/s3 to 11.254 m/s3, which is a decrease of 23.51 percent. As shown in Figure 20a, the faster the driver’s intention to launch, the larger the launch equivalent resistance and the higher the vehicle’s launch jerk.
Comparing the friction work between case 1-1 and case 1-2, the friction work decreased from 37.146 kJ to 33.821 kJ, which is a decrease of 8.95 percent. Comparing the friction work between case 2-1 and case 2-2, the friction work decreases from 60.853 kJ to 57.644 kJ, which is a decrease of 5.27 percent. Comparing the friction work between case 3-1 and case 3-2, the friction work decreased from 75.348 kJ to 74.412 kJ, which is a decrease of 1.24 percent. From Figure 20b, it can be seen that from case 1-1 to 3-1, as the launching equivalent moment of resistance increases, the driver’s intention to launch becomes faster, and the friction work of the vehicle launches becomes larger and larger.
From case 1-1 to case 1-2, there was a reduction in the clutch slipping time from 2.312 s to 2.061 s, representing a 10.86 percent decrease. Similarly, from case 2-1 to case 2-2, the clutch slipping time decreased from 2.276 s to 2.101 s, which is a decrease of 7.69 percent. In case 3-1 to case 3-2, the clutch slipping time reduced from 2.234 s to 2.121 s, indicating a decrease of 5.06 percent.
The control strategy proposed in this paper for optimizing the launching torque of the clutch can significantly reduce the degree of jerk, friction work, and clutch sync time during the launching process of heavy-duty vehicles compared to the unoptimized control strategy, as shown in Table 7 and Figure 25.
The critical position moment points, including the Kiss Point, Bite Point, and Sync Point, during clutch engagement are affected by the clutch torque, as shown in Table 8. From case 1-1 to case 3-1, the position of the Kiss Point is basically constant at 9.8 mm. Changes in the driver’s launching intention and differences in the launching equivalent resistance moment have little effect on the Kiss Points.
The position of the Bite Point in case 1-2 is 8.106 mm, which will change with the driver’s intention or the launching equivalent resistance torque. The increase in clutch torque results in a deeper clutch engagement position with a Bite Point of 7.058 in case 3-2. The position of the Sync Point in case 1-2 is 4.572 mm. The faster the driver’s intention to launch, the higher the vehicle’s launching equivalent moment of resistance, and the deeper the engagement position when the clutch is synchronized; in case 3-2, the Sync Point is 3.155 mm.
Differences in driver’s launching intention, vehicle mass, and road gradient can lead to variations in clutch engagement torque requirements for vehicle launching. However, the clutch torque needs to be realized by controlling the clutch position. Therefore, the clutch position point (KP, BP, and SP) changes under different launching conditions. The optimized clutch launching torque control strategy presented in this paper enables the clutch position to engage more profoundly within a shorter slipping time interval, as shown in Figure 26. This allows the clutch to transmit more torque for a shorter period of time to ensure that the vehicle’s launch satisfies the driver’s intention and overcomes the equivalent drag torque.

6. Conclusions

In this paper, jerk, friction work, and launching reserve power are used as performance metrics to address the variations in the driver’s launching intentions and the large differences in the launching equivalent moment of resistance of heavy vehicles. The performance function is solved using the minimum value principle based on the shooting method. The FNN is used to identify the vehicle launch states, and the weight coefficients of each performance indicator are adjusted according to the LSR results. Through simulation and experimental verification, the optimization strategy proposed in this paper can significantly improve the launching performance of heavy-duty vehicles. The optimized clutch torque is more in line with the driver’s intention to launch, and overcomes the launching resistance, as shown in Figure 22(b3), Figure 23(b3), and Figure 24(b3). The jerk, friction work, and engagement time during the heavy-duty vehicle launching process are significantly reduced, as shown in Table 7 and Figure 25. At the same time, the optimized launching strategy deepens the clutch engagement position at the same slip time, and the clutch can transfer more torque to ensure the vehicle launching power. Therefore, the launching strategy proposed in this paper can be applied to real vehicles to improve the driver’s launching comfort and improve the launching dynamics of the vehicle.

Author Contributions

Conceptualization, X.G.; methodology, X.G. and X.L.; software, G.W.; validation, M.X.; formal analysis, J.W.; investigation, J.W.; resources, M.X.; writing—original draft preparation, X.G., W.L. and X.L.; writing—review and editing, W.L. and G.W. All authors have read and agreed to the published version of the manuscript.

Funding

This research was funded by the Sichuan Provincial Science and Technology Project “Research and Application of Key Technology of Multi-Gear Electric Drive System for Electric Heavy Trucks”, grant number 2023YFG0068.

Data Availability Statement

The original contributions presented in the study are included in the article; further inquiries can be directed to the corresponding author.

Conflicts of Interest

The authors declare no conflicts of interest.

References

  1. Della Gatta, A.; Iannelli, L.; Pisaturo, M.; Senatore, A.; Vasca, F. A survey on modeling and engagement control for automotive dry clutch. Mechatronics 2018, 55, 63–75. [Google Scholar] [CrossRef]
  2. Pan, T.; Zang, H.Q. Position-based impedance torque control for automatic clutch with robust predefined-time stability guarantee. Proc. Inst. Mech. Eng. Part I J. Syst. Control. Eng. 2023, 237, 1542–1557. [Google Scholar] [CrossRef]
  3. Wu, J.M.; Yan, H.Z.; Liu, S.Q.; Ni, D. Study on nonlinear dynamics characteristics of dual speed dual clutch transmission system based on bond graph. Heliyon 2023, 9, e20862. [Google Scholar] [CrossRef] [PubMed]
  4. Zhao, Z.G.; Chen, H.J.; Zhen, Z.X.; Yang, Y.Y. Optimal torque coordinating control of the launching with twin clutches simultaneously involved for dry dual-clutch transmission. Veh. Syst. Dyn. 2014, 52, 776–801. [Google Scholar] [CrossRef]
  5. Yang, Y.Y.; Zhu, Z.B.; Wang, X.Y.; Chen, Z.; Ma, Z.L. Optimal launching-intention-aware control strategy for automated clutch engagement. Int. J. Automot. Technol. 2017, 18, 417–428. [Google Scholar] [CrossRef]
  6. Li, L.; Zhu, Z.B.; Chen, Y.; He, K.; Li, X.J.; Wang, X.Y. Engagement Control of Automated Clutch for Vehicle Launching Considering the Instantaneous Changes of Driver’s Intention. J. Dyn. Syst. Meas. Control. 2017, 139, 021011. [Google Scholar] [CrossRef]
  7. Zhao, G.D.; Liu, Y.G.; Zhai, K.N.; Jiang, F.Y.; Huang, Q.; Chen, Z. Research on intelligent launching control of dual clutch transmissions based on adaptive neural fuzzy inference system. J. Mech. Sci. Technol. 2022, 36, 3227–3237. [Google Scholar] [CrossRef]
  8. Liu, Y.G.; Zhang, J.C.; Huang, Q.; Chen, Z.; Chen, Z.H. Optimal Clutch Torque Prediction for Shifting Process of Dual Clutch Transmission Based on Support Vector Regression. Int. J. Automot. Technol. 2022, 23, 1073–1084. [Google Scholar] [CrossRef]
  9. Lin, X.Y.; Li, Y.L.; Xia, B. An online driver behavior adaptive shift strategy for two-speed AMT electric vehicle based on dynamic corrected factor. Sustain. Energy Technol. 2021, 48, 101598. [Google Scholar] [CrossRef]
  10. Liu, Y.G.; Zhao, P.; Qin, D.T.; Li, G.; Chen, Z.; Zhang, Y. Driving Intention Identification Based on Long Short-Term Memory and A Case Study in Shifting Strategy Optimization. IEEE Access 2019, 7, 128593–128605. [Google Scholar] [CrossRef]
  11. Wang, D.Y.; Hu, M.H.; Li, B.G.; Qin, D.T.; Sun, D.Y. Modular modeling and dynamic response analysis of a driveline system during start-up process. Mech. Mach. Theory 2021, 156, 104136. [Google Scholar] [CrossRef]
  12. Park, J.; Choi, S. Optimization Method of Reference Slip Speed in Clutch Slip Engagement in Vehicle Powertrain. Int. J. Automot. Technol. 2021, 22, 55–67. [Google Scholar] [CrossRef]
  13. Xu, Z.Y.; Liu, H.J. Research on the identification of DCT vehicle driver’s starting intention based on LSTM neural network and multi-sensor data fusion. Proc. Inst. Mech. Eng. Part D J. Automob. Eng. 2023, 237, 2928–2941. [Google Scholar] [CrossRef]
  14. Feng, J.H.; Qin, D.T.; Liu, Y.G.; Wang, X.; Lv, H. Pseudo-spectral optimization and data-driven control of vehicle start process with dual-clutch transmission. Mech. Mach. Theory 2022, 172, 104814. [Google Scholar] [CrossRef]
  15. Gao, J.; Yin, C.Q.; Jiang, C. Research on clutch position control based on backstepping method for small-sized tractors. Sci. Prog. 2023, 106. [Google Scholar] [CrossRef] [PubMed]
  16. Dong, G.; Wang, F.; Meng, D.L.; Chu, H.Q.; Hong, J.L.; Gao, B.Z. Modeling and control of ball-ramp electromechanical clutch actuator for in-wheel AMT of electric vehicles. Mech. Mach. Theory 2023, 180, 25–35. [Google Scholar] [CrossRef]
  17. Wu, P.; Qiang, P.H.; Pan, T.; Zang, H.Q. Double-Loop Control for Torque Tracking of Dry Clutch. Machines 2022, 10, 1142. [Google Scholar] [CrossRef]
  18. Liang, J.; Wang, F.; Feng, J.; Zhao, M.; Fang, R.; Pi, D.; Yin, G. A Hierarchical Control of Independently Driven Electric Vehicles Considering Handling Stability and Energy Conservation. IEEE Trans. Intell. Veh. 2024, 9, 738–751. [Google Scholar] [CrossRef]
  19. Guo, J.; Zhang, Y.Q. Adaptive Starting Control Strategy for Hybrid Electric Vehicles Equipped with a Wet Dual-Clutch Transmission. Actuators 2023, 12, 123. [Google Scholar] [CrossRef]
  20. Feng, J.H.; Qin, D.T.; Liu, Y.G.; Wang, X.; Lv, H. Pseudo-spectral optimization and model predictive control of vehicle shift process with dual clutch transmission. Proc. Inst. Mech. Eng. Part C J. Mech. Eng. Sci. 2023, 237, 3789–3806. [Google Scholar] [CrossRef]
  21. Bécsi, T. Quasi-Linear Parameter Varying Modeling and Control of an Electromechanical Clutch Actuator. Mathematic 2022, 10, 1473. [Google Scholar] [CrossRef]
  22. Ding, J.A.; Jiao, X.H. Observer-based adaptive dynamic sliding mode control for automatic clutch position tracking. Proc. Inst. Mech. Eng. Part E J. Process. Mech. Eng. 2023. [Google Scholar] [CrossRef]
  23. Yuan, R.F.; Wu, G.Q.; Shao, C.H.; Su, S.Q. Mechanism-oriented control for suppressing start-up judder of vehicle with automatic dry clutch: Experiment and simulation analysis. Proc. Inst. Mech. Eng. Part D J. Automob. Eng. 2021, 235, 744–758. [Google Scholar] [CrossRef]
  24. Wang, B.; Gao, B.Z.; Chen, H. Adaptive Optimal Control of Starting-up of Automated Manual Transmission. In Proceedings of the 2014 11th World Congress on Intelligent Control and Automation (Wcica), Shenyang, China, 29 June–4 July 2014; pp. 1723–1728. [Google Scholar]
  25. Gao, B.Z.; Hong, J.L.; Qu, T.; Yu, S.Y.; Chen, H. An Output Regulator With Rejection of Time-Varying Disturbance: Experimental Validation on Clutch Slip Control. IEEE Trans. Control. Syst. Technol. 2020, 28, 1158–1167. [Google Scholar] [CrossRef]
  26. Yang, Y.; Wang, M.M.; Xia, F.G.; Qin, D.T.; Feng, J.H. Modeling and Control Approach for Dual Clutch Transmission Vehicles Starting Process Based on State-Dependent Autoregressive With Exogenous Model. IEEE Access 2020, 8, 158712–158726. [Google Scholar] [CrossRef]
  27. Hong, J.L.; Gao, B.Z.; Yue, H.Q.; Chen, H. Dry Clutch Control of Two-Speed Electric Vehicles by Using an Optimal Control Scheme With Persistent Time-Varying Disturbance Rejection. IEEE Trans. Transp. Electrif. 2021, 7, 2034–2046. [Google Scholar] [CrossRef]
  28. Meng, F.; Chen, H.Y.; Zhang, T.; Zhu, X.Y. Clutch fill control of an automatic transmission for heavy-duty vehicle applications. Mech. Syst. Signal Process. 2015, 64–65, 16–28. [Google Scholar] [CrossRef]
  29. Kim, S.; Shin, K.; Yoo, C.; Huh, K. Development of Algorithms for Commercial Vehicle Mass and Road Grade Estimation. Int. J. Automot. Technol. 2017, 18, 1077–1083. [Google Scholar] [CrossRef]
  30. Cai, L.L.; Wang, H.L.; Jia, T.L.; Peng, P.; Pi, D.W.; Wang, E.L. Two-layer structure algorithm for estimation of commercial vehicle mass. Proc. Inst. Mech. Eng. Part D J. Automob. Eng. 2020, 234, 378–389. [Google Scholar] [CrossRef]
  31. Liu, Y.C.; Wei, L.T.; Fan, Z.X.; Wang, X.Y.; Li, L. Road slope estimation based on acceleration adaptive interactive multiple model algorithm for commercial vehicles. Mech. Syst. Signal Proc. 2023, 184, 109733. [Google Scholar] [CrossRef]
  32. Zheng, W.G.; Zhang, J.Z.; Wang, S.C.; Feng, G.S.; Xu, X.H.; Ma, Q.X. A Shifting Strategy for Electric Commercial Vehicles Considering Mass and Gradient Estimation. Comput. Model. Eng. Sci. 2023, 137, 489–508. [Google Scholar] [CrossRef]
  33. Kim, J. Real-Time Torque Estimation of Automotive Powertrain With Dual-Clutch Transmissions. IEEE Trans. Control. Syst. Technol. 2022, 30, 2269–2284. [Google Scholar] [CrossRef]
  34. Shi, J.L.; Li, L.; Wang, X.Y.; Liu, C.Z. Robust output feedback controller with high-gain observer for automatic clutch. Mech. Syst. Signal Proc. 2019, 132, 806–822. [Google Scholar] [CrossRef]
  35. Li, Y.X.; Wang, Z.C. Motion Characteristics of a Clutch Actuator for Heavy-Duty Vehicles with Automated Mechanical Transmission. Actuators 2021, 10, 179. [Google Scholar] [CrossRef]
  36. Guo, X.L.; Lu, H.M. Optimal Design on Diaphragm Spring of Automobile Clutch. In Proceedings of the Icicta: 2009 Second International Conference on Intelligent Computation Technology and Automation, Changsha, China, 10–11 October 2009; Volume III, pp. 206–208. [Google Scholar] [CrossRef]
  37. ISO 6358-3:2013; Pneumatic Fluid Power—Determination of Flow-Rate Characteristics of Components Using Compressible Fluids—Part 3: Method for Calculating Steady-State Flow-Rate Characteristics of Systems. ISO Internationale Organisation: Switzerland, Geneva, 2013.
  38. Qian, P.F.; Liu, L.; Pu, C.W.; Meng, D.Y.; Páez, L.M.R. Methods to improve motion servo control accuracy of pneumatic cylinders-review and prospect. Int. J. Hydromechatronics 2023, 6, 274–310. [Google Scholar] [CrossRef]
  39. Li, L.; Zhu, Z.B.; Wang, X.Y.; Yang, Y.Y.; Yang, C.; Song, J. Identification of a driver’s starting intention based on an artificial neural network for vehicles equipped with an automated manual transmission. Proc. Inst. Mech. Eng. Part D. J. Automob. Eng. 2016, 230, 1417–1429. [Google Scholar] [CrossRef]
  40. Torabi, S.; Wahde, M.; Hartono, P. Road Grade and Vehicle Mass Estimation for Heavy-duty Vehicles Using Feedforward Neural Networks. In Proceedings of the 2019 4th International Conference on Intelligent Transportation Engineering (Icite 2019), Singapore, 5–7 September 2019; pp. 316–321. [Google Scholar] [CrossRef]
  41. Chen, R.; Sun, D.Y. Fuzzy Neural Network Control of AMT Clutch in Starting Phase. In Proceedings of the 2008 International Symposium on Intelligent Information Technology Application, Shanghai, China, 20–22 December 2008; Volume II, pp. 712–715. [Google Scholar] [CrossRef]
  42. Li, A.T.; Qin, D.T. Adaptive model predictive control of dual clutch transmission shift based on dynamic friction coefficient estimation. Mech. Mach. Theory 2022, 173, 104804. [Google Scholar] [CrossRef]
  43. Xie, S.B.; Hu, X.S.; Lang, K.; Qi, S.W.; Liu, T. Powering Mode-Integrated Energy Management Strategy for a Plug-In Hybrid Electric Truck with an Automatic Mechanical Transmission Based on Pontryagin’s Minimum Principle. Sustainability 2018, 10, 3758. [Google Scholar] [CrossRef]
  44. Qian, P.F.; Ren, X.D.; Tao, G.L.; Zhang, L.R. Compound Sliding Mode Motion Trajectory Tracking Control of an Electro-Pneumatic Clutch Actuator While Maximizing Its Stiffness. J. Chin. Soc. Mech. Eng. 2016, 37, 515–524. [Google Scholar]
  45. Myklebust, A.; Eriksson, L. Modeling, Observability, and Estimation of Thermal Effects and Aging on Transmitted Torque in a Heavy Duty Truck With a Dry Clutch. IEEE/ASME Trans. Mechatron. 2015, 20, 61–72. [Google Scholar] [CrossRef]
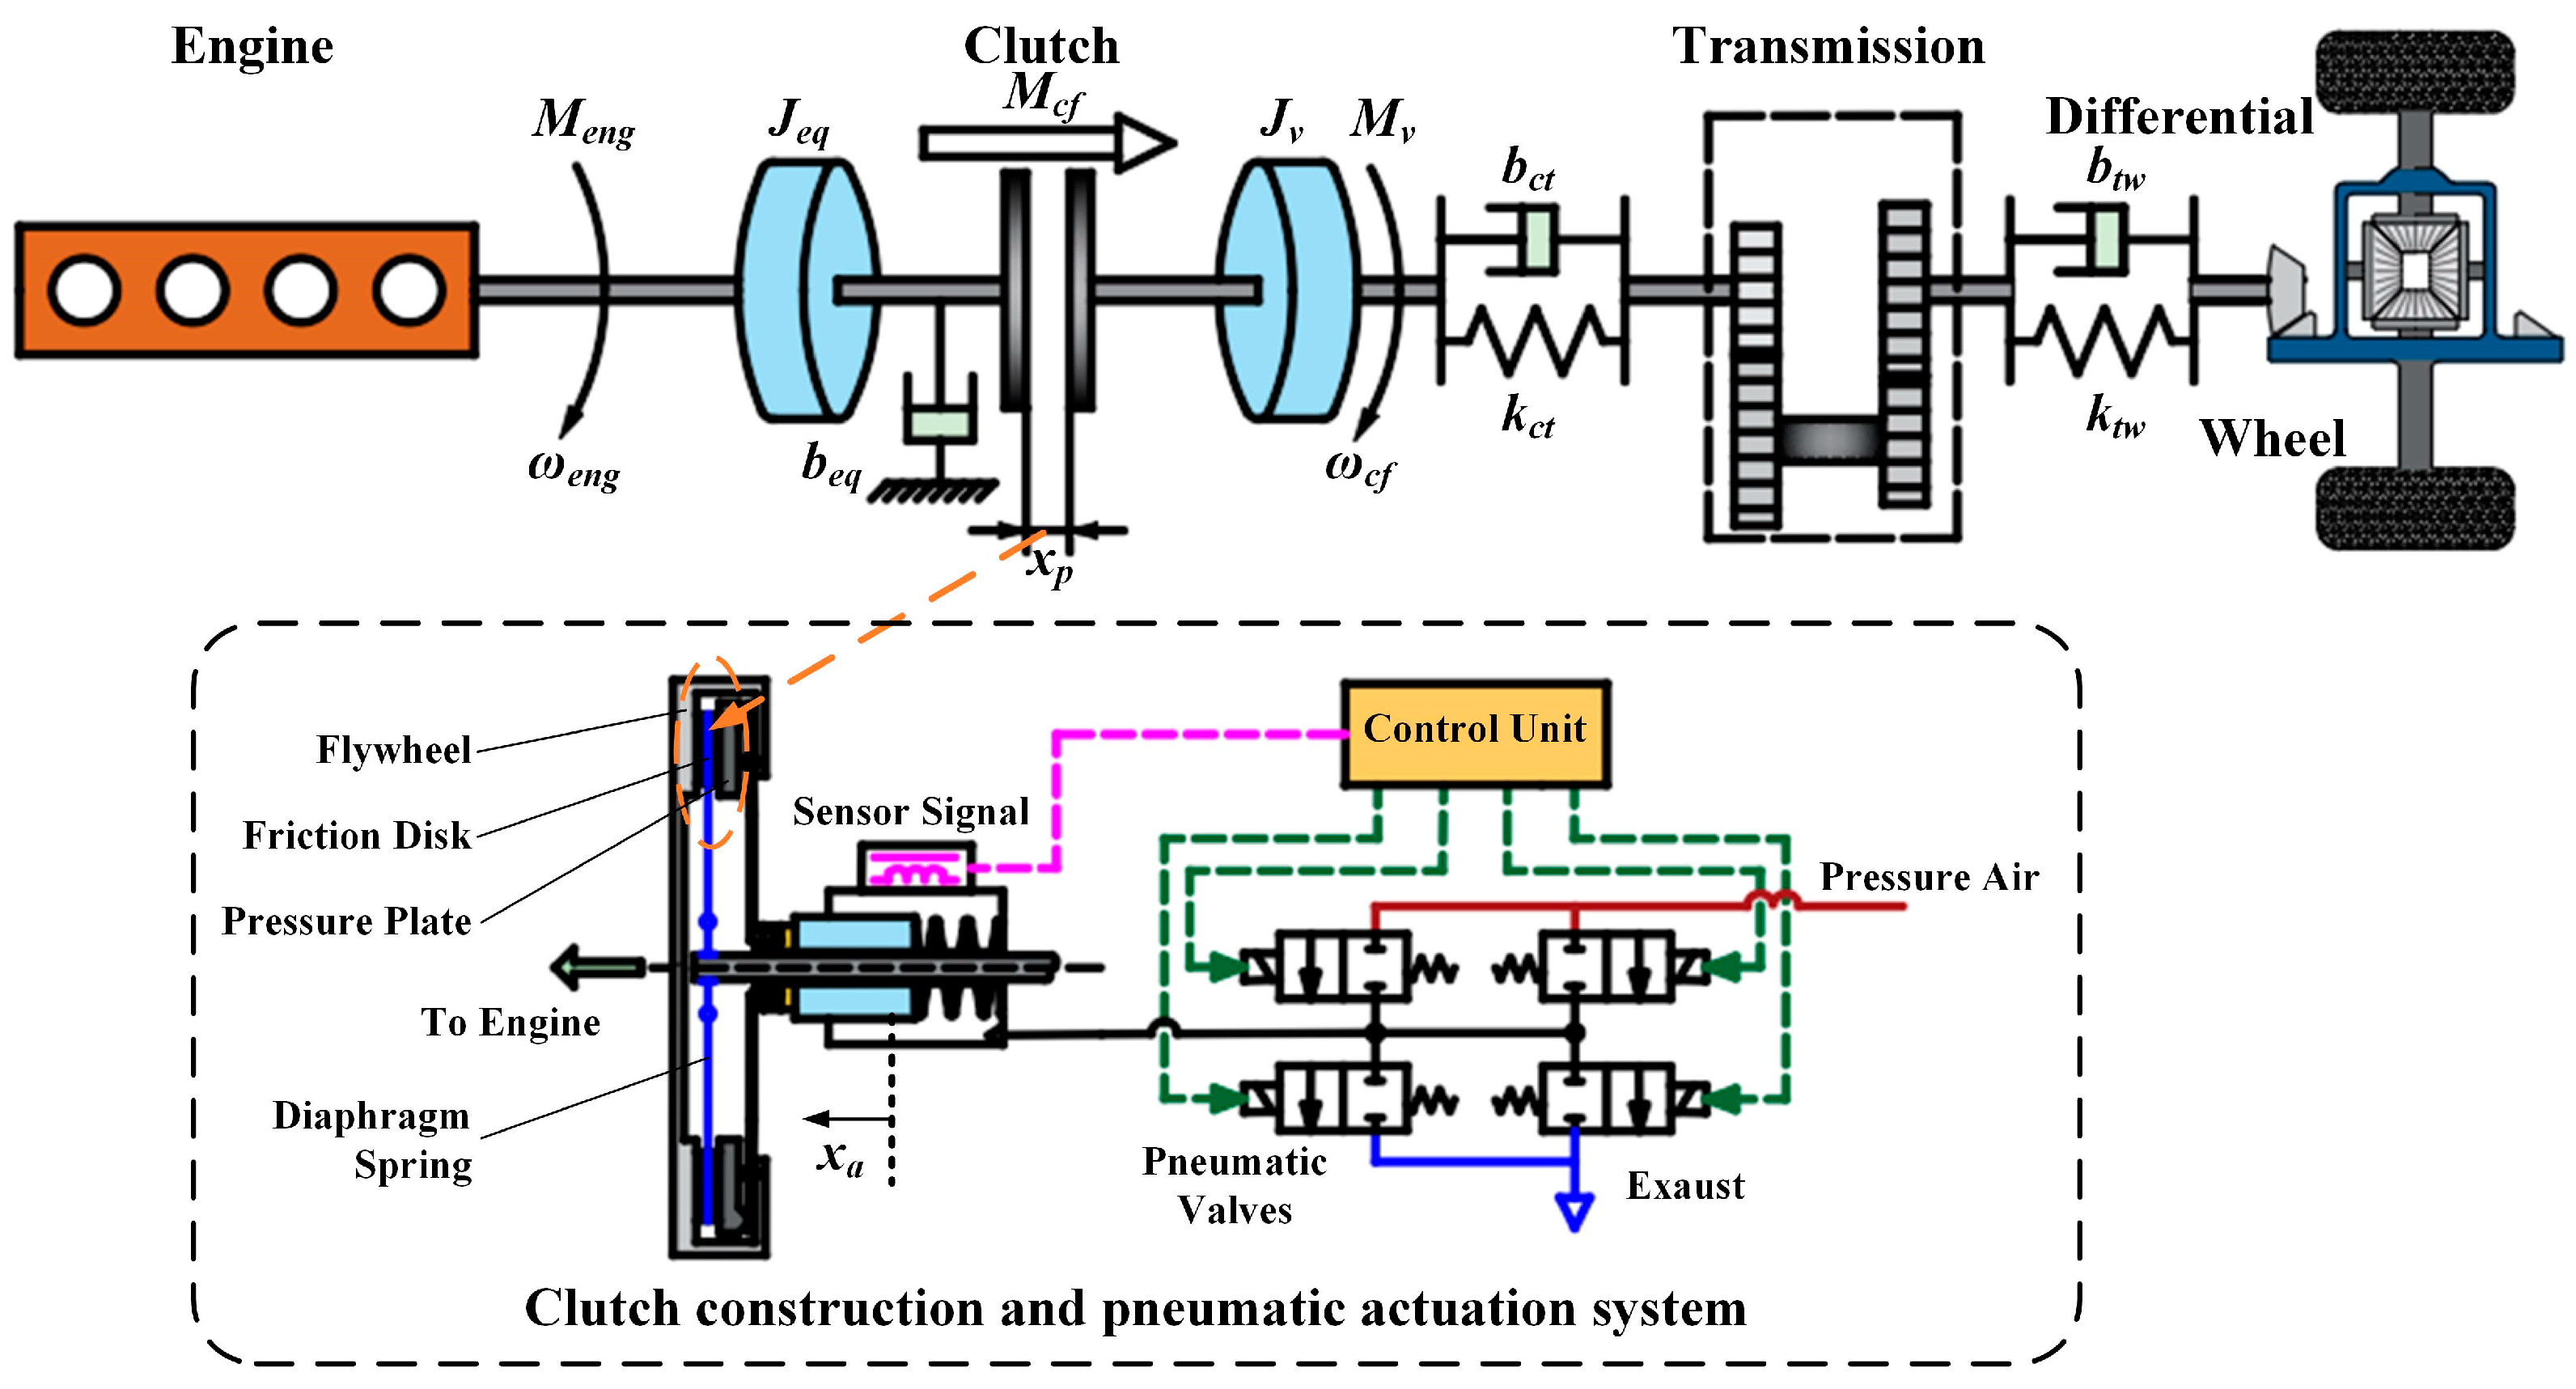
Figure 1. Schematic diagram of the powertrain and automatic clutch system of a heavy-duty vehicle.
Machines 12 00363 g001
Figure 2. Clutch engagement process during launch of a heavy-duty vehicle: (a1) Position of actuator Sync Point; (a2) Position of actuator Bite Point; (a3) Position of actuator Kiss Point; (b1) The vehicle starts to move at the moment t3; (b2) Clutch engagement position at moments t2 and t3; (b3) The clutch starts to transfer torque at the moment t2; (c1) Throttle pedal opening and clutch torque; (c2) Engine speed, clutch speed and clutch position.
Machines 12 00363 g002
Figure 3. Variation of force and displacement of clutch diaphragm spring during operation: (a) Schematic diagram of clutch diaphragm spring structure and deformation; (b) Clutch load characteristic curves.
Machines 12 00363 g003
Figure 4. Clutch launching torque to engagement displacement conversion.
Machines 12 00363 g004
Figure 5. Clutch torque for different launching intentions of the driver: (a) Throttle pedal opening 20%; (b) Throttle pedal opening 40%; (c) Throttle pedal opening 60%; (d) Throttle pedal opening 80%.
Machines 12 00363 g005
Figure 6. The membership function curve: (a) Throttle pedal opening; (b) Change rate of throttle pedal opening; (c) Driver’s launching intention.
Machines 12 00363 g006
Figure 7. Clutch torque at different launching equivalent resistance moments.
Machines 12 00363 g007
Figure 8. The membership function curve: (a) Total vehicle mass; (b) Road gradient; (c) Launching equivalent resistance.
Machines 12 00363 g008
Figure 9. Fuzzy neural network-based launching states recognition system.
Machines 12 00363 g009
Figure 10. A fuzzy neural network (FNN)-based launching states recognition (LSR) system.
Machines 12 00363 g010
Figure 11. The fuzzy rule surface of driver’s launching intention.
Machines 12 00363 g011
Figure 12. The fuzzy rule surface of launching equivalent resistance.
Machines 12 00363 g012
Figure 13. Solving the performance function based on the minimum principle of the shooting method.
Machines 12 00363 g013
Figure 14. Pneumatic actuator control based on sliding mode.
Machines 12 00363 g014
Figure 15. Automatic clutch pneumatic actuator test bench.
Machines 12 00363 g015
Figure 16. Simulation and experimental results curves: (a) Trajectory curve; (b) Trajectory tracking error.
Machines 12 00363 g016
Figure 17. The heavy-duty vehicle launching clutch torque control strategy: (a) A rule-based launching clutch torque control strategy (without optimal strategy); (b) The LSR-based clutch torque optimal control strategy (optimal control strategy).
Machines 12 00363 g017
Figure 18. Combining simulation and experimentation to optimize clutch torque during a heavy-duty vehicle launching process.
Machines 12 00363 g018
Figure 19. The effect of weighting coefficients Q1, Q2, Q3 on friction work and jerk: (a) Changing Q1, and keeping Q2, Q3 unchanged; (b) Changing Q2, and keeping Q1, Q3 unchanged; (c) Changing Q3, and keeping Q1, Q2 unchanged.
Machines 12 00363 g019
Figure 20. The correspondence between the driver’s launching intention, the launching equivalent resistance, and Q1, Q2, Q3: (a) The weight coefficients Q1, Q2, Q3 and the driver’s launching intention; (b) The weight coefficients Q1, Q2, Q3 and the launching equivalent resistance.
Machines 12 00363 g020
Figure 21. The launching clutch optimized torque map for heavy-duty vehicles based on LSR.
Machines 12 00363 g021
Figure 22. Case 1-1 and case 1-2 test results: (a) Without clutch torque optimal control strategy, (a1) jerk and friction work, (a2) engine speed, clutch speed and clutch position, (a3) throttle pedal opening and clutch torque; (b) With clutch torque optimal control strategy, (b1) jerk and friction work, (b2) engine speed, clutch speed and clutch position, (b3) throttle pedal opening and clutch torque.
Machines 12 00363 g022
Figure 23. Case 2-1 and case 2-2 test results: (a) Without clutch torque optimal control strategy, (a1) jerk and friction work, (a2) engine speed, clutch speed and clutch position, (a3) throttle pedal opening and clutch torque; (b) With clutch torque optimal control strategy, (b1) jerk and friction work, (b2) engine speed, clutch speed and clutch position, (b3) throttle pedal opening and clutch torque.
Machines 12 00363 g023
Figure 24. Case 3-1 and case 3-2 test results: (a) Without clutch torque optimal control strategy, (a1) jerk and friction work, (a2) engine speed, clutch speed and clutch position, (a3) throttle pedal opening and clutch torque; (b) With clutch torque optimal control strategy, (b1) jerk and friction work, (b2) engine speed, clutch speed and clutch position, (b3) throttle pedal opening and clutch torque.
Machines 12 00363 g024
Figure 25. Comparison of test results of friction work and jerk: (a) Maximum jerk of different case types; (b) Friction work of different case types.
Machines 12 00363 g025
Figure 26. Comparison of test results of KP, BP, and SP position.
Machines 12 00363 g026
Table 1. Clutch diaphragm spring component parameters.
Parameter NameValueParameter NameValue
Modulus of elasticity E2.06 × 105 MpaRadius of the small end rs141 mm
Poisson’s ratio μs0.29Radius of the large end Rs205.5 mm
Thickness of steel plate h5.3 mmRadius of platen loading point Ls195 mm
Height of inner cut-off cone of disc spring H8.6 mmRadius of support ring loading point ls156 mm
Separate bearing load point radius rf53 mm
Table 2. Fuzzy control rules for driver’s intention to launch.
Throttle Pedal Opening (%) Change Rate of the Throttle Pedal Opening (%·s−1)
NBNSZPSPMPB
VSSSSSSS
SSSSSMM
MSMMMMF
BMMMFFF
VBMFFFFF
Table 3. Fuzzy control rules for launching equivalent resistance.
Total Vehicle Mass (kg)Road Gradient (%)
SMBVB
SSSSM
MSSMF
BSMMF
VMMFF
VBMFFF
Table 4. Main parameters of driveline systems for a heavy-duty vehicle.
Parameter NameValue
Vehicle parametersA heavy-duty vehicle empty/half/full load mass9000/29,000/49,000 kg
Rolling resistance coefficient0.015
Windward area9.56 m2
Wind resistance factor0.76
Engine parametersMaximum output power413 Kw
Maximum output torque2600 Nm
Rated speed1800 rpm
Clutch and AMT parametersClutch torque capacity3000 Nm
Clutch friction coefficient0.3
AMT maximum input torque2600 Nm
Transmission 1st/2nd/3rd gear ratio16.688/12.924/9.926
Driveline efficiency96%
Main reducer ratio2.867
Wheel radius0.537 m
Table 5. The correspondence between the driver’s launching intention (D), the launching equivalent resistance (LR), and Q1, Q2, Q3.
DJerk (j)Friction Work (W)The Weighting Coefficients (Q)LRJerk (j)Friction Work (W)The Weighting Coefficients (Q)
{S}SmallLarge[Q1 is small, Q2 is large, Q3 is large]{S}SmallSmall[Q1 is small, Q2 is small, Q3 is large]
{M}MiddleMiddle[Q1 is middle, Q2 is middle, Q3 is middle]{M}MiddleMiddle[Q1 is middle, Q2 is middle, Q3 is middle]
{F}LargeSmall[Q1 is large, Q2 is small, Q3 is small]{F}LargeLarge[Q1 is large, Q2 is large, Q3 is small]
Table 6. Launching illustrative case scenarios for a heavy-duty vehicle.
Case TypeDriver’s Launching IntentionsLaunching Equivalent Resistance TorqueTorque Control Strategy
Case 1-1α = [0%~30%],
m = 9000 kg, θ = 0%
Slow speedSmall resistanceWithout optimal strategy
Case 1-2Slow speedSmall resistanceOptimal control strategy
Case 2-1α = [0%~55%],
m = 29,000 kg, θ = 8%
Middle speedMiddle resistanceWithout optimal strategy
Case 2-2Middle speedMiddle resistanceOptimal control strategy
Case 3-1α = [0%~100%],
m = 49,000 kg, θ = 20%
Fast speedLarge resistanceWithout optimal strategy
Case 3-2Fast speedLarge resistanceOptimal control strategy
Table 7. Test results of friction work and jerk.
Case TypeMaximum Jerk
j (m/s3)
Friction Work
W (kJ)
Speed Sync Time
t (s)
Case1-17.25137.1462.312
Case1-26.21233.8212.061
Improvement14.33%8.95%10.86%
Case2-19.58860.8532.276
Case2-28.72657.6442.101
Improvement8.99%5.27%7.69%
Case3-114.71375.3482.234
Case3-211.25474.4122.121
Improvement23.51%1.24%5.06%
Table 8. Test results of KP, BP, and SP position.
Case TypeKiss Point (mm)Bite Point (mm)Sync Point (mm)
Case1-19.7798.2114.677
Case1-29.8438.1064.572
Case2-19.8337.8074.086
Case2-29.7797.5393.891
Case3-19.7867.2453.544
Case3-29.8377.0583.155
Disclaimer/Publisher’s Note: The statements, opinions and data contained in all publications are solely those of the individual author(s) and contributor(s) and not of MDPI and/or the editor(s). MDPI and/or the editor(s) disclaim responsibility for any injury to people or property resulting from any ideas, methods, instructions or products referred to in the content.