Article

Tacholess Time Synchronous Averaging for Gear Fault Diagnosis in Wind Turbine Gearboxes Using a Single Accelerometer

by
Trong-Du Nguyen
*,
Huu-Cuong Nguyen
,
Van-Minh-Hoang Nguyen
and
Phong-Dien Nguyen
Fault Diagnostics Lab, School of Mechanical Engineering, Hanoi University of Science and Technology, Hanoi 100000, Vietnam
*
Author to whom correspondence should be addressed.
Machines 2024, 12(6), 424; https://doi.org/10.3390/machines12060424
Submission received: 14 May 2024 / Revised: 18 June 2024 / Accepted: 18 June 2024 / Published: 20 June 2024

Abstract

:
Wind power is increasingly seen as a global, sustainable, and eco-friendly energy option. However, one significant obstacle to further wind energy investment is the high failure rate of wind turbines. The gearbox plays a pivotal role in turbine performance. In recent years, there has been a surge in the focus on gearbox fault diagnosis, reflecting its criticality and prevalence in the industry. Time synchronous averaging (TSA) is a primary technique to identify faults in wind turbine gearboxes using mechanical vibration signals. Generally, implementing TSA requires a device that is capable of recording the phase information of a rotary shaft. Nevertheless, there are situations in which the installation of such a device poses difficulties. For instance, gearboxes that are in use cannot be halted to allow for the installation of a device, and sealed gearboxes provide challenges while being inserted into the device. This research presents an innovative technical way to improve the TSA method without requiring a phase signal. The proposed method has the advantage of extracting the shaft rotation angle signal from the measured acceleration signal, even in non-stationary conditions where the rotational speed varies over time. The effectiveness of the proposed method is validated through measured datasets from wind turbine gearboxes with actual faults and a dataset from a gear system with variable rotational speeds.

1. Introduction

Nowadays, wind turbines represent a widely utilized renewable energy source across countries worldwide, owing to their superior advantages. As a result, wind turbines must adhere to more stringent productivity standards and have less downtime. This means that the research aims to increase productivity and reduce operational costs. However, complex wind turbine failures result in consistently high operational costs [1]. Most wind turbines are built offshore or in uninhabited lands with abundant wind energy resources. Consequently, operating wind turbines in these locations presents significant maintenance challenges. A wind turbine with a 20-year lifecycle has operational and maintenance costs of about 25% to 30% [2,3,4]. Since the introduction of 2 MW turbines in 2002, market demand has shown a future trend towards using larger capacity wind turbines. Compared to 750 KW machines, the operational and maintenance costs of 2 MW wind turbines can be reduced by 12% [5]. However, there remain several challenges to minimizing operational costs and maintenance as well as maximizing the productivity of this type of turbine. There have been several wind turbine incidents in the world. Notably, in Binh Thuan, Vietnam, a turbine caught fire in 2020, causing damages of USD 3 million (Figure 1).
Wind turbine failures typically fall into six categories: blade fault, gearbox fault, generator fault, bearing fault, mechanical brake system fault, and high-speed shaft control system fault. Among these, gearbox faults are a major and challenging issue due to their complex structure [6]. Therefore, diagnosing gearbox faults in wind turbines presents a significant challenge, especially in reducing the frequency of incidents and downtime. Unexpectedly, as an essential component of the wind turbine system, the gearbox accounts for a significant amount of the overall investment cost (about 18%) and, according to statistical data, is also thought to have the highest fault rate, as shown in Figure 2 [7].
It can be observed in Figure 2 that the average annual downtime due to minor and major gearbox faults amounts to up to 60 days, gravely impacting the productivity and effectiveness of wind turbines. This statistical information also indicates that wind turbine gearbox maintenance and repair activities necessitate 18.38 days for completion. The distinctive size and the closely integrated nature of the gearbox with other parts make access, repair, or even replacement more difficult [8,9]. While a gearbox’s stated operating lifetime of 20 years is usually the case, in practice, it may only last 6 to 8 years [7]. This indicates that several faults drastically reduce the wind turbine’s lifetime. Because of these variables, avoiding defects within the wind turbine is critical. As a result, the condition monitoring of the gearbox in wind turbines is an essential part of the wind turbine operation process [10,11]. The early detection of possible issues can significantly minimize downtime and prevent major faults in wind turbines [8].
Vibration monitoring for wind turbine gearboxes effectively minimizes the risk of incidents and accidents caused by faults during operation. Time synchronous averaging is a technique applied to separate the periodic components of a signal. It is typically employed as a filtering approach in the time domain. It is a highly effective and accurate signal processing technique to isolate periodic signals from a complex signal applied to rotating machinery [9,10,11,12,13,14]. McFadden [15] presented a method for identifying cracks in the geared system by employing TSA in conjunction with phase demodulation. Boulahbal et al. [16] employed TSA and wavelet transform to identify cracks in geared systems. Zheng et al. [17] used a time-averaged wavelet spectrum based on continuous wavelet transform (CWT) for gear fault diagnosis.
Presently, the recommended TSA techniques need a phase signal to divide the required acceleration data into shaft revolutions. To obtain phase information data, it is necessary to set up phase measuring equipment, known as a tachometer, onto a rotating shaft of the machine. However, it is challenging to interrupt the machine’s operation to connect the tachometer, as doing so could result in substantial economic losses stemming from the machine’s downtime. Moreover, most gearboxes are often enclosed, posing a challenge in precisely directing the laser light emitted by the tachometer towards the revolving shaft for phase measurement, even while the machine is stationary.
To overcome these drawbacks, phase information must be reconstructed from estimating the shaft rotational frequency. Currently, many scientists in the vibration signal analysis field are concentrating on various techniques to estimate the instantaneous frequency of shafts [18,19,20,21]. In order to determine the rotational frequency of the shaft, it is necessary to analyze the signal in the time–frequency domain using windowing transforms such as Short-time Fourier Transforms (STFTs) [14,22] and wavelet transforms [23,24,25]. By examining the time–frequency representation (TFR) to identify gear meshing frequency (GMF) components, after that, dividing these components by the number of teeth will give the shaft rotational frequency. Finally, the phase information is successfully reconstructed.
There has been an increasing amount of literature on this topic in recent years [26,27,28]. Bonnardot et al. [29] proposed a method to resample the signal against the angle by using the acceleration signal of a gearbox. Further progress has been made in this area, building on the research conducted by Combet et al. [30]. In this study, the author estimates rotational speed around one of the harmonics of gear meshing frequency and then demodulates the phase of this range. Another study carried out in [31,32] assessed several resampling techniques to establish order tracking for the condition monitoring of rotating machine vibration. Moreover, Combet et al. [33] introduced a novel approach for extracting the fluctuation in instantaneous speed from the signal. This algorithm relies on determining an instantaneous time scaling factor. The determination of this factor is based on the disparity between two signal segments, which is referred to as the “short time scale transform”.
Several studies have investigated the non-use of phase signal approaches in TSA techniques. In recent years, the idea of a “tacholess” method has emerged and has been successfully applied to gear systems [34,35,36,37,38,39] and rolling bearings [40,41,42,43,44,45,46]. However, many studies frequently concentrate on reconstructing phase information when rotational speeds remain constant. The task of extracting phase information from acceleration signals in circumstances with variable rotational speeds is difficult and has only been documented in a limited number of papers [47,48,49,50]. The work [51] by Gerber et al. was published in 2014 and presented at the CMMNO conference, presenting a thorough description of a universal, data-driven condition monitoring method. This approach monitors spectral peaks, harmonic series, and modulation sidebands. The technique, which employs angular resampling to maintain a consistent machine state, works across a wide range of rotational speeds and generates system health indicators for proactive maintenance.
This article will present the following novelty and main contributions: (i) propose a novel approach to separate the shaft rotation angle signal from the measured acceleration signal; (ii) develop an algorithm for detecting faults in the gearbox of a wind turbine based on time synchronous averaging using separated shaft rotation angle signals; (iii) evaluate the qualitative effectiveness of the proposed method by comparing it to time synchronous averaging; and (iv) quantitatively evaluate the proposed method using statistical feature values to determine the error of the proposed method.
The subsequent sections of this paper are organized as follows: Section 2 provides a literature assessment on extracting feature values using time synchronous averaging and selecting appropriate parameters for diagnosing gear faults in wind turbine gearboxes. Section 3 introduces a novel technique for feature extraction based on time synchronous averaging without using tacho signals. The experimental test results shown in Section 4 showcase the efficacy of the suggested technique. The Conclusion section offers additional discussions and prospective advancements in gear problem identification.

2. Literature Review

2.1. Feature Extraction from TSA Based on Tacho Signal

In general, the measured vibration signal from the wind turbine gearbox housing is a combination of the periodic signal component and noise, which the following formula can represent:
x t = s t + w t
where s ( t ) is the periodic signal with a period of T 0 (corresponding to a frequency f 0 = 1 T 0 ), and w ( t ) represents the noise.
The time domain averaging of the signal can be understood as follows: The signal is divided into blocks, with each block corresponding to a period of T 0 . Then, the blocks are summed together and averaged by the number of blocks. Mathematically, it can be represented as follows.
y t = 1 M r = 0 M 1 x t + r T 0
where r is the block index, and M is the total number of blocks. If the signal x ( t ) is sampled with a sampling period Δ t , then divided signals can be rewritten in the form of a discrete-time signal as follows:
y n Δ t = 1 M r = 0 M 1 x n Δ t + r N Δ t
where N is the number of samples within one block and is determined by the formula T 0 = N Δ t , and n = 1 , 2 , N 1 .
The frequency response of y ( t ) has been demonstrated with f 0 = 1 T 0 as follows [13]:
H f = 1 M sin π M f / f 0 sin π f / f 0
The time domain averaging method acts as a frequency filtering technique, preserving the periodic frequency components at frequency f 0 while attenuating the non-periodic frequency components with frequencies other than f 0 in terms of amplitude.

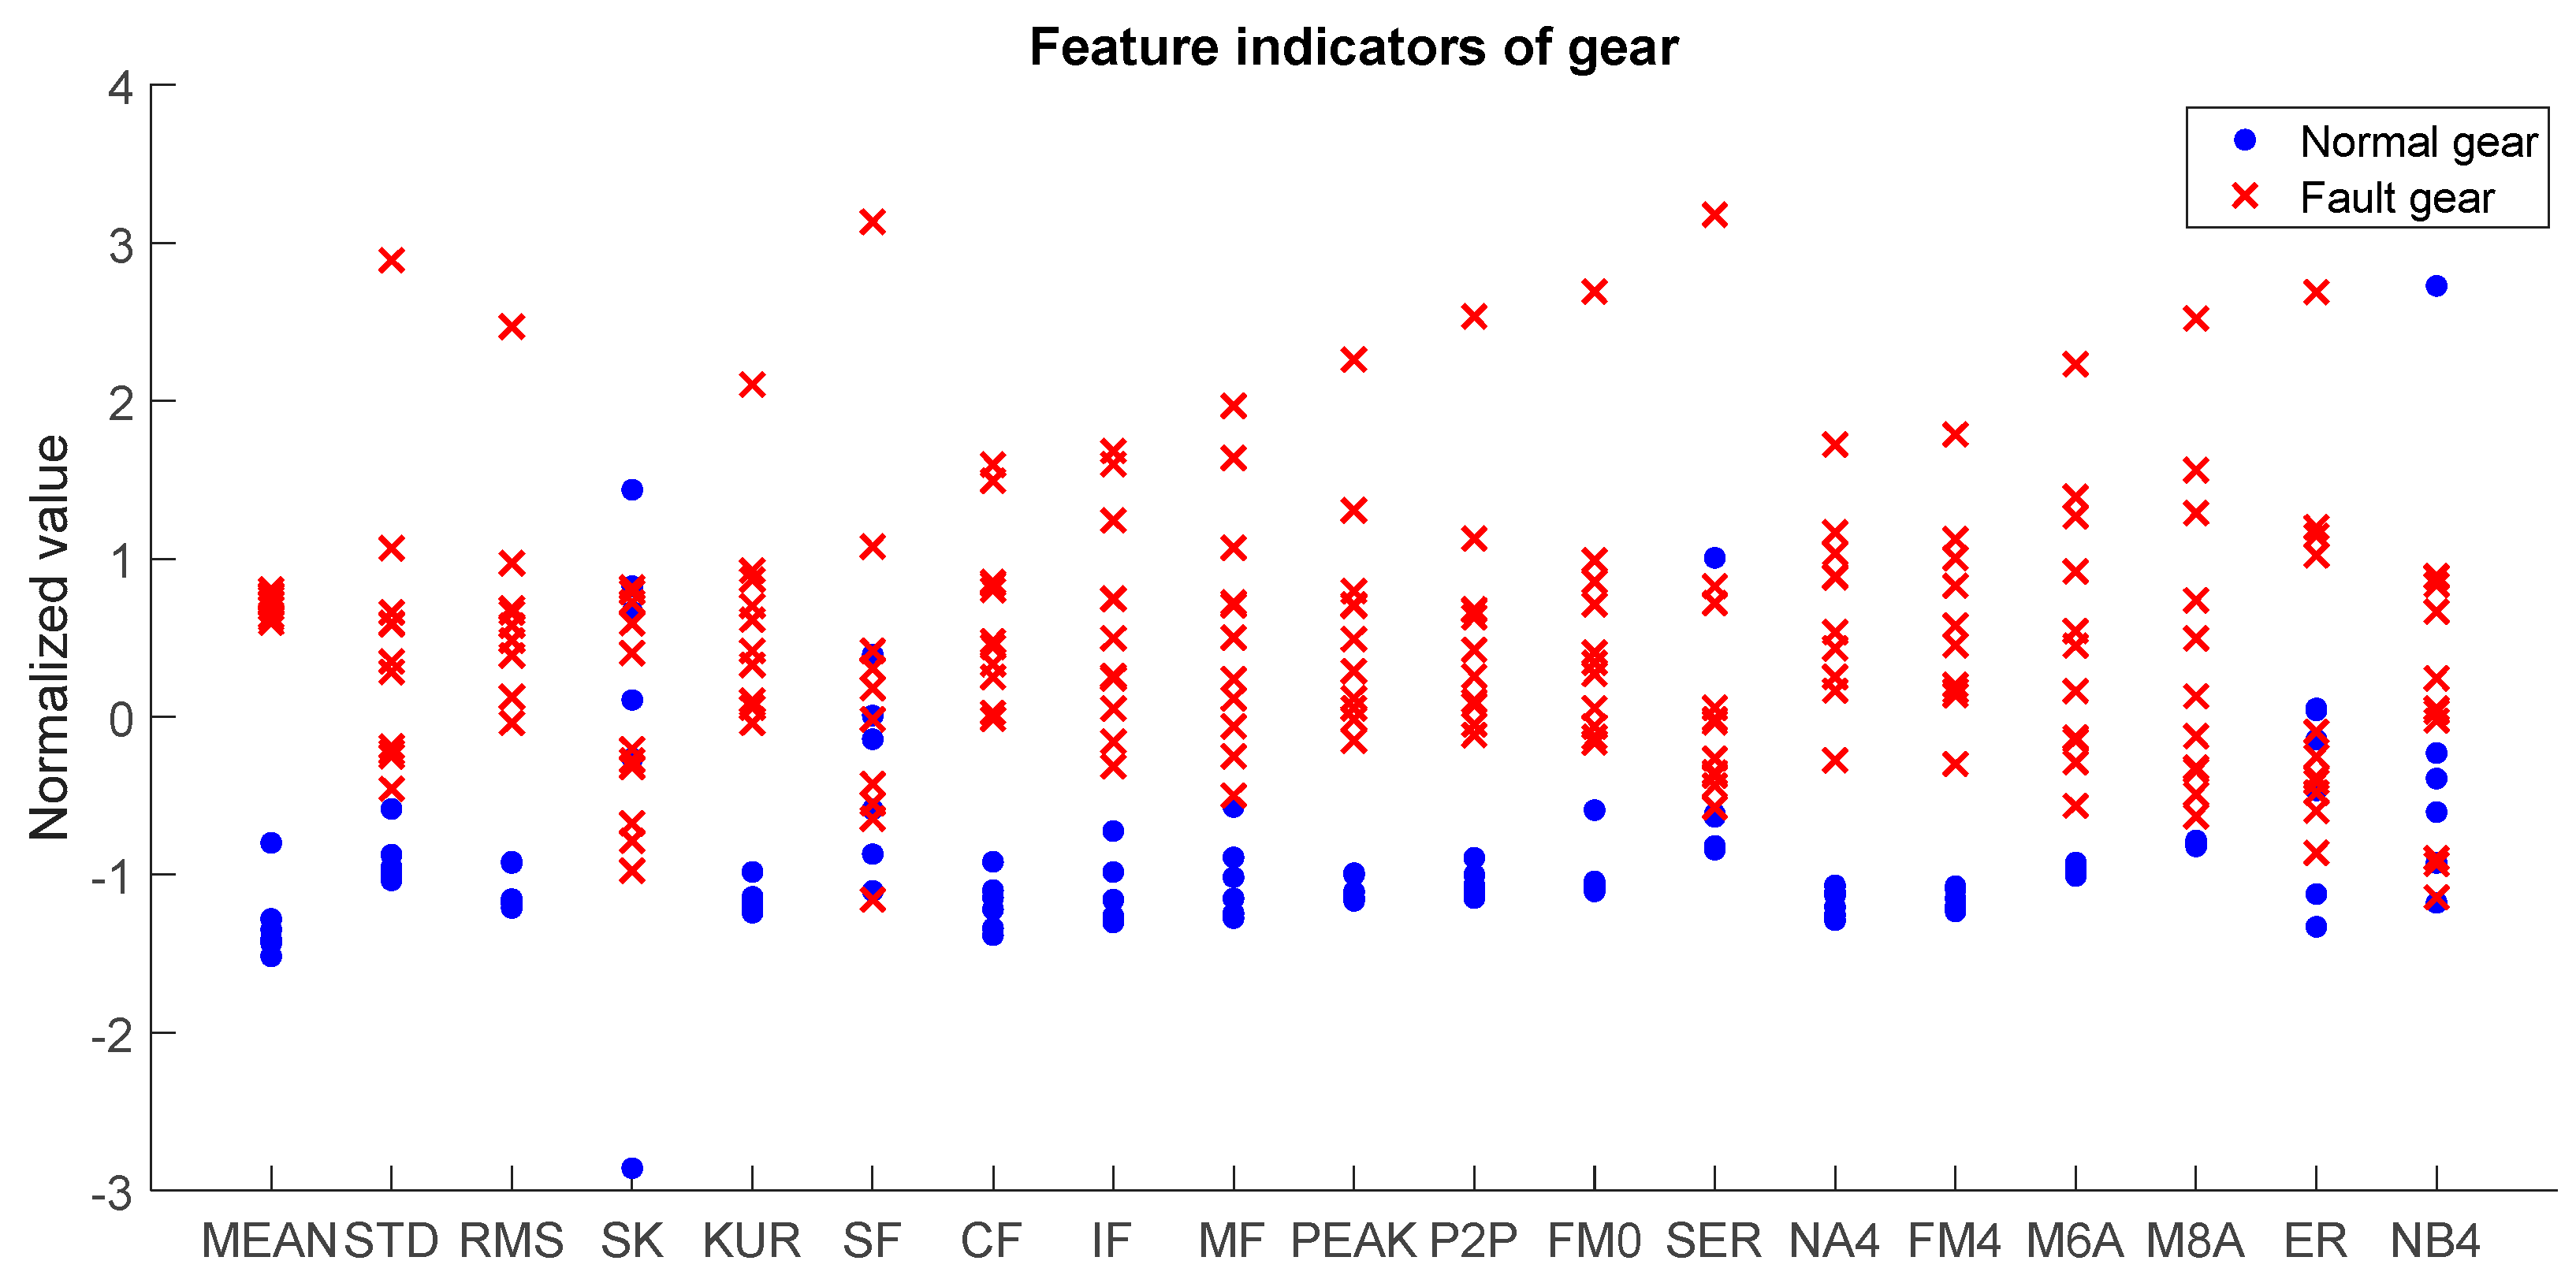
2.2. Selection Feature for Gear Fault Diagnostics

Various time domain features are commonly used to describe signals. These features provide valuable information about the properties and characteristics of the signal. In general, time domain feature indicators provide evaluation quickly and effectively. Table 1 shows frequently used time domain feature indicators.
The gear feature indicators listed in Table 2 are proposed in [52]. The gear feature indicators are valuable tools for evaluating the characteristics of gear meshing frequencies and their harmonics and sidebands. By examining these indicators, engineers and technicians can gather crucial insights into the condition and performance of gear transmission systems. These indices offer information about the energy level, amplitude, and presence of harmonics and sidebands in gear meshing frequency (GMF). Professionals can evaluate the health condition of gear, detect potential issues such as misalignment, wear, or other faults, and make informed decisions about necessary corrective actions.

3. Feature Extraction from TSA without Using a Tacho Signal

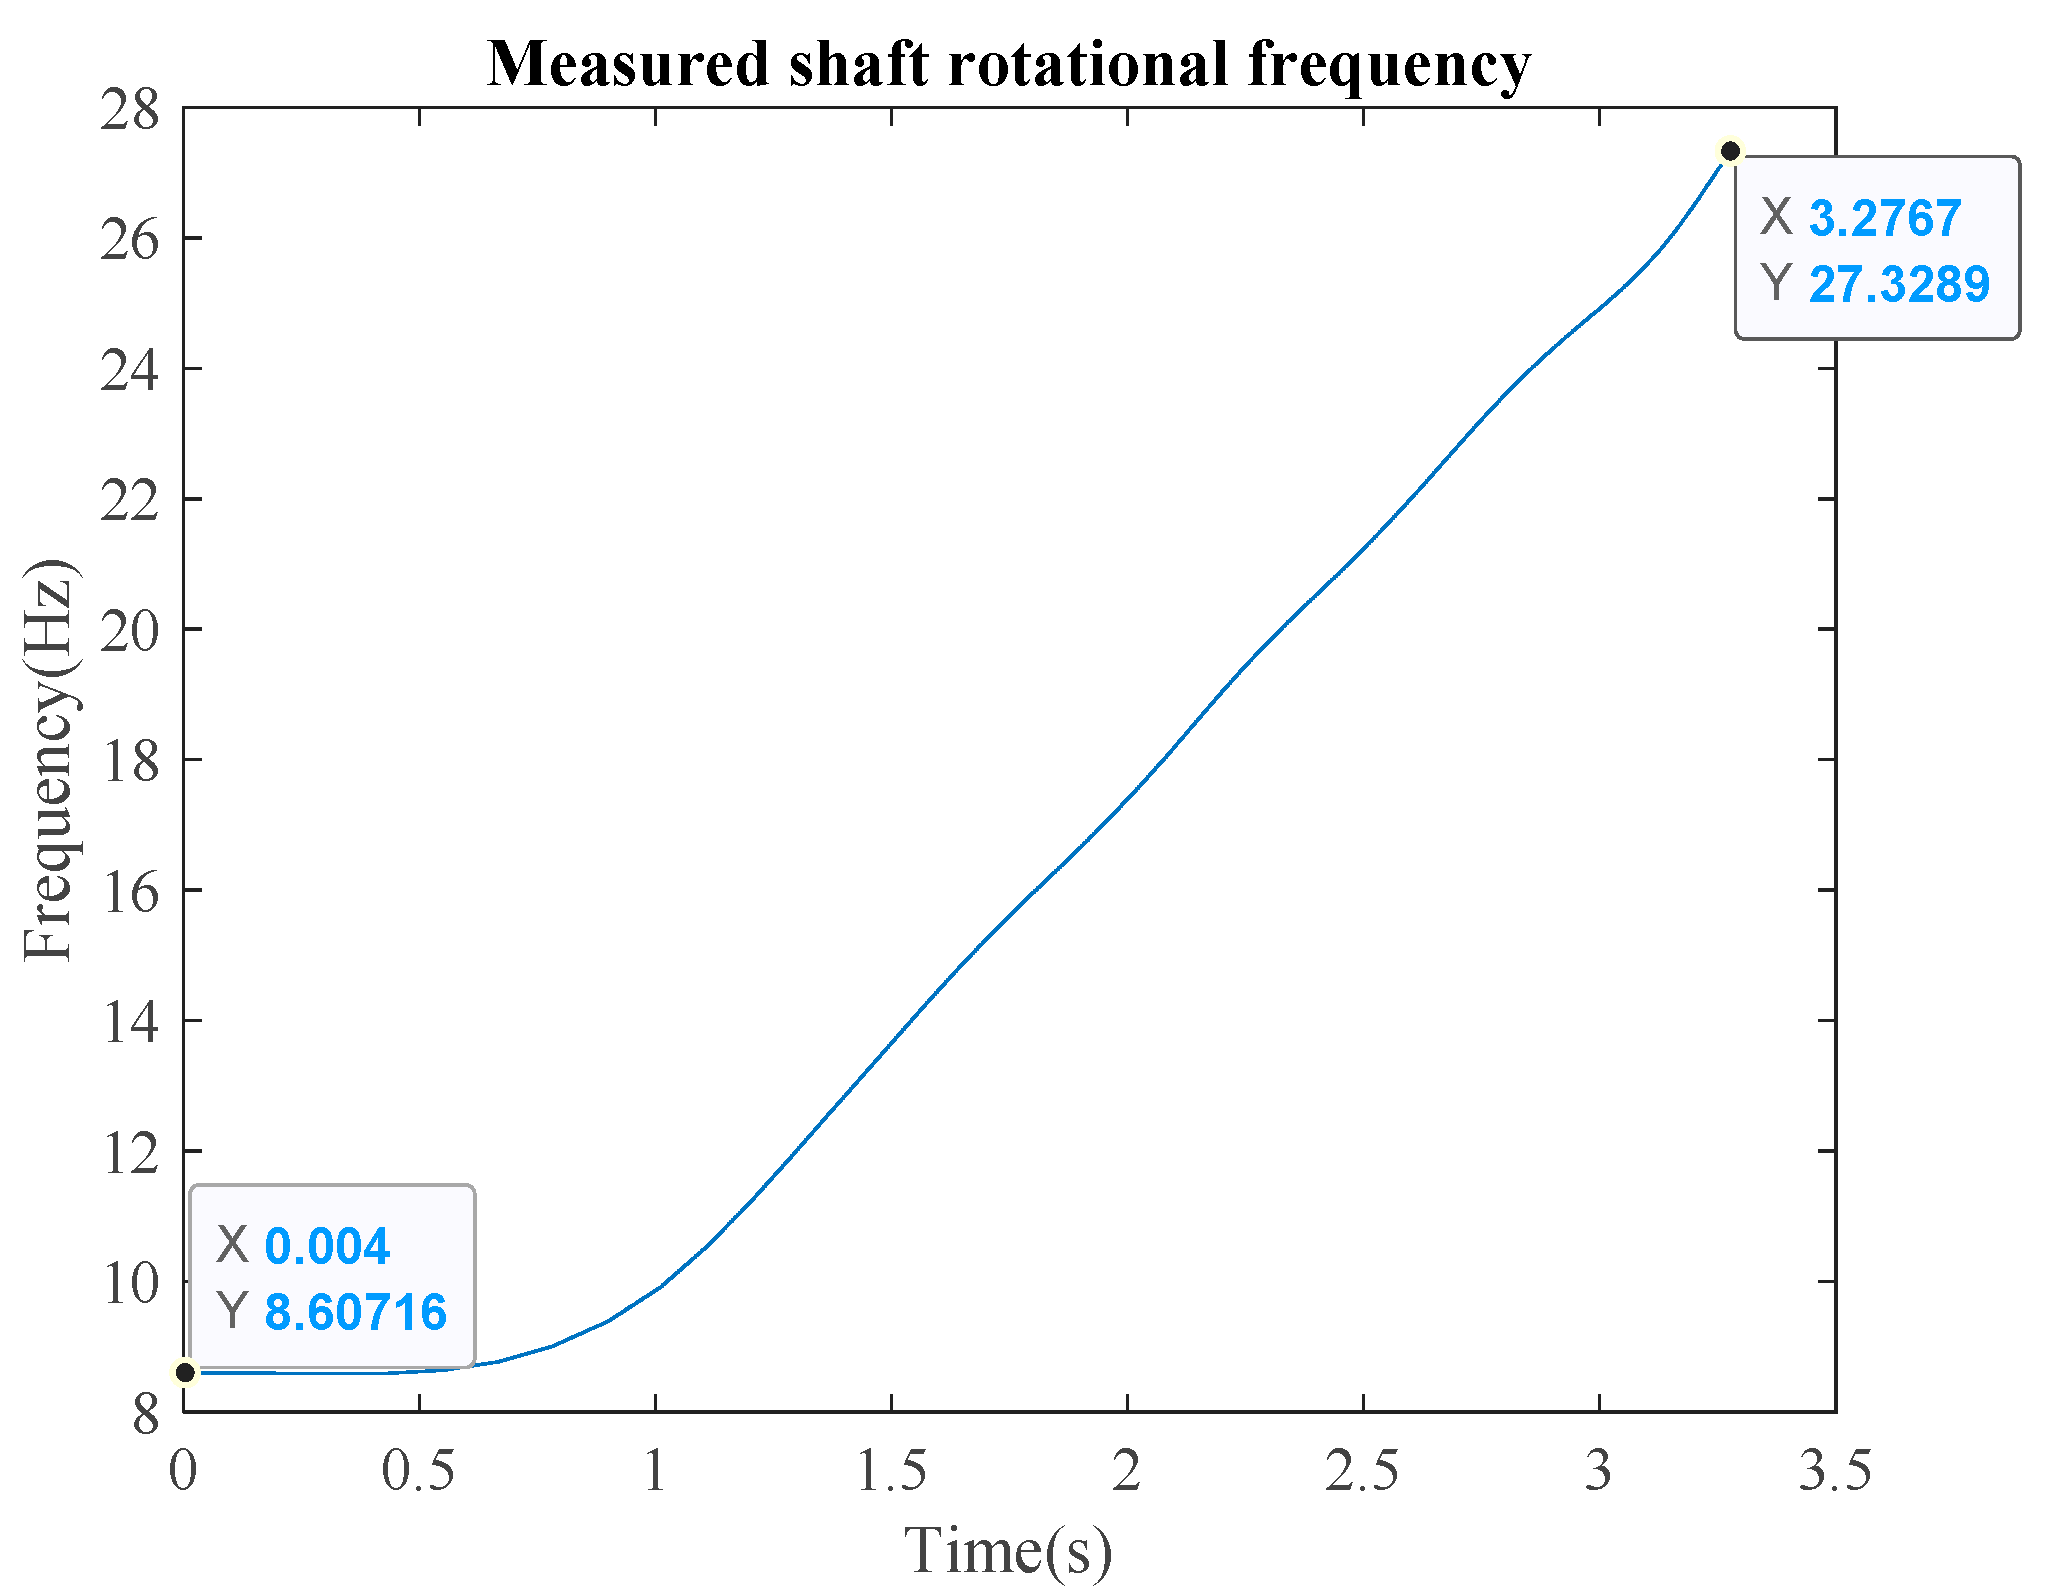
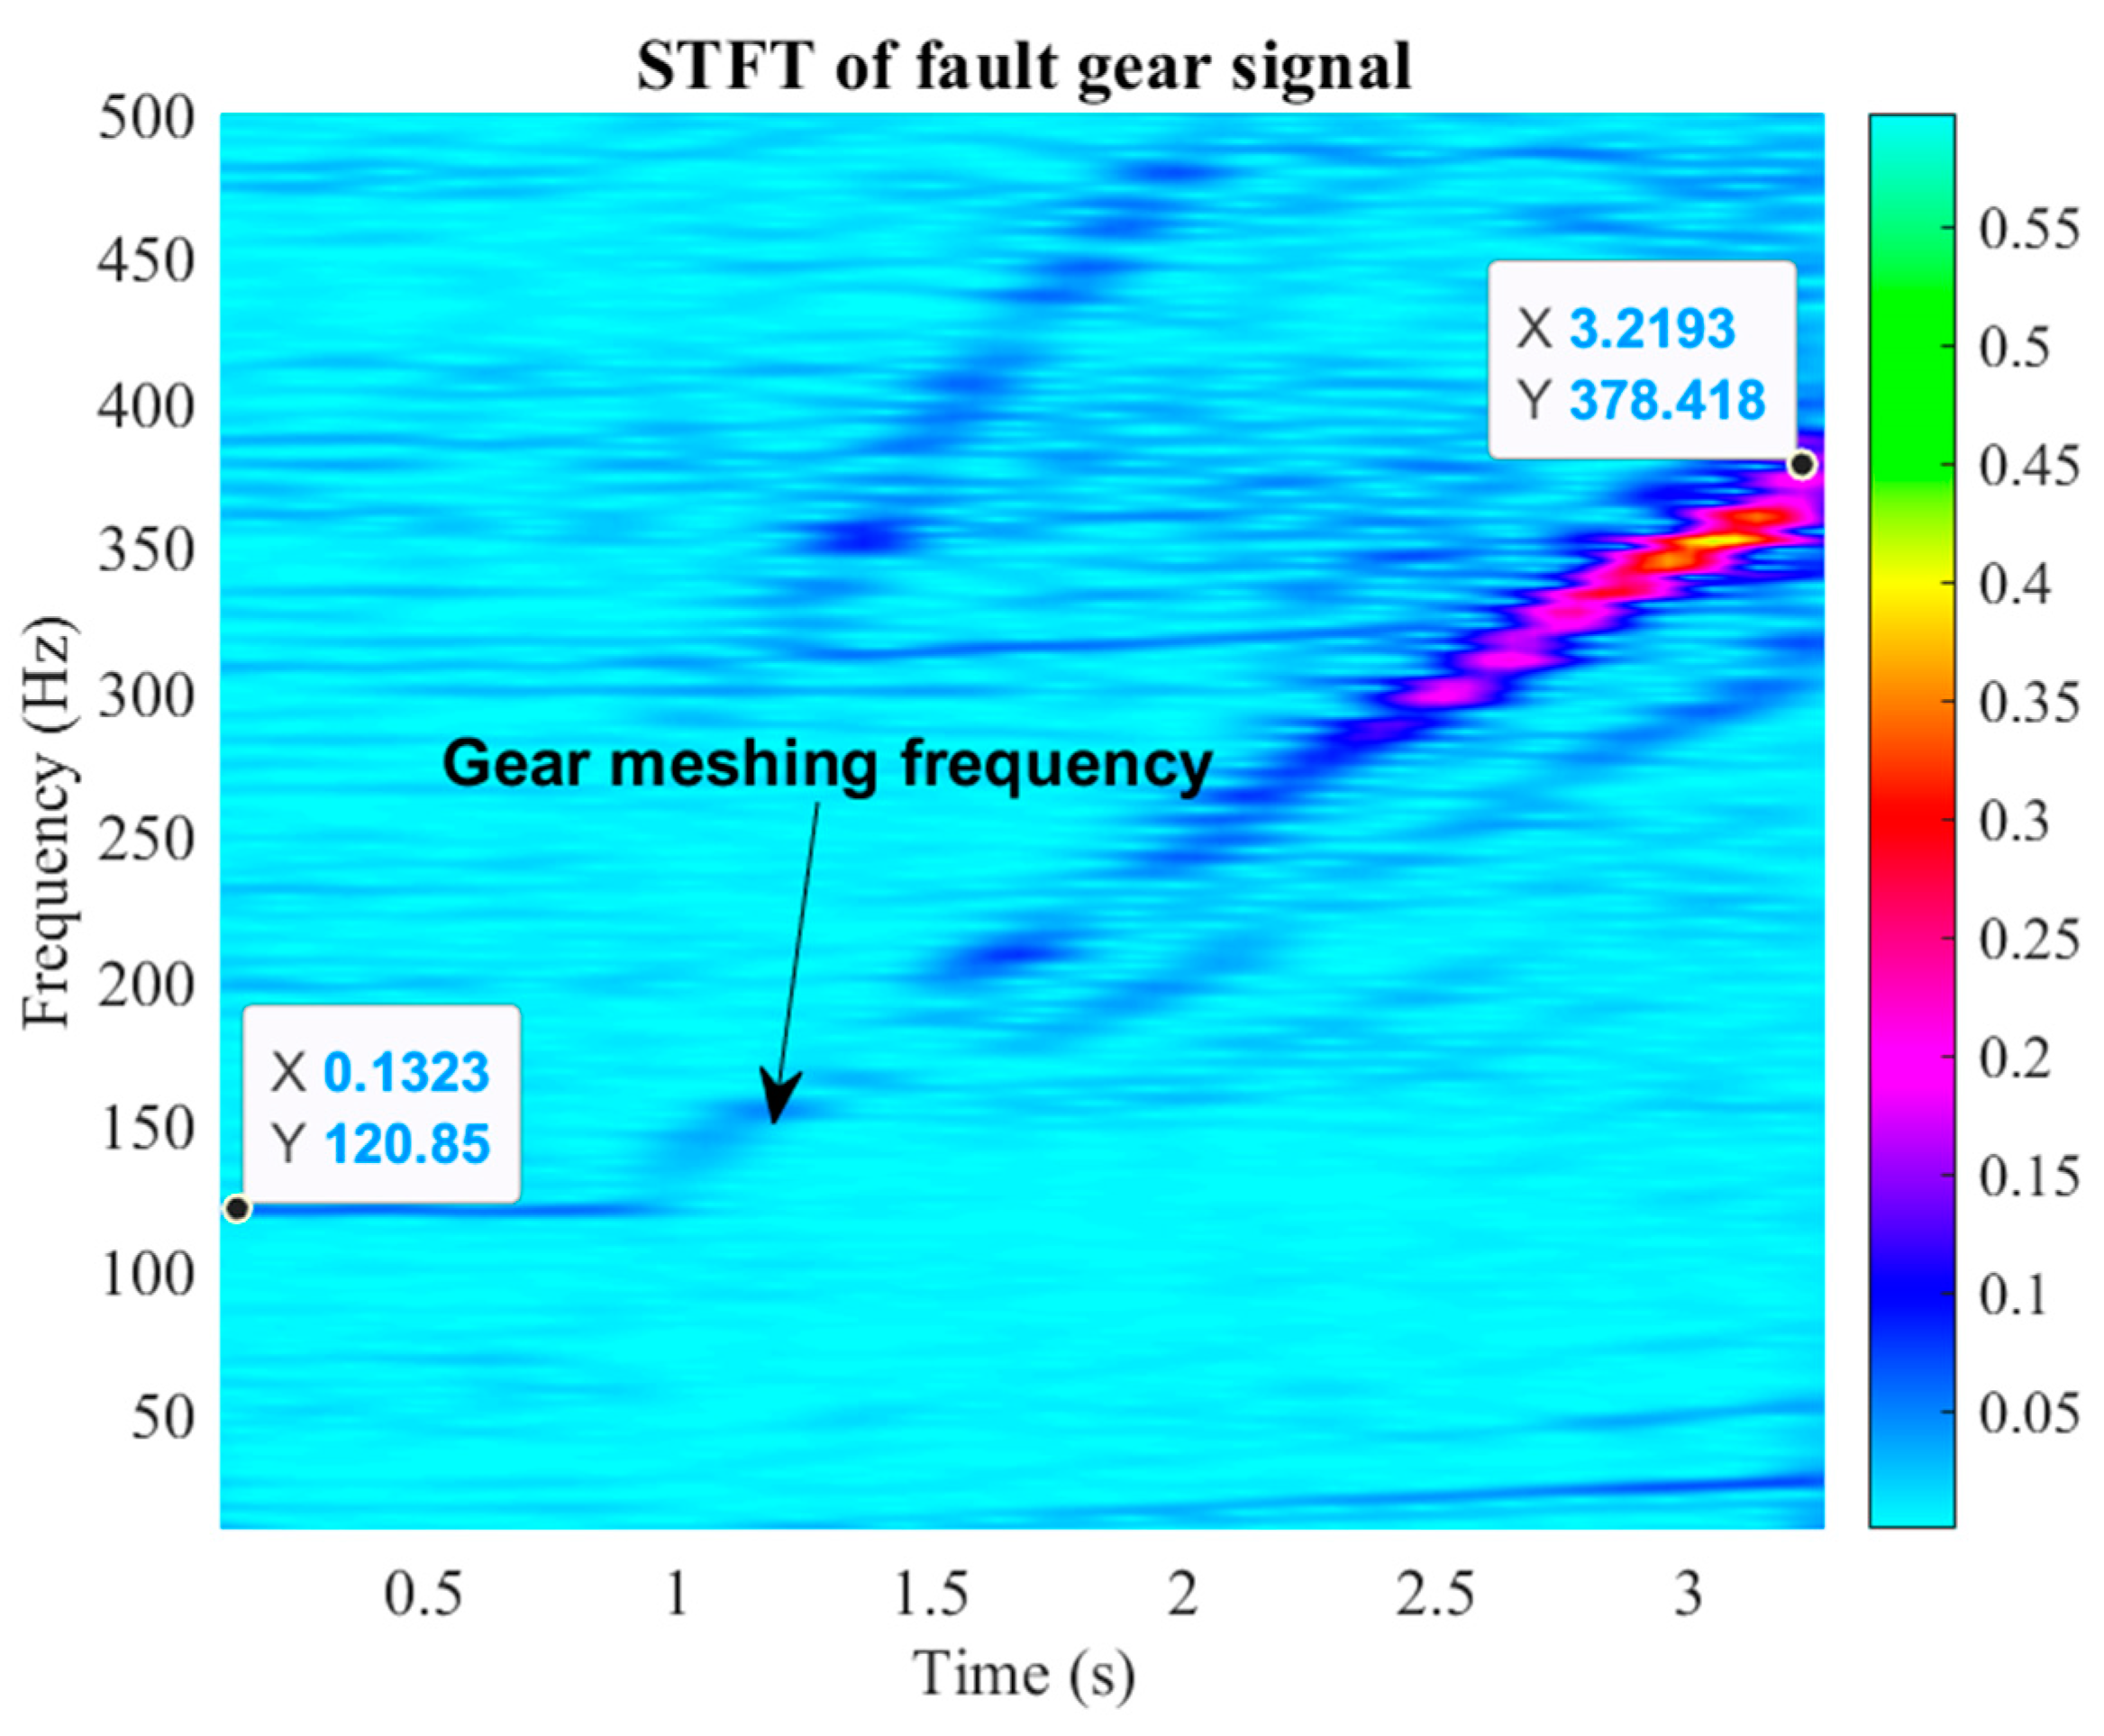
3.1. Reconstruction Tacho Signal from Time–Frequency Representation (TFR)
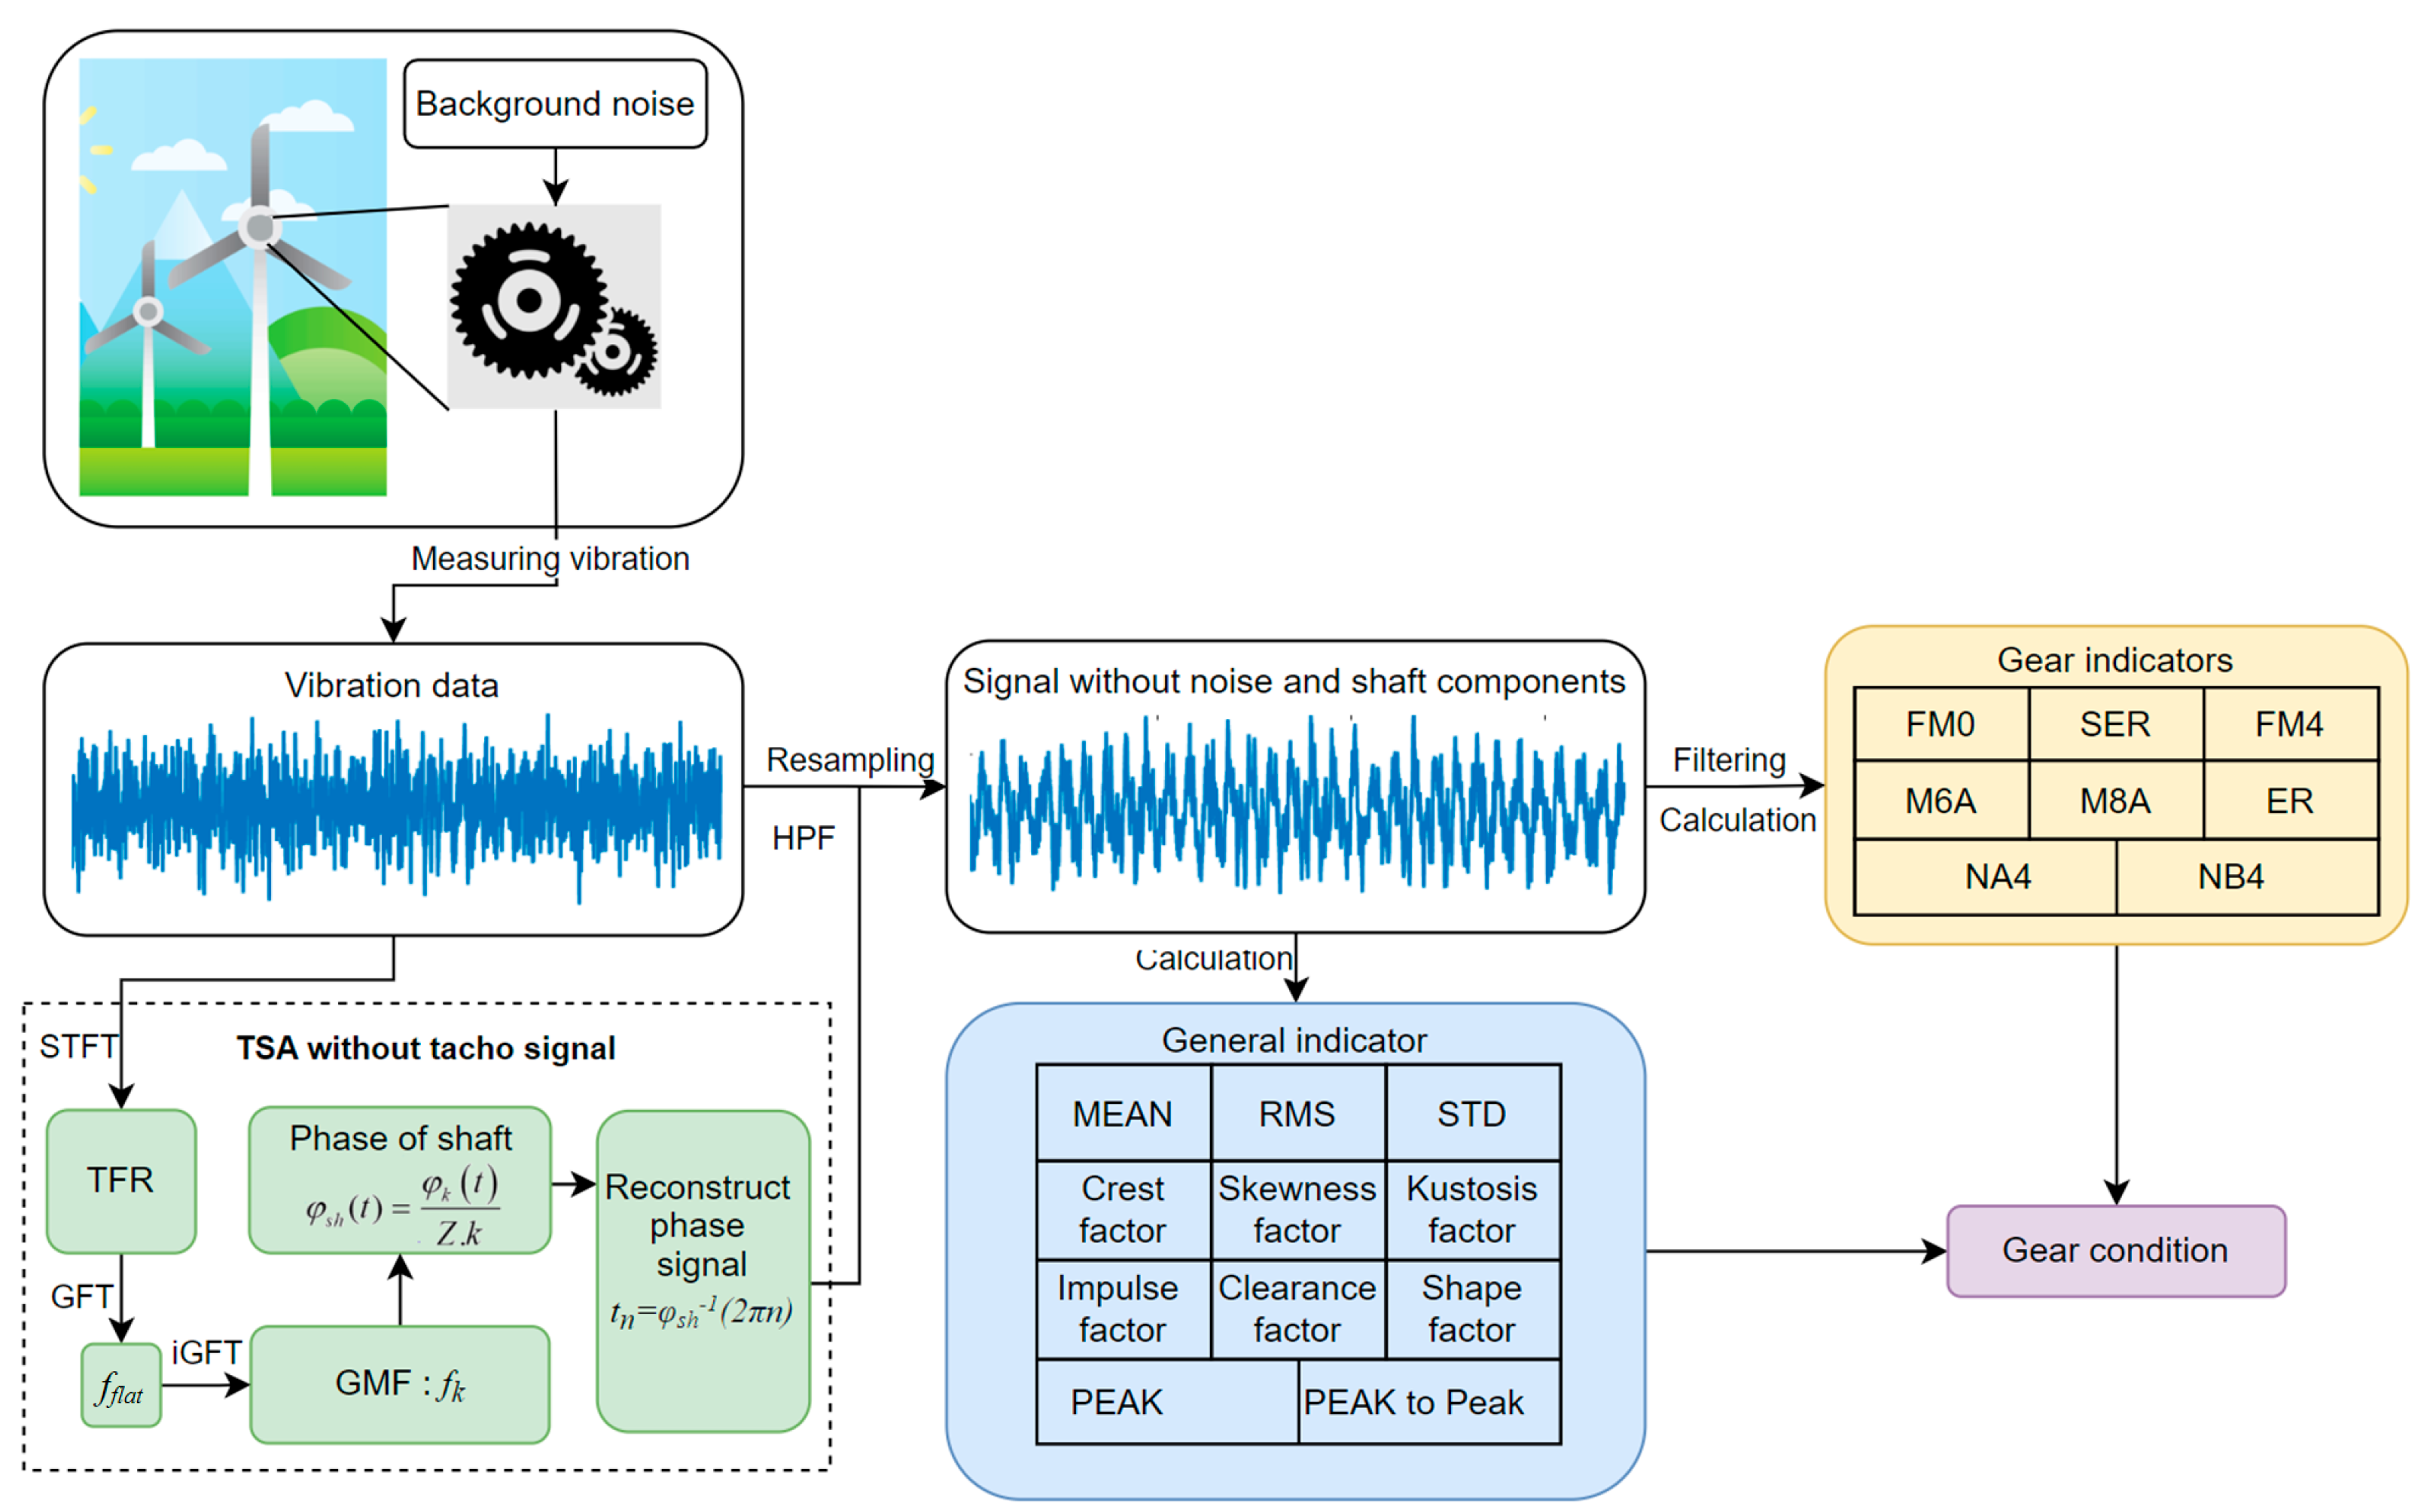
Instead of using a tacho signal, TSA can be calculated using the instantaneous frequency information extracted from the TFR. The TFR captures the time-varying frequency content of a signal, allowing for instantaneous frequency analysis at different times. The TSA algorithm uses the extracted instantaneous frequency to align the signal segments corresponding to the same phase or frequency components. This alignment is performed by resampling the signal segments based on instantaneous frequency estimates, effectively synchronizing the signals.
The TSA without tach signal starting from the Fourier transform is as follows:
X f = + x t e i 2 π f t d t
where x ( t ) is the original signal. Then, the spectrogram of the signal x t   based on STFT is X t , f 2 with X t , f and can be calculated by the following:
X t , f = T w / 2 T T w / 2 x τ γ τ t e j 2 π f τ d τ
where γ ( t ) represents the analysis window function. The TFR is visually inspected to identify the frequency component associated with the rotational speed of the shaft. The frequency curve corresponding to the shaft speed can be determined by analyzing the spectrogram. Subsequently, an algorithm is employed to track the selected component’s peak point, enabling the approximate frequency estimation. The estimation of the instantaneous frequency (IF) can be expressed as follows:
f m a x t = A r g m a x X t , f 2
where f ϵ f t , f t f m a x t d τ δ f , f m a x t d τ + δ f .
In the equation mentioned, δ f represents the frequency tolerance used to detect peak points. X ( t , f ) refers to the STFT of the signal x ( t ) computed at the specified frequency value based on the previous estimation f m a x ( t d τ ) . It is worth noting that when t = 0 , f t should be a predetermined value.
The initial estimation of the IF can be used to calculate the incremental shaft rotation angle signal of the n t h harmonic order. Then, the phase information of the reference shaft can be determined by dividing the above shaft rotation angle signal by n as follows:
φ p ( t ) = 2 π n 0 t f m a x u d u
where the index φ p ( t ) represents the change in the instantaneous phase from time zero.
The IF estimation can be disrupted due to overlapping frequencies. If the sideband and GMF change rapidly, their frequency curves are close to each other, leading to path changes during curve tracking. In such cases, isolating the k t h harmonic frequency components may separate the k t h and k + 1 t h harmonic components.
To address this challenge, this paper proposes the utilization of the Generalized Fourier Transform (GFT) introduced by S. Olhede and A.T. Walden [53]. The GFT can transform time-varying frequency components into time-invariant frequency components. For a signal x ( t ) , the GFT is defined as follows:
X G f = + x t e j 2 π [ f t + x 0 t ] d t
where x 0 ( t ) is a real-valued function dependent on time, representing the signal’s phase. By letting f 0 t = f t d x 0 t d t , the GFT can be written as follows:
X G f = + u t e j 2 π f t d t  
Equation (10) resembles the forward Fourier transform. Consequently, the inverse Fourier transform can be derived as follows:
u t = + X G f e j 2 π f t d f
Hence,
x t = e j 2 π x 0 t + X G f e j 2 π f t d t
By neglecting the amplitude, we have X G f = δ f f 0 ; we obtain the following:
x t = e j 2 π f 0 t + x 0 t
As a result, the time-varying frequency f t of the signal x ( t ) , after applying the GFT, will be transformed into a signal with a flattened frequency f f l a t .

3.2. Flowchart

Based on the analyzed knowledge in the previous chapters, the proposed scheme consists of two main parts as shown in Figure 3:
  • Phase signal reconstruction:
Step 1: The STFT is applied to the measured acceleration signal to obtain the time–frequency distribution quickly.
Step 2: The highest amplitude frequency f m a x is flattened by the general Fourier transform.
Step 3: A band-pass filter separates the flattened frequency.
Step 4: The gear mesh frequency is obtained using inverse GFT to the flattened frequency.
Step 5: Based on GMF, the tacho signal is reconstructed.
Step 6: The signal is filtered by high-pass filtering at 800 Hz to remove the shaft frequency and low-frequency components, which do not represent gear vibration characteristics. Then, TSA is applied to obtain the signal without being affected by the varying shaft speed.
  • Calculating characteristic values:
Step 7: Calculate general indicator and gear characteristic indicators by equation in Section 2.2.
Step 8: These indicators are assessed to conclude gear condition.

4. Experiment Test Results

The gear vibration dataset was designed by Dr. Eric Bechhoefer [54,55]. The dataset is measured from a V90 wind turbine with three blades, capable of generating 3 MW of power. It was gathered at a high sampling rate of 97,656 Hz, providing a detailed resolution of gear vibration patterns. The input shaft rotational speed of the gear system is 30 Hz. The dataset includes six normal and six fault modes with the 960 Hz gear meshing frequency.
Figure 4 and Figure 5 depict the frequency spectrums of the healthy and fault gear vibration datasets. In healthy cases, GMF at 960 Hz with prominent amplitude can be observed, as shown in Figure 4. However, the varying rotational shaft speed causes the blurred effect. The blurring effect also occurs in the case of faulty gears. The frequency spectrum in Figure 5 does not clearly represent GMF and its sideband frequencies. Consequently, without stabilizing the frequency spectrum, it becomes challenging to accurately diagnose the condition of the gears solely based on these visualizations
After executing the first part of the proposed scheme, the TSA signal is obtained as in Figure 6 and Figure 7. Figure 6 depicts that the healthy signals after applying TSA are similar and have stable amplitudes, not changing much. On the other hand, the fault signals have highly fluctuating fractional signals, as shown in Figure 7. Therefore, by observation, the fault condition of the gear can be identified.
Figure 8 shows that the TSA signal with and without the tacho signal are highly similar. Qualitatively, the overall signal is equivalent.
For detailed quantitative assessment, Figure 9 shows the color map of the percentage difference in the feature indicators calculated from the TSA signals with and without the tach signal. In the color map, the blue color represents the low percentage difference, indicating that the difference is small, and the yellow color indicates a high percentage difference. The percentage below 5% is the darkest blue. Some signal samples, which have all the darkest blue percentage values, can completely apply TSA without a tach signal. Feature indicators, which almost have the darkest blue percentage values, are highly reliable, such as MEAN, STD, RMS, KUR, NA4, FM4, M6A, and M8A. Additionally, highly different percentage values are not concentrated in specific indicators but appear randomly. These high values are caused by the error in extracting frequency curves from time–frequency representations. Overall, the amount of low difference values is 88%, which concludes that the TSA proposed scheme is reliable.
Figure 10 depicts the distribution of normalized feature indicator values. The results indicate that most of the statistical features effectively discriminate between faults (represented by “x”) and normal conditions (represented by “o”), such as MEAN, RMS, NA4, and FM4. However, certain features, such as SK, SF, ER, and NB4, do not exhibit such clear distinctions. In addition, the normal gear values are concentrated in a small range of values, whereas the fault gear values are spread over a larger range of values. Moreover, the gear fault values are all larger than the normal values, which can be used to identify gear faults.
Table 3 shows Fisher’s discriminant ratio (FDR) of the proposed scheme results and the reference result in [52]. The results of the two studies are similar. By observing Table 3 and Figure 10, indicators with clear separation give FDR values higher than 1. Both studies showed that the following feature indicators can be used as the basis of diagnostic of gear damage under conditions of varying rotation speed: MEAN, CF, NA4, FM4, KUR, IF, PEAK, RMS, P2P, MF, FM0, M6A, STD, and M8A. Additionally, only gear feature indicators NA4, FM4, FM0, M6A, and M8A should be used to diagnose gear damage under highly varying rotation speed conditions because time feature indicators cannot capture the characteristics of gear mesh frequencies and their sidebands.
To verify the ability to handle variable rotational speed signals, a single-stage gearbox test rig was provided by G. Meltzer and Nguyen Phong Dien [56]. This experiment utilized a back-to-back test rig to assess the impact of tooth faults on gearbox vibrations. More precisely, the pinion, which had 14 teeth, suffered significant pitting that affected 60% of the tooth flank surface. This was conducted to simulate severe wear conditions. To accurately mimic different operational conditions in real-world scenarios, the rotational speed of the gearbox was controlled in two distinct modes: constant and linearly increasing. The vibrational data from these tests were collected using a high-resolution multi-channel data acquisition system, which recorded signals at a sampling rate of 10 kHz with a 32-bit ADC. An accelerometer sensor was placed on the roller bearing housing to detect vibrations originating from faulty gears installed on the driving shaft.
The time-varying rotational speed of the shaft is seen in Figure 11. This is a non-linear problem because the rotating speed of the shaft changes over time. Traditional digital signal processing techniques, such as frequency spectrum and time domain features, have become ineffective. Thus, it is necessary to represent the signal in the time–frequency domain, as depicted in Figure 12.
In Figure 12, the time–frequency distribution clearly highlights the first-order GMF as the predominant feature. This frequency component notably shifts from 120 Hz to 378 Hz in response to the shaft’s rotational speed alteration from 8.6 Hz to 27.3 Hz (Figure 11). Employing the suggested approach to start isolating this first-order GMF component from the time–frequency representation is as follows:
(i)
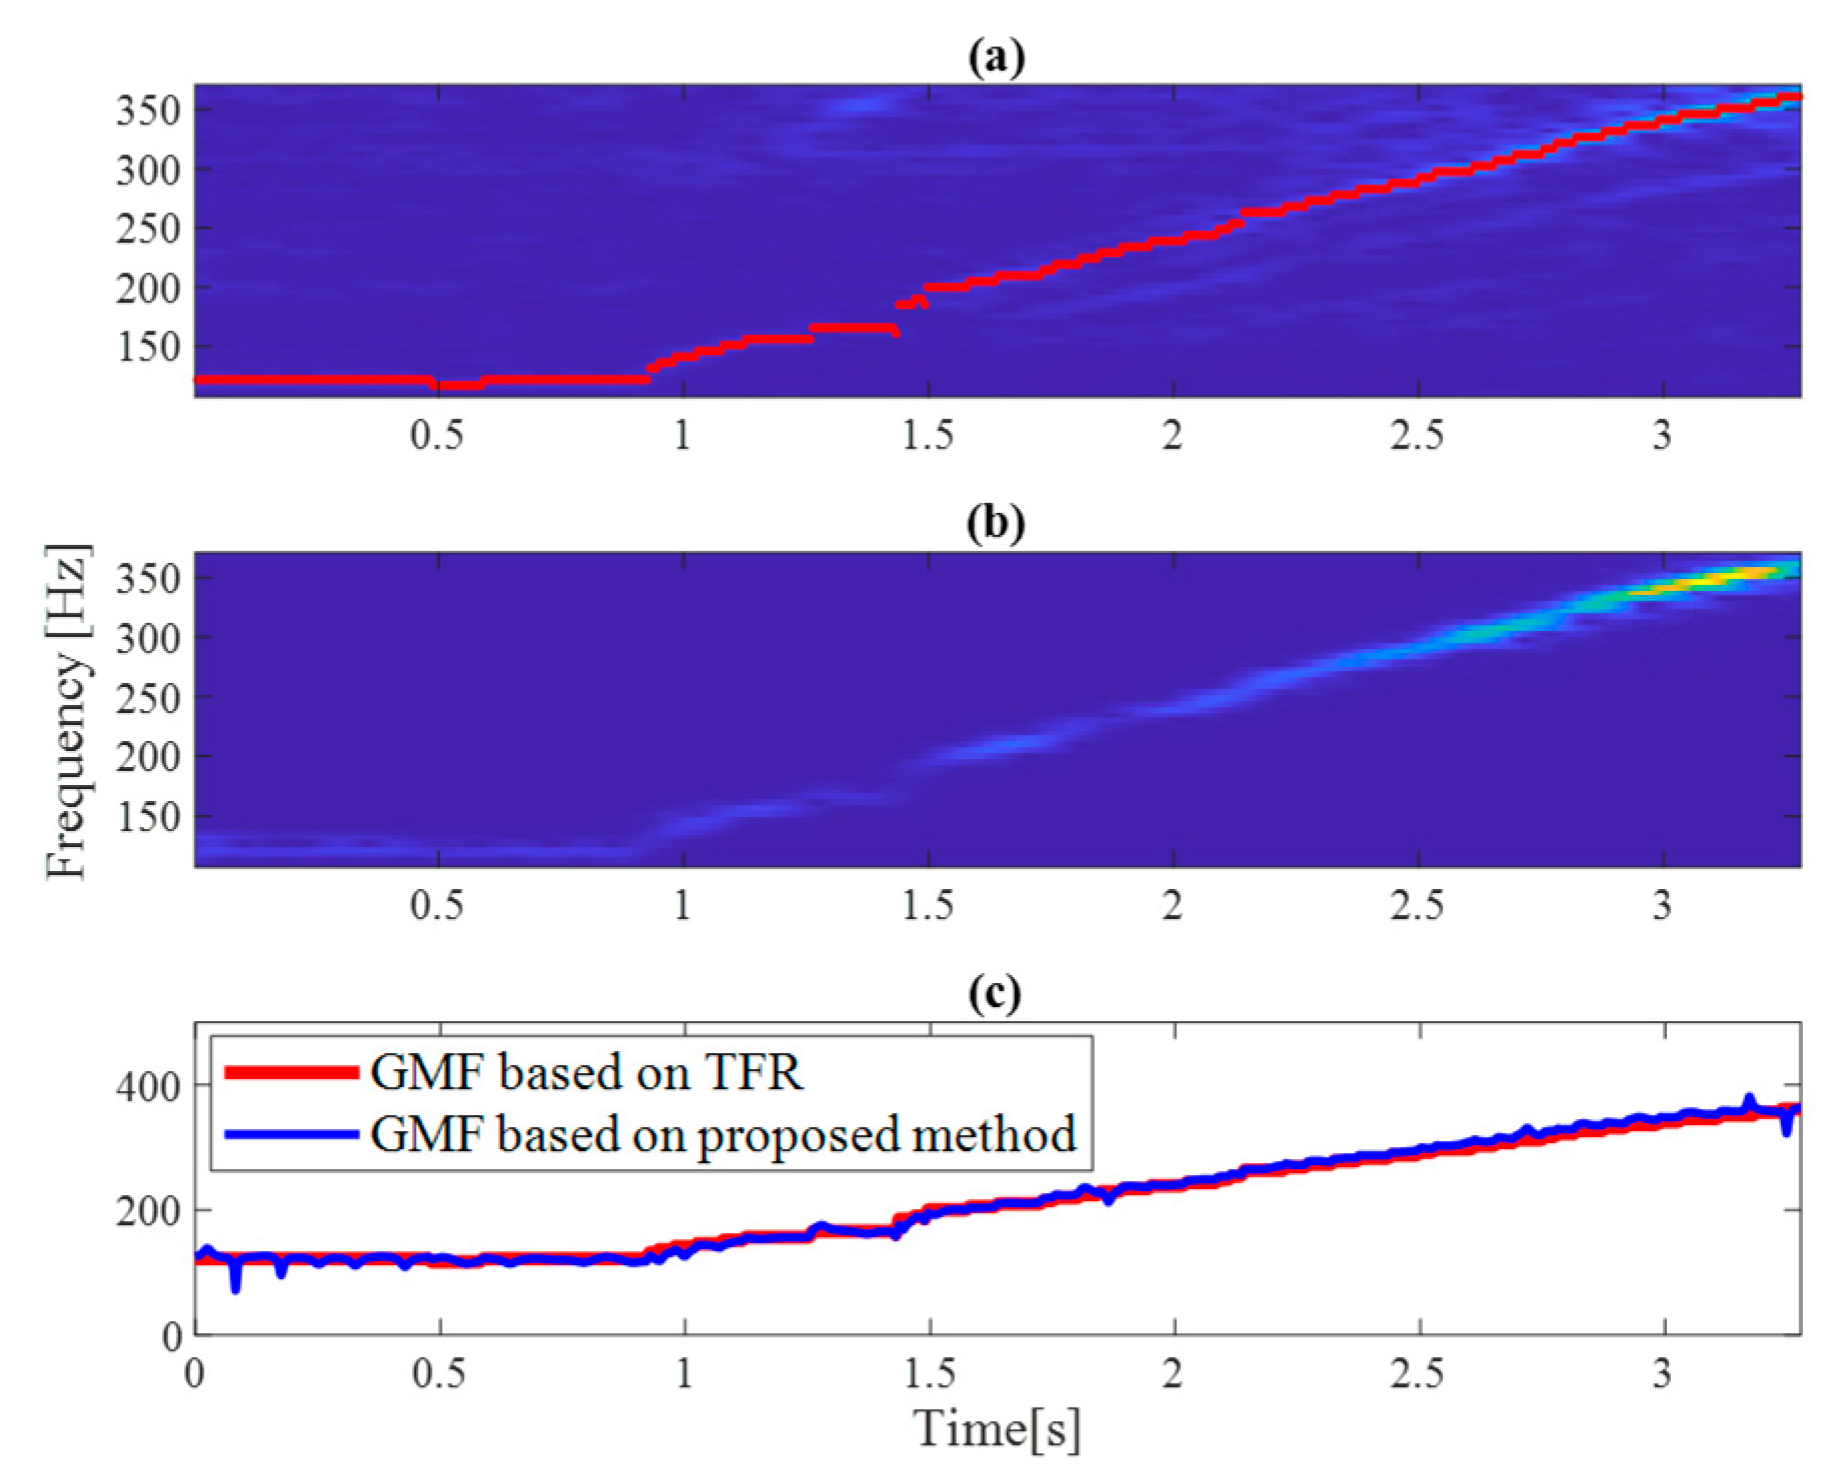
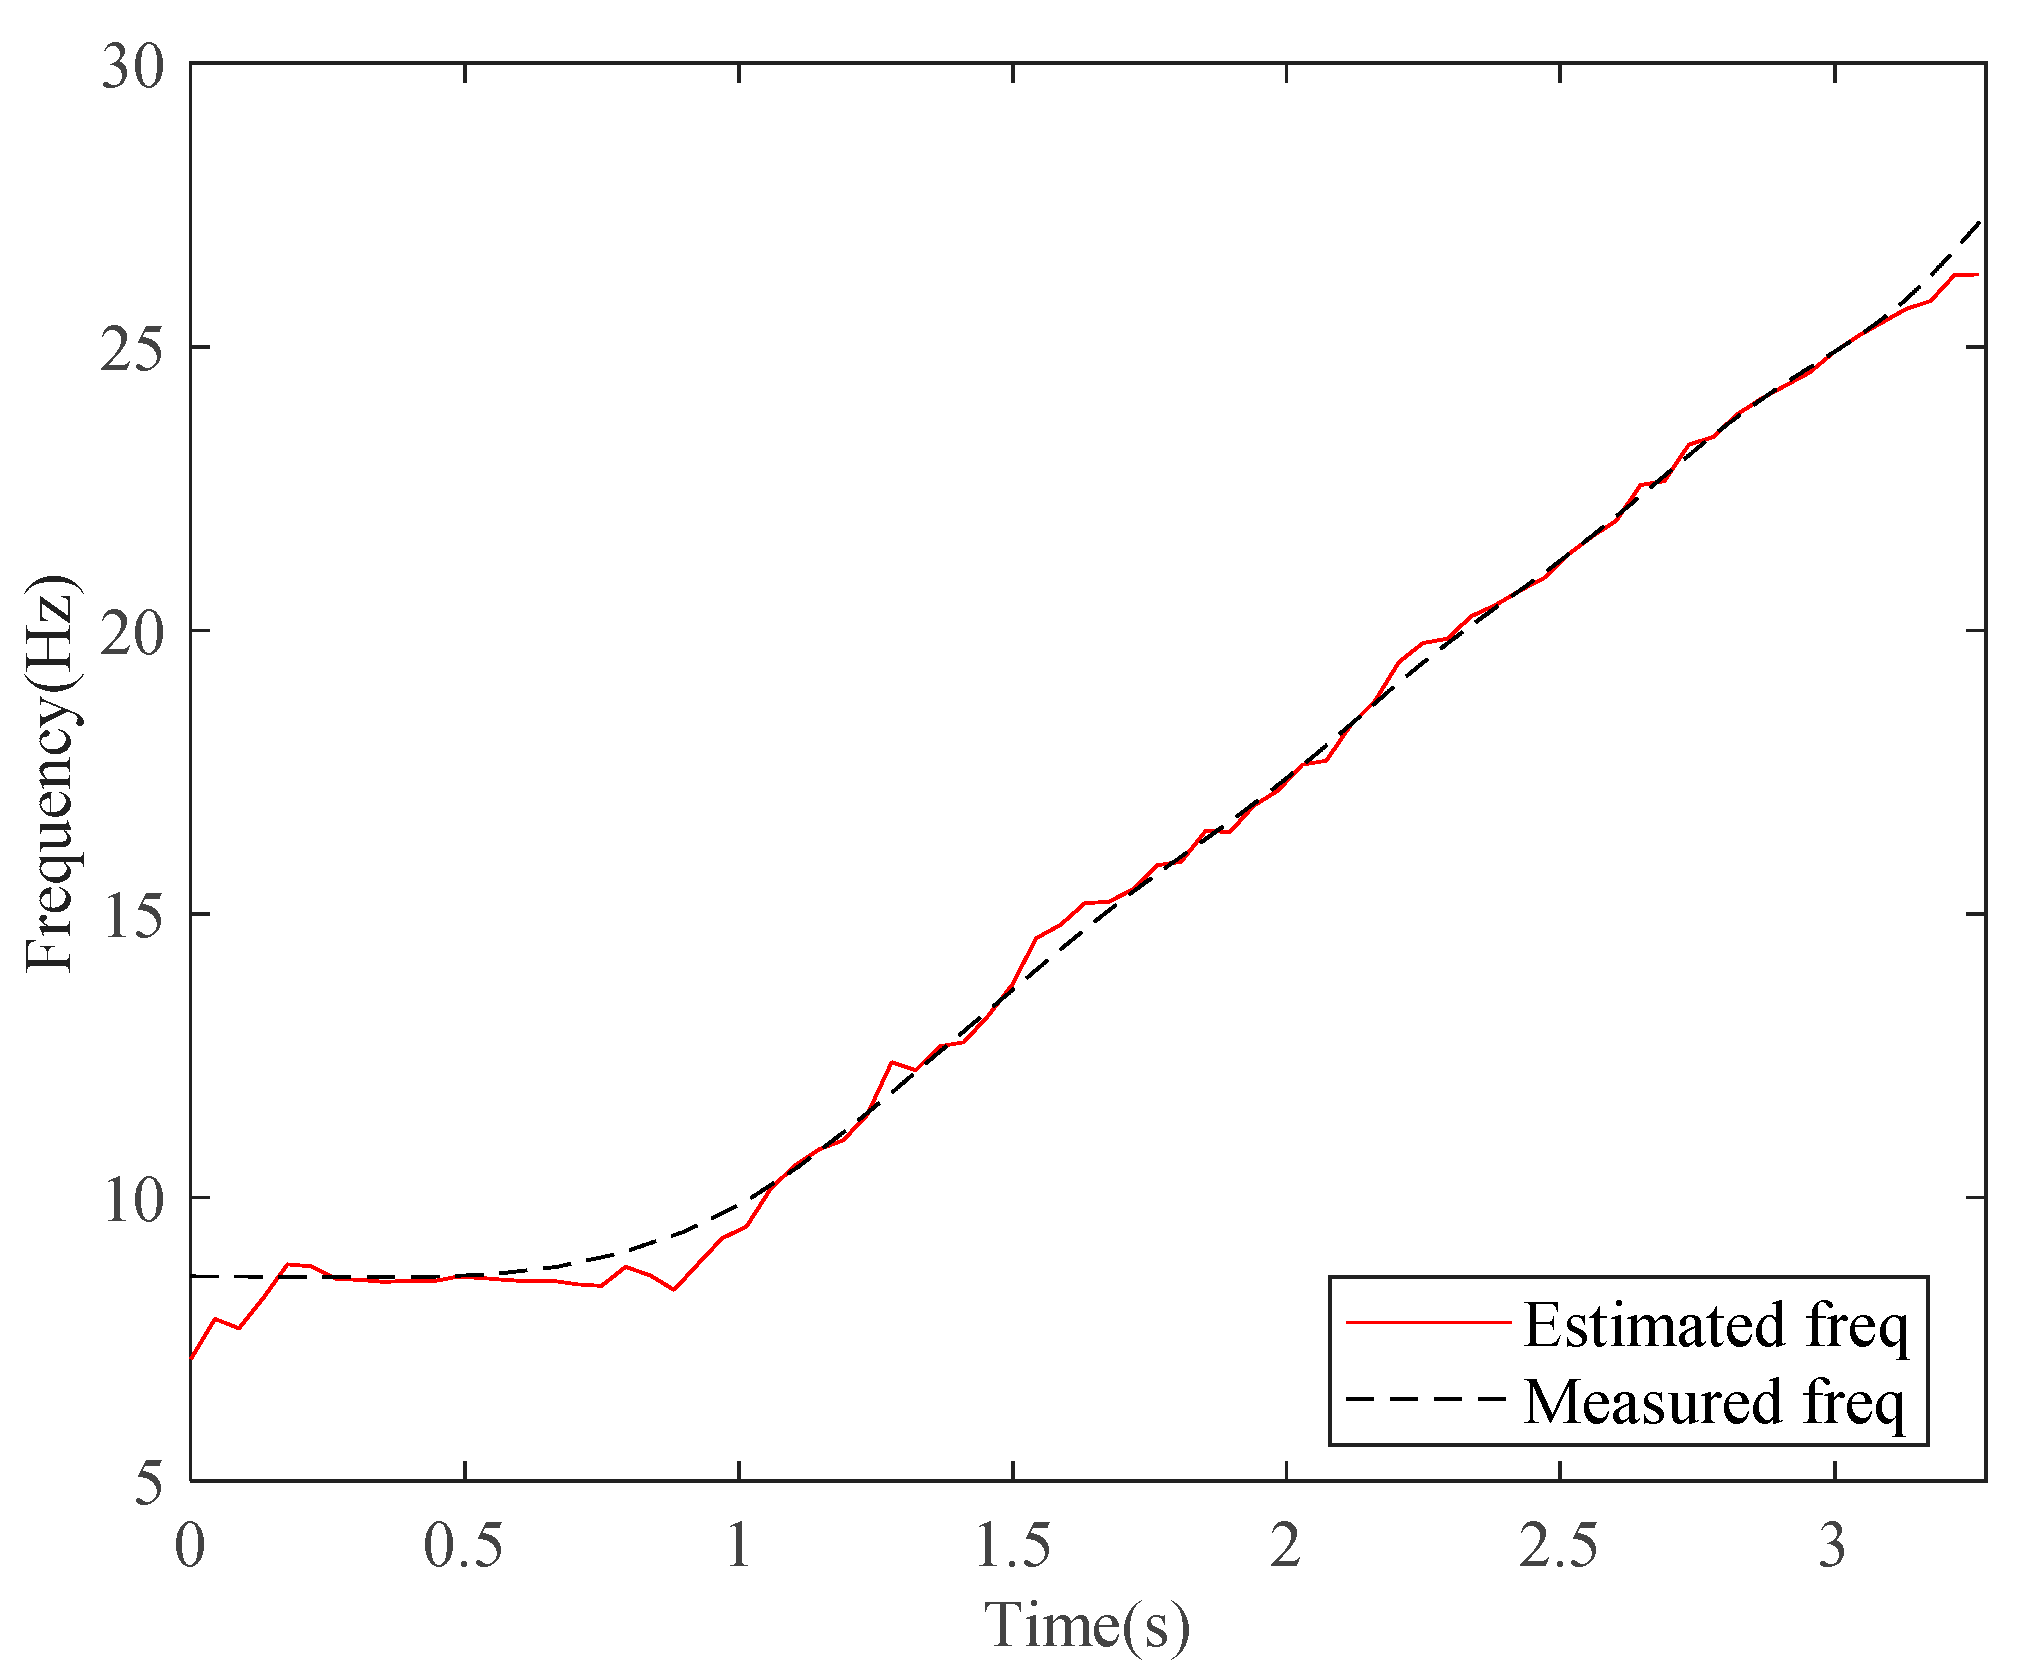
The preliminary GMF estimate obtained from the spectrogram is a red instantaneous frequency curve, as shown in Figure 13a;
(ii)
The frequency components around the first-order meshing frequency are eliminated to obtain a clean first-order GMF, as shown in Figure 13b;
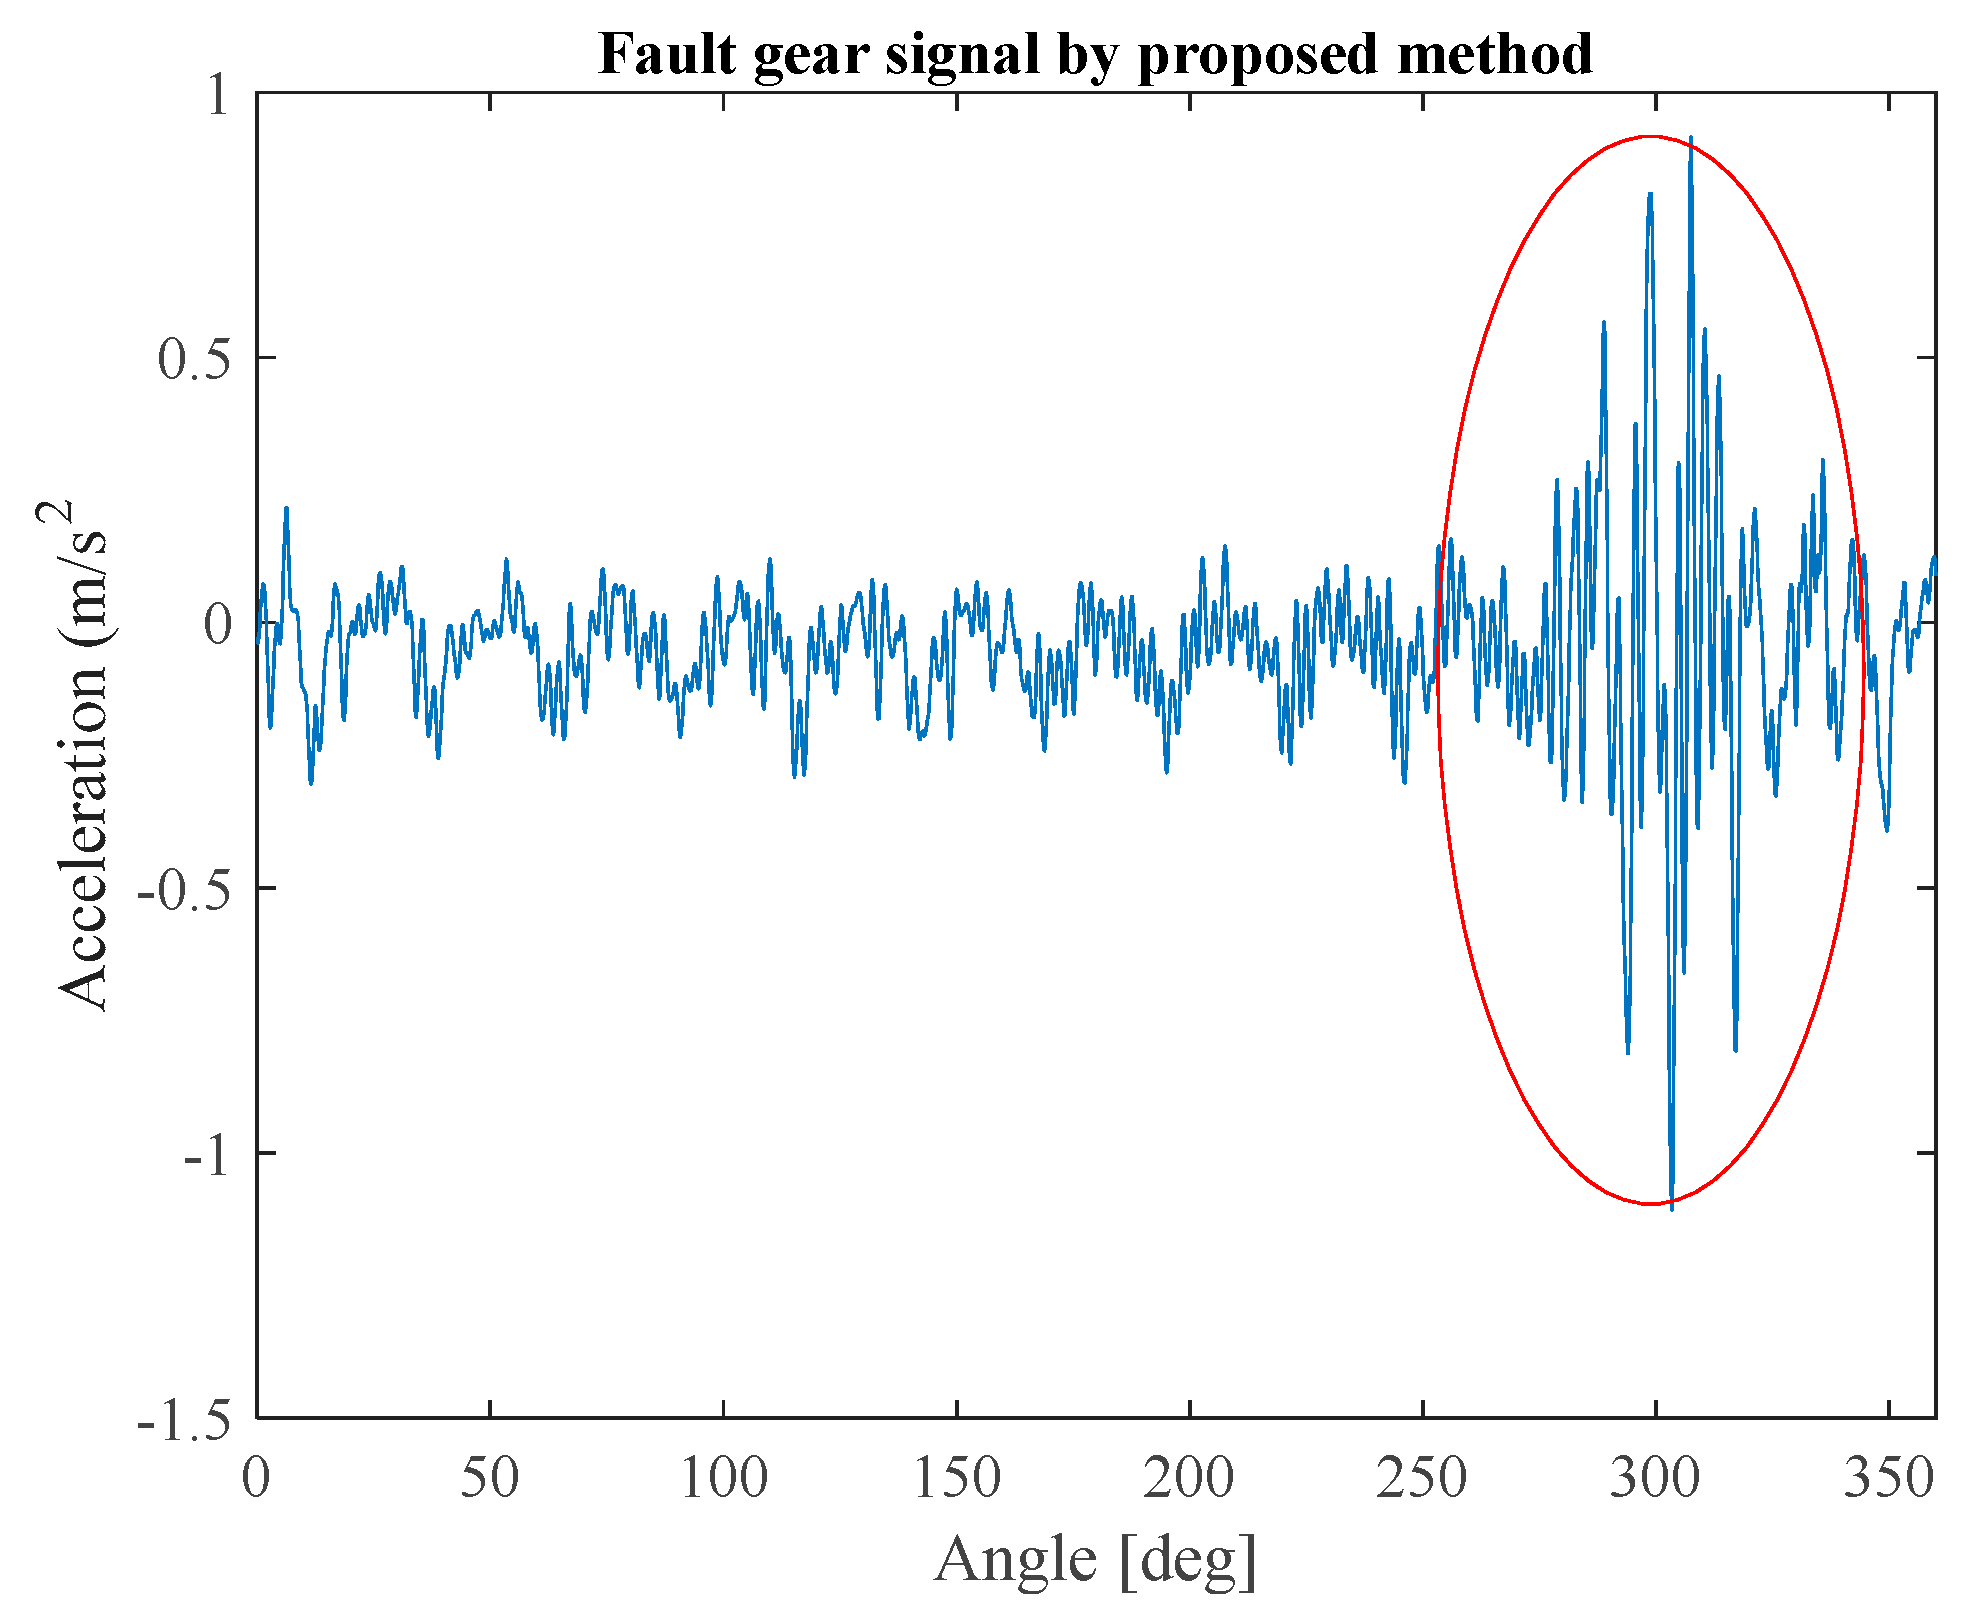
(iii)
The results in Figure 13c clearly indicate that the preliminary estimated GMF components almost fully overlap with the separated GMF components.
The basic concept of the suggested approach for identifying frequency components that display large variations involves a series of complex digital signal processing techniques. Initially, the TFR of the signal is analyzed to identify a key frequency component related to GMF. This understanding is crucial for identifying the appropriate frequency component to isolate. Subsequently, the local maximum technique is utilized to accurately track the dominant gear meshing frequency component, employing the formulation provided in Equation (7). Following the extraction process, the GFT is employed to flatten the identified frequency component to become the constant frequency component, as outlined in Equation (9), which enables easily filtering out the flattened frequency. In order to complete the isolation process, the initial GMF component is reconstructed by using the inverse GFT, as described in Equation (11). This comprehensive strategy efficiently isolates GMF from the TFR of the signal.
To determine the shaft rotational frequency, divide the first-order GMF by the number of teeth (14 teeth). Figure 14 demonstrates a strong correlation between the estimated shaft rotational frequency obtained from the TFR and the actual observed rotational frequency of the shaft. The error between the estimated frequency and the measured frequency is 2.2%.
The phase information can be recovered based on the estimated frequency of shaft rotation. The reconstructed tacho signal is then combined with the initial acceleration signal to perform the TSA method and obtain a TSA signal. The results are shown in Figure 15. The area displaying a significant increase in intensity, shown by the color red, clearly indicates fault gear.

5. Conclusions

This study provides a broad overview of the significance of renewable energy in general and wind turbines in particular. Regarding wind turbine condition monitoring, the gearbox is the most important part that needs attention. Time synchronous averaging is an effective approach to detect any gear fault presented in the gearbox. In a dynamic working environment where wind speeds fluctuate, this method is advantageous since it removes non-periodic elements and only keeps any fault symptoms existing in the diagnosed vibration signal. A novel approach to extract the tacho signal from its measured acceleration signal is constructed using a mathematical model. Subsequently, this article introduces tacholess TSA techniques to address the constraints encountered when tacho signals cannot be recorded. The wind turbine gearbox fault signal analysis results across six measured datasets using the proposed method have shown its effectiveness in cases of stable rotational speeds. To further validate the effectiveness of the proposed method in cases of variable rotational speeds, a publicly available dataset for researchers was utilized. The analysis results indicate that the proposed method successfully detected faults using only a single accelerometer sensor. In addition, the evaluation and quantification of the statistical features of the proposed method are also presented to further demonstrate its powerful capabilities. The results of this research have significant practical consequences, such as cost savings in diagnosis by eliminating the need for additional phase measuring devices. This study can also be expanded to provide effective inputs for automatic fault classifiers, thereby developing online diagnostic tools for wind turbines shortly.

Author Contributions

T.-D.N.: Conceptualization, Formal Analysis, Investigation, Methodology, Software, Writing—original draft, Writing—review and editing, Supervision, and Validation. H.-C.N.: Conceptualization, Investigation, Software, Visualization, Writing—original draft, and Data curation. V.-M.-H.N.: Writing—review and editing and Visualization. P.-D.N.: Data curation, Funding acquisition, Methodology, Project administration, Resources, Supervision, Validation, and Writing—review and editing. All authors have read and agreed to the published version of the manuscript.

Funding

This research received no external funding.

Data Availability Statement

Data are contained within the article.

Conflicts of Interest

The authors declare no conflicts of interest.

Abbreviations

CWTcontinuous wavelet transform
FDRFisher’s discriminant ratio
GFTGeneralized Fourier Transform
GMFgear meshing frequency
IFinstantaneous frequency
STFTShort-time Fourier Transform
TFRtime–frequency representation
TSAtime synchronous averaging

References

  1. Liu, W.Y.; Tang, B.P.; Han, J.G.; Lu, X.N.; Hu, N.N.; He, Z.Z. The Structure Healthy Condition Monitoring and Fault Diagnosis Methods in Wind Turbines: A Review. Renew. Sustain. Energy Rev. 2015, 44, 466–472. [Google Scholar] [CrossRef]
  2. García Márquez, F.P.; Tobias, A.M.; Pinar Pérez, J.M.; Papaelias, M. Condition Monitoring of Wind Turbines: Techniques and Methods. Renew. Energy 2012, 46, 169–178. [Google Scholar] [CrossRef]
  3. Sohoni, V.; Gupta, S.C.; Nema, R.K. A Critical Review on Wind Turbine Power Curve Modelling Techniques and Their Applications in Wind Based Energy Systems. J. Energy 2016, 2016, 8519785. [Google Scholar] [CrossRef]
  4. Salameh, J.P.; Cauet, S.; Etien, E.; Sakout, A.; Rambault, L. Gearbox Condition Monitoring in Wind Turbines: A Review. Mech. Syst. Signal Process. 2018, 111, 251–264. [Google Scholar] [CrossRef]
  5. Moeini, R.; Entezami, M.; Ratkovac, M.; Tricoli, P.; Hemida, H.; Hoeffer, R.; Baniotopoulos, C. Perspectives on Condition Monitoring Techniques of Wind Turbines. Wind Eng. 2019, 43, 539–555. [Google Scholar] [CrossRef]
  6. El-Naggar, M.F.; Abdelhamid, A.S.; Elshahed, M.A.; Bekhet, M.E.S.M. Dynamic Reliability and Availability Allocation of Wind Turbine Subassemblies Through Importance Measures. IEEE Access 2022, 10, 99445–99459. [Google Scholar] [CrossRef]
  7. Faulstich, S.; Hahn, B.; Tavner, P.J. Wind Turbine Downtime and Its Importance for Offshore Deployment. Wind Energy 2011, 14, 327–337. [Google Scholar] [CrossRef]
  8. Blesa, J.; Jiménez, P.; Rotondo, D.; Nejjari, F.; Puig, V. An Interval NLPV Parity Equations Approach for Fault Detection and Isolation of a Wind Farm. IEEE Trans. Ind. Electron. 2015, 62, 3794–3805. [Google Scholar] [CrossRef]
  9. Mcfadden, P.D.; Toozhy, M.M. Application of Synchronous Averaging to Vibration Monitoring of Rolling Element Bearings. Mech. Syst. Signal Process. 2000, 14, 891–906. [Google Scholar] [CrossRef]
  10. McFadden, P.D. A Technique for Calculating the Time Domain Averages of the Vibration of the Individual Planet Gears and the Sun Gear in an Epicyclic Gearbox. J. Sound Vib. 1991, 144, 163–172. [Google Scholar] [CrossRef]
  11. McFadden, P.D. A Revised Model for the Extraction of Periodic Waveforms by Time Domain Averaging. Mech. Syst. Signal Process. 1987, 1, 83–95. [Google Scholar] [CrossRef]
  12. Halim, E.B.; Shoukat Choudhury, M.A.A.; Shah, S.L.; Zuo, M.J. Time Domain Averaging across All Scales: A Novel Method for Detection of Gearbox Faults. Mech. Syst. Signal Process. 2008, 22, 261–278. [Google Scholar] [CrossRef]
  13. Braun, S. The Synchronous (Time Domain) Average Revisited. Mech. Syst. Signal Process. 2011, 25, 1087–1102. [Google Scholar] [CrossRef]
  14. Du, N.T.; Dien, N.P. Advanced Signal Decomposition Methods for Vibration Diagnosis of Rotating Machines: A Case Study at Variable Speed. In Modern Mechanics and Applications, Proceedings of the International Conference on Modern Mechanics and Applications, Ho Chi Minh City, Vietnam, 2–4 December 2020; Lecture Notes in Mechanical Engineering; Springer: Singapore, 2022. [Google Scholar]
  15. McFadden, P.D. Detecting Fatigue Cracks in Gears by Amplitude and Phase Demodulation of the Meshing Vibration. J. Vib. Acoust. 1986, 108, 165–170. [Google Scholar] [CrossRef]
  16. Boulahbal, D.; Golnaraghi, M.F.; Ismail, F. Amplitude and Phase Wavelet Maps for the Detection of Cracks in Geared Systems. Mech. Syst. Signal Process. 1999, 13, 423–436. [Google Scholar] [CrossRef]
  17. Zheng, H.; Li, Z.; Chen, X. Gear Fault Diagnosis Based on Continuous Wavelet Transform. Mech. Syst. Signal Process. 2002, 16, 447–457. [Google Scholar] [CrossRef]
  18. Urbanek, J.; Barszcz, T.; Antoni, J.; Samanta, B.; Al-Balushi, K.R. A Two-Step Procedure for Estimation of Instantaneous Rotational Speed with Large Fluctuations. Mech. Syst. Signal Process. 2013, 38, 96–102. [Google Scholar] [CrossRef]
  19. Lu, S.; Yan, R.; Liu, Y.; Wang, Q. Tacholess Speed Estimation in Order Tracking: A Review with Application to Rotating Machine Fault Diagnosis. IEEE Trans. Instrum. Meas. 2019, 68, 2315–2332. [Google Scholar] [CrossRef]
  20. Thirumala, K.; Umarikar, A.C.; Jain, T. Estimation of Single-Phase and Three-Phase Power-Quality Indices Using Empirical Wavelet Transform. Trans. Power Deliv. 2014, 30, 445–454. [Google Scholar] [CrossRef]
  21. Lin, R.; Liu, Z.; Jin, Y. Instantaneous Frequency Estimation for Wheelset Bearings Weak Fault Signals Using Second-Order Synchrosqueezing S-Transform with Optimally Weighted Sliding Window. ISA Trans. 2021, 115, 218–233. [Google Scholar] [CrossRef] [PubMed]
  22. Meignen, S.; Pham, D.H. Retrieval of the Modes of Multicomponent Signals from Downsampled Short-Time Fourier Transform. IEEE Trans. Signal Process. 2018, 66, 6204–6215. [Google Scholar] [CrossRef]
  23. Nguyen, T.-D.; Nguyen, P.-D. Improvements in the Wavelet Transform and Its Variations: Concepts and Applications in Diagnosing Gearbox in Non-Stationary Conditions. Appl. Sci. 2024, 14, 4642. [Google Scholar] [CrossRef]
  24. Dien, N.P.; Du, N.T. Fault Detection for Rotating Machines in Non-Stationary Operations Using Order Tracking and Cepstrum. In Advances in Engineering Research and Application, Proceedings of the International Conference on Engineering Research and Applications, Thai Nguyen, Vietnam, 1–2 December 2019; Sattler, K.-U., Nguyen, D.C., Vu, N.P., Tien Long, B., Puta, H., Eds.; Springer International Publishing: Cham, Switzerland, 2020; pp. 349–356. [Google Scholar]
  25. Dien, N.P.; Du, N.T. Gear Crack Detection under Variable Rotating Speed Conditions Using a Single Channel Accelerometer. Int. J. Mech. Prod. Eng. Res. Dev. 2020, 10, 127–136. [Google Scholar] [CrossRef]
  26. Du, N.T.; Dien, N.P.; Nga, N.T.T. Gear Fault Detection in Gearboxes Operated in Non-Stationary Conditions Based on Variable Sideband Analysis without a Tachometer. Front. Mech. Eng. 2022, 8, 1021222. [Google Scholar] [CrossRef]
  27. Schmidt, S.; Heyns, P.S.; de Villiers, J.P. A Novelty Detection Diagnostic Methodology for Gearboxes Operating under Fluctuating Operating Conditions Using Probabilistic Techniques. Mech. Syst. Signal Process. 2018, 100, 152–166. [Google Scholar] [CrossRef]
  28. Hamza, B.; Refassi, K. Novel Tacholess Order Tracking Method for Gear Fault Diagnosis under Speed-up and Speed-down Conditions. Insight-Non-Destr. Test. Cond. Monit. 2023, 65, 161–164. [Google Scholar] [CrossRef]
  29. Bonnardot, F.; El Badaoui, M.; Randall, R.B.; Danière, J.; Guillet, F. Use of the Acceleration Signal of a Gearbox in Order to Perform Angular Resampling (with Limited Speed Fluctuation). Mech. Syst. Signal Process. 2005, 19, 766–785. [Google Scholar] [CrossRef]
  30. Combet, F.; Gelman, L. An Automated Methodology for Performing Time Synchronous Averaging of a Gearbox Signal without Speed Sensor. Mech. Syst. Signal Process. 2007, 21, 2590–2606. [Google Scholar] [CrossRef]
  31. Coats, M.D.; Sawalhi, N.; Randall, R.B. Extraction of Tacho Information from a Vibration Signal for Improved Synchronous Averaging. In Proceedings of the Annual Conference of the Australian Acoustical Society 2009—Acoustics 2009: Research to Consulting, Adelaide, Australia, 23–25 November 2009. [Google Scholar]
  32. Urbanek, J.; Barszcz, T.; Sawalhi, N.; Randall, R.B. Comparison of Amplitude-Based and Phase-Based Methods for Speed Tracking in Application to Wind Turbines. Metrol. Meas. Syst. 2011, 18, 11. [Google Scholar] [CrossRef]
  33. Combet, F.; Zimroz, R. A New Method for the Estimation of the Instantaneous Speed Relative Fluctuation in a Vibration Signal Based on the Short Time Scale Transform. Mech. Syst. Signal Process. 2009, 23, 1382–1397. [Google Scholar] [CrossRef]
  34. Zhao, H.; Jiang, Y.; Niu, G. A Tacholess Order Tracking Method Based on Extended Intrinsic Chirp Component Decomposition for Gears under Large Speed Variation Conditions. J. Phys. 2022, 2184, 012052. [Google Scholar] [CrossRef]
  35. Etien, E.; Allouche, A.; Rambault, L.; Doget, T.; Cauet, S.; Sakout, A. A Tacholess Order Analysis Method for Pmsg Mechanical Fault Detection with Varying Speeds. Electronics 2021, 10, 418. [Google Scholar] [CrossRef]
  36. Jing, S.; Luo, Z.; Leng, J.; Wang, Z. Tacholess Order Tracking Method for Gearbox Based on Time-Varying Filter and Energy Centrobaric Correction Method. J. Vibroeng. 2019, 21, 1282–1295. [Google Scholar] [CrossRef]
  37. Xu, L.; Chatterton, S.; Pennacchi, P.; Liu, C. A Tacholess Order Tracking Method Based on Inverse Short Time Fourier Transform and Singular Value Decomposition for Bearing Fault Diagnosis. Sensors 2020, 20, 6924. [Google Scholar] [CrossRef]
  38. Peeters, C.; Leclère, Q.; Antoni, J.; Lindahl, P.; Donnal, J.; Leeb, S.; Helsen, J. Review and Comparison of Tacholess Instantaneous Speed Estimation Methods on Experimental Vibration Data. Mech. Syst. Signal Process. 2019, 129, 407–436. [Google Scholar] [CrossRef]
  39. Schmidt, S.; Heyns, P.S.; de Villiers, J.P. A Tacholess Order Tracking Methodology Based on a Probabilistic Approach to Incorporate Angular Acceleration Information into the Maxima Tracking Process. Mech. Syst. Signal Process. 2018, 100, 630–646. [Google Scholar] [CrossRef]
  40. Han, J.; Gao, H.; Guo, L.; Liu, X.; Wu, T.; Li, S. Bearing Fault Diagnosis Method Based on Order Tracking without Rotational Speed. Xinan Jiaotong Daxue Xuebao/J. Southwest Jiaotong Univ. 2024, 59, 220–228. [Google Scholar] [CrossRef]
  41. Duan, R.; Liao, Y.; Yang, L. Adaptive Tacholess Order Tracking Method Based on Generalized Linear Chirplet Transform and Its Application for Bearing Fault Diagnosis. ISA Trans. 2022, 127, 324–341. [Google Scholar] [CrossRef]
  42. Jiang, Z.; Zhang, K.; Zhang, X.; Xu, Y. A Tacholess Order Tracking Method Based on Spectral Amplitude Modulation for Variable Speed Bearing Fault Diagnosis. IEEE Trans. Instrum. Meas. 2023, 72, 3518708. [Google Scholar] [CrossRef]
  43. Hu, Y.; Tu, X.; Li, F.; Li, H.; Meng, G. An Adaptive and Tacholess Order Analysis Method Based on Enhanced Empirical Wavelet Transform for Fault Detection of Bearings with Varying Speeds. J. Sound Vib. 2017, 409, 241–255. [Google Scholar] [CrossRef]
  44. Wang, Y.; Xu, G.; Luo, A.; Liang, L.; Jiang, K. An Online Tacholess Order Tracking Technique Based on Generalized Demodulation for Rolling Bearing Fault Detection. J. Sound Vib. 2016, 367, 233–249. [Google Scholar] [CrossRef]
  45. Zhao, M.; Lin, J.; Xu, X.; Lei, Y. Tacholess Envelope Order Analysis and Its Application to Fault Detection of Rolling Element Bearings with Varying Speeds. Sensors 2013, 13, 10856. [Google Scholar] [CrossRef] [PubMed]
  46. Du, N.T.; Trung, P.T.; Cuong, N.H.; Dien, N.P. Automatic Rolling Bearings Fault Classification: A Case Study at Varying Speed Conditions. Front. Mech. Eng. 2024, 10, 1341466. [Google Scholar] [CrossRef]
  47. Zhou, Q.; Liu, W.; Wu, C. A Fast Tacho-Less Order Tracking Method for Gear Fault Diagnosis Under Large Rotational Speed Variation Conditions Based on Multi-Stage Generalized Demodulation. In Advances in Mechanical Design: Proceedings of the 2019 International Conference on Mechanical Design, Huzhou, China, 12–14 August 2020; Springer: Singapore, 2020; Volume 77, p. 77. [Google Scholar]
  48. Sun, B.; Li, H.; Wang, C.; Zhang, K.; Chen, S. Current-Aided Dynamic Time Warping for Planetary Gearbox Fault Detection at Time-Varying Speeds. IEEE Sens. J. 2024, 24, 390–402. [Google Scholar] [CrossRef]
  49. Qu, Y.; Zhu, J.; He, D.; Qiu, B.; Bechhoefer, E. Development of a New Acoustic Emission Based Fault Diagnosis Tool for Gearbox. In Proceedings of the PHM 2013—2013 IEEE International Conference on Prognostics and Health Management, Gaithersburg, MD, USA, 24–27 June 2013. [Google Scholar]
  50. Coats, M.D.; Randall, R.B. Compensating for Speed Variation by Order Tracking with and without a Tacho Signal. In Proceedings of the Institution of Mechanical Engineers—10th International Conference on Vibrations in Rotating Machinery, London, UK, 1–13 September 2012. [Google Scholar]
  51. Gerber, T.; Martin, N.; Mailhes, C. Monitoring Based on Time-Frequency Tracking of Estimated Harmonic Series and Modulation Sidebands. In Advances in Condition Monitoring of Machinery in Non-Stationary Operations, Proceedings of the Fourth International Conference on Condition Monitoring of Machinery in Non-Stationary Operations, CMMNO’2014, Lyon, France, 15–17 December 2014; Chaari, F., Zimroz, R., Bartelmus, W., Haddar, M., Eds.; Springer International Publishing: Cham, Switzerland, 2016; pp. 87–98. [Google Scholar]
  52. Sim, J.; Kim, S.; Park, H.J.; Choi, J.H. A Tutorial for Feature Engineering in the Prognostics and Health Management of Gears and Bearings. Appl. Sci. 2020, 10, 5639. [Google Scholar] [CrossRef]
  53. Olhede, S.; Walden, A.T. A Generalized Demodulation Approach to Time-Frequency Projections for Multicomponent Signals. Proc. R. Soc. A 2005, 461, 2159–2179. [Google Scholar] [CrossRef]
  54. Bechhoefer, E.; Kingsley, M.; Menon, P. Bearing Envelope Analysis Window Selection Using Spectral Kurtosis Techniques. In Proceedings of the Prognostics and Health Management (PHM), Denver, CO, USA, 20–23 June 2011; IEEE: Montreal, QC, Canada, 2011; pp. 1–6. [Google Scholar]
  55. Bechhoefer, E.; Van Hecke, B.; He, D. Processing for Improved Spectral Analysis. In Proceedings of the Annual Conference of Prognostics and Health Management Society 2013, New Orleans, LA, USA, 14–17 October 2013. [Google Scholar]
  56. Meltzer, G.; Dien, N.P. Fault Diagnosis in Gears Operating under Non-Stationary Rotational Speed Using Polar Wavelet Amplitude Maps. Mech. Syst. Signal Process. 2004, 18, 985–992. [Google Scholar] [CrossRef]
Figure 1. Wind turbine fire in Vietnam (source: Internet).
Machines 12 00424 g001
Figure 2. Reliability characteristics for different subassemblies in the wind turbine.
Machines 12 00424 g002
Figure 3. Proposed method flowchart.
Machines 12 00424 g003
Figure 4. Spectrum of gear health in 6 cases.
Machines 12 00424 g004
Figure 5. Spectrum of gear fault in 6 cases.
Machines 12 00424 g005
Figure 6. Healthy gear signal analysis by the proposed method.
Machines 12 00424 g006
Figure 7. Fault gear signal analysis by the proposed method.
Machines 12 00424 g007
Figure 8. Compare the TSA with tach to the proposed method in a fault signal case.
Machines 12 00424 g008
Figure 9. The color map shows the percentage difference in statistical features.
Machines 12 00424 g009
Figure 10. Normalized feature indicator values.
Machines 12 00424 g010
Figure 11. Gear fault signal with time-varying speed.
Machines 12 00424 g011
Figure 12. Spectrogram of fault gear signal.
Machines 12 00424 g012
Figure 13. Preliminary GMF estimate (a); extracted GMF from the proposed method (b); comparing results (c).
Machines 12 00424 g013
Figure 14. A comparison of the measured frequency and the estimated frequency.
Machines 12 00424 g014
Figure 15. The proposed tacholess TSA method in a fault gear.
Machines 12 00424 g015
Table 1. Time domain feature indicators.
ValueEquation
Mean M E A N = X N
Root mean square R M S = X 2 N
Standard deviation S T D = ( X X ¯ ) 2 N 1
Peak value P E A K = m a x ( X )
Skewness factor S K = 1 N X X ¯ 3 S T F 3
Kurtosis factor K U R = 1 N ( X X ¯ ) 4 S T F 4
Crest factor C F = P E A K R M S
Clearance factor C L = max X X N 2
Shape factor S F = R M S M E A N
Impulse factor I F = P E A K M E A N
Peak to peak P 2 P = max X m i n ( X )
Table 2. Gear feature indicators.
Value DescriptionEquation
The figure of merits zero F M 0 = P P x i = 1 N h a r P i
Sideband energy ratio S E R = i = 1 N s b S i + + S i P 1
The ratio of the fourth moment to the squared average variance of the residual signal N A 4 = 1 N i = 1 N r e s i r e s ¯ 4 1 M j = 1 M 1 N k = 1 N r e s j k res   j ¯ 2 2
The ratio of the fourth moment to the squared average variance of the GMF-centered filtered signal envelope N B 4 = 1 N i = 1 N s i s ¯ 4 1 M j = 1 M 1 N k = 1 N s j k s j ¯ 2 2 .
Fault detection on a few gear teeth F M 4 = N i = 1 N d i f f i d i f f ¯ 4 i = 1 N d i f f i d i f f ¯ 2 2 .
Surface fault detection on machinery components M 6 A = N 2 i = 1 N d i f f i d i f f ¯ 6 i = 1 N d i f f i d i f f ¯ 2 3
Surface fault detection on machinery components with higher sensitivity M 8 A = N 3 i = 1 N d i f f i d i f f ¯ 8 i = 1 N d i f f i d i f f ¯ 2 4
Energy ratio E R = R M S d i f f i = 1 N h a r { P i + j = 1 N s b S i j + + S i j }
Table 3. Comparing the proposed scheme reference results.
Reference ResultsThe Proposed Scheme Results
FeatureFDR ValueFeatureFDR Value
MEAN57.02MEAN56.98
CF12.13CF10.61
NA49.88NA410.25
FM48.96FM49.25
KUR8.63KUR8.75
IF6.32RMS5.76
PEAK5.98PEAK5.74
RMS5.80IF5.71
P2P4.77P2P4.64
MF4.14MF3.79
FM03.58FM03.37
M6A3.05M6A3.11
STD2.12STD2.11
M8A1.48M8A1.54
ER0.38ER0.38
SER0.28SER0.30
SF0.23SF0.22
NB40.01NB40.01
SK0.00SK0.00
Disclaimer/Publisher’s Note: The statements, opinions and data contained in all publications are solely those of the individual author(s) and contributor(s) and not of MDPI and/or the editor(s). MDPI and/or the editor(s) disclaim responsibility for any injury to people or property resulting from any ideas, methods, instructions or products referred to in the content.

