Article

Comparison of Electromagnetic Performance in Interior Permanent Magnet Motors with Different Central and Bilateral Bridges

School of Electrical and Electronic Engineering, Harbin University of Science and Technology, Harbin 150080, China
*
Author to whom correspondence should be addressed.
Machines 2024, 12(6), 423; https://doi.org/10.3390/machines12060423
Submission received: 25 April 2024 / Revised: 23 May 2024 / Accepted: 29 May 2024 / Published: 19 June 2024
(This article belongs to the Section Electrical Machines and Drives)

Abstract

:
Studies on the central and bilateral bridges of interior permanent magnet (IPM) motors often focus on individual mechanical strength or electromagnetic performance, lacking comparative studies on the electromagnetic performance of motors with different central and bilateral bridges under the same mechanical strength. This paper designs three rotors with different central and bilateral bridges and compares the electromagnetic performance of the three motors. First, to ensure the safe operation of the three rotors at high speeds, the mechanical stress of each rotor has been analyzed using the finite-element method (FEM). Subsequently, the major electromagnetic performances of the three motors are analyzed and compared, including the air-gap flux density, back electromotive force (back-EMF), inductance, salience, torque, power, loss, efficiency, and demagnetization. The results indicate that the rotor without central bridges has the largest leakage flux and the lowest torque but exhibits minimal torque ripple. The rotor with narrower bilateral bridges has the highest torque and maximum torque ripple. The torque performance of the rotor with wider bilateral bridges lies between the two aforementioned motors, and it possesses the highest efficiency. In the end, by adjusting the dimensions of the permanent magnets, the torque of all three models increases, but the motor with narrower bilateral bridges still has the largest torque. These findings provide valuable references for rotor design.

1. Introduction

In recent years, the issue of environmental pollution has prompted a heightened global concern for environmental protection. As a crucial response to this increasingly serious problem, the automotive industry has undergone a significant shift from internal combustion engine vehicles to electric vehicles (EVs) [1,2,3]. The power source of EVs can be obtained from renewable energy systems, such as solar or wind power. This feature holds enormous potential for reducing greenhouse gas emissions and the release of toxic wastes [4]. Permanent Magnet Synchronous Motors (PMSMs), with advantages such as small size, high efficiency, and high power density, have become a key component of EVs [5,6,7,8].
PMSMs can be further categorized into surface permanent magnet (SPM) motors and interior permanent magnet (IPM) motors [9]. SPM motors require the use of a protective sleeve for the permanent magnets (PMs), leading to a substantial increase in manufacturing costs [10]. In contrast, IPM motors, with the PMs located inside the rotor, provide better protection, eliminating the need for additional sheathing for safe operation. Furthermore, the significant difference between the q-axis and d-axis inductance in IPM motors results in a substantial increase in reluctance torque, enhancing overall motor performance. The unique characteristics of IPM motors have made them particularly attractive for integration into EVs [11]. Meanwhile, Fractional slot concentrated windings have been widely utilized mainly due to their increased power density, enhanced efficiency, reduced end-winding lengths, decreased cogging torque, improved field-weakening capability, and fault tolerance. Especially when combined with Fractional slot concentrated windings and IPM motors, it exhibits even better performance [12].
IPM motors are widely used in EVs, such as those manufactured by brands like Toyota, Honda, and Tesla [13,14,15,16], as well as in micro EVs like campus patrol EVs [17,18]. Over the years, the evolving technological requirements of EVs have led to changes in motor specifications. One significant aspect is motor speed, which demonstrates a noticeable trend towards higher rotational speeds. This evolution is exemplified by the transition from the 6000 revolutions per minute (rpm) motor speed in the 2004 Prius to 13,500 rpm in 2010, then further to 17,000 rpm in 2017, and finally reaching 20,000 rpm in the Tesla motor of 2021 [19,20]. The increase in rotational speed introduces a set of novel challenges that encompass both the mechanical strength and electromagnetic performance aspects of the motor.
Currently, substantial research is focused on investigating the impact of bridges on the electromagnetic performance of motors. A detailed study in [21] employs the finite-element method (FEM) to analyze the impact of parameters such as the central and bilateral bridge widths and the PM angles on the electromagnetic performance of motors. However, it overlooks the influence of parameter variations on the mechanical strength of the rotor, resulting in certain rotors failing to achieve the optimal leakage flux coefficient. Consequently, this oversight has repercussions on electromagnetic performance. In [22], the study investigates the impact of different bilateral bridges on average torque and introduces two innovative bilateral bridges. The findings suggest that the proposed bilateral bridges reduce torque ripple while maintaining a constant average torque. However, the mechanical strength of the rotor is not taken into account, leading to a lack of fairness in the comparison. Ref. [23] investigates the influence of different bilateral bridge shapes on electromagnetic performance but similarly overlooks the mechanical strength variations in the rotor caused by changes in the bilateral bridges. Ref. [24] conducts a comprehensive parametric sensitivity study on the impact of rotor geometrical parameters of IPM motors on electromagnetic performance.
Rotor mechanical strength has also been extensively researched. The equivalent circle method is employed to calculate rotor mechanical stress in [25], and the maximum rotor speed is determined through this approach. Ref. [26] investigates the impact of bridge widths and PM angles on the maximum rotor mechanical stress using analytical methods. A precise function has been established to rapidly compute the maximum mechanical stress of the rotor by determining the concentration factor. Comparative analysis with FEM indicates minimal errors associated with this function [27]. A novel model is presented in [28], which integrates the Timoshenko beam theory with an analogous spring network. This unique model is specifically tailored to assess mechanical stress distribution in rotor systems. Ref. [29] discusses various analytical methods for calculating rotor mechanical stress. The above studies primarily focus on individual research on either the electromagnetic performance or the mechanical strength of motors, lacking simultaneous consideration of both aspects.
Ref. [30] compares SPM and IPM motors, revealing that IPM motors exhibit high field-weakening capability and overload capacity, whereas SPM motors demonstrate virtually no overload capacity. Ref. [13] introduces a novel triple-layer PM rotor with a uniform PM size, therefore reducing the manufacturing cost of the rotor. In comparison to a single-layer PM rotor, the proposed rotor exhibits lower losses; however, its cost remains higher than that of the single-layer PM rotor. Ref. [16] introduces a motor design methodology and conducts a comparative analysis of rotors with single-layer, double-layer, and three-layer PMs. The research findings indicate that the single-layer PM rotor provides optimal overall performance. Ref. [31] explores the cross-magnetization impact of various IPM rotor configurations and introduces a rotor structure designed to mitigate the cross-magnetization effect. Ref. [21] conducts a design and comparative investigation of IPM motors featuring various rotor topologies, such as spoke-type PMs, tangential-type PMs, U-shape PMs, and V-shape PMs. The findings suggest that the IPM motor with V-shape PMs exhibits superior performance. The above studies either solely investigate electromagnetic performance or focus on rotor strength, with scarce literature examining the impact of different combinations of central and bilateral bridge widths on motor performance while maintaining consistent rotor strength.
The specific arrangement of this article is as follows. First, three rotors with differing central and bilateral bridge widths will be designed, and a mechanical strength verification will be conducted to ensure that these three rotors possess equivalent mechanical strength under maximum rotational speed. Following this, an analysis and comparison of the no-load performance and load performance of the three motors will be carried out.

2. Motor Specification and Mechanical Stress Analysis

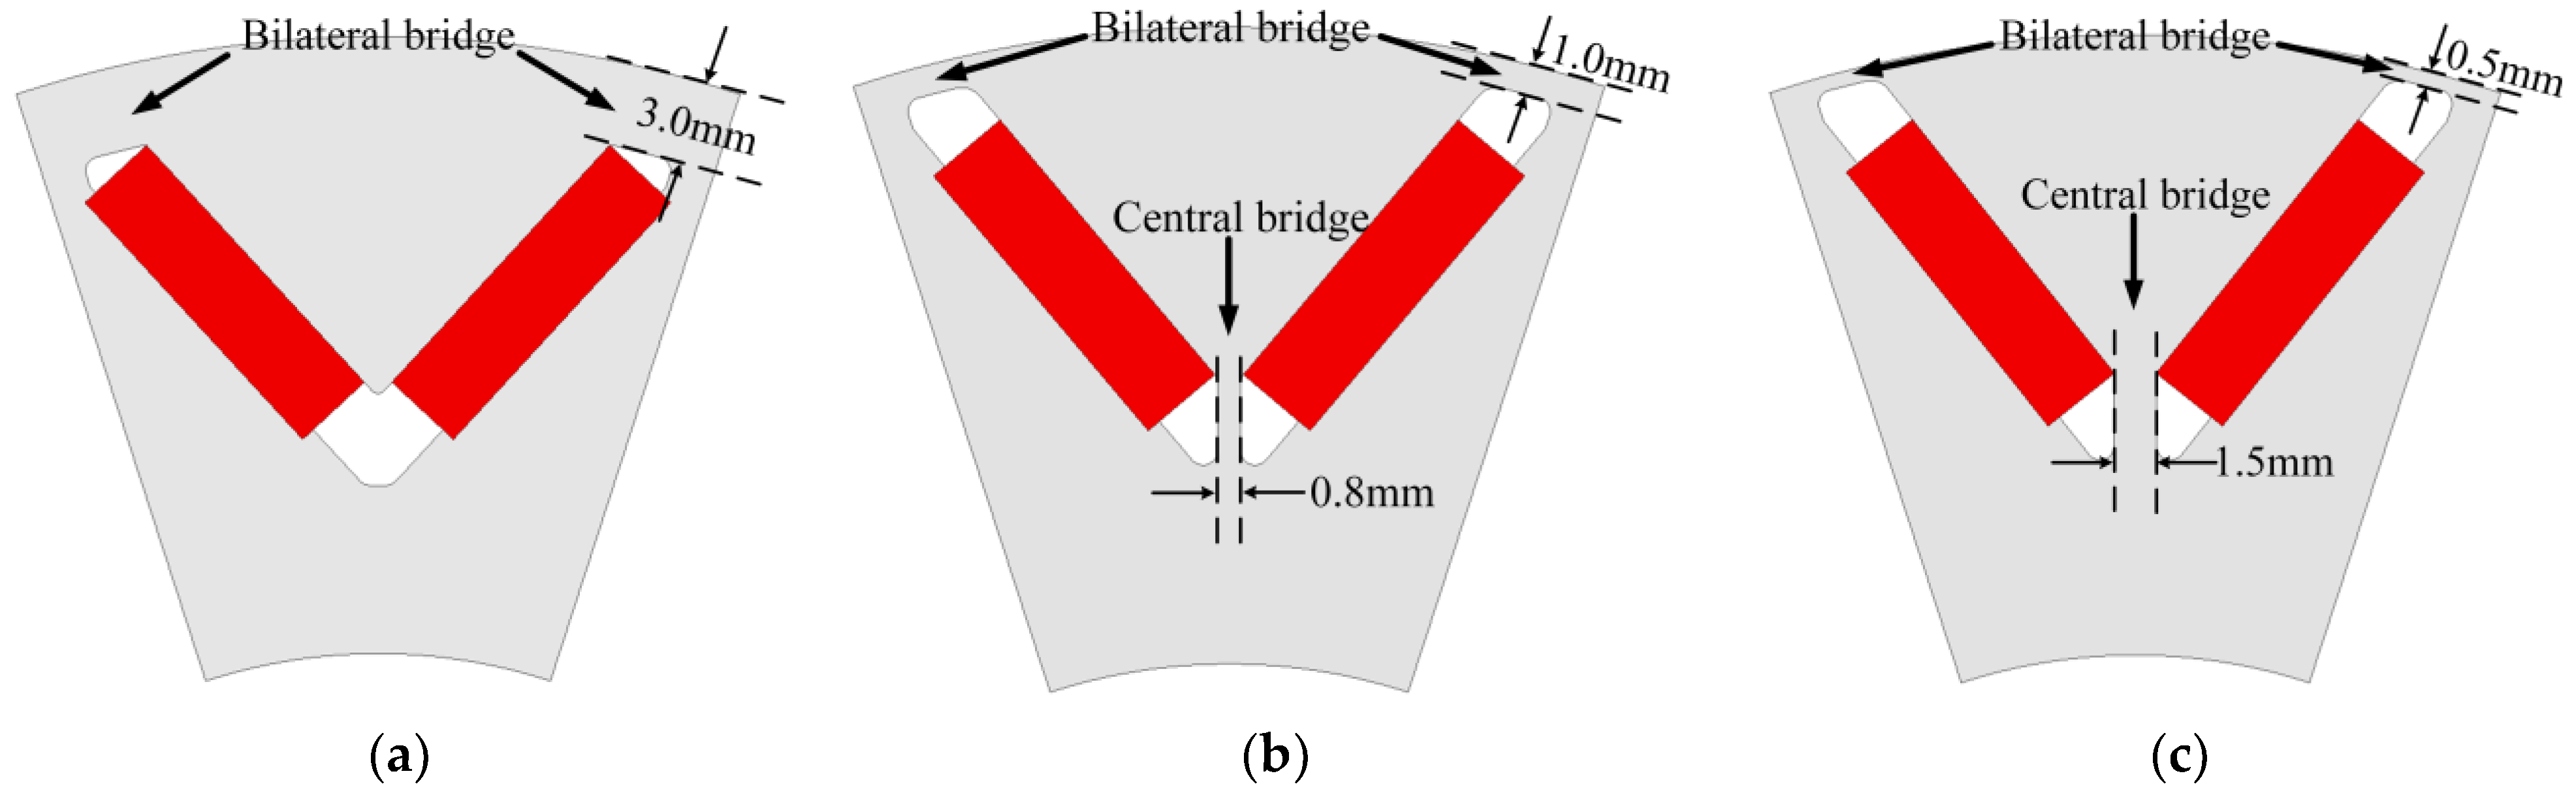
2.1. Motor Specification

Figure 1 illustrates three IPM motors with different rotor designs, denoted as Model A, Model B, and Model C. Model A distinguishes itself by the absence of central bridges, whereas both Model B and Model C integrate central and bilateral bridges. However, in comparison to Model B, Model C features narrower bilateral bridges and wider central bridges. There are various combinations of central and bilateral bridge widths that can meet the mechanical strength requirements of the rotor. However, to highlight the differences in these designs, three models with significantly divergent central and bilateral bridge widths have been selected. The specific widths of the central and bilateral bridges are determined by the mechanical stress analysis in Section 2.2, and the exact values are marked in Figure 1. In terms of other parameters, such as PM dimensions and stator specifications, these three motors remain consistent. The cost of three motors is roughly the same. To decrease the axial length of the motors, the stators of all motors have adopted the same concentrated winding scheme. The main motor parameters are detailed in Table 1. The rated current is 20 A, and the rated speed is 3000 rpm.

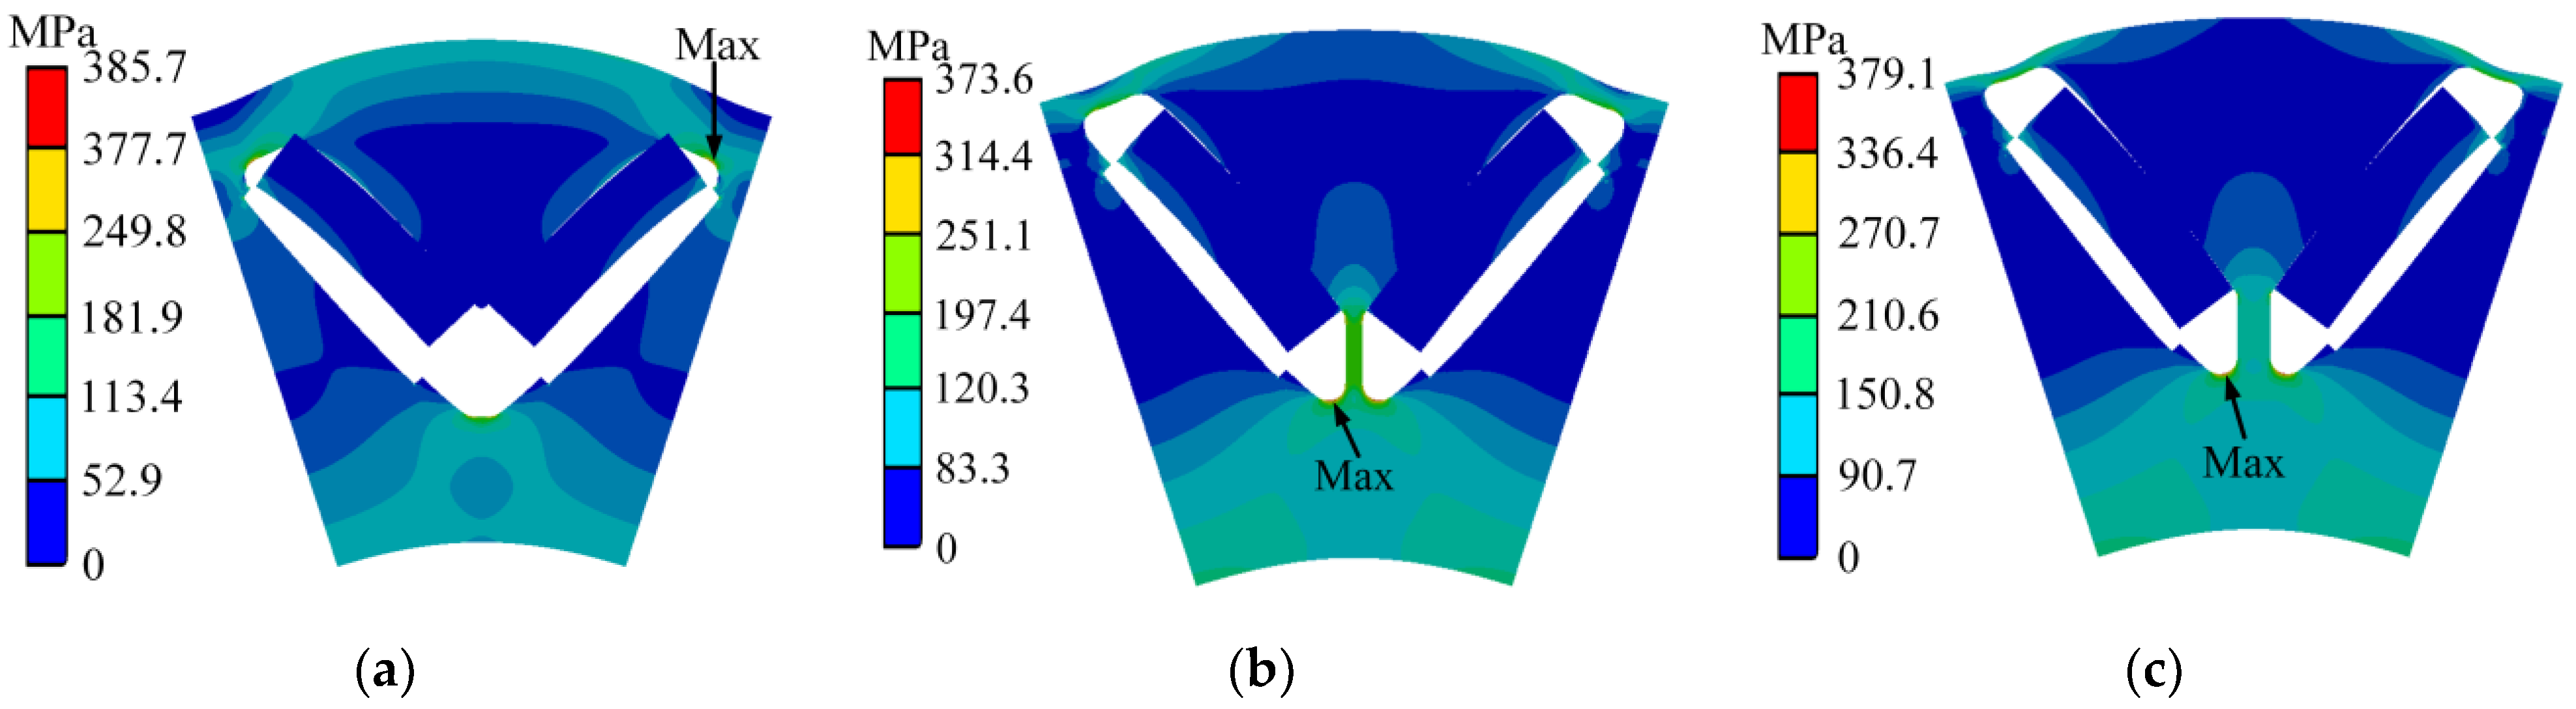
2.2. Mechanical Stress Analysis

To ensure the safe operation of the rotors, finite-element method (FEM) analysis is conducted on the mechanical stress of three rotors at 1.2 times the maximum speed (21,600 rpm). Figure 2 illustrates the mechanical stress distribution of the three rotors. To show the deformation clearly, the deformation has been magnified 200 times. Clearly, Model A exhibits the maximum deformation. After repeatedly adjusting the central and bilateral bridge widths, the maximum mechanical stresses for the three models are 387.5 MPa, 373.6 Mpa, and 379.1 Mpa, respectively. The maximum mechanical stresses of the three models are comparable, meeting the design requirements. The maximum mechanical stress in Model A occurs on the bilateral bridges, whereas in Model B and Model C, it occurs on the central bridges.
The material parameters for the rotor are listed in Table 2. The absence of central bridges in Model A results in increased bilateral bridge widths. Model B and Model C, with central bridges, experience reduced rotor deformation, consequently lowering the mechanical stress on the rotor. Consequently, this leads to a reduction in the combined central and bilateral bridge widths. The sum of the central and bilateral bridge widths at each rotor pole is 6.0 mm, 2.8 mm, and 2.5 mm, respectively. Therefore, among these three models, Model C exhibits the smallest leakage flux, while Model A has the highest leakage flux.

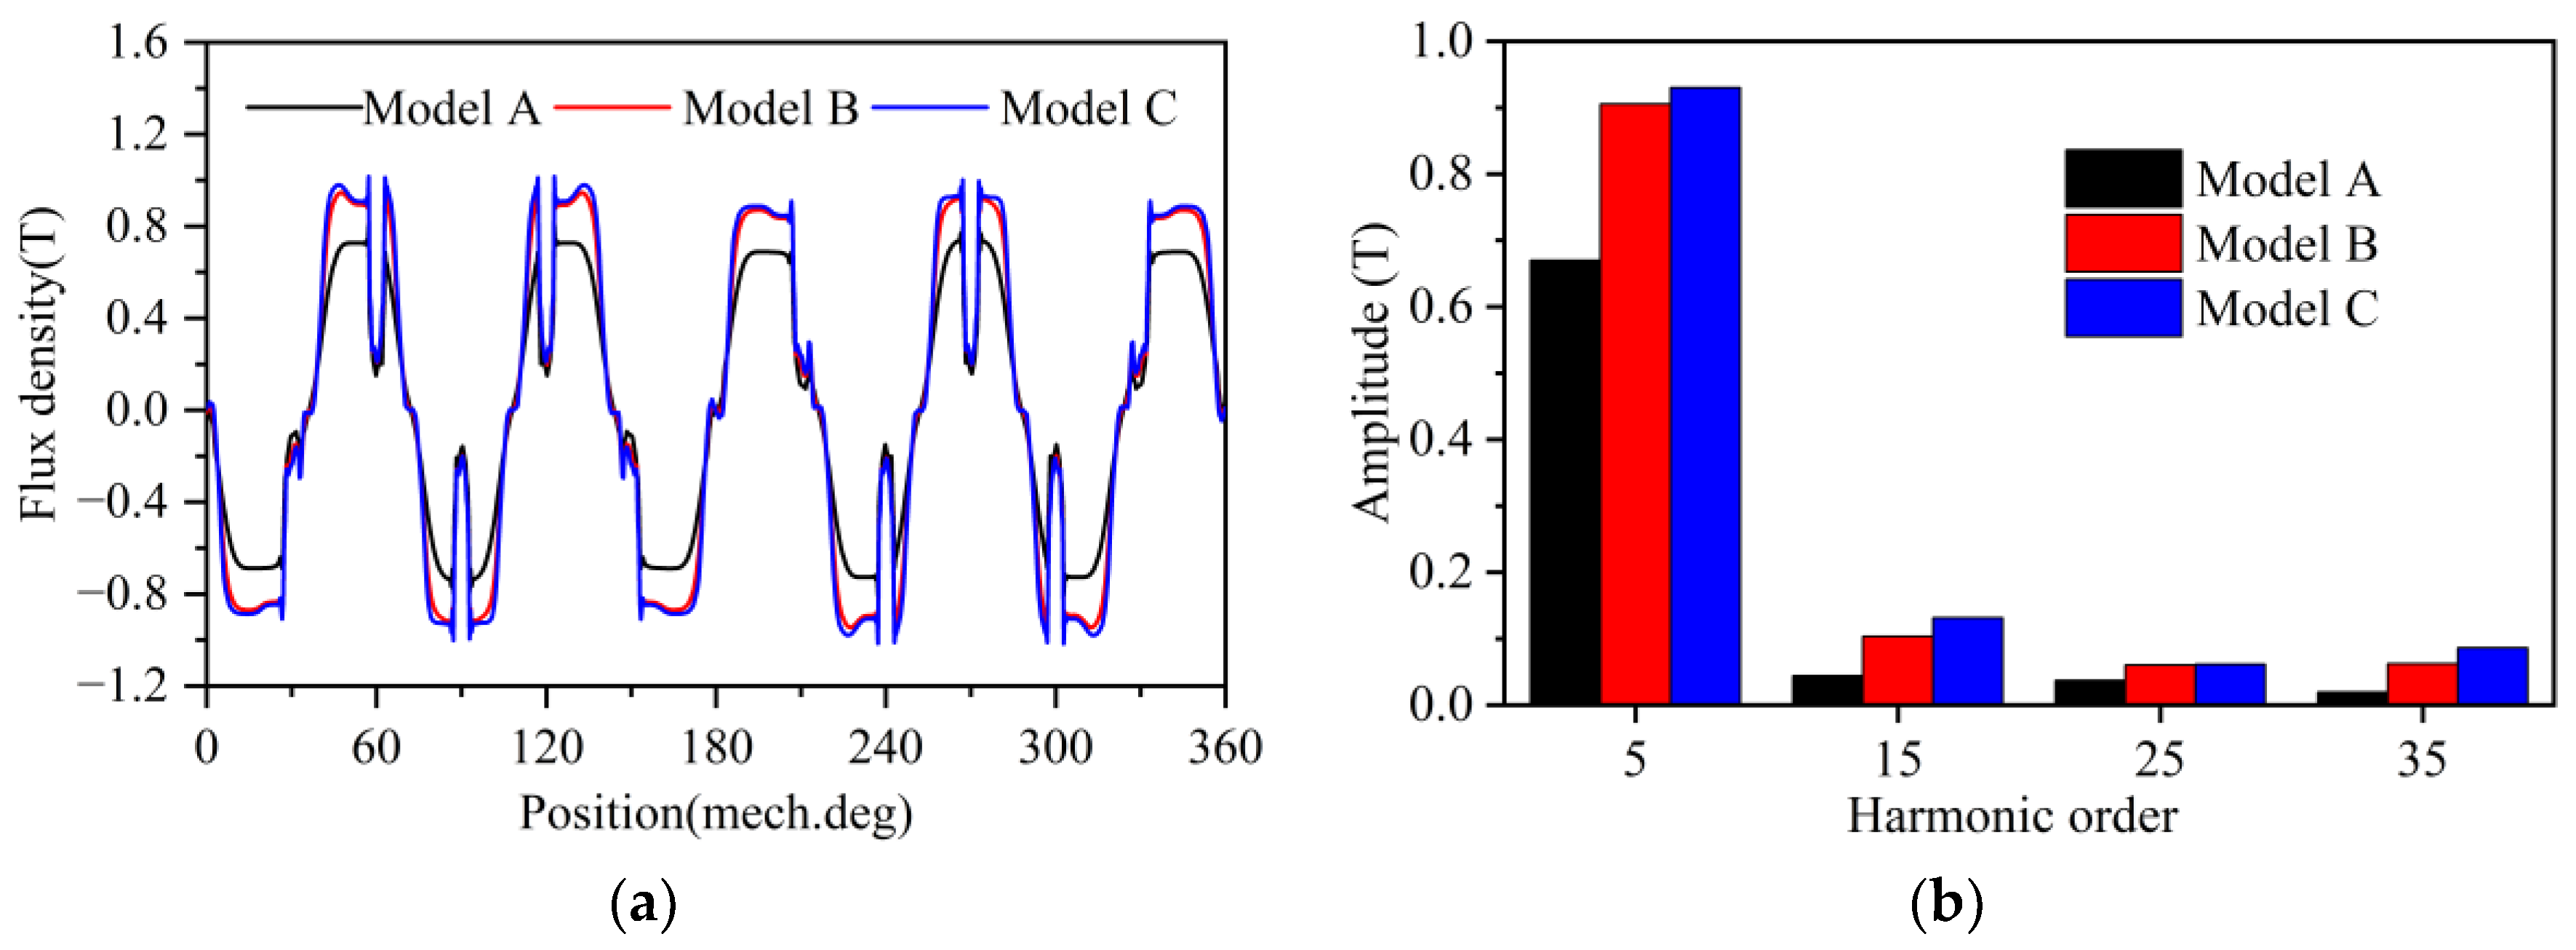
3. Comparison of No-Load Performance

The no-load performance mainly includes the air-gap flux density, back electromotive force (back-EMF), and cogging torque. Figure 3a illustrates the air-gap flux density for three models. Figure 3b depicts the Fourier decomposition of the air-gap flux density. It can be seen that the air-gap flux distribution of Model A is closer to the sinusoidal waveform. Model C, due to its minimal leakage flux, exhibits the highest fundamental amplitude (fifth). However, its harmonic amplitudes also increase. The fundamental amplitudes of the air-gap flux for the three models are 0.67 T, 0.91 T, and 0.93 T, respectively. A larger fundamental amplitude can increase torque density. The total harmonic distortion (THD) of the air-gap flux for the three models is 9.13%, 15.43%, and 18.94%, respectively. High THD can lead to significant torque ripple and losses.
Figure 4 illustrates the back-EMF and harmonic decomposition of three models at 3000 rpm. The waveform of Model A closely resembles a sine wave, and Model C exhibits the highest fundamental and harmonic amplitudes. The back-EMF results of the three models are consistent with the air-gap flux density waveforms. The fundamental amplitudes of the back-EMF for the three models are 135.6 V, 178.4 V, and 183.7 V, respectively.
Figure 5 presents the line voltages of these three models. Due to the Y-type connection of the stator windings, these waveforms do not include the third harmonic and its multiples. The fundamental amplitudes of the line voltages for the three models are 234.5 V, 309.1 V, and 316.0 V, respectively.
The phenomenon of cogging torque, arising from the interaction between the stator teeth and the rotor PMs, poses a significant challenge in motor design. Its presence frequently results in undesirable consequences, notably the elevation in torque ripple. Techniques such as skewed slots or skewed poles are frequently utilized to address stringent design criteria and alleviate cogging torque.
The cogging torque waveforms of the three models are shown in Figure 6. Due to the increased air-gap flux density, the cogging torque of Model B and Model C significantly increases compared to Model A. The peak-to-peak values of the cogging torque for the three models are 204.2 mNm, 386.2 mNm, and 490.6 mNm, respectively.

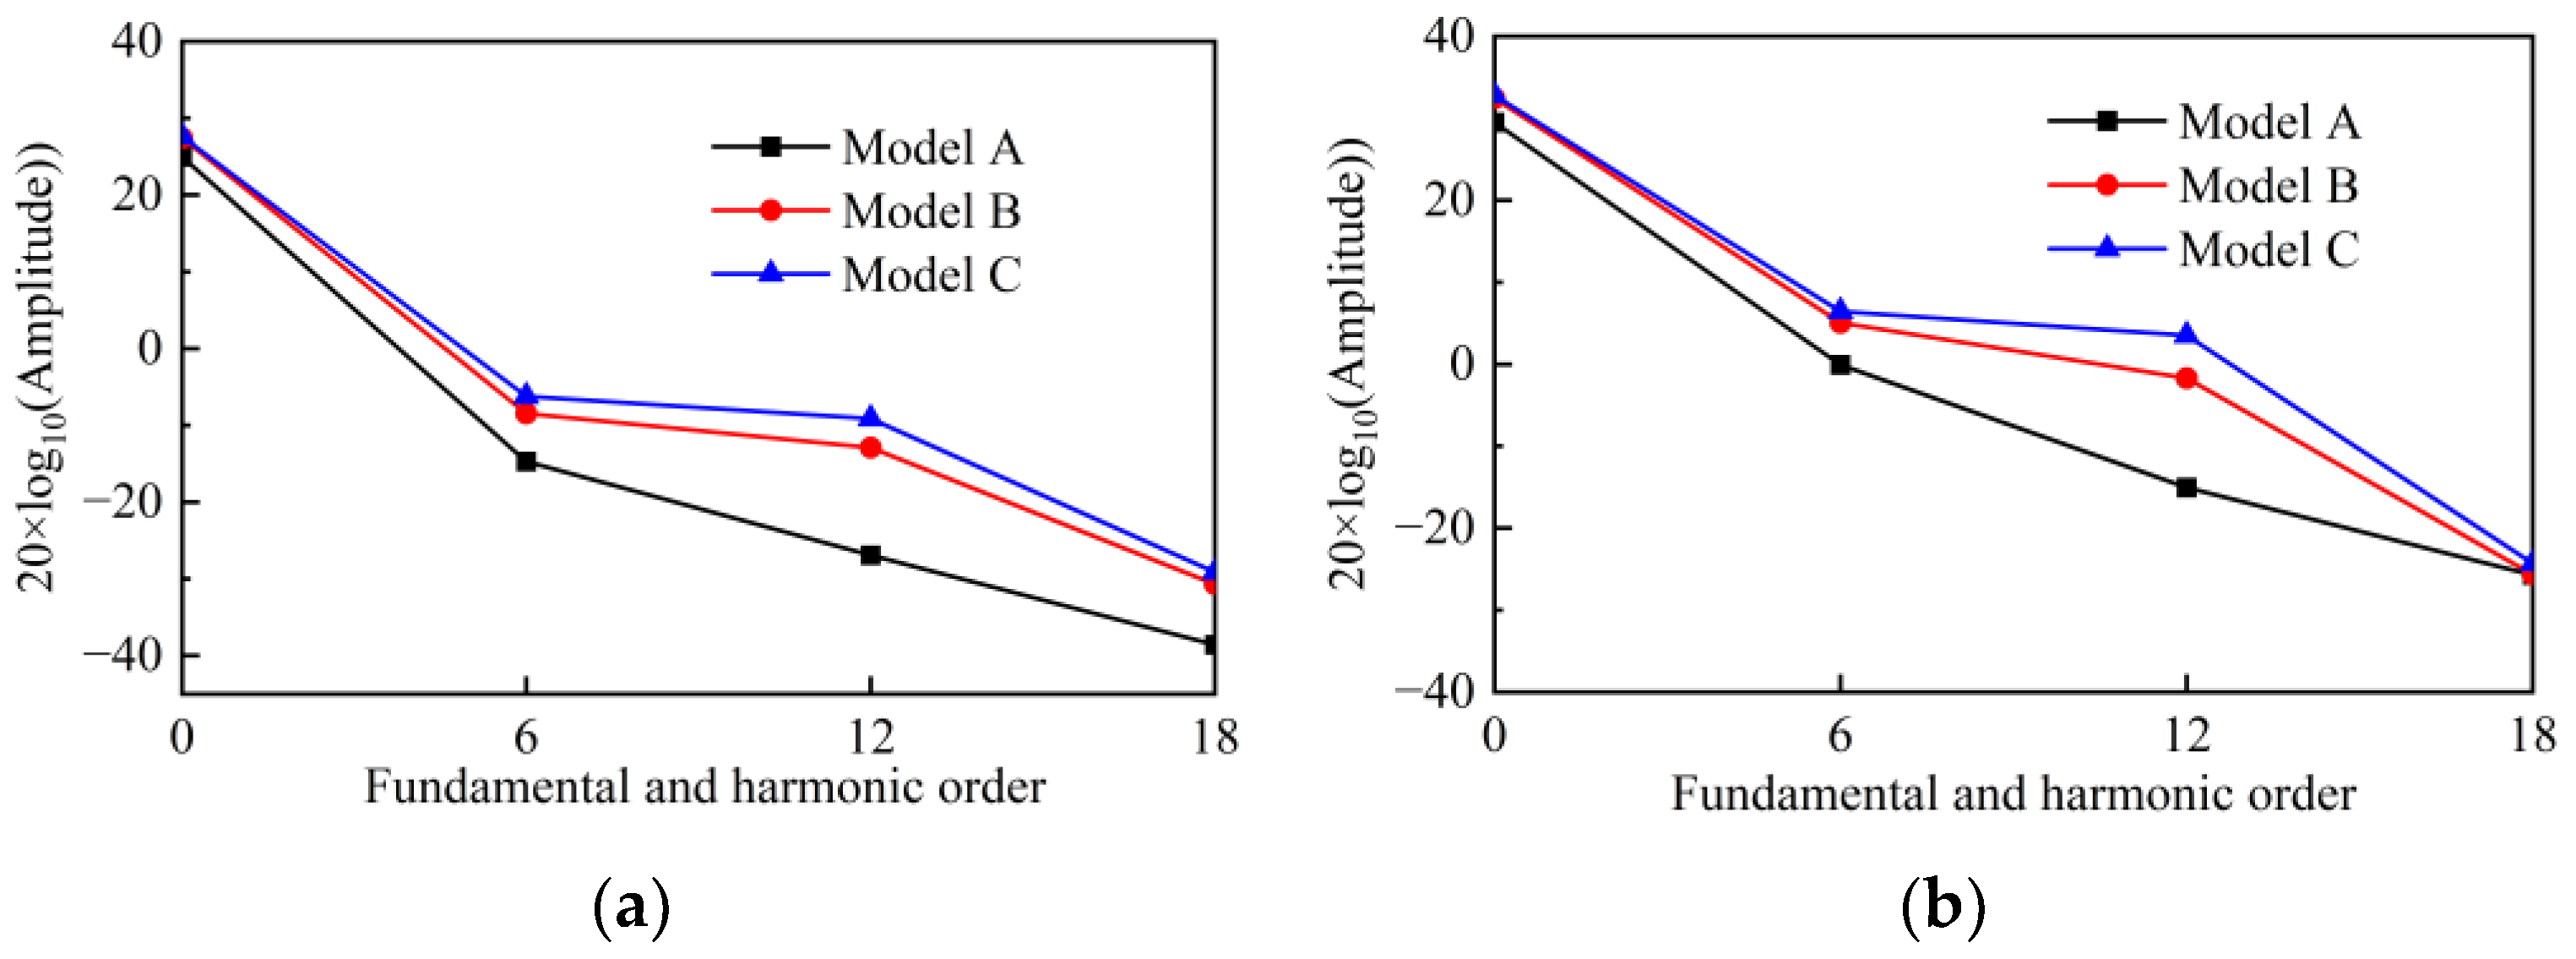
4. Comparison of Load Performance

4.1. Inductance and Salience

Salience is defined as the discrepancy between the d-axis inductance (Ld) and the q-axis inductance (Lq). A high level of salience is essential for achieving elevated torque output and extending the constant power region. Ld and Lq are defined separately.
L d = ψ d ψ P M i d L q = ψ q i q
where ψd and ψq represent the d-axis and q-axis magnetic flux, respectively. ψPM is defined as the magnetic flux generated by PMs. id and iq represent the d-axis and q-axis currents, respectively.
Figure 7a shows the variation of Ld with current. As the current increases, the motor gradually tends to saturate, leading to a decrease in Ld for all three models. Model A demonstrates the highest Ld, which can be attributed to its widest bilateral bridges. Conversely, Model C, characterized by the smallest total widths of central and bilateral bridges, exhibits the minimum Ld. At the rated current of 20 A, the Ld values for the three models are 4.09 mH, 3.53 mH, and 3.43 mH, respectively.
Figure 7b illustrates the variation of Lq with current. Similarly, as the current increases, the Lq values decrease for all three models. Model A has the largest Lq, while the Lq values for Model B and Model C are approximately the same. At the rated current of 20 A, the Lq values of the three models are 4.49 mH, 4.318 mH, and 4.319 mH, respectively. When the current is 40 A, the Lq values of the three models tend to be identical.
Figure 7c shows the variation of salience with current. Due to Model C having the minimum Ld, it results in Model C having the maximum salience. At the rated current of 20 A, the salience values of the three models are, respectively, 0.40 mH, 0.788 mH, and 0.889 mH. As the current increases due to the saturation of the motor, the salience of Model A first becomes less than zero, and then, nearing 40 A, the salience of Model B turns less than zero. The salience of Model C remains consistently greater than zero. The salience of less than zero results in the reluctance torque becoming negative, leading to a degradation in motor performance.

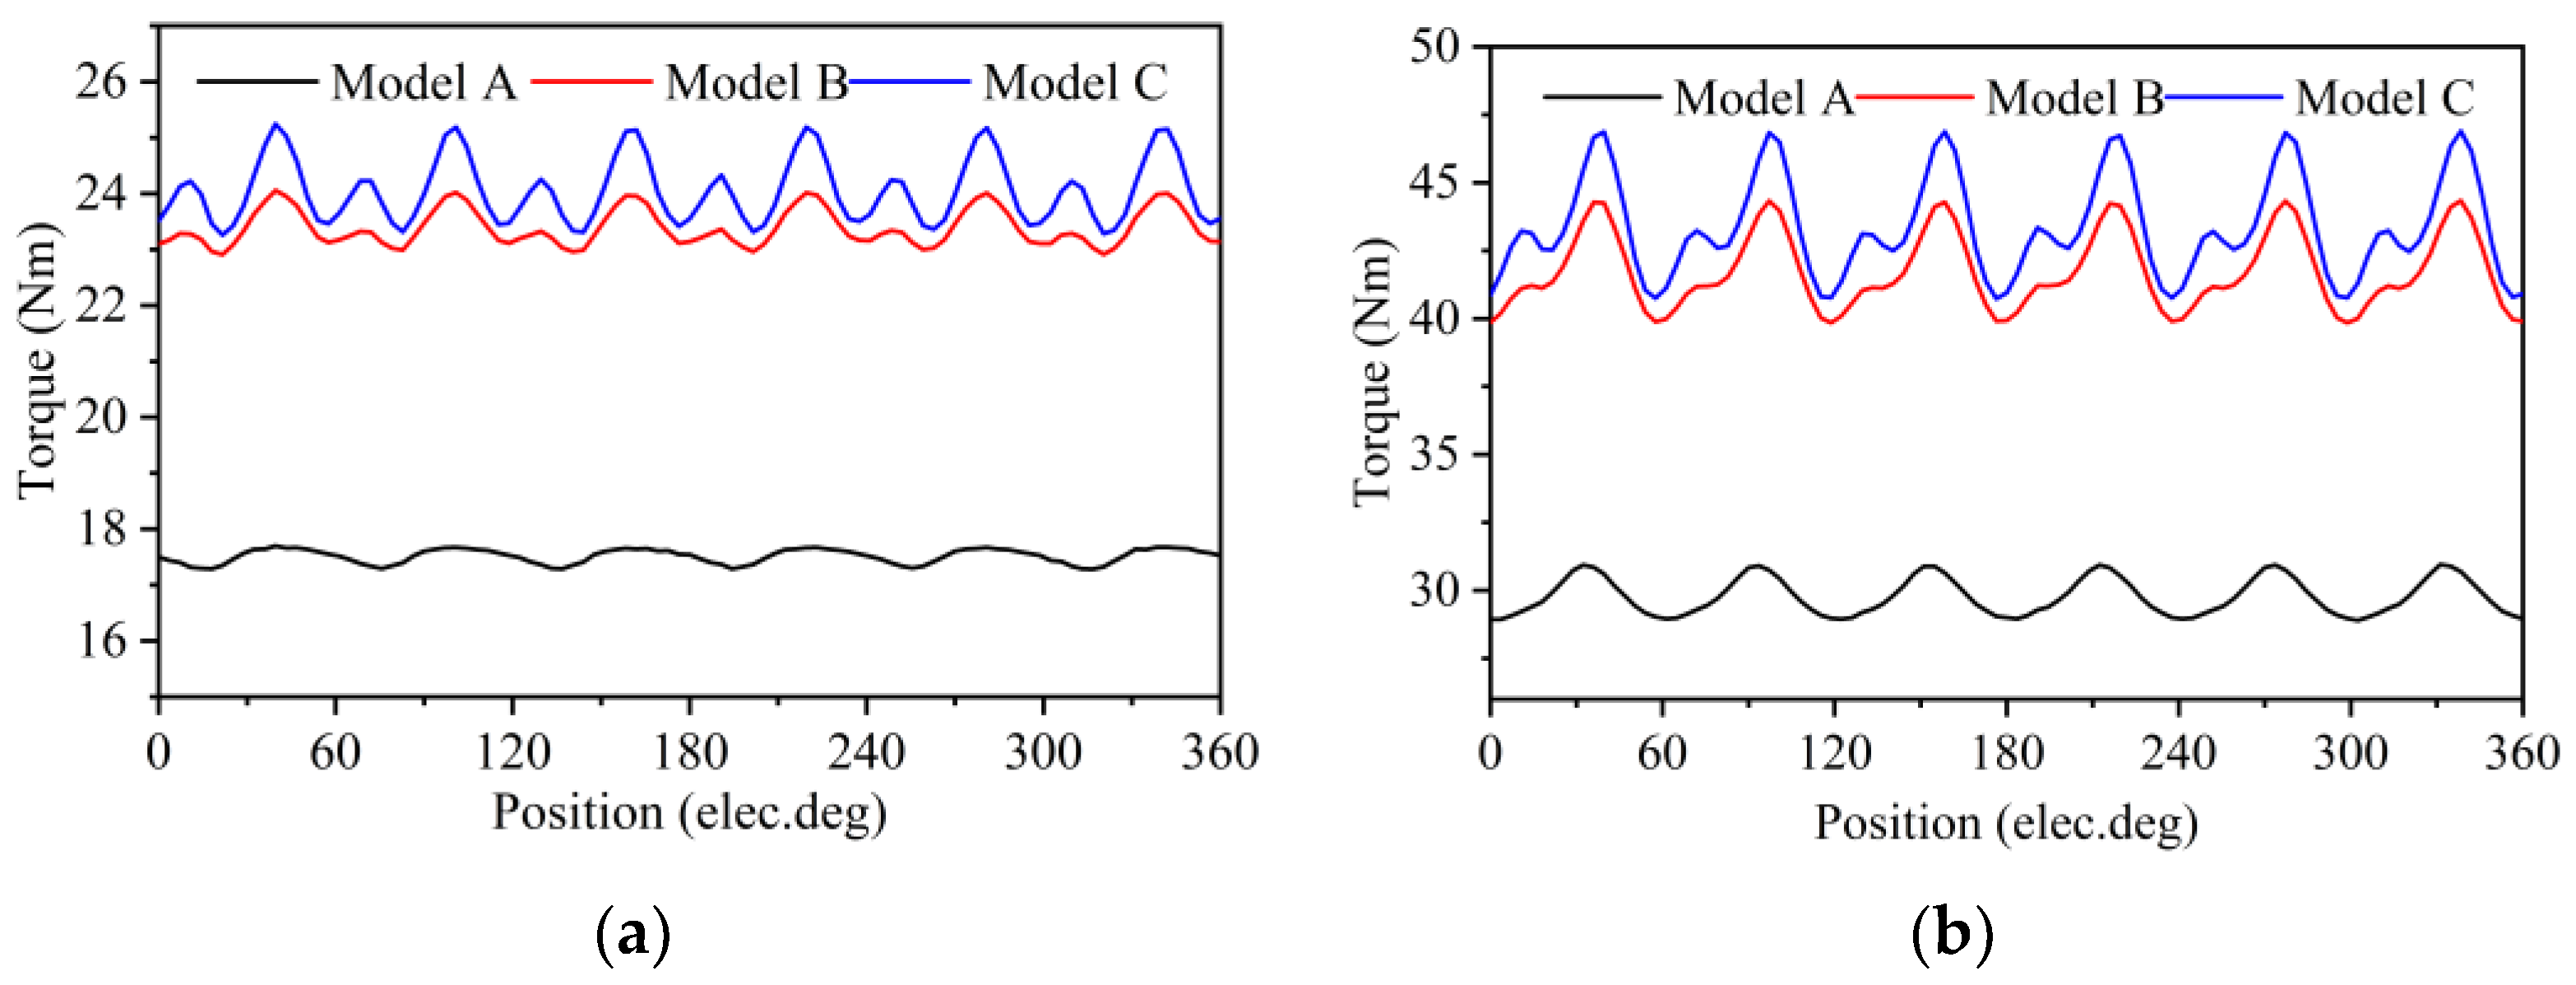
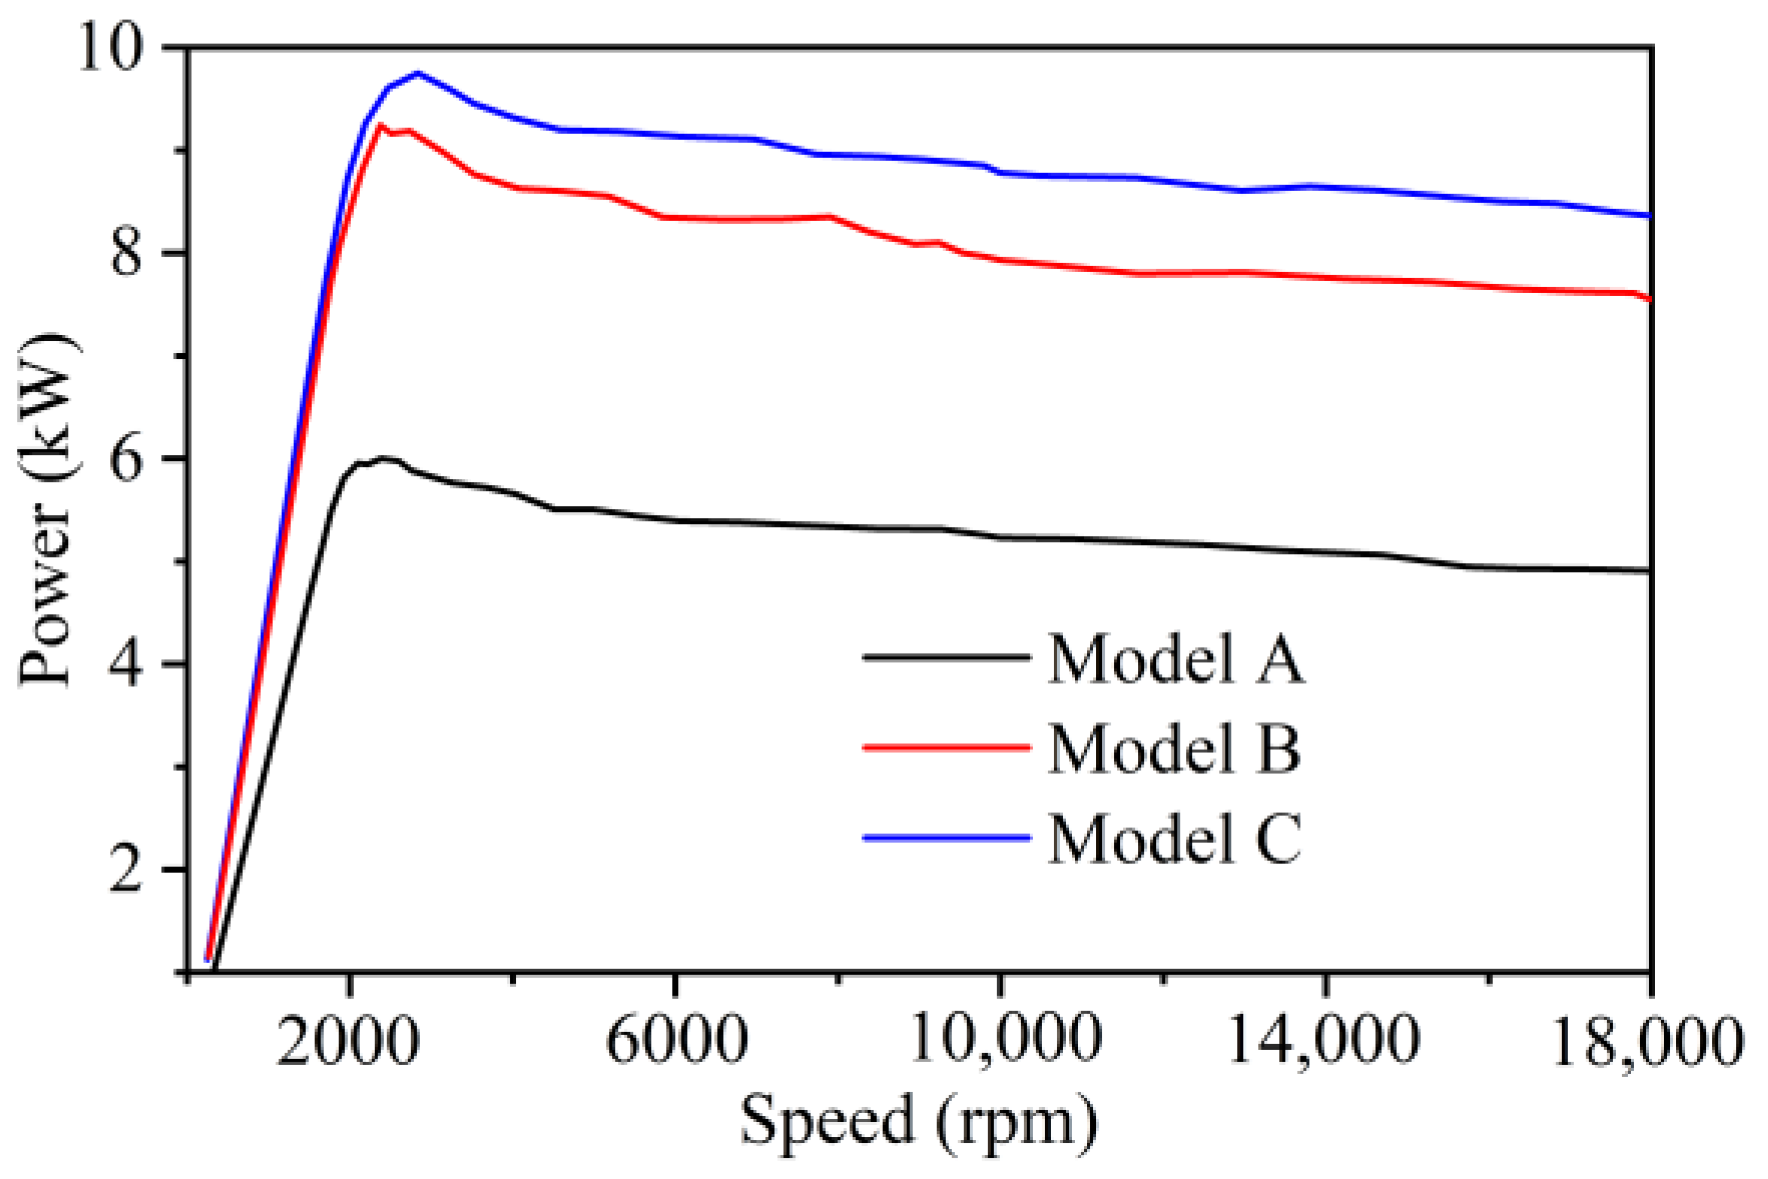
4.2. Torque and Power

Figure 8a depicts the waveform of torque under maximum torque per ampere (MTPA) control when the current is 20 A. Model C exhibits the highest average torque, attributed to its maximum air-gap flux density and salience. Due to the highest THD of the air-gap flux density in Model C, its torque ripple is maximal. Table 3 shows the average torque, torque component, and torque ripple of three IPM motors when the current is 20 A, where Tavg represents average torque, ΔTp-p represents peak-to-peak torque, Tripple represents torque ripple.
The waveform of torque at MTPA control when the current is 40 A is shown in Figure 8b. It shows that the Model C has the highest average torque and the torque ripples. Table 4 shows the average torque, torque component, and torque ripple of three IPM motors when the current is 40 A.
To present the magnitude relationship between average torque and harmonic torque more clearly, Figure 9 shows the Decibel graph of torque at different currents. The 0th order represents the average torque.
As is well known, the composition of electromagnetic torque for motors can be formulated with Equation (2). The first term represents the PM torque, and the second term represents the reluctance torque.
T = 3 2 p ( ψ P M i q + ( L d L q ) i d i q )    = 3 2 p ( ψ P M I a cos θ + ( L d L q ) I a 2 sin θ cos θ )
where p is the number of pole pairs. Ia is the stator current. θ is the current angle lagging the q-axis. Therefore, keeping the stator current constant, increasing ψpm can increase the PM torque, and increasing salience can enhance the reluctance torque. Because the ψpm and salience of Model C are the highest, the torque of Model C is always the largest.
The torque-angle characteristics of the three motors are shown in Figure 10. It can be seen that when the current is 20 A, the current angles for maximum torque of the three models are 20, 20, and 21 degrees, respectively. When the current is 40 A, the current angles for maximum torque of the three models are 26, 27, and 28 degrees, respectively. Due to the maximum salience of Model C, the current angle θ of Model C remains the largest.
Figure 11 illustrates the proportion of PM torque and reluctance torque for three models under varying currents. At 20 A, the order of PM torque and reluctance torque for all three models is as follows: Model C > Model B > Model A. Additionally, the reluctance torque for all models is positive. At 40 A, due to saturation effects, both Model A and Model B exhibit negative salience, resulting in negative values for their respective reluctance torque. Since the salience of Model B approaches zero, its reluctance torque tends toward zero as well. Conversely, at this point, Model C demonstrates positive saliency; hence, its reluctance torque retains a positive value.
Figure 12 illustrates the power characteristic curves of three models under the 40 A current limit, with maximum power values of 6.0 kW, 9.2 kW, and 9.7 kW, respectively. Model C, due to its lower leakage flux and maximum salience, exhibits the highest power output across the entire speed range.

4.3. Loss and Efficiency

Figure 13 illustrates the distribution of iron loss density for three models at the same output (20 Nm and 3000 rpm). At this moment, the specific parameters of the three motors are as shown in Table 5: It can be observed that under these conditions, Model A performs the worst. Although it has smaller stator iron loss, its higher stator current leads to the lowest efficiency. Model C, despite requiring the smallest stator current, incurs total losses approximately greater than those of Model B, resulting in Model B achieving the highest efficiency. The mechanical losses of the three models are determined by empirical formulas from Ref. [32], all approximately equal to 27.5 W. The reluctance torque of the three models remains highest in Model C; although the value is smaller, it still contributes to increased motor output power.

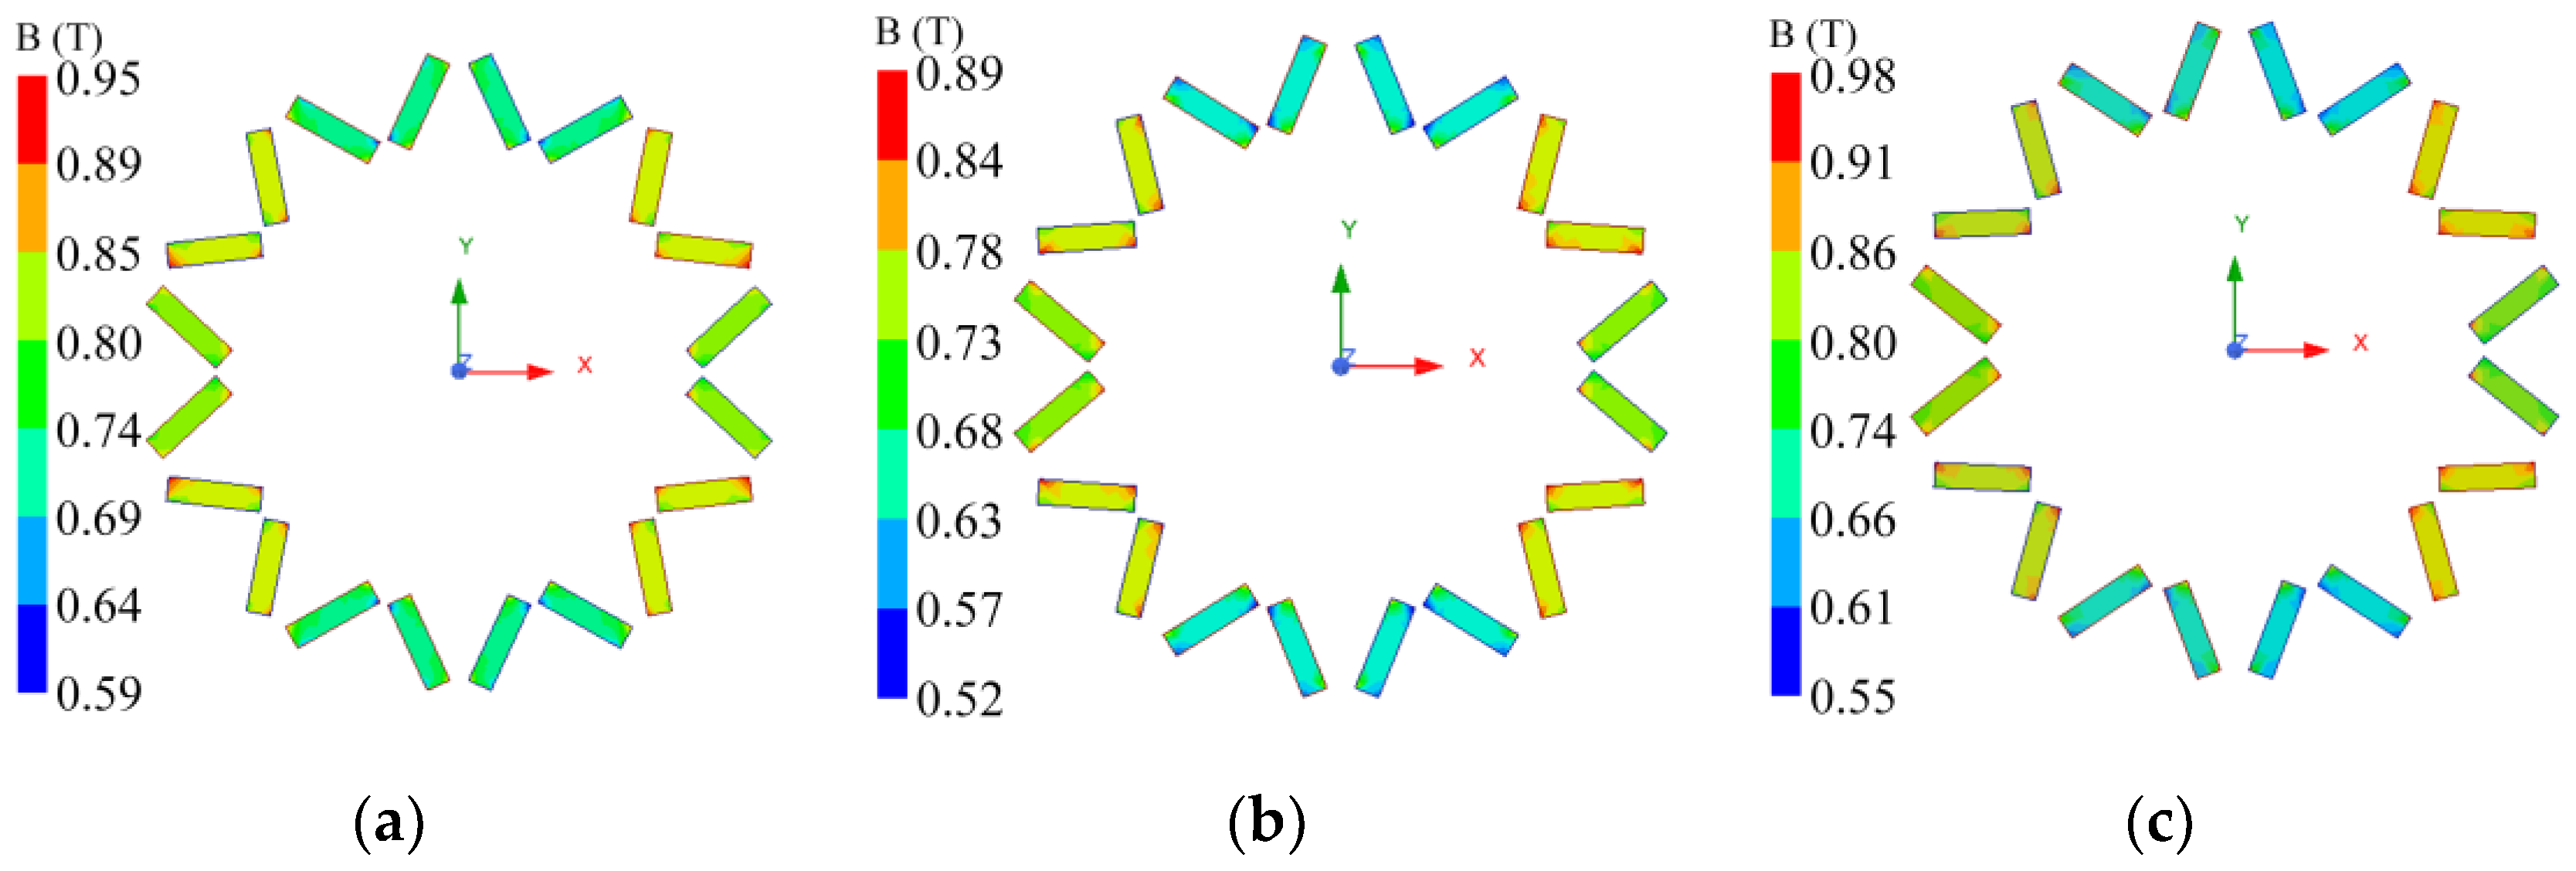
4.4. Demagnetization Analysis

4.4.1. Demagnetization Analysis

Demagnetization analysis is an important aspect of motor design. Demagnetization of the PMs can affect the performance of the motor. The higher the temperature, the more susceptible the PMs are to demagnetization. Therefore, this article conducts a demagnetization analysis of three motors under extreme conditions (temperature of 180 °C, stator current of 40 A, current angle of 90 deg).
Figure 14 shows the magnetic flux density of the three motors under extreme conditions. The minimum magnetic flux densities for Model A, Model B, and Model C are 0.59 T, 0.52 T, and 0.55 T, respectively, all located near the central bridges. All three models do not undergo demagnetization. Model A has the maximum magnetic flux density and the lowest demagnetization risk due to the wide bilateral bridges, allowing a large amount of demagnetizing magnetic field to pass through the bilateral bridges. This results in a higher magnetic flux density within the PMs of Model A. Model B has a smaller minimum magnetic flux density compared to Model C, as the narrow central bridges of Model B cause some demagnetizing magnetic flux to enter the PMs.

4.4.2. Analysis of the Impact of PM Dimensions on Demagnetization and Torque

This section will use PMs with the same volume to obtain the maximum torque of three models by optimizing the length and thickness of the PMs. Due to the smaller size change, the impact on rotor strength is being neglected. The minimum magnetic flux density of the PMs changes with the increase of the thickness of the PMs, as shown in Figure 15a. The motor torque varies with the increase in the thickness of the PMs, as shown in Figure 15b. As the thickness of the PMs increases, the motor’s ability to resist demagnetization improves. However, due to the increased thickness of the PMs, the length of the PMs decreases, resulting in a decrease in motor torque.
To ensure uniform demagnetization conditions across all three models, torque comparisons are made with the minimum magnetic flux density of the PMs set at 0.5 T. At this point, the thicknesses of the PMs for Model A, Model B, and Model C are 2.6 mm, 2.9 mm, and 2.7 mm, respectively. The torque values for these models stand at 19.7 Nm, 24.0 Nm, and 25.6 Nm, respectively. Remarkably, after optimization, all three models exhibit increased torque performance, with Model C maintaining the highest torque output among them.

4.5. Thermal Analysis

Under the same output conditions (20 Nm, 3000 rpm), thermal analysis is conducted on three motors utilizing natural cooling. As shown in Figure 16, the axial temperature distributions of the three motors are illustrated. Since this operating condition is the most commonly encountered for the motors, the temperatures of all three motors meet the requirements, allowing for long-term stable operation. At this juncture, Model A exhibits a higher overall temperature due to its higher stator current compared to Model B and Model C. Model B maintains the lowest temperature among the three models, owing to its lowest losses. All three motors meet the requirements of maximum rotor temperature below 150 °C and maximum winding temperature below 130 °C, providing a significant safety margin for the motors under extreme operating conditions (short-term overspeed and overload).

5. Conclusions

This article designs three rotors with different widths of central and bilateral bridges and conducts a detailed comparison, reaching the following conclusions:
(1)
Due to the absence of a central bridge, Model A requires a very thick bilateral bridge to ensure rotor operation, resulting in a significant increase in magnetic flux leakage and causing Model A to not meet torque requirements.
(2)
The total bridge width of Model B and Model C is significantly smaller than that of Model A, resulting in a reduction in inductance for both Model B and Model C. However, the decrease in the Ld compared to Lq is more significant for Model B and Model C, leading to an increased salience for both. Among them, Model C has the smallest Ld, maximizing its salience, which results in Model C having the highest reluctance torque.
(3)
Model B and Model C, both equipped with a central bridge configuration, meet the torque design requirements. However, the narrow bilateral bridge design of Model C results in the maximum air-gap flux density, leading to Model C exhibiting the highest torque. Nonetheless, due to the higher THD of Model C, torque ripple also increases.
(4)
At rated current, the losses of the three models follow the order Model C > Model B > Model A. However, due to the lower losses of Model B, it has the highest efficiency.
(5)
By adjusting the thickness of the PMs to ensure uniform demagnetization conditions across all three models, Model C maintains the highest torque, while Model A continues to exhibit the lowest torque.
In summary, the configuration of central and bilateral bridges significantly influences both the electromagnetic performance and mechanical strength of IPM motors. The absence of a central bridge can result in significant magnetic flux leakage, therefore impacting the motor’s torque output. Adjustments in the widths of central and bilateral bridges can notably affect the motor’s inductance, salience, and efficiency, consequently influencing its overall performance.

Author Contributions

Conceptualization, B.S., C.Y. and W.C.; software, B.S.; formal analysis, C.Y.; data curation, B.S.; writing—original draft preparation, B.S.; writing—review and editing, C.Y.; supervision, W.C.; and funding acquisition, W.C. All authors have read and agreed to the published version of the manuscript.

Funding

This work was supported in part by the National Natural Science Foundation of China under Grants U21A20145 and 51977052, and in part by Heilongjiang Province Key R&D Project 2023ZX05B02 and in part by Guangxi Science and Technology Major Project GUIKE AA23062059.

Data Availability Statement

The data presented in this study are available in this article.

Conflicts of Interest

The authors declare no conflicts of interest.

References

  1. Kubik, A.; Turoń, K.; Folęga, P.; Chen, F. CO2 Emissions—Evidence from internal combustion and electric engine vehicles from car-sharing systems. Energies 2023, 16, 2185. [Google Scholar] [CrossRef]
  2. Husain, I.; Ozpineci, B.; Islam, M.S.; Gurpinar, E.; Su, G.-J.; Yu, W.; Chowdhury, S.; Xue, L.; Rahman, D.; Sahu, R. Electric drive technology trends, challenges, and opportunities for future electric vehicles. Proc. IEEE 2021, 109, 1039–1059. [Google Scholar] [CrossRef]
  3. Liu, C.; Chau, K.T.; Lee, C.H.T.; Song, Z. A critical review of advanced electric machines and control strategies for electric vehicles. Proc. IEEE 2020, 109, 1004–1028. [Google Scholar] [CrossRef]
  4. Li, Y.; Han, M.; Yang, Z.; Li, G. Coordinating flexible demand response and renewable uncertainties for scheduling of community integrated energy systems with an electric vehicle charging station: A bi-level approach. IEEE Trans. Sustain. Energy 2021, 12, 2321–2331. [Google Scholar] [CrossRef]
  5. Palangar, M.F.; Soong, W.L.; Bianchi, N.; Wang, R.-J. Design and optimization techniques in performance improvement of line-start permanent magnet synchronous motors: A review. IEEE Trans. Magn. 2021, 57, 900214. [Google Scholar] [CrossRef]
  6. Dambrauskas, K.; Vanagas, J.; Zimnickas, T.; Kalvaitis, A.; Ažubalis, M. A method for efficiency determination of permanent magnet synchronous motor. Energies 2020, 13, 1004. [Google Scholar] [CrossRef]
  7. Zhao, J.; Wang, Z.; Liu, H.; Ning, F.; Hong, X.; Du, J.; Yu, M. Modal analysis and structure optimization of permanent magnet synchronous motor. IEEE Access 2020, 8, 151856–151865. [Google Scholar] [CrossRef]
  8. Deng, W.; Zuo, S.; Chen, W.; Qian, Z.; Qian, C.; Cao, W. Comparison of eccentricity impact on electromagnetic forces in internal-and external-rotor permanent magnet synchronous motors. IEEE Trans. Transp. Electrif. 2021, 8, 1242–1254. [Google Scholar] [CrossRef]
  9. Yoon, K.Y.; Baek, S.W. Performance improvement of concentrated-flux type IPM PMSM motor with flared-shape magnet arrangement. Appl. Sci. 2020, 10, 6061. [Google Scholar] [CrossRef]
  10. Du, G.; Li, N.; Zhou, Q.; Gao, W.; Wang, L.; Pu, T. Multi-Physics Comparison of surface-mounted and interior permanent magnet synchronous motor for high-speed applications. Machines 2022, 10, 700. [Google Scholar] [CrossRef]
  11. Kamiev, K.; Montonen, J.; Ragavendra, M.P.; Pyrhonen, J.; Tapia, J.A.; Niemela, M. Design principles of permanent magnet synchronous machines for parallel hybrid or traction applications. IEEE Trans. Ind. Electron. 2012, 60, 4881–4890. [Google Scholar] [CrossRef]
  12. El-Refaie, A.M. Fractional-slot concentrated-windings synchronous permanent magnet machines: Opportunities and challenges. IEEE Trans. Ind. Electron. 2009, 57, 107–121. [Google Scholar] [CrossRef]
  13. Sarlioglu, B.; Morris, C.T.; Han, D.; Li, S. Driving toward accessibility: A review of technological improvements for electric ma-chines, power electronics, and batteries for electric and hybrid vehicles. IEEE Ind. Appl. Mag. 2016, 23, 14–25. [Google Scholar] [CrossRef]
  14. Binder, J.; Silvagni, M.; Ferrari, S.; Deusinger, B.; Tonoli, A.; Pellegrino, G. High-speed IPM motors with rotor sleeve: Structural design and performance evaluation. In Proceedings of the 2023 IEEE Workshop on Electrical Machines Design, Control and Diagnosis (WEMDCD), Newcastle upon Tyne, UK, 13–14 April 2023; pp. 1–6. [Google Scholar]
  15. Cao, R.; Mi, C.; Cheng, M. Quantitative comparison of flux-switching permanent-magnet motors with interior permanent magnet motor for EV, HEV, and PHEV applications. IEEE Trans. Magn. 2012, 48, 2374–2384. [Google Scholar] [CrossRef]
  16. Goss, J.; Popescu, M.; Staton, D. A comparison of an interior permanent magnet and copper rotor induction motor in a hybrid electric vehicle application. In Proceedings of the 2013 International Electric Machines & Drives Conference, Chicago, IL, USA, 12–15 May 2013; pp. 220–225. [Google Scholar]
  17. Sun, X.; Shi, Z.; Lei, G.; Guo, Y.; Zhu, J. Analysis and design optimization of a permanent magnet synchronous motor for a campus patrol electric vehicle. IEEE Trans. Veh. Technol. 2019, 68, 10535–10544. [Google Scholar] [CrossRef]
  18. Varaticeanu, B.; Minciunescu, P.; Matei, S. Performance evaluation of permanent magnet assisted synchronous reluctance motor for micro electric vehicle. In Advanced Microsystems for Automotive Applications 2015: Smart Systems for Green and Automated Driving; Springer International Publishing: Berlin/Heidelberg, Germany, 2016; pp. 173–186. [Google Scholar]
  19. Agamloh, E.; Von Jouanne, A.; Yokochi, A. An overview of electric machine trends in modern electric vehicles. Machines 2020, 8, 20. [Google Scholar] [CrossRef]
  20. Shao, B.; Cai, W.; Xie, Y.; Yang, C.; Guo, G.; Tang, Y. Design of a novel rib for improving the mechanical and electromagnetic performance of IPMSMs. In Proceedings of the 2023 26th International Conference on Electrical Machines and Systems (ICEMS), Zhuhai, China, 5–8 November 2023; pp. 464–467. [Google Scholar]
  21. Liu, X.; Chen, H.; Zhao, J.; Belahcen, A. Research on the performances and parameters of interior PMSM used for electric vehicles. IEEE Trans. Ind. Electron. 2016, 63, 3533–3545. [Google Scholar] [CrossRef]
  22. Song, C.H.; Kim, D.H.; Kim, K.C. Design of a novel IPMSM bridge for torque ripple reduction. IEEE Trans. Magn. 2020, 57, 8201004. [Google Scholar] [CrossRef]
  23. Jin, C.S.; Jung, D.S.; Kim, K.C.; Chun, Y.-D.; Lee, H.-W.; Lee, J. A study on improvement magnetic torque characteristics of IPMSM for direct drive washing machine. IEEE Trans. Magn. 2009, 45, 2811–2814. [Google Scholar]
  24. Chen, H.; Lee, C.H.T. Parametric sensitivity analysis and design optimization of an interior permanent magnet synchronous motor. IEEE Access 2019, 7, 159918–159929. [Google Scholar] [CrossRef]
  25. Binder, A.; Schneider, T.; Klohr, M. Fixation of buried and surface-mounted magnets in high-speed permanent-magnet synchronous machines. IEEE Trans. Ind. Appl. 2006, 42, 1031–1037. [Google Scholar] [CrossRef]
  26. Chai, F.; Li, Y.; Liang, P.; Pei, Y. Calculation of the maximum mechanical stress on the rotor of interior permanent-magnet synchronous motors. IEEE Trans. Ind. Electron. 2016, 63, 3420–3432. [Google Scholar] [CrossRef]
  27. Chu, G.; Dutta, R.; Rahman, M.F.; Lovatt, H.; Sarlioglu, B. Analytical calculation of maximum mechanical stress on the rotor of interior permanent-magnet synchronous machines. IEEE Trans. Ind. Appl. 2019, 56, 1321–1331. [Google Scholar] [CrossRef]
  28. Barcaro, M.; Meneghetti, G.; Bianchi, N. Structural analysis of the interior PM rotor considering both static and fatigue loading. IEEE Trans. Ind. Appl. 2013, 50, 253–260. [Google Scholar] [CrossRef]
  29. Monissen, C.; Arslan, M.E.; Krings, A.; Andert, J. Mechanical stress in rotors of permanent magnet machines—Comparison of different determination methods. Energies 2022, 15, 9169. [Google Scholar] [CrossRef]
  30. Pellegrino, G.; Vagati, A.; Guglielmi, P.; Boazzo, B. Performance comparison between surface-mounted and interior PM motor drives for electric vehicle application. IEEE Trans. Ind. Electron. 2011, 59, 803–811. [Google Scholar] [CrossRef]
  31. Yamazaki, K.; Kumagai, M. Torque analysis of interior permanent-magnet synchronous motors by considering cross-magnetization: Variation in torque components with permanent-magnet configurations. IEEE Trans. Ind. Electron. 2013, 61, 3192–3201. [Google Scholar] [CrossRef]
  32. Pyrhonen, J.; Jokinen, T.; Hrabovcova, V. Design of Rotating Electrical Machines; John Wiley & Sons: Hoboken, NJ, USA, 2013. [Google Scholar]
Figure 1. IPM motors with different rotors. (a) Model A. (b) Model B. (c) Model C.
Machines 12 00423 g001
Figure 2. Distribution of rotor mechanical stress. (a) Model A. (b) Model B. (c) Model C.
Machines 12 00423 g002
Figure 3. Air-gap flux density (a) Waveforms. (b) Harmonics order.
Machines 12 00423 g003
Figure 4. Back-EMF. (a) Waveforms. (b) Harmonics order.
Machines 12 00423 g004
Figure 5. Line voltage. (a) Waveforms. (b) Harmonics order.
Machines 12 00423 g005
Figure 6. Cogging torque of the three models.
Machines 12 00423 g006
Figure 7. The curves of inductance and salience variation with current. (a) Ld. (b) Lq. (c) salience.
Machines 12 00423 g007
Figure 8. Torque for Different Current Values. (a) current = 20 A. (b) current = 40 A.
Machines 12 00423 g008
Figure 9. Decibel graph of Fundamental and Harmonic. (a) current = 20 A. (b) current = 40 A.
Machines 12 00423 g009
Figure 10. Torque-current angle curves.
Machines 12 00423 g010
Figure 11. PM torque and reluctance torque.
Machines 12 00423 g011
Figure 12. Power curves of three models.
Machines 12 00423 g012
Figure 13. Distribution of iron loss density. (a) Model A. (b) Model B. (c) Model C.
Machines 12 00423 g013
Figure 14. Magnetic flux distribution of PMs under extreme conditions. (a) Model A. (b) Model B. (c) Model C.
Machines 12 00423 g014
Figure 15. Demagnetization and torque characteristics (a) Variation of minimum magnetic flux density with PMs thickness. (b) Variation of torque with PMs thickness.
Machines 12 00423 g015
Figure 16. Axial temperature distribution (a) Model A. (b) Model B. (c) Model C.
Machines 12 00423 g016
Table 1. Main parameters of motor.
ParametersValueParametersValue
Slot number12pole number10
Turns per coil60Outer stator diameter (mm)140
Rated speed (rpm)3000Axial length (mm)130
Rated torque (Nm)20Air gap (mm)0.5
Max speed (rpm)18,000DC voltage (V)350
PM remanence (T)1.28PM coercivity (kA/m)1023
Table 2. Material parameters of rotor.
ParametersSteelMagnet
Young’s modulus (GPa)210200
Density (kg/m3)76008200
Poisson’s ratio0.270.3
Yield strength (MPa)390-
Table 3. Torque components of current = 20 A.
ParametersModel AModel BModel C
6th (Nm)0.1840.3770.488
12th (Nm)0.04510.2260.641
18th (Nm)0.0120.0290.035
Tave (Nm)17.723.424.0
ΔTp-p (Nm)0.4301.151.99
Tripple (%)2.434.918.29
Table 4. Torque components of current = 40 A.
ParametersModel AModel BModel C
6th (Nm)0.9931.792.10
12th (Nm)0.180.821.49
18th (Nm)0.0510.0520.061
Tave (Nm)29.841.843.4
ΔTp-p (Nm)2.034.496.17
Tripple (%)6.8110.7414.21
Table 5. The main calculated parameters of the motor at the same output.
ParametersModel AModel BModel C
Stator current (A)23.017.016.5
Stator iron loss (W)220.0243.6250.1
Rotor iron loss (W)44.638.037.6
PM loss (W)6.74.03.3
Mechanical loss (W)27.527.527.5
Copper loss (W)187.7137.4133.1
Efficiency (%)92.8193.3393.29
Reluctance torque (Nm)0.661.251.37
Disclaimer/Publisher’s Note: The statements, opinions and data contained in all publications are solely those of the individual author(s) and contributor(s) and not of MDPI and/or the editor(s). MDPI and/or the editor(s) disclaim responsibility for any injury to people or property resulting from any ideas, methods, instructions or products referred to in the content.

