Article

Investigation of Valve Seat Cone Angle on Small Opening Direct-Acting Relief Valve Cavitation Noise

1
School of Mechanical Engineering, Yanshan University, Qinhuangdao 066004, China
2
Hebei Provincial Key Laboratory of Heavy Machinery Fluid Power Transmission and Control, Yanshan University, Qinhuangdao 066004, China
3
State Key Laboratory of Crane Technology, Yanshan University, Qinhuangdao 066004, China
4
Henan Aerospace Hydraulic and Pneumatic Technology Co., Ltd., Zhengzhou 450016, China
*
Author to whom correspondence should be addressed.
Machines 2024, 12(7), 434; https://doi.org/10.3390/machines12070434
Submission received: 14 May 2024 / Revised: 14 June 2024 / Accepted: 21 June 2024 / Published: 25 June 2024
(This article belongs to the Special Issue Components of Hydrostatic Drive Systems)

Abstract

:
Direct-acting relief valves are important pressure-control components in hydraulic systems; however, noise problems are now common. This study aimed to reduce and numerically analyze the valve cavitation and noise using the Zwart–Gerber–Belamri (ZBG) model with the Ffowcs Williams and Hawkings (FW–H) model to optimize the design based on the sound field perspective. First, a direct-acting relief valve flow field model was established to determine the relationship between the seat structure and the degree of cavitation through a CFD (Computational Fluid Dynamics) simulation. Second, sound field analysis was conducted based on the cavitation and non-cavitation flow fields, respectively, and the resulting noise levels were compared. Finally, prototypes of the relief valve were manufactured, and noise levels between the original and optimized valves were compared. The results revealed that cavitation within the relief valve generated noise while optimizing the valve seat cone angle suppressed this phenomenon, thereby reducing the noise emitted by the optimized valve by 18.2 dB compared to the original valve. These findings can serve as a guide for designing and optimizing direct-acting relief valves.

1. Introduction

Direct-acting relief valves are widely used as safety components in hydraulic systems in aerospace, construction machinery, and other fields [1,2,3]. The relief valve is affected by the structure, which is often accompanied by cavitation and produces sharp noise during work, seriously affecting the stability of the hydraulic system. Relief valves that suppress cavitation noise are crucial to the overall hydraulic system. Therefore, it is necessary to study the cavitation phenomenon and noise generated in the relief valve to provide a reference for the optimal design of the relief valve.
Ji et al. found that the valve structure significantly affects the cavitation strength noise [4,5]. Wang et al. demonstrated that changing the spool or seat structure can effectively reduce cavitation [6,7,8]. Kudźma et al. revealed through acoustic and cavitation tests that the valve head with the smallest expansion angle and the highest critical velocity exhibits the lowest noise in the throttle orifice where cavitation occurs [9]. Zhang et al. found that cavitation noise could be suppressed by reducing the pressure difference before and after the valve [10]. Wang et al. discovered that different arrangement types with the same number of stages and hole diameters in the throttling stage have different cavitation positions [11]. Gao et al. found that a reduction in outlet area of about 50% effectively reduced cavitation near the valve orifice and inhibited cavitation [12]. Guan et al. observed that increasing the inclination of the flow channel can improve the reduction of cavitation intensity [13]. Han et al. found that different forms of throttles cause different degrees of cavitation [14,15]. Wei et al. found that perforated plate valves provide effective noise reduction [16]. He et al. found that the intensity of cavitation in the valve increases with increasing oil temperature [17,18]. Zhang et al. revealed the relationship between low-temperature cavitation and vortex structure [19]. Previous studies have mainly focused on the effect of structure and operating conditions on cavitation, but less so on studies of noise levels.
In recent years, research has been carried out on the phenomenon of valve noise. Guo et al. proposed an improvement measure to reduce flow-induced noise based on the Ffowcs Williams and Hawkings model (FW–H) equation for addressing valve noise problems [20]. Xu et al. modeled the large eddy simulation and the FH–W formulation by using the cavitation characteristics and noise propagation in a single-hole orifice plate [21]. Jin et al. conducted a numerical study based on FH–W acoustic simulation equations and internal flow characteristics, revealing the effect of cavitation on spool noise generation [22]. Lu et al. developed a cavitation flow equation based on a large eddy simulation (LES) model incorporating a multiphase cavitation model [23]. Liu et al. used LES techniques to study the cavitation effects of three different nozzle configurations [24]. Chang et al. found a significant increase in sound pressure levels within the high-frequency range of 500–8000 Hz by using LES and Zwart–Gerber–Belamr (ZGB) cavitation models [25]. Yuan et al. developed a compressible two-phase method for cavitation flows based on OpenFOAM to study cavitation jets [26]. Cheng et al. used an LES approach combined with the Schnerr–Sauer cavitation model to observe the effect of cavitation on local turbulence [27]. Yang et al. used the LES and the Permeability FW–H methods to predict cavitation noise [28]. Liang et al. employed a two-phase mixing model and found that the presence of a notch at the valve opening reduces cavitation intensity [29]. However, most of these studies are limited to noise analyses without cavitation flow fields.
Most of the current research methods for cavitation noise suppression in poppet valves involve reducing cavitation levels through structural optimization. However, there is a lack of research addressing the noise generated by the cavitation phenomenon as a target. Therefore, this study aimed to optimize the seat cone angle of the direct-acting relief valve with noise reduction as the optimization objective. First, using the LES turbulence model to simulate 3D flow field, the cavitation flow field of the relief valve was simulated and analyzed using the ZGB model to quantify the cavitation levels for different structures. Second, the FH–W model was used to import the cavitation flow field into the sound field for simulation and analysis of sound pressure levels generated by different structures. Finally, the machined samples were experimentally verified to provide theoretical and experimental references for the optimal design of these valves.

2. Direct-Acting Relief Valve Modeling

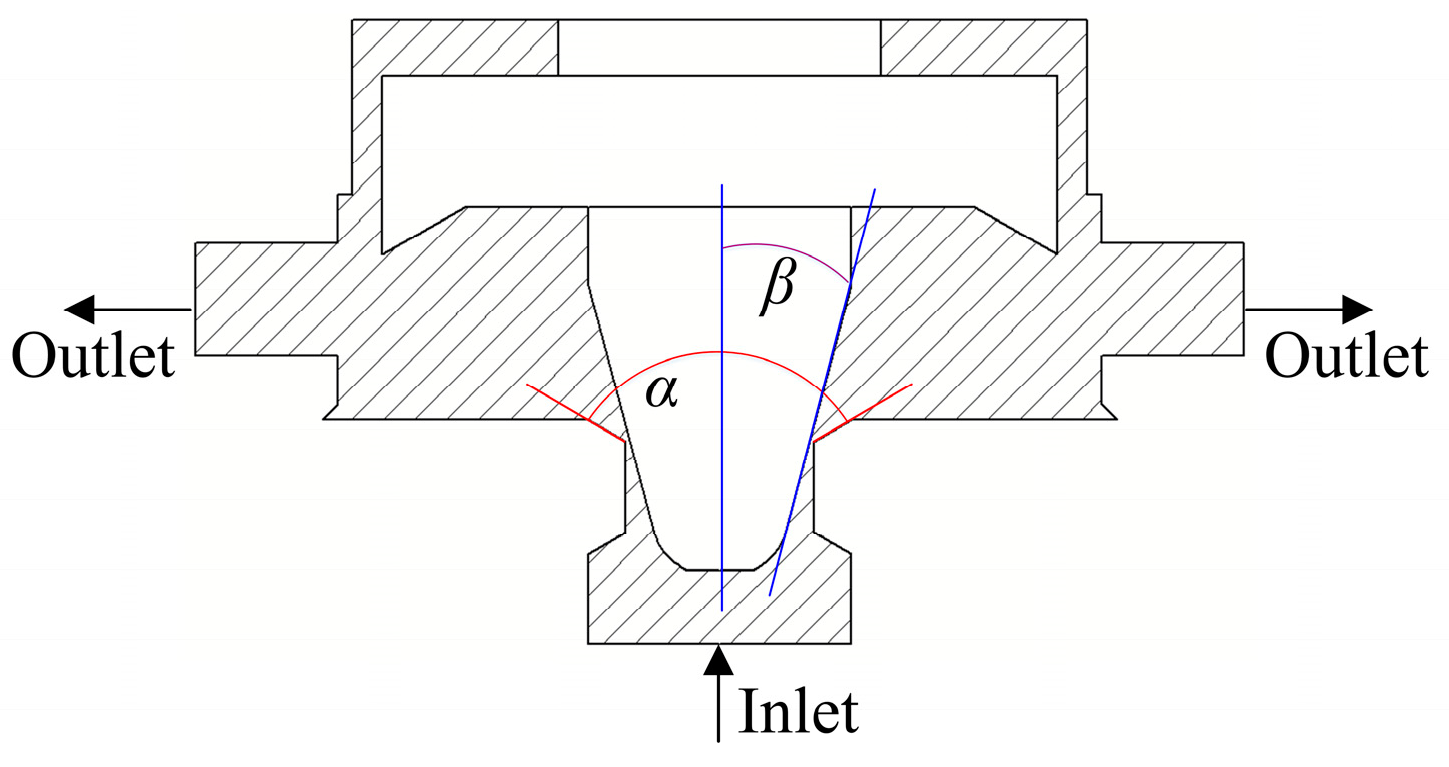
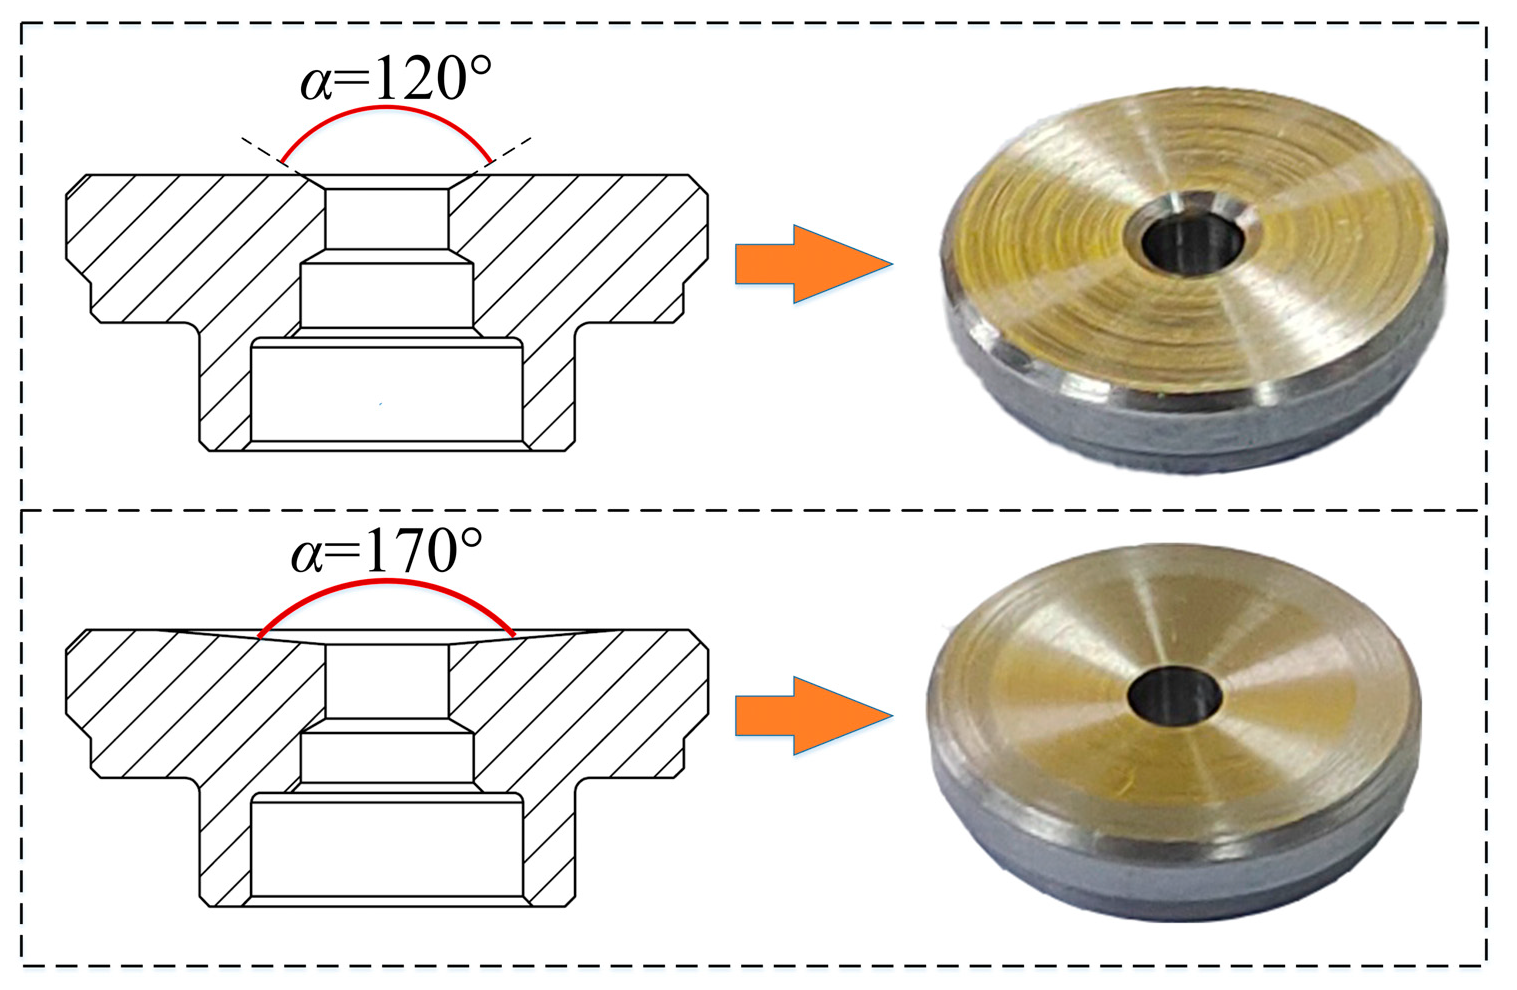
2.1. Working Principle and Configuration of Direct-Acting Relief Valves

Figure 1 displays a model of a direct-acting relief valve and explains its operating principle. During operation, hydraulic fluid generated hydraulic pressure on the cone spool surface, directing it opposite to the spring force. When the inlet pressure was lower than the regulating pressure of the relief valve, the hydraulic pressure acting on the cone valve spool became less than the elastic force, causing the cone valve spool to close. Conversely, when the inlet pressure exceeded the set pressure of the relief valve, the liquid pressure acting on the cone valve spool surpassed the spring force, causing the cone valve spool to move upward under the action of the liquid pressure until a balance was achieved between the liquid pressure and the spring force in the new position, establishing the maximum pressure within the hydraulic system.
A direct-acting relief valve served as the safety valve, with the outlet directly connected to the tank; thus, the pressures were all 0 MPa. The working pressure is defined as absolute, and an offset of 1 bar was set to prevent liquid vaporization. The simulation boundaries and specific values are detailed in Table 1.

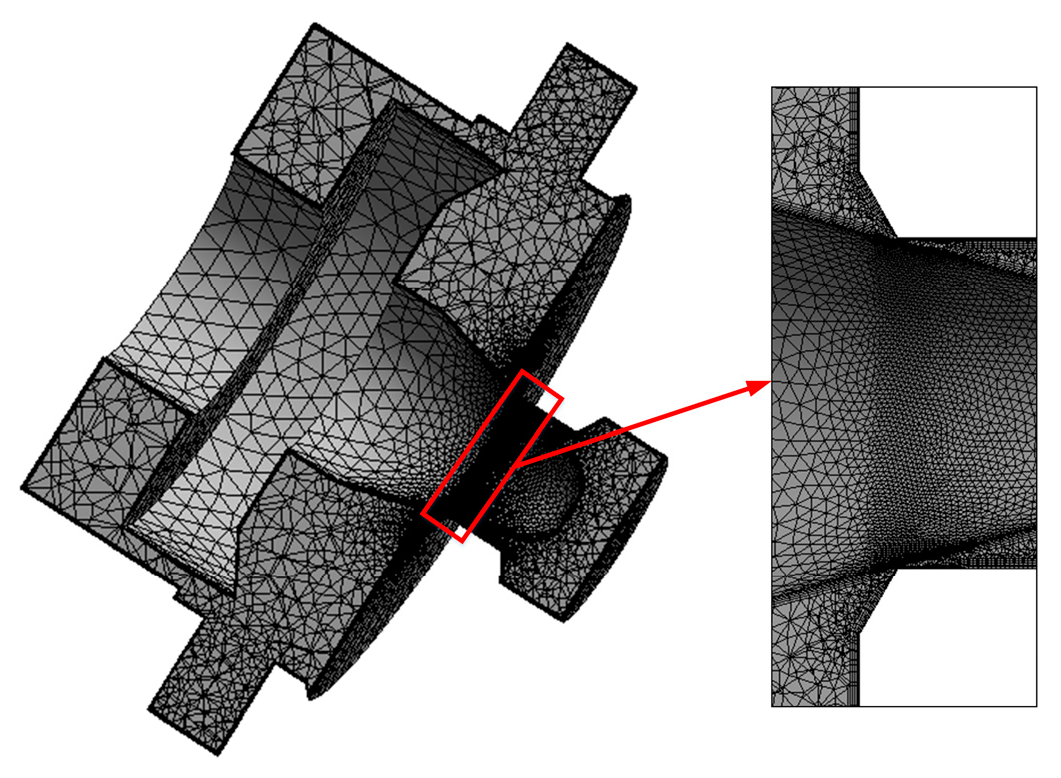
2.2. Fluid Computational Domain

Figure 2 indicates the computational domain of the direct-acting relief valve. Since the object of this study is the throttle orifice flow field, only the main throttle orifice flow field was modeled and simplified, while other unrelated structures were neglected. The left figure in Figure 2 shows the 3D model of the computational domain, while the right figure shows the schematic diagram of the flow field structure. The flow field boundary comprises a spool wall, sleeve wall, seat wall, symmetry plane, inlet, and outlet. The inlet boundary condition is defined as the pressure-inlet, while the outlet boundary is defined as the pressure-outlet. The wall was configured as a no-slip stationary wall. For clarifying the region where cavitation exists in the flow field, the overall 3D flow field and the characteristic planar flow field are analyzed. The plane of the valve containing the valve outlet region is selected.
Given the presence of sharp corner structures in the flow field model within the relief valve and the millimeter-scale opening of the valve port, an unstructured mesh was used for delineation. Simultaneously, to improve the calculation accuracy, the mesh encryption process was performed at sharp corners, high flow velocities, and areas with large pressure gradients. The resulting mesh model of the flow field in the relief valve is illustrated in Figure 3. To meet the LES requirements, the grids near the wall are refined. The first boundary layer height is set to 0.01 mm and the growth rate perpendicular to the wall direction is set to 1.2, ensuring sufficient grid resolution within the boundary layer.
The number of meshes directly determines the simulation speed and accuracy. To obtain the optimal number of meshes, the model depicted in Figure 3 was analyzed for mesh independence. Under the boundary conditions of inlet velocity of Vin = 1.73 m/s and outlet pressure of Pout = 0 MPa, the trend of inlet pressure versus total steam volume was simulated by changing the number of meshes. The working fluid is hydraulic oil, the set temperature is 30 °C, and the saturated vapor pressure of the oil used is 354 Pa. The properties of the oil and vapor sets are listed in Table 2. Oil is the primary phase, while vapor is the secondary phase. The simulation results are displayed in Figure 4.
Figure 4 depicts that the simulation results for inlet pressure and vapor volume stabilize when the number of meshes reaches 3.3 × 10⁵; therefore, the optimal number of meshes for the flow channel model depicted in Figure 3 is set to 3.3 × 10⁵.

2.3. Numerical Method

To simulate the cavitation flow, the LES approach coupled with the ZGB cavitation model is employed to solve the unsteady cavitation flow field. After the cavitation simulating of the relief valve through the ZBG model, the sound field of the cavitation flow field simulation using the FH-W model will be carried out.

2.3.1. Zwart-Gerber-Belamri Model

Cavitation is the cause of two-phase flow cavitation and turbulence occur simultaneously. Therefore, the Zwart–Gerber–Belamri cavitation model is selected. α is volume fraction of vapor, which is defined in the cavitation model as:
α = n b 4 3 π R b 3 1 + n b 4 3 π R b 3
where nb is the number of bubbles. Assuming that all bubbles in the system have the same size, the cavitation rate R can be obtained by multiplying the number density of bubbles and the rate of change of the mass of individual bubbles. As the vapor volume fraction increases, the total interphase mass transfer rate due to cavitation per unit volume is:
When PvP, the bubble growth rate is computed by:
R e = F v a p 3 ρ v α n u c ( 1 α v ) R B 2 ( p v p ) 3 ρ 1
When Pv < P, the bubble collapse rate is calculated by:
R c = F c o n d 3 ρ v α v R B 2 ( p p v ) 3 ρ 1
where Fvap is evaporation coefficient, 50; pv is the saturated vapor pressure of the liquid at a corresponding temperature, Pa; αnuc is nucleation site volume fraction, 5 × 10⁻⁴; αv is the gas phase volume fraction; RB is the bubble radius, 1 × 10⁻⁶ m; Fcond is condensation coefficient, 0.01; ρ1 is the liquid density, 890 kg/m3; ρv is the gas density, 1.29 kg/m3; Re is the evaporation phase formation rate; and Rc is the condensation phase formation rate [30].

2.3.2. Ffowcs Williams and Hawkings Model

The FW–H equation, extended by Williams and Hawkings based on the Lighthill’s acoustic analogy theory, has been widely applied for calculating the far-field noise. It is essentially an inhomogeneous wave equation which can be derived from the continuity equation and the Navier–Stokes equations. The equation is as follows:
1 a 0 2 2 p t 2   2 p = 2 x i x j T i j H ( f ) d d x i P i j n j + ρ u i u n δ ( f ) + d d t ρ u n δ ( f )
where ui is the fluid velocity component in xi direction; un is the fluid velocity component normal to the source surface f = 0; δ(f) is the Dirac delta function; H(f) is the Heaviside function; p is the sound pressure at the far field ( p = p p 0 ); a0 is the far field sound speed; Tij is the Lighthill stress tensor; and Pij is the compressive stress tensor [31].

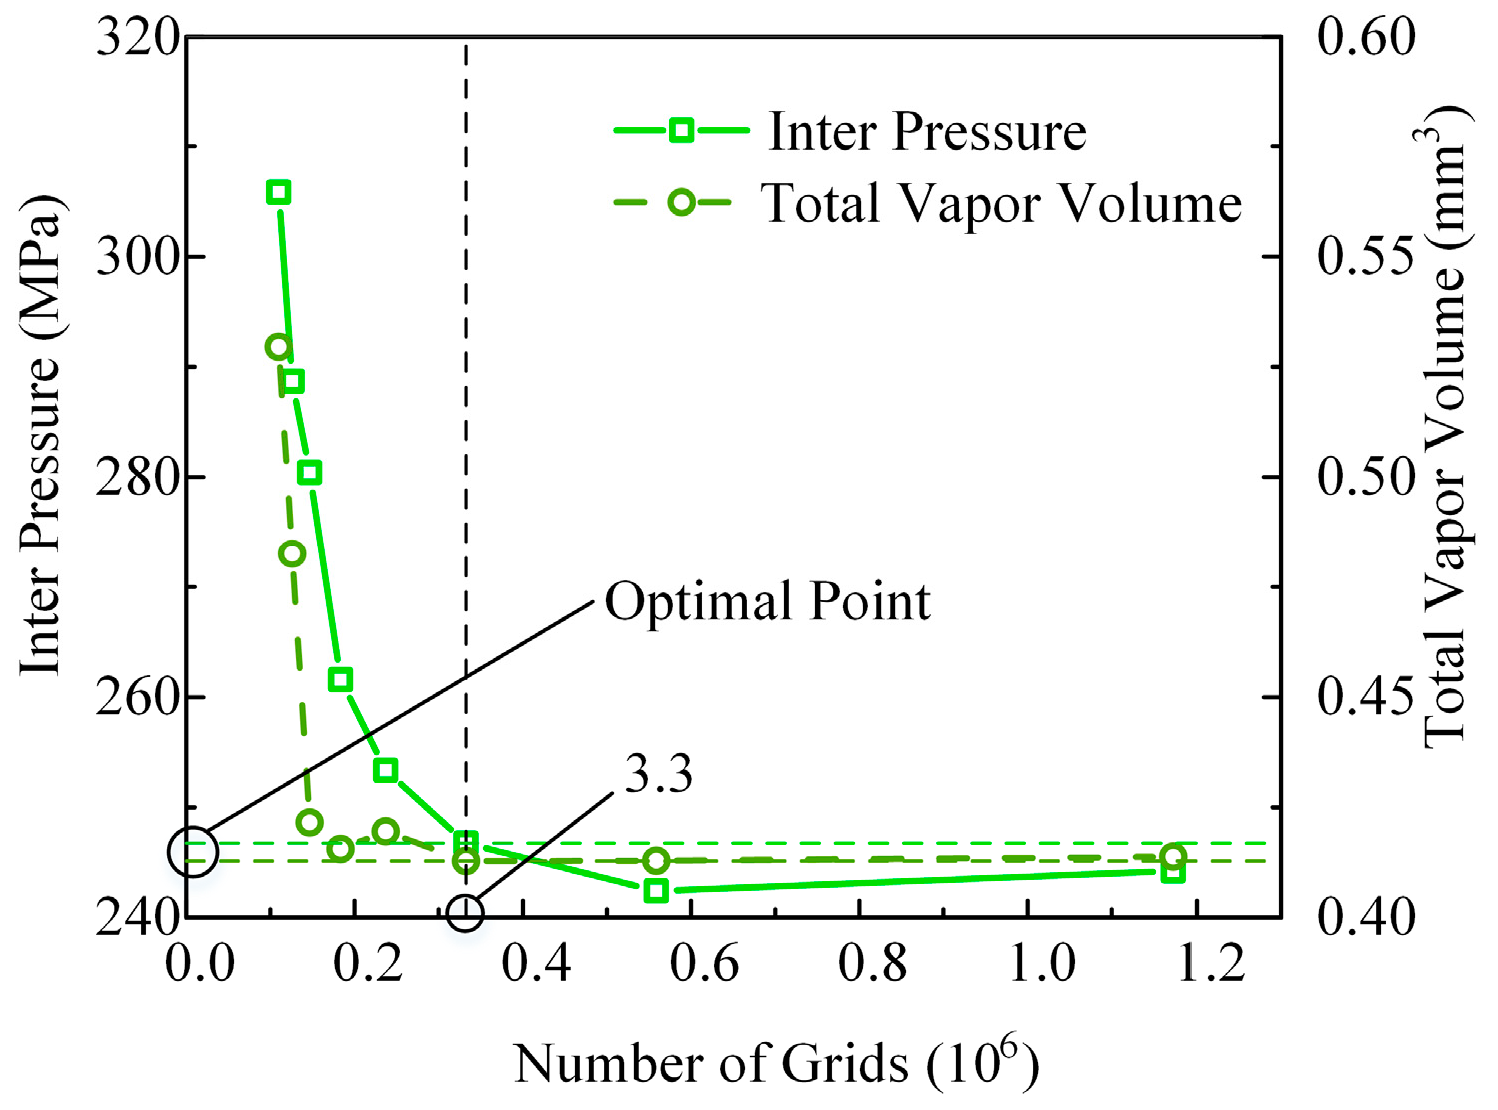
2.4. Numerical Strategy and Validation of Numerical Method

In the present paper, the Pressure-Based SIMPLEC algorithm is employed, a bounded second-order implicit scheme is used to discretize the transient term, while the convection term in the momentum equation is discretized using a bounded central differencing scheme. A least square cell-based method is used to calculate the gradient of variables which appear in differential equations and first order upwind scheme is utilized for the volume fraction of cavitation model. LES requires the dimensionless wall distance below one for solid walls [28]. Here, the dimensionless wall distance y+ is defined as:
y + = Δ y · u τ v
where Δy is the distance to the closest wall and uτ is the friction velocity. The requirement of y+ < 1 is achieved for all meshes, indicating that the grid resolutions meet the simulation requirements.

3. Results and Discussion

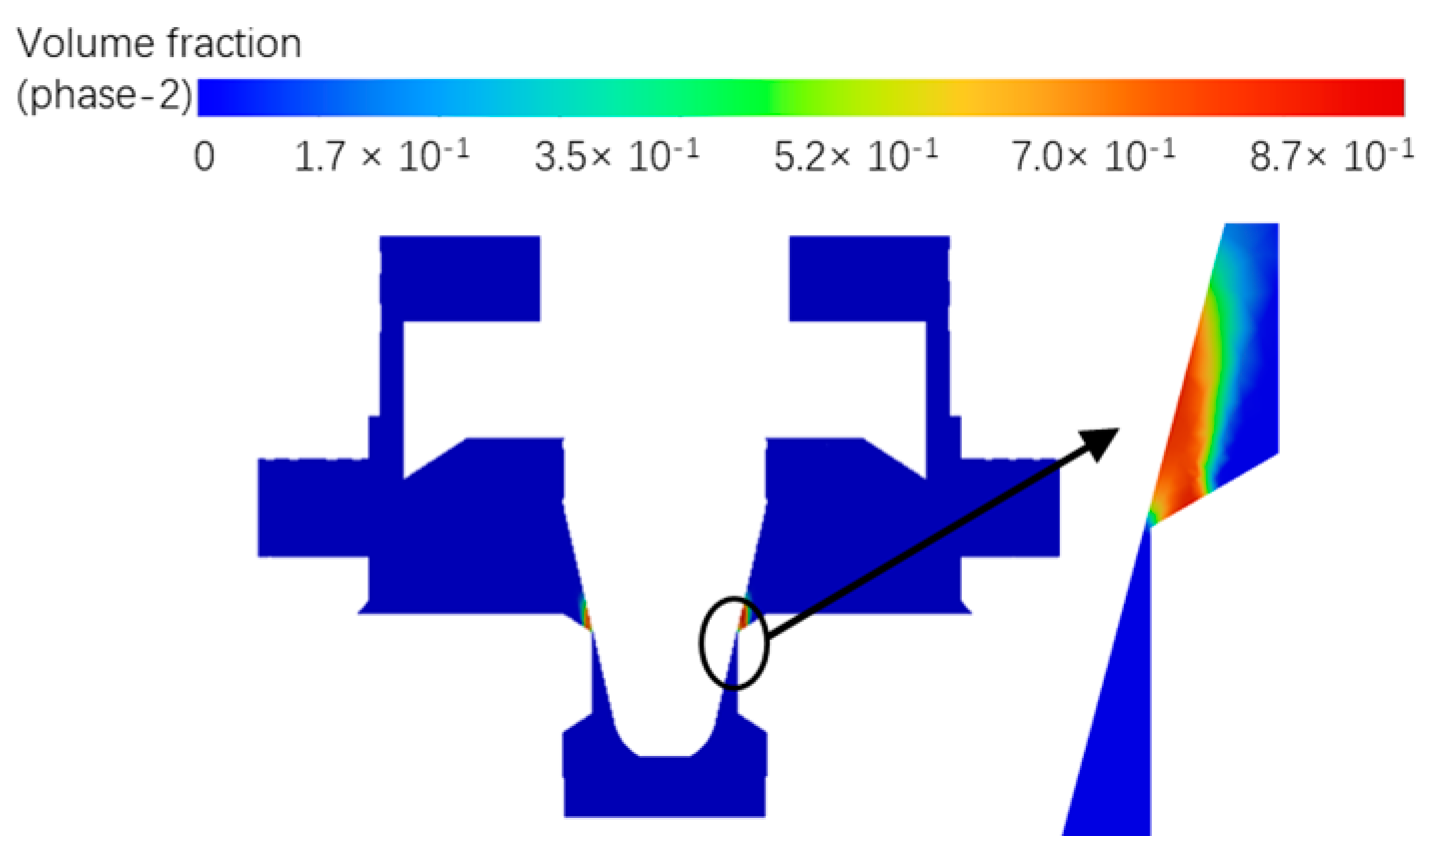
3.1. Influent of Valve Seat on the Cavitation

Figure 5 shows the numerical simulation results based on the 3D flow field model. The maximum vapor volume fraction in the cavitation field was used to assess the cavitation intensity.
Analysis of the vapor volume fraction contours shows that cavitation is mainly occurring in the vicinity of the valve seat and spool contact. Therefore, structural optimization was focused on decreasing cavitation in the vicinity of the valve seat and spool contact.
The above analysis revealed that the seat cone angle and the spool half cone angle in the relief valve are the key factors affecting the cavitation phenomenon. To analyze the effect of different seat cone angles and the spool half cone angle on cavitation, the seat cone angle and the spool half cone angle were set to α and β, respectively. The original seat cone angle and the spool half cone angle of the direct-acting relief valve examined in this paper were 120°and 15°, as demonstrated in Figure 6.
In this research, the vapor volume cloud was simulated for seat cone angles of 90°, 100°, 110°, 130°, 140°, 150°, 160°, and 170°, as displayed in Figure 7. Additionally, the relationship between the vapor volume and the valve seat cone angle obtained from Figure 7 is presented in Figure 8.
Figure 8 manifests that, with the original seat cone angle as a reference, the vapor volume in the valve decreased as the seat cone angle increased, thereby reducing the cavitation phenomenon. Conversely, when the seat cone angle was smaller than the original reference angle, the vapor volume in the relief valve increased.
The vapor volume cloud was simulated for valve spool half cone angle of 12°, 13°, 14°, 16°, 17°, 18°, 19°, and 20°, as displayed in Figure 9. Additionally, the relationship between the vapor volume and the valve spool half cone angle obtained from Figure 7 is presented in Figure 10.
The cavitation simulations were carried out by setting up nine groups of different valve spool half cone angle and valve seat cone angle from small to large, and the cavitation phenomena were compared as shown in Figure 11. It can be seen that, compared with the seat cone angle, the variation of the spool half cone angle size has less effect on the degree of valve cavitation.

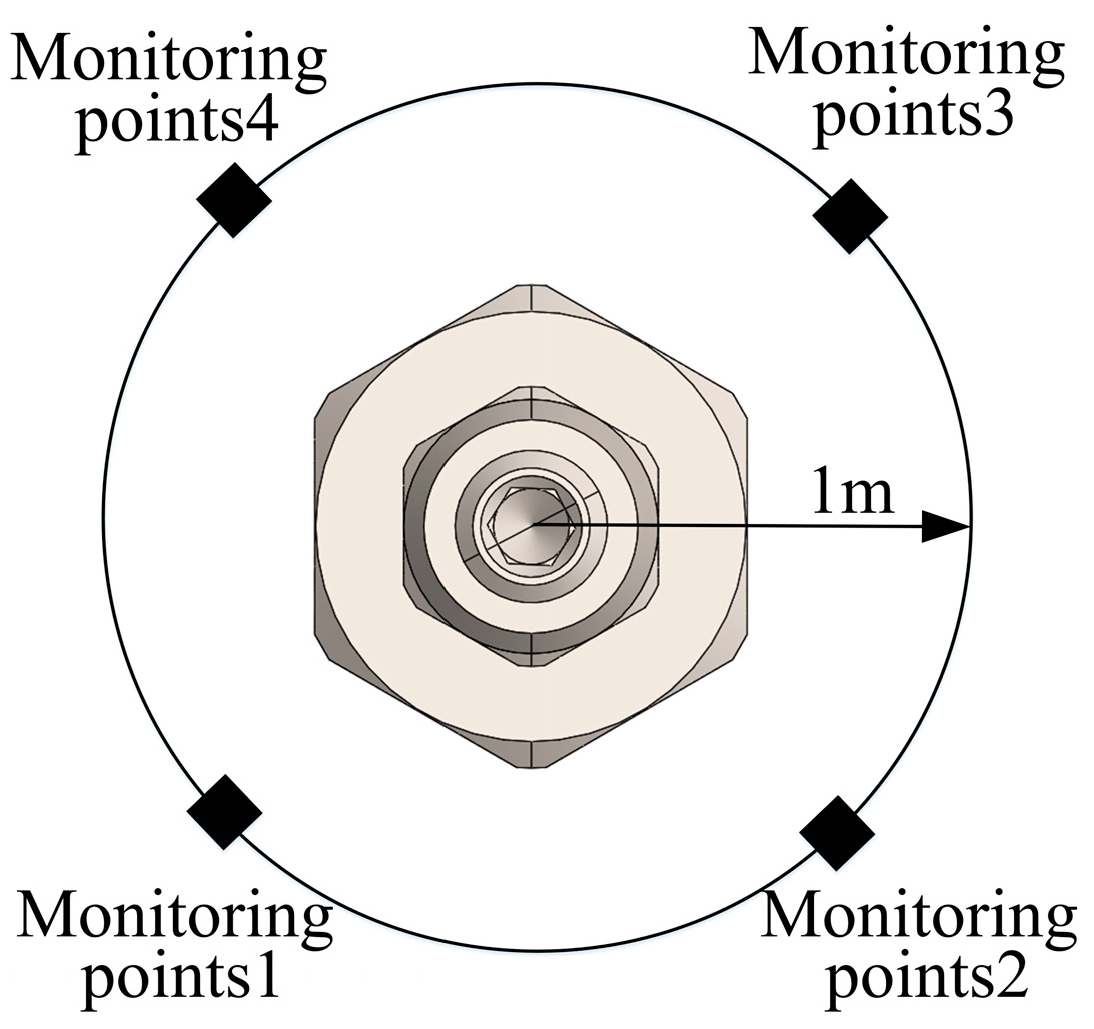
3.2. Analysis of Sound Field

The cavitation flow field was substituted into the sound field for numerical analysis. Figure 12 indicates that four noise detection points were set up at a distance of 1 m around the test valve.
The frequency response curves of the sound pressure level (SPL) at four monitoring points are shown in Figure 13. The numerical calculation results of each monitoring point are different for specific values; however, the overall trend is basically the same, and the main components of cavitation noise are at their peak point, and the peak point distribution is mainly at high frequencies. At this point, the total sound pressure level at the four monitoring points averaged 102.25 dB.
The sound field simulation was performed separately for the cavitation flow field with different valve seat cone angles for the above cavitation simulation. Figure 14 displays the sound pressure levels at four noise monitoring points. This can be obtained from different valve seat cone angles of the sound pressure change rule. The sound pressure variation rules of different valve seat cone angles are obtained.
The sound pressure levels obtained from the four noise monitoring points were averaged and compared with their corresponding seat cone angle cavitation levels (Figure 15). It can be observed that the cavitation flow field noise and the cavitation degree exhibit the same trends. Therefore, as the valve seat cone angle increased, the noise generated by cavitation gradually reduced, with noise levels at valve seat cone angles 170° and 120° reduced by 22.25 dB. Figure 16 displays the frequency response curve of sound pressure level at the seat cone angle of 170°, indicating a notably lower sound pressure level than that at a 120° angle.
The sound pressure levels obtained from the four noise monitoring points were averaged and compared with their corresponding seat cone angle cavitation levels (Figure 17). It can be observed that the cavitation flow field noise and the cavitation degree exhibit the same trends. Therefore, as the valve spool half cone angle increased, the noise generated by cavitation gradually reduced, with noise levels at valve seat cone angles 12° and 15° reduced by 2.25 dB. A comparison of the sound pressure levels of the nine sets of different spool half cone angles and seat cone angles is shown in Figure 18. It can be seen that, compared with the valve seat, the spool half cone angle size change in the degree of sound pressure level generated by the valve is small. Therefore, the effect of the spool half cone angle on the cavitation noise of the valve can be ignored and the valve can be optimized only for the size of the seat cone angle.
Figure 19 depicts different valve seat cone angles without cavitation phenomenon of the flow field into the sound field for numerical analysis. Different valve seat cone angles can be observed without cavitation phenomenon, and the sound pressure level is close.
Figure 20 compares the average noise levels at different seat cone angles with and without cavitation. Without cavitation, the noise generated by relief valve operation was lower, and changing the seat cone angle has minimal effect on noise levels. Conversely, with cavitation, the noise generated by relief valve operation was higher, and changing the valve seat cone angle can change the cavitation phenomenon, thereby changing the generated noise. It can be concluded that cavitation is one of the causes of noise generated by the relief valve. Therefore, in the design of direct-acting relief valves, increasing the value seat cone angle is recommended.

4. Experimental Validation

4.1. Test Platform

To verify the accuracy of simulation results, this study utilized the relief valve experimental platform (Figure 21) to test the noise level of a direct-acting relief valve during operation. Ensure there are no other sources of sound around the test platform and arrange acoustic foam around the valve under test to ensure that the reflected and overlapping sound is shielded.
As illustrated in Figure 22, valve seats with cone angles of 120° and 170° were manufactured and tested for noise under operating conditions. Experiments on noise level with the valve seat cone angles of 120° and 170° have been carried out in three groups, namely Torδ and Topδ (δ = 1, 2, 3), respectively.
During relief valve testing, the original and optimized valves were installed in the same hydraulic system and noise measurements were made in the same operating environment. A digital sound level meter was mounted 1 m from the experimental valve. To ensure the reliability of the results, the noise sound pressure levels of both valves were taken under the same operating conditions.

4.2. Comparison of Simulation and Experiment

Figure 23 displays the comparison of experimental test results with simulated results. The simulation results for the original and optimized valves are named Sor and Sop, respectively.
Based on the experimental results, the simulated sound pressure level of the original valve simulation was 102.3 dB, while the average sound pressure level of the three groups of the original valve experimental test was 99.9 dB. The simulated sound pressure level of the optimized valve was 80 dB, while the average sound pressure level of three optimized valve experimental tests was 81.7 dB.
The deviation expression for the valve simulation and experimental test is as follows:
η = S P L s i m u l a t e S P L t e s t S P L t e s t × 100 %
The relative deviations between the simulation and experimental test results of the original and optimized are 2.4% and 2.08%, respectively. It can be seen that the correctness of the simulation model of the relief valve and the feasibility of the optimization direction are verified.

5. Conclusions

This study conducted simulation and experimental analyses of the cavitation flow field and sound field in a direct-acting relief valve to determine how the structural parameters of the direct-acting relief valve affect cavitation and the resulting noise. The main conclusions of this study are as follows:
(1)
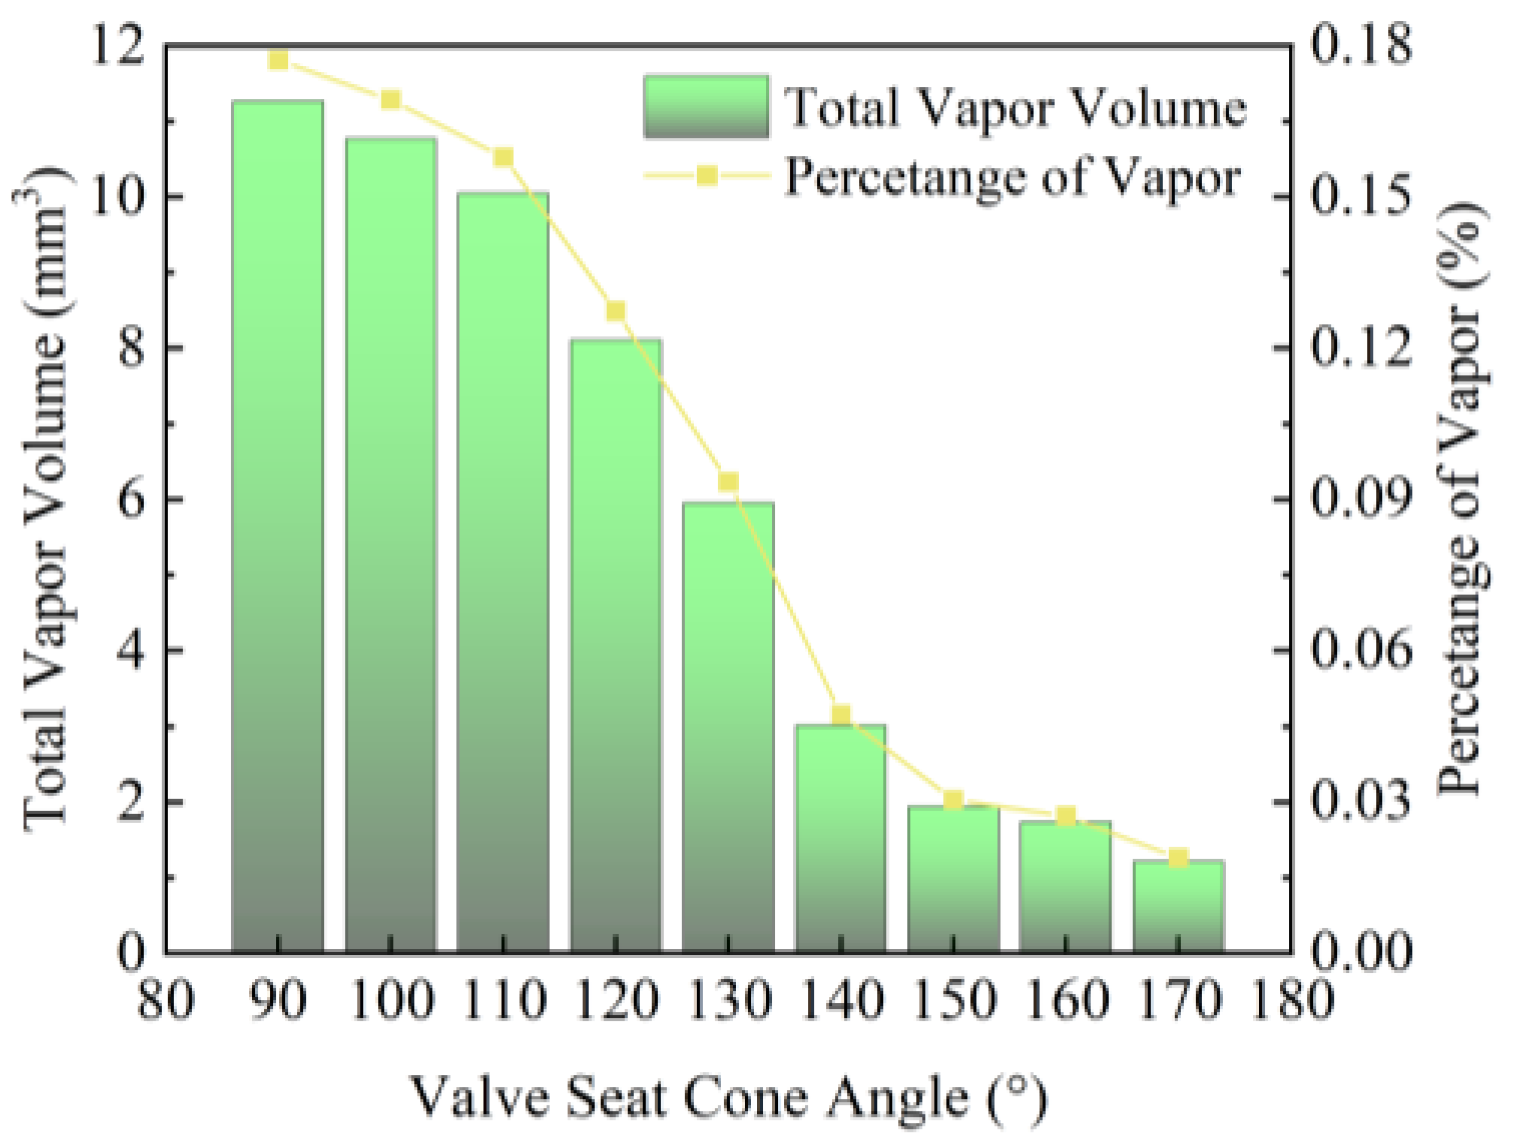
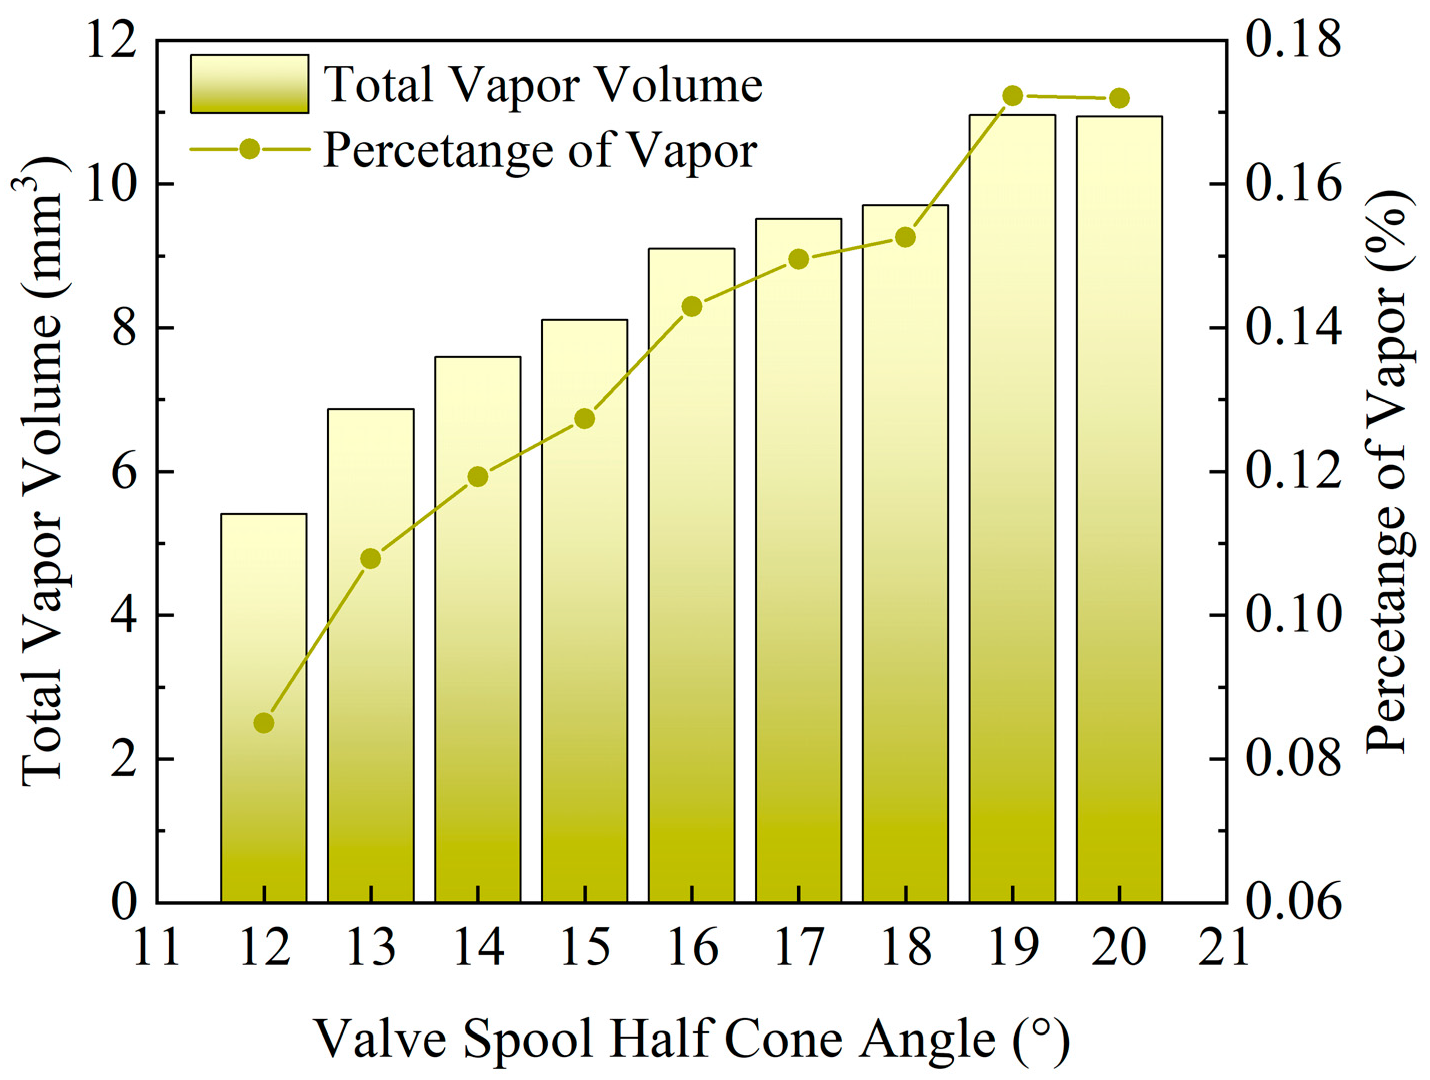
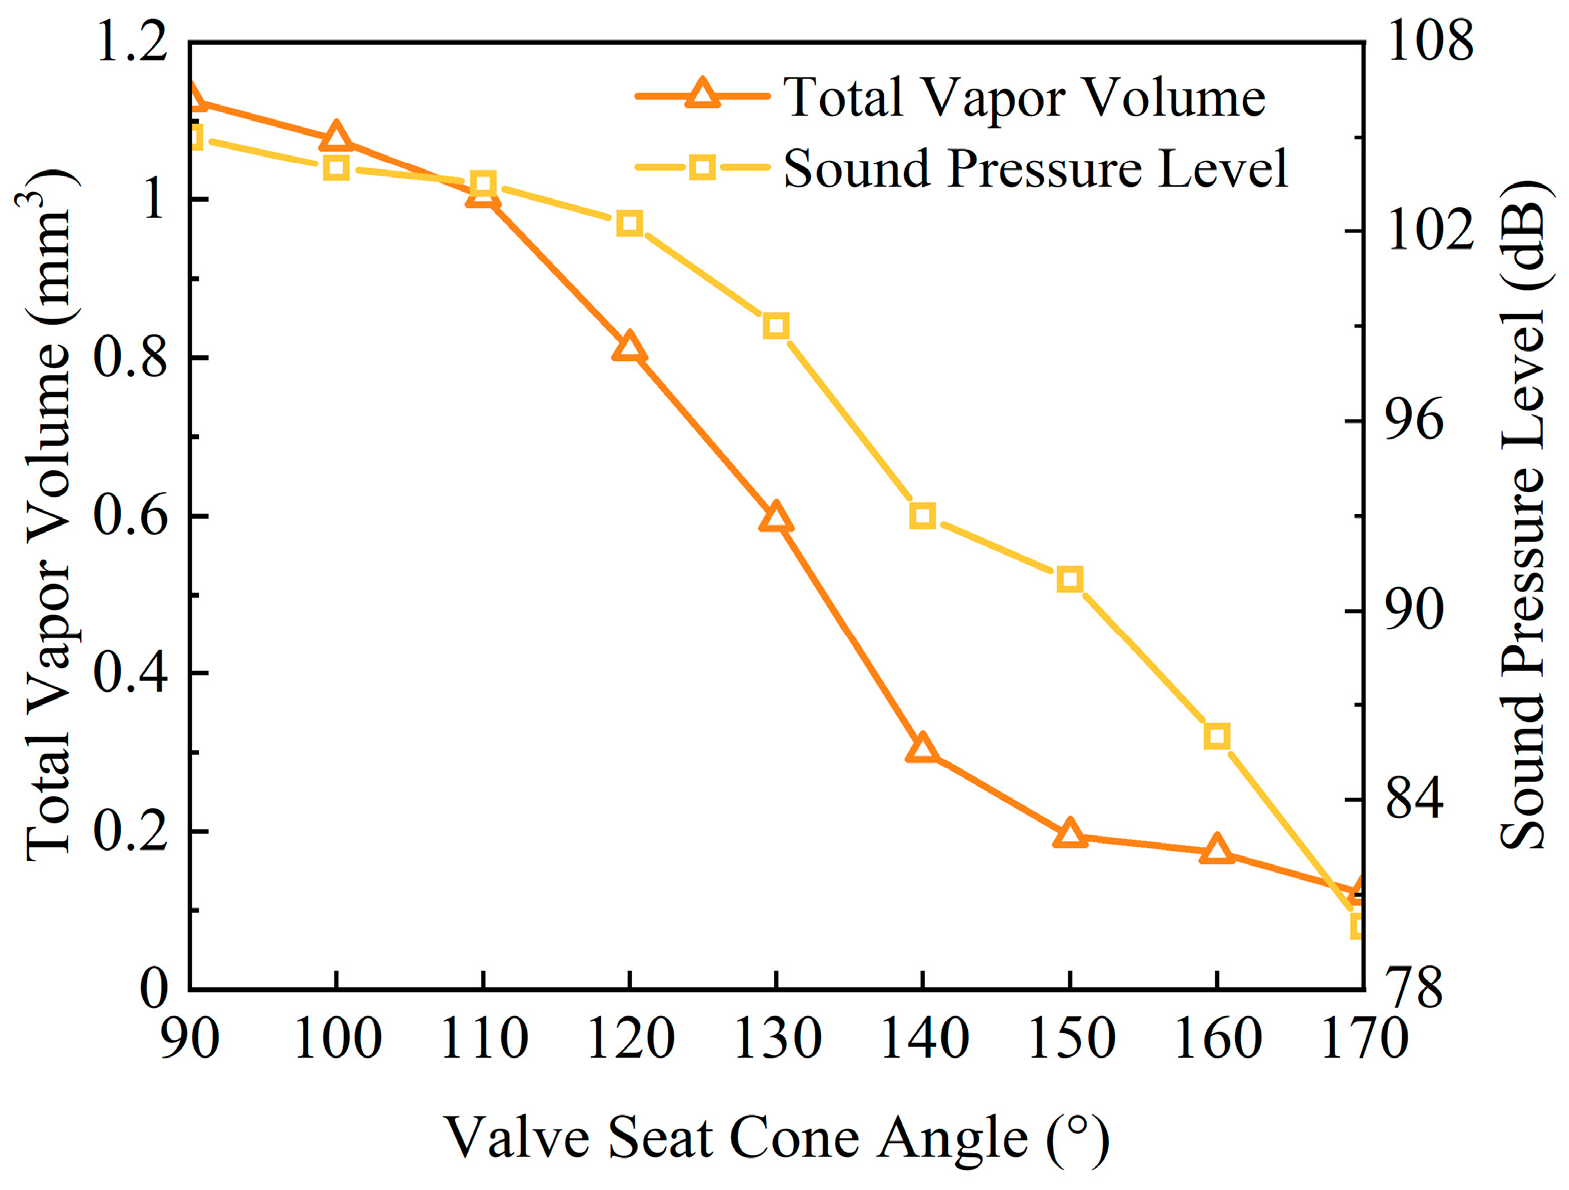
Direct-acting relief valves are prone to cavitation, particularly at the valve seat cone angle. However, increasing the seat cone angle significantly reduced the vapor volume fraction within the relief valve compared to the total vapor volume, thereby reducing the risk of cavitation.
(2)
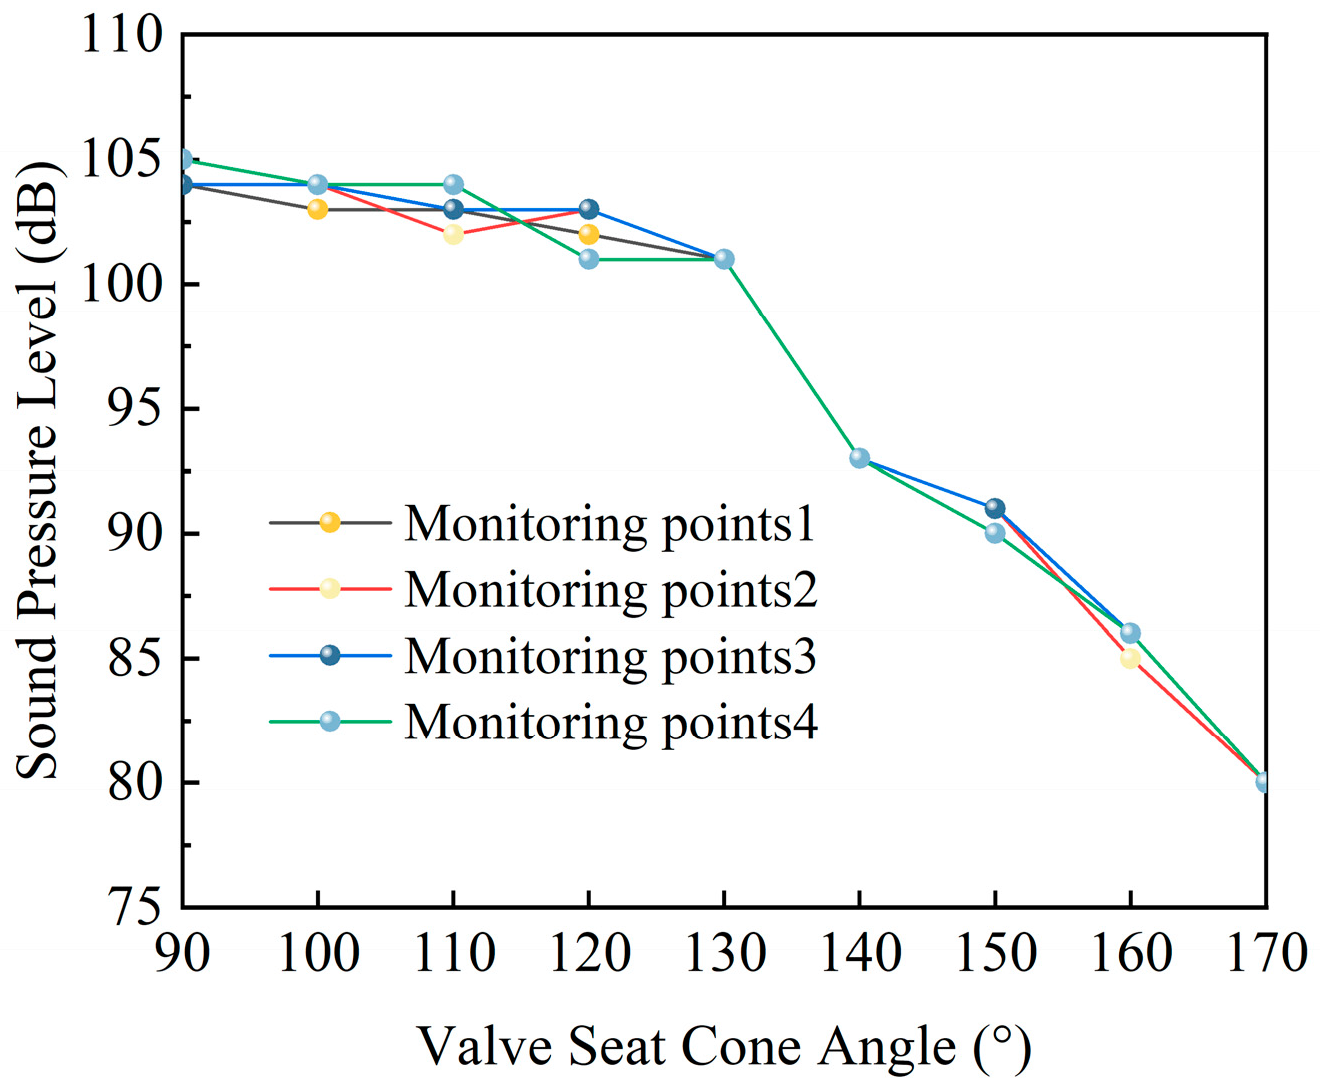
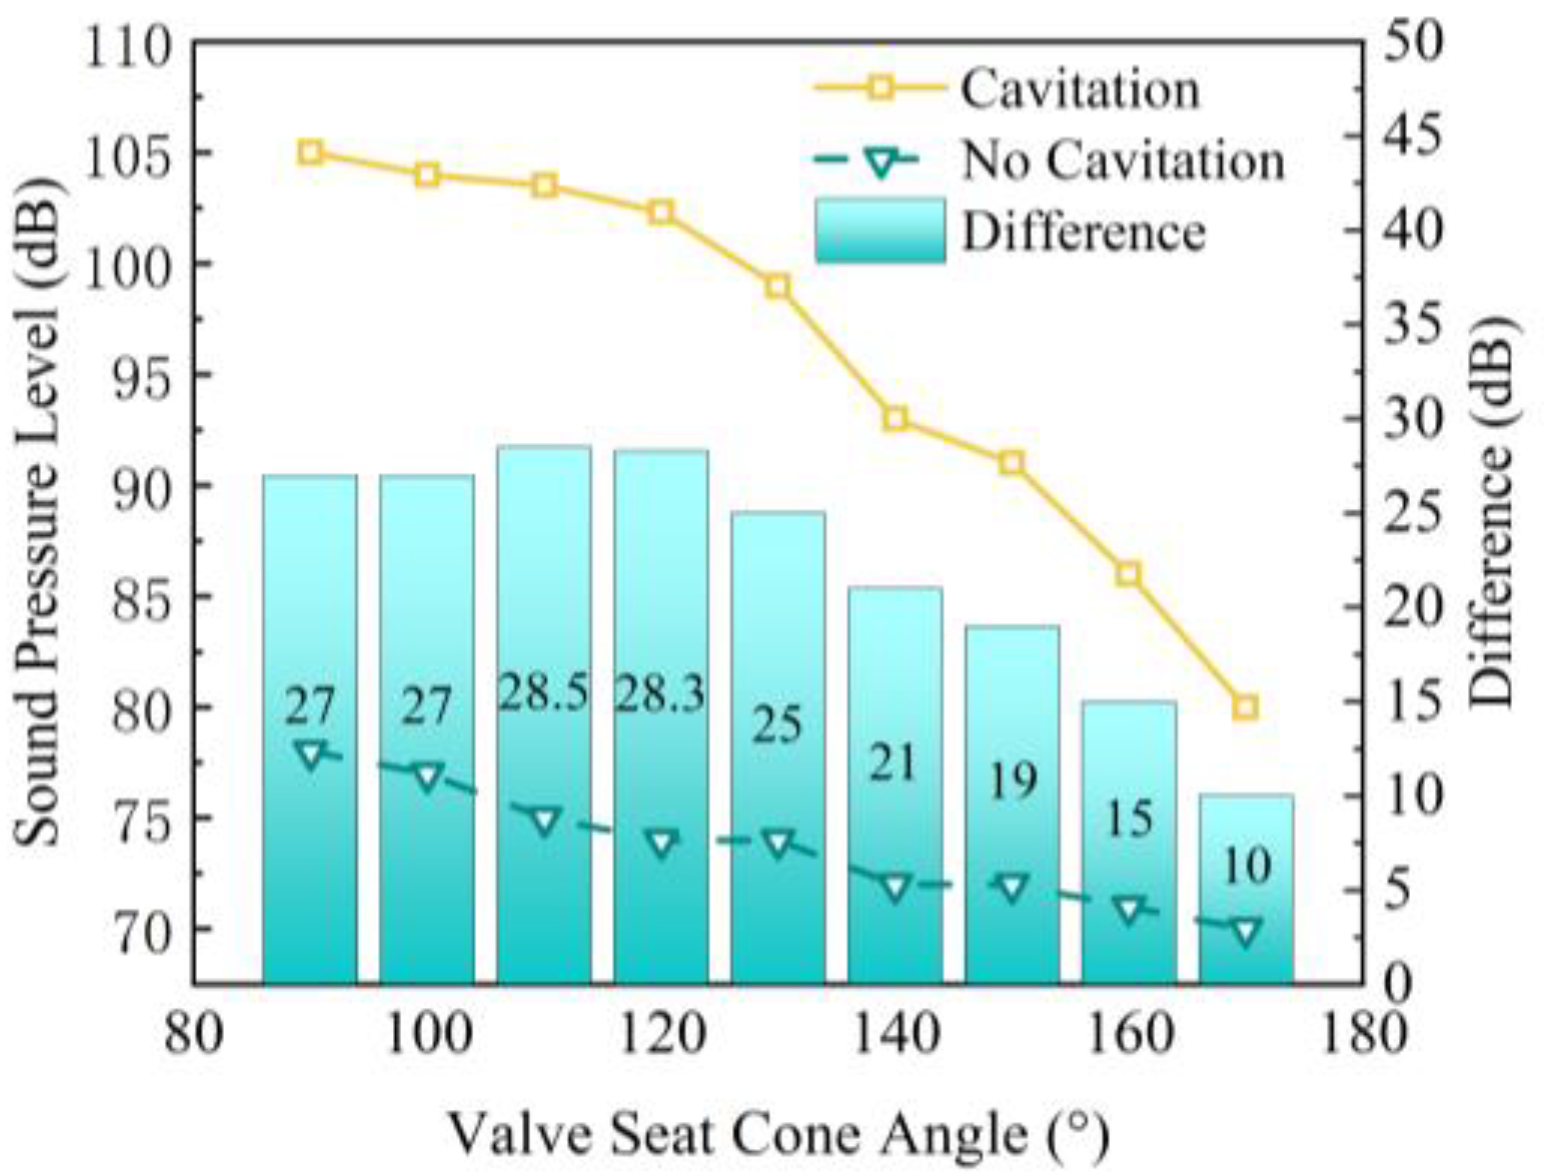
When the relief valve spool opening is small, and cavitation is absent, the resulting noise is minimal, and a change in the valve seat cone angle has little impact on the noise. Conversely, when cavitation occurs, the generated noise is higher, suggesting that cavitation is the main cause of noise generated during relief valve operation.
(3)
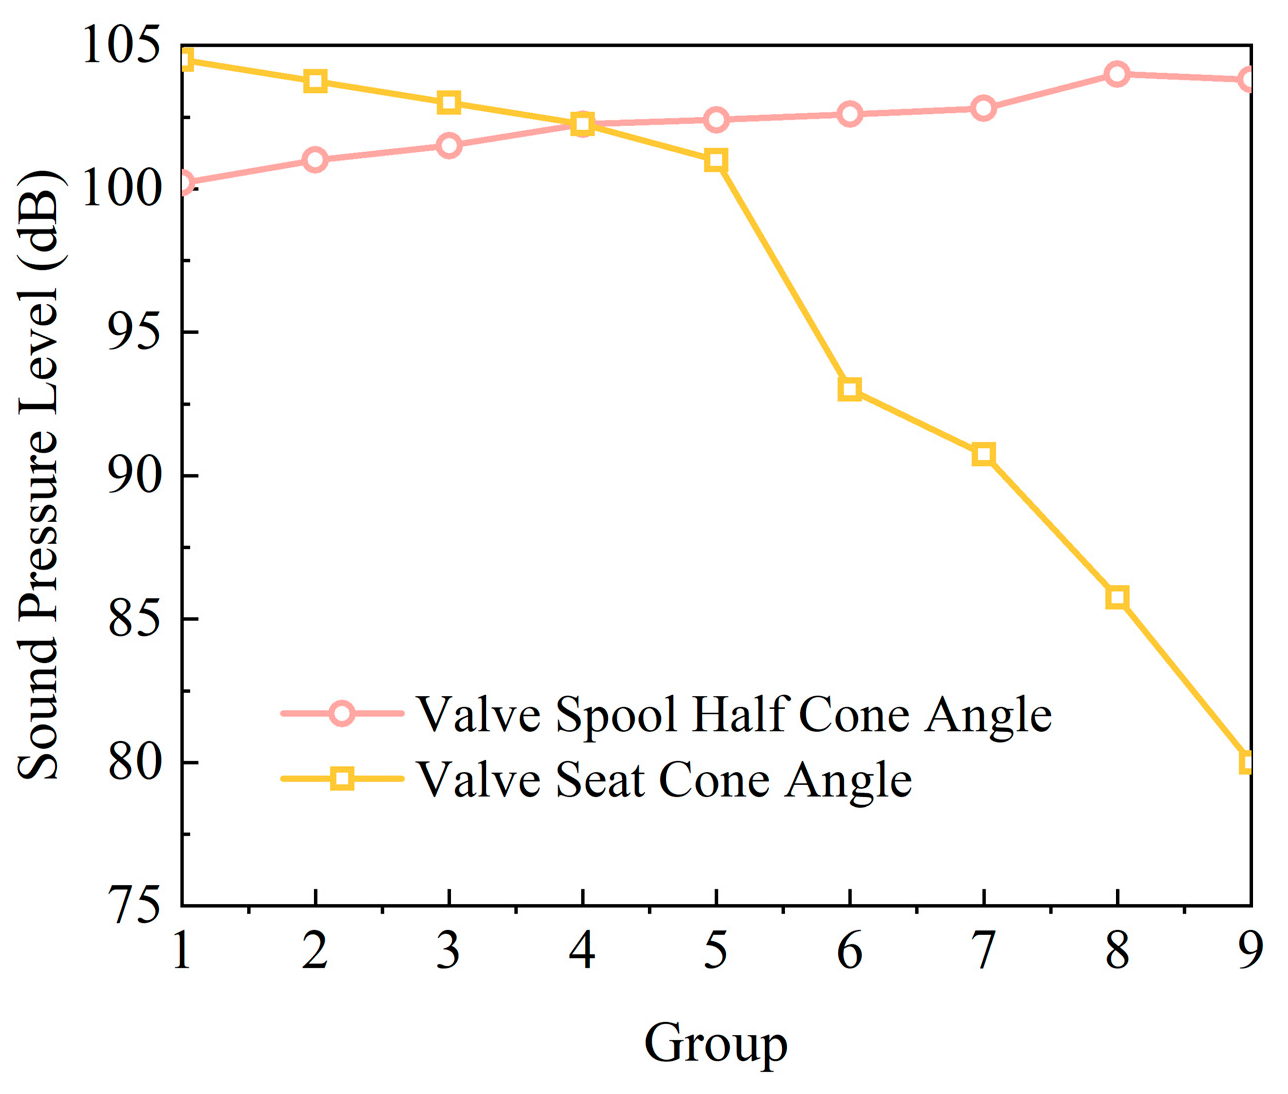
The simulation and experimental test results exhibit similar trends, with a relative deviation of 2.4% for the simulation and 2.08% for the experimental test, validating the accuracy of each other. Optimization of the seat cone angle reduces the noise level of the relief valve by 18.2 dB.

Author Contributions

Conceptualization, T.Q. and Z.W.; methodology, T.Q.; software, J.Z.; validation, T.Q., Z.W. and J.Z.; formal analysis, Z.W.; investigation, T.Q.; writing—original draft preparation, Z.W. and J.Z.; writing—review and editing, L.Y., Y.S. and C.A.; project administration, L.Y.; funding acquisition, L.Y. All authors have read and agreed to the published version of the manuscript.

Funding

This research was funded by the National Natural Science Foundation of China under Project 52305073 and the Hebei Province Higher Education Science and Technology Research Project CXY2024034.

Data Availability Statement

Data are contained within the article.

Conflicts of Interest

Author Jiannan Zhang was employed by the company Henan Aerospace Hydraulic and Pneumatic Technology Co., Ltd. The remaining authors declare that the research was conducted in the absence of any commercial or financial relationships that could be construed as a potential conflict of interest.

References

  1. Yin, Y.B.; Wang, D.; Li, W.D.; Fu, J.Y.; He, P.F.; Zhang, X.B. Effect of the resonance suppression damping on the stability of a cartridge pilot-operated relief valve. J. Fluids Struct. 2023, 121, 103948. [Google Scholar] [CrossRef]
  2. Jiao, Z.X.; Zhang, H.; Shang, Y.X.; Liu, X.C.; Wu, S. A power-by-wire aircraft brake system based on high-speed on-off valves. Aerosp. Sci. Technol. 2020, 106, 106177. [Google Scholar] [CrossRef]
  3. Ding, R.Q.; Zhang, J.H.; Xu, B.; Cheng, M. Programmable hydraulic control technique in construction machinery: Status, challenges and countermeasures. Autom. Constr. 2018, 95, 172–192. [Google Scholar] [CrossRef]
  4. Ji, H.; Fu, X.; Yang, H.; Tsukiji, T. Investigation into cavitation induced noise within hydraulic relief valve. Proceedings of the JFPS International Symposium on Fluid Power. Jpn. Fluid Power Syst. Soc. 2002, 2002, 409–412. [Google Scholar]
  5. Yi, D.Y.; Lu, L.; Zou, J.; Fu, X. Interactions between poppet vibration and cavitation in relief valve. Proc. Inst. Mech. Eng. Part C J. Mech. Eng. Sci. 2015, 229, 1447–1461. [Google Scholar] [CrossRef]
  6. Xu, H.; Wang, H.H.; Hu, M.Y.; Jiao, L.Y.; Li, C. Optimal design and experimental research of the anti-cavitation structure in the water hydraulic relief valve. J. Press. Vessel. Technol. 2018, 140, 051601. [Google Scholar] [CrossRef]
  7. Yuan, C.; Zhu, L.S.; Du, Z.L.; Liu, S.Q. Numerical investigation into the cavitating jet inside water poppet valves with varied valve seat structures. Eng. Appl. Comput. Fluid Mech. 2021, 15, 391–412. [Google Scholar] [CrossRef]
  8. Wu, W.R.; Qiu, B.H.; Tian, G.T.; Liao, X.N.; Wang, T. CFD-based cavitation research and structure optimization of relief valve for noise reduction. IEEE Access 2022, 10, 66356–66373. [Google Scholar] [CrossRef]
  9. Kudźma, Z.; Stosiak, M. Studies of flow and cavitation in hydraulic lift valve. Arch. Civ. Mech. Eng. 2015, 15, 951–961. [Google Scholar] [CrossRef]
  10. Zhang, J.; Qi, N.M.; Jiang, J.H. Effect of cone throttle valve pressure on cavitation noise. J. Eng. 2020, 2020, 275–281. [Google Scholar] [CrossRef]
  11. Wang, H.; Zhu, Z.M.; Xu, H.C.; Li, J.L. Effects of throttling structures on cavitation flow and circumferential uniformity in a control valve. Eng. Fail. Anal. 2022, 134, 106025. [Google Scholar] [CrossRef]
  12. Gao, H.; Lin, W.; Tsukiji, T. Investigation of cavitation near the orifice of hydraulic valves. Proc. Inst. Mech. Eng. Part G J. Aerosp. Eng. 2006, 220, 253–265. [Google Scholar] [CrossRef]
  13. Wang, G.; Deng, J.; Kou, L.Y.; Wang, W.H.; Gao, Q.F.; Zhu, X.J. Study on the influence of structural parameters on the flow and cavitation characteristics of tandem multi-stage pressure-reducing valves. Flow Meas. Instrum. 2022, 87, 102230. [Google Scholar]
  14. Han, M.X.; Liu, Y.S.; Wu, D.F.; Zhao, X.F.; Tan, H.J. A numerical investigation in characteristics of flow force under cavitation state inside the water hydraulic poppet valves. Int. J. Heat Mass Transf. 2017, 111, 1–16. [Google Scholar] [CrossRef]
  15. Qian, J.Y.; Xu, J.X.; Fang, L.; Zhao, L.; Wu, J.Y.; Jin, Z.J. Effects of throttling windows on cavitation flow of sleeve control valve. Ann. Nucl. Energy 2023, 189, 109841. [Google Scholar] [CrossRef]
  16. Wei, L.; Zhu, G.R.; Qian, J.Y.; Fei, Y.; Jin, Z.J. Numerical simulation of flow-induced noise in high pressure reducing valve. PLoS ONE 2015, 10, e0129050. [Google Scholar] [CrossRef] [PubMed]
  17. He, J.; Zhang, Y.J.; Liu, X.M.; Li, B.B.; Sun, S.Z.; Peng, J.J.; Liu, W.W. Experiment and simulation study on cavitation flow in pressure relief valve at different hydraulic oil temperatures. Flow Meas. Instrum. 2023, 89, 102289. [Google Scholar] [CrossRef]
  18. An, W.; Ren, L.; Bai, Y.Y.; Bao, G. Numerical simulation of the temperature rise and cavitation flow in a hydraulic slide valve. Flow Meas. Instrum. 2024, 96, 102553. [Google Scholar] [CrossRef]
  19. Zhang, G.; Wang, W.W.; Wu, Z.Y.; Chen, D.S.; Kim, H.D.; Lin, Z. Effect of the opening degree on evolution of cryogenic cavitation through a butterfly valve. Energy 2023, 283, 128543. [Google Scholar] [CrossRef]
  20. Guo, P.C.; Sun, L.G.; Sun, S.H.; Feng, J.J.; Wu, K.G.; Luo, X.Q. Numerical acoustic characteristics and optimum design of the pressure reducing valve. In IOP Conference Series: Earth and Environmental Science; IOP Publishing: Bristol, UK, 2016; Volume 49, p. 062022. [Google Scholar]
  21. Xu, B.; Hu, H.F.; Yang, K.; Wang, H.J. The role of thermodynamic effects in Cavitation: Impacts on cavitation structure and propagation of cavitation noise. Nucl. Eng. Des. 2024, 418, 112921. [Google Scholar] [CrossRef]
  22. Jin, H.Z.; Zhang, J.M.; Liu, X.F.; Wang, C. Study on flow-induced noise characteristics of multistage depressurization valve in the nuclear power plant. Nucl. Eng. Des. 2023, 407, 112282. [Google Scholar] [CrossRef]
  23. Lu, L.; Wang, J.; Li, M.R.; Ryu, S.H. Experimental and numerical analysis on vortex cavitation morphological characteristics in u-shape notch spool valve and the vortex cavitation coupled choked flow conditions. Int. J. Heat Mass Transf. 2022, 189, 122707. [Google Scholar] [CrossRef]
  24. Liu, H.S.; Xu, Y.; Wang, J.X. Experimental and numerical simulations to examine the mechanism of nozzle geometry affecting cavitation water jets. Geoenergy Sci. Eng. 2024, 233, 212511. [Google Scholar] [CrossRef]
  25. Chang, Z.B.; Zhao, L.; Mai, C.L.; Peng, Y.; Jiang, J. Study on noise induced by cavitation flow in orifice plates. Ocean Eng. 2023, 287, 115772. [Google Scholar] [CrossRef]
  26. Yuan, C.; Song, J.C.; Liu, M.H. Investigation of flow dynamics and governing mechanism of choked flow for cavitating jet in a poppet valve. Int. J. Heat Mass Transf. 2019, 129, 113–131. [Google Scholar] [CrossRef]
  27. Cheng, H.Y.; Bai, X.R.; Long, X.P.; Ji, B.; Peng, X.X.; Farhat, M. Large eddy simulation of the tip-leakage cavitating flow with an insight on how cavitation influences vorticity and turbulence. Appl. Math. Model. 2020, 77, 788–809. [Google Scholar] [CrossRef]
  28. Yang, Z.P.; Wang, X.C.; Zhao, X.T.; Cheng, H.Y.; Ji, B. LES investigation of the wavy leading edge effect on cavitation noise. Ultrason. Sonochemistry 2024, 103, 106780. [Google Scholar] [CrossRef]
  29. Liang, J.; Luo, X.; Liu, Y.; Li, X.; Shi, T. A numerical investigation in effects of inlet pressure fluctuations on the flow and cavitation characteristics inside water hydraulic poppet valves. Int. J. Heat Mass Transf. 2016, 103, 684–700. [Google Scholar] [CrossRef]
  30. Zwart, P.J.; Gerber, A.G.; Belamri, T. A two-phase flow model for predicting cavitation dynamics. In Proceedings of the Fifth International Conference on Multiphase Flow, Yokohama, Japan, 30 May–3 June 2004; Volume 152. [Google Scholar]
  31. Yang, C.; Zhang, J.S.; Huang, Z.W. Numerical study on cavitation–vortex–noise correlation mechanism and dynamic mode decomposition of a hydrofoil. Phys. Fluids 2022, 34, 125105. [Google Scholar] [CrossRef]
Figure 1. Schematic diagram of the operating principle of a direct-acting relief valve.
Machines 12 00434 g001
Figure 2. Computational domain of relief valve.
Machines 12 00434 g002
Figure 3. Computational mesh model.
Machines 12 00434 g003
Figure 4. Effect of the number of grid elements on the simulation results of inlet pressure and vapor volume.
Machines 12 00434 g004
Figure 5. Vapor volume cloud.
Machines 12 00434 g005
Figure 6. Schematic of the original seat cone angle of a direct-acting relief valve.
Machines 12 00434 g006
Figure 7. Vapor volume cloud at different seat cone angles.
Machines 12 00434 g007aMachines 12 00434 g007b
Figure 8. Maximum vapor volume fraction at different seat cone angles.
Machines 12 00434 g008
Figure 9. Vapor volume cloud at different spool half cone angles.
Machines 12 00434 g009aMachines 12 00434 g009b
Figure 10. Maximum vapor volume fraction at different spool half cone angles.
Machines 12 00434 g010
Figure 11. Comparison of vapor volume fraction between seat cone angles and spool half cone angles.
Machines 12 00434 g011
Figure 12. Schematic distribution of monitoring points.
Machines 12 00434 g012
Figure 13. Frequency response curve of sound pressure level of the original valve.
Machines 12 00434 g013
Figure 14. Sound pressure levels at different seat cone angles.
Machines 12 00434 g014
Figure 15. Vapor volume compared to sound pressure level.
Machines 12 00434 g015
Figure 16. Frequency response curves of sound pressure level of optimized valves.
Machines 12 00434 g016
Figure 17. Sound pressure levels at different spool half cone angles.
Machines 12 00434 g017
Figure 18. Comparison of sound pressure level between seat cone angles and spool half cone angles.
Machines 12 00434 g018
Figure 19. Frequency response curves of sound pressure levels at different seat cone angles without cavitation.
Machines 12 00434 g019
Figure 20. Comparison of noise with and without cavitation at different seat cone angles.
Machines 12 00434 g020
Figure 21. Relief valve test platform.
Machines 12 00434 g021
Figure 22. Manufactured valve seats with two different cone angles.
Machines 12 00434 g022
Figure 23. Simulation and experimental comparison of original and optimized valves.
Machines 12 00434 g023
Table 1. Boundary conditions and parameter settings.
NumberParameter NameUnitValue
1Valve Openingmm0.08
2Inlet pressureMPa25
3Outlet pressureMPa0
Table 2. Properties of oil and vapor.
FluidDensity (kg/m3)Viscosity (Pa·s)
Oil8900.04094
vapor1.2251.7894 × 10−5
Disclaimer/Publisher’s Note: The statements, opinions and data contained in all publications are solely those of the individual author(s) and contributor(s) and not of MDPI and/or the editor(s). MDPI and/or the editor(s) disclaim responsibility for any injury to people or property resulting from any ideas, methods, instructions or products referred to in the content.

