Article

Fault Diagnosis in Induction Motors through Infrared Thermal Images Using Convolutional Neural Network Feature Extraction

by
Uriel Calderon-Uribe
1,
Rocio A. Lizarraga-Morales
2,* and
Igor V. Guryev
1
1
Departamento de Estudios Multidisciplinarios, División de Ingenierías, Campus Irapuato-Salamanca, Universidad de Guanajuato, Yuriria 38940, Mexico
2
Departamento de Arte y Empresa, División de Ingenierías, Campus Irapuato-Salamanca, Universidad de Guanajuato, Salamanca 36885, Mexico
*
Author to whom correspondence should be addressed.
Machines 2024, 12(8), 497; https://doi.org/10.3390/machines12080497
Submission received: 2 July 2024 / Revised: 20 July 2024 / Accepted: 21 July 2024 / Published: 23 July 2024
(This article belongs to the Special Issue Application of Deep Learning in Fault Diagnosis)

Abstract

:
The development of diagnostic systems for rotating machines such as induction motors (IMs) is a task of utmost importance for the industrial sector. Reliable diagnostic systems allow for the accurate detection of different faults. Different methods based on the acquisition of thermal images (TIs) have emerged as diagnosis systems for the detection of IM faults to prevent the further generation of faults. However, these methods are based on artisanal feature selection, so obtaining high accuracy rates is usually challenging. For this reason, in this work, a new system for fault detection in IMs based on convolutional neural networks (CNNs) and thermal images (TIs) is presented. The system is based on the training of a CNN using TIs to select and extract the most salient features of each fault present in the IM. Subsequently, a classifier based on a decision tree (DT) algorithm is trained using the features learned by the CNN to infer the motor conditions. The results of this methodology show an improvement in the accuracy, precision, recall, and F1-score metrics for 11 different conditions.

1. Introduction

In the last decade, rotatory machines such as induction motors (IMs) have played an important role in industrial development. Industries such as manufacturing, transportation, and fabrics benefit from the high-efficiency generation of IMs [1,2,3]. However, IMs are subject to harsh working conditions such as long working periods, mechanical and electrical stress, overloads, abrasion, and unbalanced loads, resulting in premature deterioration and motor failure. For this reason, monitoring systems have been developed to prevent IMs from being damaged or to avoid waste of resources [4,5]. Early detection of faults or abnormal states in IMs, including stator faults, rotor electrical faults, and short-circuit faults, can improve the lifespan of the motor, generating maximum productivity and minimum downtime.
In recent years, a large number of methodologies have been proposed for fault detection in IMs. These methodologies can be divided into two different sets, namely invasive methodologies and non-invasive methodologies [6,7]. On the one hand, within invasive methodologies, signal acquisition is the most used technique for detecting failures in IMs. Torque and current are the most commonly measured signals [8,9,10]. However, due to their complexity, these methodologies are not suitable for harsh work environments, since it could be difficult to identify faults in IMs at early stages. Moreover, these methodologies are usually expensive and can cause fatal injuries during installation [11,12]. On the other hand, non-invasive methodologies such as thermal analysis (TA) emerge as an alternative for detecting faults in IMs [13]. The main objective of TA is to capture patterns through thermal images (TIs) and infer the motor conditions. IM failures often cause an increase in temperature, so it is possible to diagnose motor conditions based on thermal patterns. The framework followed by the methods that use TIs involves improving the output image via pre-processing to detect the region of interest (ROI) [14,15,16]. Subsequently, different segmentation techniques, both manual and automatic, are used to infer the motor conditions [17]. In the first case, within the manual segmentation, in [18], TIs were manually segmented, and the hottest points were detected to determine the failures in the IM. In [14], first- and second-order statistical features were extracted to select the most outstanding ones using a linear discriminant algorithm (LDA) [19]. Subsequently, a multi-layer perceptron (MLP) wass used to infer the motor conditions. In [20], a histogram-based technique was used to extract features from the TIs. Then, an MLP was used to infer the faults present in the motor. Alternatively, within the automatic segmentation methods, in [21], the watershed technique was implemented to find the area of interest within the TIs. Subsequently, a neuro-fuzzy classifier was implemented to categorize faults in the IM. In [17], thermal images were segmented into three different zones using the scale-invariant feature transform (SIFT) method. Then, temperature feature was extracted in each zone. Finally, this feature was used to build a classifier and infer the motor conditions. In [22], thermal images were first categorized into two classes, namely cold and hot, using a decision tree. Subsequently, the region of interest was extracted using the block-wise method and the random forest algorithm. Finally the random forest was trained to infer 11 different faults present in the IM.
Although the aforementioned methods achieve a reasonable classification rate in automatically classifying IM faults, there are still unresolved practical problems. First, although the extraction of statistical features provides useful information for the automatic identification of faults in IMs, the acquisition of TIs under different environmental conditions can generate different statistical features. Therefore, different failures presented in the IM could have statistical features in common, generating misclassification problems. Secondly, although the extraction of the ROI allows for segmentation in the study area, this area is compromised when the raw image presents noise, which can generate a false ROI, triggering misclassification. Thirdly, recent classification methods used in IMs are based on unbiased datasets. This generates false ranking indices so that such methods cannot not perform well in practical environments. To address the aforementioned problems, a new system based on CNN and DT classifiers is presented. Using the dataset presented in [22,23], two subsets (training and testing sets) are created to train, tune, and evaluate the final model. First, the training set is used to tune a CNN. The tuning process consists of fitting the training set to the CNN model. Two outputs are part of the CNN model. One output, composed of 11 nodes, is used to adjust the weights in the network. The second output is used as a feature vector to fit the DT. Once the CNN is trained, the training set is evaluated again on the CNN to extract the most salient features of each of the faults. Then, these features are used to train and tune a DT classifier. Finally, the DT classifier is evaluated using the testing set, showing improvements in metrics such as accuracy, precision, recall, and F1 score. Although this technique has been applied in signal and image processing areas [24,25,26], it has not been implemented in detecting faults in induction motors. The main contribution of the proposed model is that there is no need to extract features from TIs manually. The features are automatically extracted by the CNN. Moreover, the proposed model is resistant to noise presented in the image, which makes the model more suitable for harsh environments. Thus, the model efficiently classifies 11 different IM fault conditions.
The remainder of this paper is structured as follows. Section 2 describes the methods used to infer the motor conditions based on TIs. The experimentation and the obtained results are discussed in Section 3. Finally, Section 4 describes the conclusions of the work.

2. Proposed Methodology

This section describes the proposed methodology for classifying IM faults in 11 interest classes. An overall description of the development of this methodology is presented in Figure 1. In this figure, it can be observed that the proposed method comprises six stages, namely image input, data augmentation, creation of training and testing sets, extraction of features with a CNN, training the DT based on extracted CNN features, and performance evaluation. In the first and second stages, the dataset proposed in [22] is subjected to random flip and random rotation in order to homogenize the classes in the dataset. In the third stage, the training and testing sets are created to train, tune, and evaluate the performance of the final model. Once the datasets are created, the training set is used in stage four to train a CNN that allows for the extraction of the most relevant features from each fault. Subsequently, in stage five, these features are used to train a DT classifier and infer the condition of the IM. Finally, the performance of the DT classifier is evaluated using the testing set. More details are presented in the following subsections.

2.1. Dataset Description

In this study, the dataset proposed in [22,23] was used to develop the suggested methodology. This dataset contains 369 images distributed across 11 different conditions. Each image has dimensions of 360 × 240 in RGB (red, green, and blue) format. Figure 2 shows the different conditions present in the dataset. From this figure, it can be observed that the dataset is composed of a healthy condition, 8 different inter-turn faults (ITFs), the combination of windings and stuck rotor faults, and cooling fan faults. Table 1 describes the set of images presented in each class.

2.2. Data Augmentation

In machine learning, data augmentation is a technique used to create artificial data from existing data [27]. The main goal of data augmentation is to homogenize the dataset. In this study, special attention is paid to unbalanced classes. This is because unbalanced datasets can generate misclassification. According to Table 1, the number of TIs presented in each class is lower than 30% stator 3-phase fault (42 thermal images). It is concluded that the dataset is not balanced. To address this issue, random flips (horizontal and vertical) and random rotations are used to balance the dataset according to the class with more TIs (this is the 30% stator 3-phase class). Figure 3 shows an example of the transformations used in the 50% stator 2-phase fault.
Once the dataset is balanced (462 thermal images, 42 images per class), two stratified sets are created, namely the training set and the testing set. The training set is formed by 369 (80% of the balanced dataset) TIs, while the testing set is composed of 93 (20% of the balanced dataset) TIs. Table 2 shows the data distribution through each set. Finally, all images are resized to 250 × 250 × 3 to fit in the CNN model.

2.3. Feature Extraction Using Convolutional Neural Network

In the classification process, feature extraction is a crucial step for the development of a predictive model. Relevant features need to be extracted to achieve high classification metrics. Traditional feature extraction methods are based on statistical features, while a CNN can learn features from raw images, achieving a better performance [28,29]. In this study, a CNN was constructed to learn features from the raw TIs. Thus, the proposed CNN is formed by two blocks, namely the feature-learning block and the classification block. Figure 4 shows the structure of the proposed CNN model.
In the feature-learning block, different convolutional operations are used to extract the most reliant features from each IM fault. The input data of this block are the raw TIs, which are a 3-dimensional matrix with a size of 250 × 250 × 3 . According to Figure 4, the featuring-learning block is formed by 5 blocks of 2-dimensional convolutional layers (2D convolutions) [30], 5 blocks of max-pooling layers [31], and rectified linear units (ReLUs) of activation functions [32].
Once the feature-learning stage is executed, the extracted feature vectors are input into the classification block. The classification block is formed by the flattening layer, one dense layer with 512 units and a ReLU as an activation function, a dropout layer [33] with a 0.5 frequency rate, one dense layer with 11 units, and a softmax activation function [34]. Finally, the loss function, the optimizer, the learning rate, and the batch size are set to sparse categorical cross entropy, the Adam optimizer, 0.001, and 16, respectively. Appendix A.1 describes the CNN training process.
Once the CNN is trained and evaluated, the feature-learning block is used to extract features from the training set. The main goal is to replace the classification block with a different classifier and maximize the performance in the evaluation process. In this study, the classification block was replaced with a decision tree (DT) classifier [35]. This is because fitting small datasets in a CNN can lead to overfitting [36]. For this reason, the classification block was changed to a model that can manipulate the information generated from small datasets—in this case, a DT [37]. The DT classifier was trained with the features generated by the CNN in the training set and evaluated using the features generated by the CNN in the testing set.

2.4. Decision Tree Classifier

In machine learning, a decision tree (DT) is a machine learning algorithm used for both classification and regression tasks [38,39]. The method consists of a root node and decision nodes. Based on the available features, both types of nodes perform evaluations to generate homogeneous subsets and create a final model [40]. To select the best attribute at each node, the Gini impurity gain and entropy gain methods act as splitting criteria for decision tree models. In this study, the Gini impurity gain was computed to select the best attribute at each node. Thus, the Gini impurity gain is defined according to Equation (1):
G i n i = 1 i k p i 2
where k denotes the samples from each class and p i represents the probability of samples belonging to class i. In this work, the DT classifier was trained with 80% of the data, corresponding to a vector composed of 369 samples and 512 features (the features extracted by the CNN) and evaluated by a testing set formed by 93 samples and 512 features.

3. Results and Discussion

3.1. Evaluation Metrics

In this study, all experimentation was performed on a computer with an AMD Ryzen 5600G to 3.9 GHz CPU, an NVIDIA GeForce GTX 1650 GPU with 4 GB, and 16 GB of RAM. The proposed models were run efficiently using PyTorch and scikit-learn frameworks [41]. During the implementation, different metrics were used to evaluate the performance of the model. Accuracy, precision, recall, and F1 score describe the evaluation process used in this study. Equations (2)–(5) illustrate the aforementioned metrics.
a c c u r a c y = T P + T N T P + F N + F P + T N
p r e c i s i o n = T P T P + F P
r e c a l l = T P T P + F N
F 1 - s c o r e = 2 ( p r e c i s i o n ) ( r e c a l l ) p r e c i s i o n + r e c a l l
where T P represents true positive, T N represents true negative, F P represents false positive, and F N represents false negative.

3.2. Hyperparameter Tuning

To obtain an optimal CNN, different combinations of hyperparameters and structures were exhaustively analyzed. Because there is a large number of combinations of hyperparameters and structures, some of them were chosen empirically. The hyperparameters selected empirically were the learning rate, the dropout rate, the convolutional kernels, and the number of dense layers. Table 3 shows two proposed models to infer IM faults.
Once the experimentation with different hyperparameters was accomplished, the final CNN architecture was selected according to the validation error. The hyperparameters that obtain the lowest validation error are shown in Table 4. All the suggested models were trained for 20 epochs in a range of time of 1.2 to 1.9 min.
Figure 5 shows the validation loss obtained by the proposed models. According to Figure 5, the model with the least validation loss is model 3, with the hyperparameters shown in Table 4.
After the CNN architecture was selected, different decision tree classifiers were trained using the features learned by the CNN. Unlike convolutional neural networks, decision trees do not contain many hyperparameters to tune. This allows the model to be trained and tuned quickly. Table 5 shows the hyperparameters that allowed the DT classifier to obtain the highest values for each metric.
For a clear vision of the improvement in classification rate achieved by the decision tree classifier using the CNN features, Figure 6 shows the confusion matrix generated by the CNN and the DT classifier. As shown in the figure, the classification index achieved by the decision tree classifier is higher than that achieved by the CNN.

3.3. Feature Extraction

To better understand the impact of feature selection, the Gradient-weighted Class Activation Mapping (Grad-CAM) algorithm was implemented [42], as discussed in the following analysis. The Grad-CAM method is a technique used to visualize the decision-making process generated by a CNN. The main objective is to calculate the gradient of the output class score concerning the feature maps of the last convolutional layer in the CNN; then, Grad-CAM determines the output class score. Subsequently, the feature maps are weighted using the calculated gradients, creating a heat map highlighting the input image’s main areas. Figure 7 shows the features extracted by the CNN that allow for the classification of the rotor class as a positive class.
As shown in the figure, the features obtained using the CNN are those that comprise the motor region. This removes unnecessary information from the image, leaving only the most salient features that allow the fault to be inferred.

3.4. Results

Using the classification results of the test set, the metrics established in Equations (2)–(5) are calculated. The results show that the proposed DT model with the CNN features reaches an accuracy of 98.0%, a precision of 98.0%, a recall of 98.0%, and an F1 score of 98.0% in a total of 93 samples distributed across 11 classes. These results show an improvement with the models represented in the state of the art. The details of the classification process are shown in Table 6. Results shown in Table 6 indicate that the proposed model achieves good performance on a small dataset.

3.5. Model Comparison

In order to evaluate the performance of the proposed model, the effectiveness achieved by the proposed methodology was compared with the performance achieved by different models present in the literature. The results obtained by each model can be found in Table 7. According to this table, the proposed model shows an advantage compared to the other models not only in the accuracy index but also in precision, recall, and F1 score. According to the comparison with the model proposed in [22], improvements of 5.2% in the accuracy metric, 5.9% in the precision metric, 4.8% in the recall metric, and 5.4% in the F1-score metric were achieved by the proposed model. In comparison with the methods proposed by different authors, the statistical feature extraction [14,43,44,45] techniques achieve good performance in IM fault classification. However, these methods are susceptible to noise presented in the image, preventing the achievement of good performance [28]. For this reason, the number of classes that the final model can classify decreases drastically. The proposed approach allows for the classification of 11 different classes, in comparison with [16,38,46], which only classifies a maximum of 6 different classes. This is because image processing is based on obtaining characteristic elements of an image based on the intensity of the pixels. However, a small variation in pixel intensity can cause completely different results [47]. Thus, the features extracted by the proposed CNN are a better option than the statistical feature methods. Therefore, the success of this methodology is due to the features extracted by the proposed CNN. Although the performance achieved by the proposed model is satisfactory, the metrics mentioned above can be improved if the size of the dataset increases. Increasing the size of the dataset makes the training data more diverse, preventing the model from misclassifying. The presence of more data results in better machine learning models [48].

4. Summary and Conclusions

In this work, a new framework based on a CNN and DT is proposed for the automatic detection of IM faults. The proposed CNN is used as a feature extractor to obtain the most salient features of different conditions of the IM. Once the features are extracted using the CNN, a DT is built to infer the motor conditions. In summary, the contribution of this research constitutes two parts. (1) The model uses raw thermographic images without filtering; this shows the model’s ability to handle images with noise. (2) The combination of a CNN as a feature extractor and a DT as a classifier improves the classification indices necessary to build a good classifier. In this research, the dataset proposed in [22] was used to measure the proposed model’s performance. The performance achieved by this model is 98% in the accuracy metric, 98% in the precision and recall metrics, and 98% in the F1-score metric. The proposed method achieves good classification metrics, low classification error, and automatic feature extraction, making it a potential candidate for automatic IM fault detection in rough environments. Future work should focus on achieving a higher performance index in the metrics mentioned earlier using assembled models.

Author Contributions

Conceptualization and methodology, R.A.L.-M. and I.V.G.; software, R.A.L.-M. and U.C.-U.; validation R.A.L.-M. and U.C.-U.; formal analysis R.A.L.-M. and I.V.G.; investigation, R.A.L.-M. and U.C.-U.; resources, U.C.-U. and I.V.G.; data curation U.C.-U.; writing—review and editing, R.A.L.-M. and I.V.G. All authors have read and agreed to the published version of the manuscript.

Funding

This research received no external funding.

Institutional Review Board Statement

Not applicable.

Informed Consent Statement

Not applicable.

Data Availability Statement

Data is contained within the article.

Acknowledgments

The authors would like to thank the University of Guanajuato for financial support. In addition, we would like to thank the Mexican CONACyT for financial support.

Conflicts of Interest

The authors declare no conflicts of interest.

Appendix A

Appendix A.1. CNN Training

This section describes the training process for the CNN mentioned in Section 2.3. Table A1 describes the steps to carry out the training of the CNN.
Table A1. Training function definition.
Training Function
def trainig_step(data, model):
X, y = data
predictions, _ = model(X)
loss = loss_fn(predictions, y)
loss.backward()
gradients = [v.value.grad for v in trainable_weights]
optimizer.apply(gradients, trainable_weights)
accuracy.update_state(y, predictions)
loss_mean.update_state(loss)
return accuracy, loss_mean
According to Table A1, the training process involves the following steps:
  • The batch data are divided into samples and targets according to variables X and y;
  • The CNN model is evaluated using the samples (X) to obtain the predictions. Note that the “_” symbol represents the second output. This output contains the features in the CNN model, and it is not used in the weight adjustment;
  • The predictions are used with the loss functions and the optimizer to adjust the CNN weights;
  • The average loss and accuracy are calculated to obtain a perspective on the advanced training.

References

  1. Lee, S.B.; Stone, G.C.; Antonino-Daviu, J.; Gyftakis, K.N.; Strangas, E.G.; Maussion, P.; Platero, C.A. Condition Monitoring of Industrial Electric Machines: State of the Art and Future Challenges. IEEE Ind. Electron. Mag. 2020, 14, 158–167. [Google Scholar] [CrossRef]
  2. Gangsar, P.; Tiwari, R. Signal based condition monitoring techniques for fault detection and diagnosis of induction motors: A state-of-the-art review. Mech. Syst. Signal Process. 2020, 144, 106908. [Google Scholar] [CrossRef]
  3. Bramerdorfer, G.; Lei, G.; Cavagnino, A.; Zhang, Y.; Sykulski, J.; Lowther, D.A. More Robust and Reliable Optimized Energy Conversion Facilitated through Electric Machines, Power Electronics and Drives, and Their Control: State-of-the-Art and Trends. IEEE Trans. Energy Convers. 2020, 35, 1997–2012. [Google Scholar] [CrossRef]
  4. Gyftakis, K.N.; Spyropoulos, D.V.; Mitronikas, E.D. Advanced Detection of Rotor Electrical Faults in Induction Motors at Start-Up. IEEE Trans. Energy Convers. 2021, 36, 1101–1109. [Google Scholar] [CrossRef]
  5. de Jesús Rangel-Magdaleno, J. Induction Machines Fault Detection: An Overview. IEEE Instrum. Meas. Mag. 2021, 24, 63–71. [Google Scholar] [CrossRef]
  6. Benbouzid, M.; Berghout, T.; Sarma, N.; Djurović, S.; Wu, Y.; Ma, X. Intelligent Condition Monitoring of Wind Power Systems: State of the Art Review. Energies 2021, 14, 5967. [Google Scholar] [CrossRef]
  7. He, J.H.; Liu, D.P.; Chung, C.H.; Huang, H.H. Infrared Thermography Measurement for Vibration-Based Structural Health Monitoring in Low-Visibility Harsh Environments. Sensors 2020, 20, 7067. [Google Scholar] [CrossRef] [PubMed]
  8. Ali, M.Z.; Shabbir, M.N.S.K.; Liang, X.; Zhang, Y.; Hu, T. Machine Learning-Based Fault Diagnosis for Single- and Multi-Faults in Induction Motors Using Measured Stator Currents and Vibration Signals. IEEE Trans. Ind. Appl. 2019, 55, 2378–2391. [Google Scholar] [CrossRef]
  9. Choudhary, A.; Goyal, D.; Letha, S.S. Infrared Thermography-Based Fault Diagnosis of Induction Motor Bearings Using Machine Learning. IEEE Sens. J. 2021, 21, 1727–1734. [Google Scholar] [CrossRef]
  10. Aviña-Corral, V.; Rangel-Magdaleno, J.; Morales-Perez, C.; Hernandez, J. Bearing Fault Detection in Adjustable Speed Drive-Powered Induction Machine by Using Motor Current Signature Analysis and Goodness-of-Fit Tests. IEEE Trans. Ind. Inform. 2021, 17, 8265–8274. [Google Scholar] [CrossRef]
  11. Jia, Z.; Liu, Z.; Vong, C.M.; Pecht, M. A Rotating Machinery Fault Diagnosis Method Based on Feature Learning of Thermal Images. IEEE Access 2019, 7, 12348–12359. [Google Scholar] [CrossRef]
  12. Shao, H.; Xia, M.; Han, G.; Zhang, Y.; Wan, J. Intelligent Fault Diagnosis of Rotor-Bearing System Under Varying Working Conditions With Modified Transfer Convolutional Neural Network and Thermal Images. IEEE Trans. Ind. Inform. 2021, 17, 3488–3496. [Google Scholar] [CrossRef]
  13. Choudhary, A.; Mian, T.; Fatima, S. Convolutional neural network based bearing fault diagnosis of rotating machine using thermal images. Measurement 2021, 176, 109196. [Google Scholar] [CrossRef]
  14. Huda, A.N.; Taib, S. Application of infrared thermography for predictive/preventive maintenance of thermal defect in electrical equipment. Appl. Therm. Eng. 2013, 61, 220–227. [Google Scholar] [CrossRef]
  15. Ahmed, M.M.; Huda, A.; Mat Isa, N.A. Recursive construction of output-context fuzzy systems for the condition monitoring of electrical hotspots based on infrared thermography. Eng. Appl. Artif. Intell. 2015, 39, 120–131. [Google Scholar] [CrossRef]
  16. Karvelis, P.; Georgoulas, G.; Stylios, C.D.; Tsoumas, I.P.; Antonino-Daviu, J.A.; Picazo Rodenas, M.J.; Climente-Alarcón, V. An automated thermographic image segmentation method for induction motor fault diagnosis. In Proceedings of the IECON 2014—40th Annual Conference of the IEEE Industrial Electronics Society, Dallas, TX, USA, 29 October–1 November 2014; pp. 3396–3402. [Google Scholar] [CrossRef]
  17. Khanjani, M.; Ezoji, M. Electrical fault detection in three-phase induction motor using deep network-based features of thermograms. Measurement 2021, 173, 108622. [Google Scholar] [CrossRef]
  18. Garcia-Ramirez, A.G.; Morales-Hernandez, L.A.; Osornio-Rios, R.A.; Benitez-Rangel, J.P.; Garcia-Perez, A.; de Jesus Romero-Troncoso, R. Fault detection in induction motors and the impact on the kinematic chain through thermographic analysis. Electr. Power Syst. Res. 2014, 114, 1–9. [Google Scholar] [CrossRef]
  19. Xanthopoulos, P.; Pardalos, P.M.; Trafalis, T.B. Linear Discriminant Analysis. In Robust Data Mining; Springer: New York, NY, USA, 2013; pp. 27–33. [Google Scholar] [CrossRef]
  20. Huda, A.; Taib, S.; Ghazali, K.; Jadin, M. A new thermographic NDT for condition monitoring of electrical components using ANN with confidence level analysis. ISA Trans. 2014, 53, 717–724. [Google Scholar] [CrossRef] [PubMed]
  21. Laurentys Almeida, C.A.; Braga, A.P.; Nascimento, S.; Paiva, V.; Martins, H.J.A.; Torres, R.; Caminhas, W.M. Intelligent Thermographic Diagnostic Applied to Surge Arresters: A New Approach. IEEE Trans. Power Deliv. 2009, 24, 751–757. [Google Scholar] [CrossRef]
  22. Najafi, M.; Baleghi, Y.; Gholamian, S.A.; Mehdi Mirimani, S. Fault Diagnosis of Electrical Equipment through Thermal Imaging and Interpretable Machine Learning Applied on a Newly-introduced Dataset. In Proceedings of the 2020 6th Iranian Conference on Signal Processing and Intelligent Systems (ICSPIS), Mashhad, Iran, 23–24 December 2020; pp. 1–7. [Google Scholar] [CrossRef]
  23. Najafi, M.; Baleghi, Y.; Mirimani, S.M. Thermal Image of Equipment (Induction Motor) + 40 Ground Truths Added. Mendeley Data, V3. 2023. Available online: https://data.mendeley.com/datasets/m4sbt8hbvk/3 (accessed on 20 July 2024).
  24. Sun, Y.; Zhang, H.; Zhao, T.; Zou, Z.; Shen, B.; Yang, L. A New Convolutional Neural Network with Random Forest Method for Hydrogen Sensor Fault Diagnosis. IEEE Access 2020, 8, 85421–85430. [Google Scholar] [CrossRef]
  25. Aili Wang, Y.W.; Chen, Y. Hyperspectral image classification based on convolutional neural network and random forest. Remote Sens. Lett. 2019, 10, 1086–1094. [Google Scholar] [CrossRef]
  26. Wang, Y.; Li, Y.; Song, Y.; Rong, X. Facial Expression Recognition Based on Random Forest and Convolutional Neural Network. Information 2019, 10, 375. [Google Scholar] [CrossRef]
  27. Mumuni, A.; Mumuni, F. Data augmentation: A comprehensive survey of modern approaches. Array 2022, 16, 100258. [Google Scholar] [CrossRef]
  28. He, K.; Zhang, X.; Ren, S.; Sun, J. Deep Residual Learning for Image Recognition. In Proceedings of the IEEE Conference on Computer Vision and Pattern Recognition (CVPR), Las Vegas, NV, USA, 27–30 June 2016. [Google Scholar]
  29. He, K.; Zhang, X.; Ren, S.; Sun, J. Identity Mappings in Deep Residual Networks. In Computer Vision—ECCV 2016, Proceedings of the 14th European Conference, Amsterdam, The Netherlands, 11–14 October 2016; Leibe, B., Matas, J., Sebe, N., Welling, M., Eds.; Springer International Publishing: Cham, Switzerland, 2016; pp. 630–645. [Google Scholar]
  30. Albawi, S.; Mohammed, T.A.; Al-Zawi, S. Understanding of a convolutional neural network. In Proceedings of the 2017 International Conference on Engineering and Technology (ICET), Antalya, Turkey, 21–23 August 2017; pp. 1–6. [Google Scholar] [CrossRef]
  31. Christlein, V.; Spranger, L.; Seuret, M.; Nicolaou, A.; Král, P.; Maier, A. Deep Generalized Max Pooling. In Proceedings of the 2019 International Conference on Document Analysis and Recognition (ICDAR), Sydney, NSW, Australia, 20–25 September 2019; 2019; pp. 1090–1096. [Google Scholar] [CrossRef]
  32. Chen, Y.; Dai, X.; Liu, M.; Chen, D.; Yuan, L.; Liu, Z. Dynamic ReLU. In Computer Vision—ECCV 2020, Proceedings of the 16th European Conference, Glasgow, UK, 23–28 August 2020; Vedaldi, A., Bischof, H., Brox, T., Frahm, J.M., Eds.; Springer International Publishing: Cham, Switzerland, 2020; pp. 351–367. [Google Scholar]
  33. Baldi, P.; Sadowski, P.J. Understanding Dropout. In Proceedings of the Advances in Neural Information Processing Systems, Lake Tahoe, NV, USA, 5–8 December 2013; Burges, C., Bottou, L., Welling, M., Ghahramani, Z., Weinberger, K., Eds.; Curran Associates, Inc.: Sydney, NSW, Australia, 2013; Volume 26. [Google Scholar]
  34. Ding, B.; Qian, H.; Zhou, J. Activation functions and their characteristics in deep neural networks. In Proceedings of the 2018 Chinese Control And Decision Conference (CCDC), Shenyang, China, 9–11 June 2018; pp. 1836–1841. [Google Scholar] [CrossRef]
  35. Kingsford, C.; Salzberg, S.L. What are decision trees? Nat. Biotechnol. 2008, 26, 1011–1013. [Google Scholar] [CrossRef] [PubMed]
  36. Pasupa, K.; Sunhem, W. A comparison between shallow and deep architecture classifiers on small dataset. In Proceedings of the 2016 8th International Conference on Information Technology and Electrical Engineering (ICITEE), Yogyakarta, Indonesia, 5–6 October 2016; pp. 1–6. [Google Scholar] [CrossRef]
  37. Harsh, H.; Patel, P.P. Study and Analysis of Decision Tree Based Classification Algorithms. Int. J. Comput. Sci. Eng. 2018, 6, 74–78. [Google Scholar] [CrossRef]
  38. Tran, M.Q.; Elsisi, M.; Mahmoud, K.; Liu, M.K.; Lehtonen, M.; Darwish, M.M.F. Experimental Setup for Online Fault Diagnosis of Induction Machines via Promising IoT and Machine Learning: Towards Industry 4.0 Empowerment. IEEE Access 2021, 9, 115429–115441. [Google Scholar] [CrossRef]
  39. Kirchgässner, W.; Wallscheid, O.; Böcker, J. Data-Driven Permanent Magnet Temperature Estimation in Synchronous Motors with Supervised Machine Learning: A Benchmark. IEEE Trans. Energy Convers. 2021, 36, 2059–2067. [Google Scholar] [CrossRef]
  40. Kotsiantis, S.B. Decision trees: A recent overview. Artif. Intell. Rev. 2013, 39, 261–283. [Google Scholar] [CrossRef]
  41. Imambi, S.; Prakash, K.B.; Kanagachidambaresan, G.R. PyTorch. In Programming with TensorFlow: Solution for Edge Computing Applications; Springer International Publishing: Cham, Switzerland, 2021; pp. 87–104. [Google Scholar] [CrossRef]
  42. Selvaraju, R.R.; Cogswell, M.; Das, A.; Vedantam, R.; Parikh, D.; Batra, D. Grad-CAM: Visual Explanations From Deep Networks via Gradient-Based Localization. In Proceedings of the IEEE International Conference on Computer Vision (ICCV), Venice, Italy, 22–29 October 2017. [Google Scholar]
  43. Janssens, O.; Schulz, R.; Slavkovikj, V.; Stockman, K.; Loccufier, M.; Van de Walle, R.; Van Hoecke, S. Thermal image based fault diagnosis for rotating machinery. Infrared Phys. Technol. 2015, 73, 78–87. [Google Scholar] [CrossRef]
  44. Lozanov, Y.; Tzvetkova, S.; Petleshkov, A. Use of machine learning techniques for classification of thermographic images. In Proceedings of the 2020 12th Electrical Engineering Faculty Conference (BulEF), Varna, Bulgaria, 9–12 September 2020; pp. 1–4. [Google Scholar] [CrossRef]
  45. BV, C.; Ananthan, T. Machine Learning Based Fault Detection in Induction Motor using Thermal Imaging. In Proceedings of the 2022 3rd International Conference on Electronics and Sustainable Communication Systems (ICESC), Coimbatore, India, 17–19 August 2022; pp. 929–936. [Google Scholar] [CrossRef]
  46. Glowacz, A.; Glowacz, Z. Diagnostics of stator faults of the single-phase induction motor using thermal images, MoASoS and selected classifiers. Measurement 2016, 93, 86–93. [Google Scholar] [CrossRef]
  47. Yu, Y.; Wang, C.; Fu, Q.; Kou, R.; Huang, F.; Yang, B.; Yang, T.; Gao, M. Techniques and Challenges of Image Segmentation: A Review. Electronics 2023, 12, 1199. [Google Scholar] [CrossRef]
  48. Ying, X. An Overview of Overfitting and its Solutions. J. Phys. Conf. Ser. 2019, 1168, 022022. [Google Scholar] [CrossRef]
  49. Tran, V.T.; Yang, B.S.; Gu, F.; Ball, A. Thermal image enhancement using bi-dimensional empirical mode decomposition in combination with relevance vector machine for rotating machinery fault diagnosis. Mech. Syst. Signal Process. 2013, 38, 601–614. [Google Scholar] [CrossRef]
  50. Bai, T.; Zhang, L.; Duan, L.; Wang, J. NSCT-Based Infrared Image Enhancement Method for Rotating Machinery Fault Diagnosis. IEEE Trans. Instrum. Meas. 2016, 65, 2293–2301. [Google Scholar] [CrossRef]
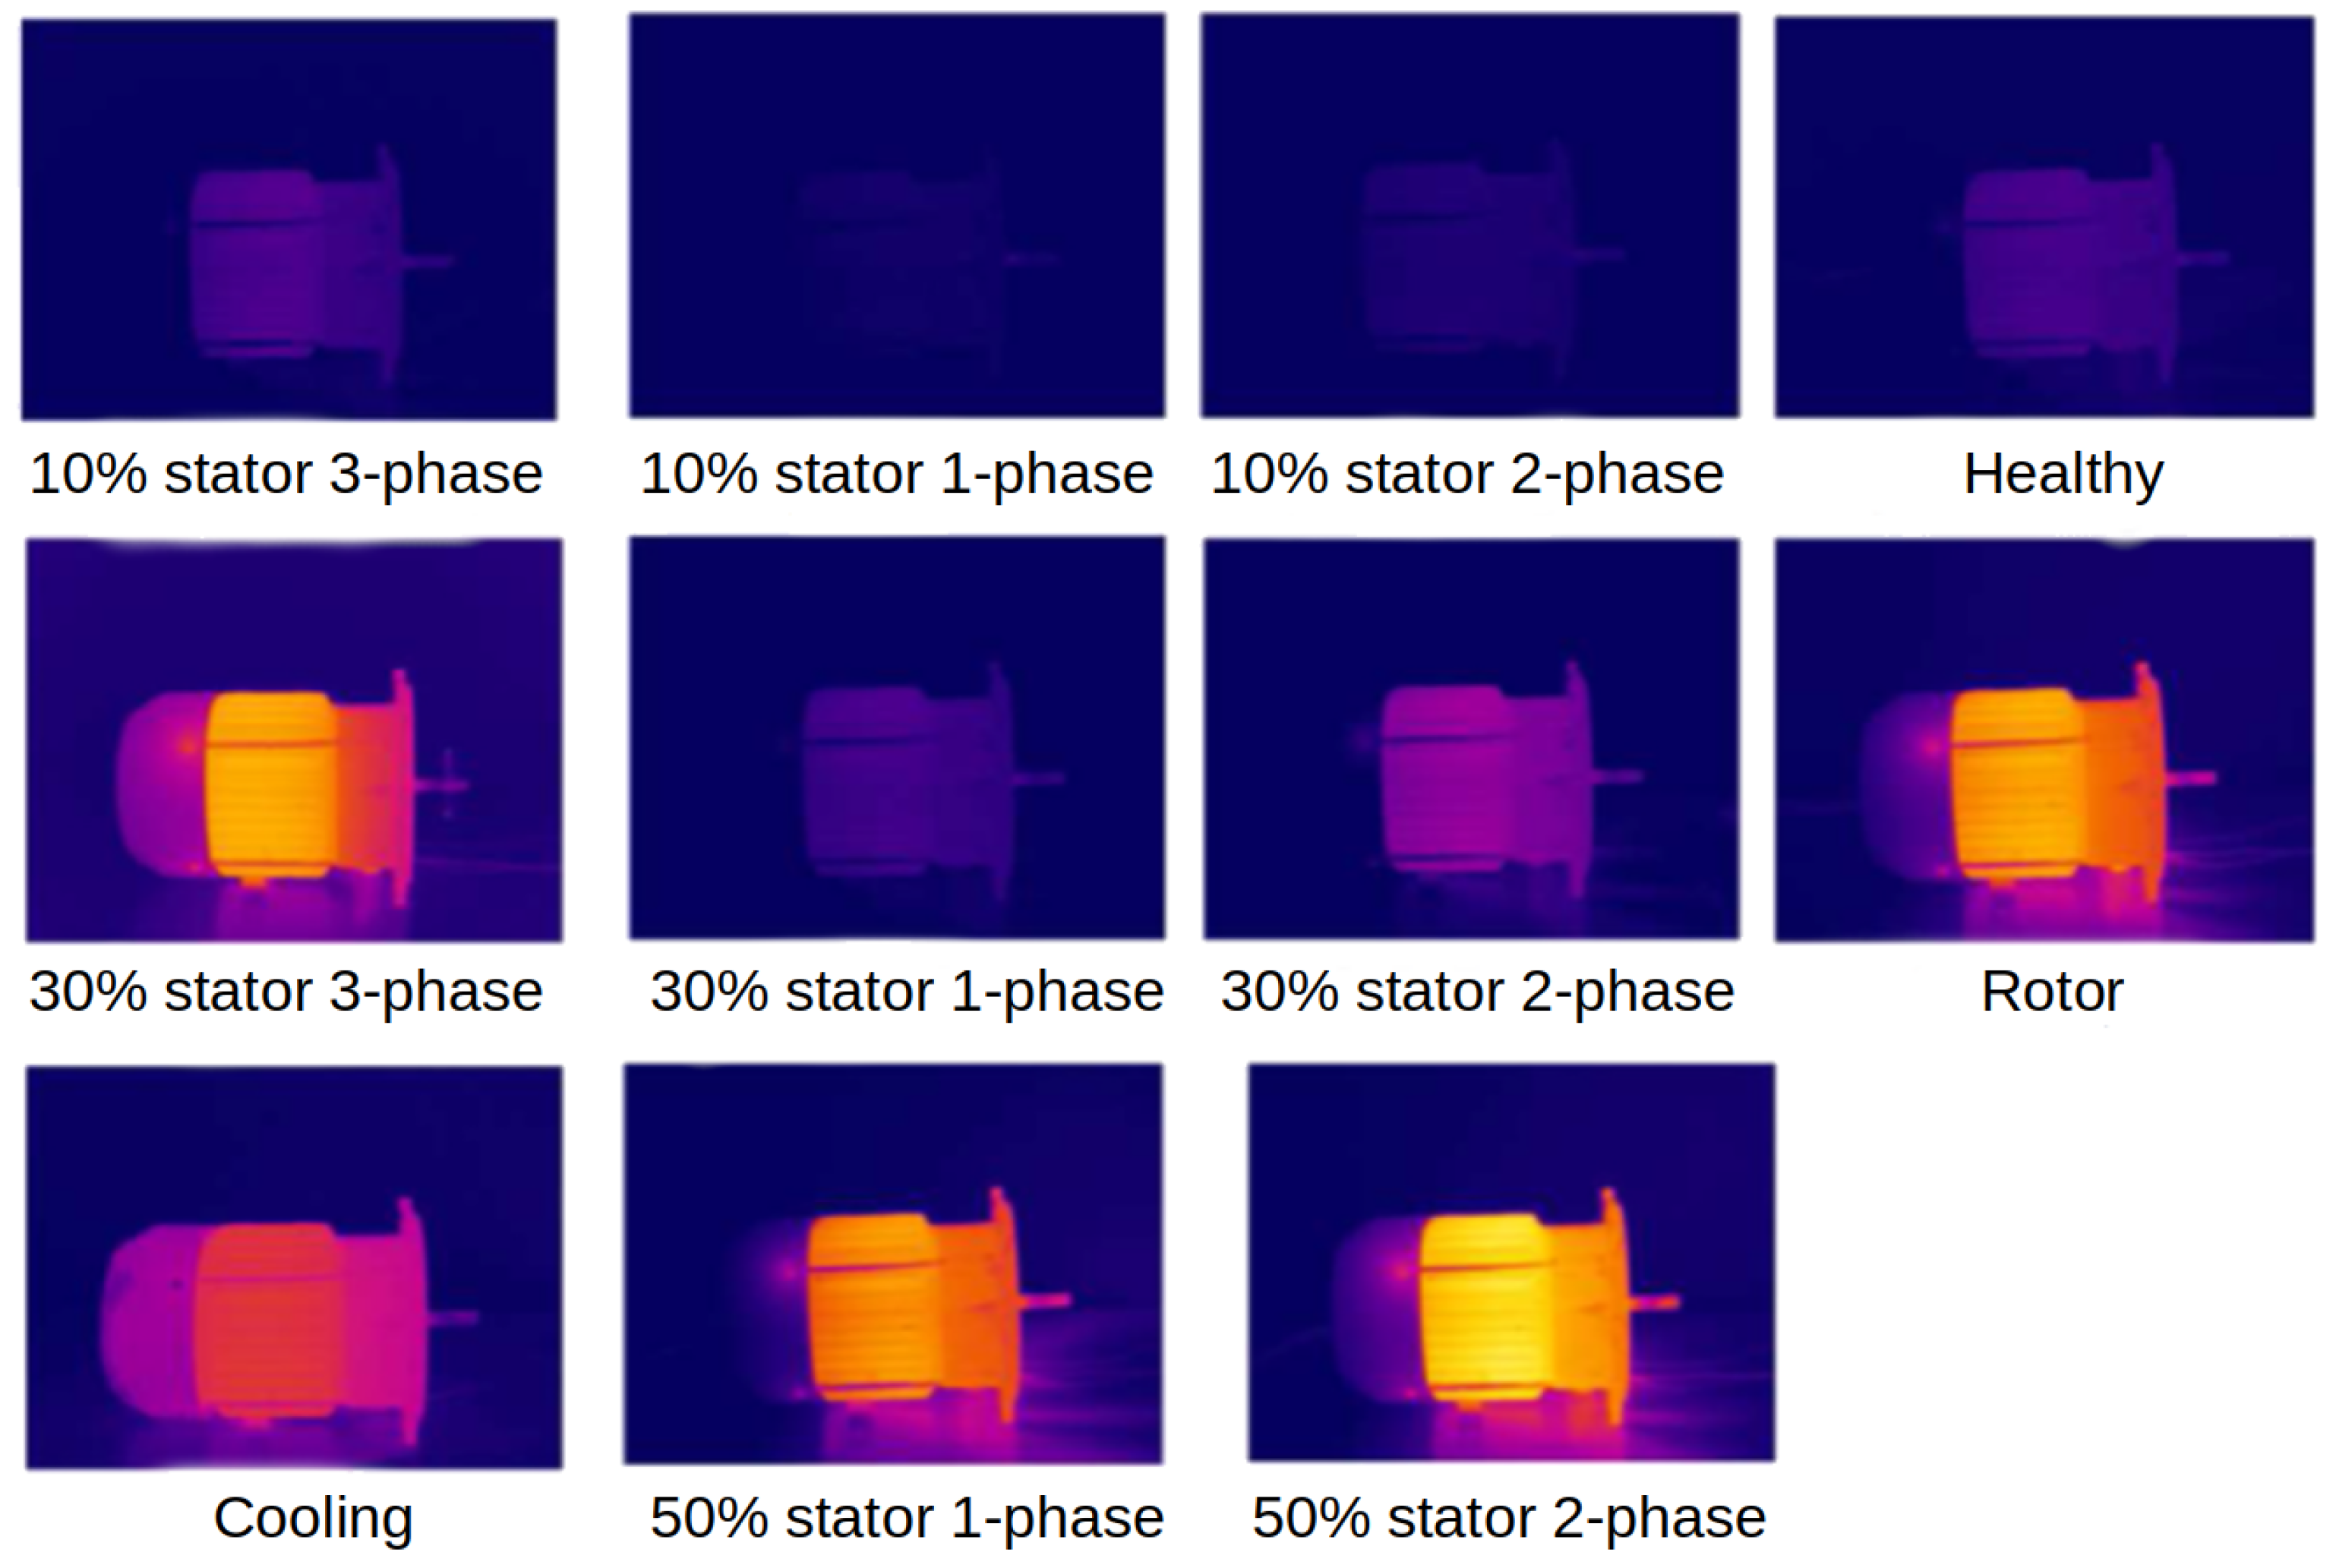
Figure 1. Overall process for the detection of faults in IMs.
Machines 12 00497 g001
Figure 2. Thermal images that show the different faults present in the IM.
Machines 12 00497 g002
Figure 3. Data augmentation applied to IM faults. (a) Original image, 50% stator 2-phase class; (b) vertical flip applied to the 50% stator 2-phase class; (c) original image, 50% stator 2-phase; (d) horizontal flip applied to the 50% stator 2-phase class.
Machines 12 00497 g003
Figure 4. Model structure used to extract features from IM faults.
Machines 12 00497 g004
Figure 5. Validation loss obtained by the suggested models.
Machines 12 00497 g005
Figure 6. Results obtained using a CNN and DT (s represents the stator, and p represents the phase): (a) CNN confusion matrix; (b) DT confusion matrix.
Machines 12 00497 g006
Figure 7. Features extracted by the proposed CNN using the Grad-CAM method. (a) Image belonging to the rotor class; (b) features extracted by the last convolutional layer of the proposed CNN model.
Machines 12 00497 g007
Table 1. Image distribution presented in the dataset. According to the authors of [22,23], the % symbol represents the rate of short circuit in each phase. The numbered phases represent the phases in which the short circuit occurred.
ClassImagesDimensionsFormat
Cooling28360 × 240 × 3BMP
Rotor30360 × 240 × 3BMP
50% stator
2-phase
38360 × 240 × 3BMP
50% stator
1-phase
35360 × 240 × 3BMP
30% stator
3-phase
42360 × 240 × 3BMP
30% stator
2-phase
38360 × 240 × 3BMP
30% stator
1-phase
37360 × 240 × 3BMP
10% stator
3-phase
31360 × 240 × 3BMP
10% stator
2-phase
31360 × 240 × 3BMP
10% stator
1-phase
34360 × 240 × 3BMP
Healthy25360 × 240 × 3BMP
Total369 --
Table 2. Data distribution used to train and evaluate the performance of the final model.
Dataset/ClassTraining SetTesting SetTotal
Rotor33942
Healthy34842
10%-stator
3-phase
34842
50%-stator
1-phase
33942
50%-stator
2-phase
34842
30%-stator
2-phase
33942
10%-stator
2-phase
34842
10%-stator
1-phase
33942
30%-stator
3-phase
34842
30%-stator
1-phase
34842
Cooling33942
Total36993462
Table 3. Suggested models to infer faults in induction motors.
ModelHyperparametersValuesActivation
Function
Model 1Convolutional layer
kernel size
16, 32, 64,
64, 128
ReLU
Dense layer size128, 11ReLU,
 Softmax
Dropout rate0.2-
Learning rate0.01-
Model 2Convolutional layer
kernel size
16, 16, 32,
64, 128
ReLU
Dense layer size256, 11ReLU,
 Softmax
Dropout rate0.3-
Learning rate0.01-
Table 4. Optimal CNN hyperparameters to infer induction motor faults.
HyperparameterOptimal Values
Learning rate0.001
Dropout rate0.5
Convolutional layer
kernel size
32, 32, 64, 128, 256
Dense layer size512, 11
Table 5. Hyperparameters used to train the DT.
Model ParameterValue
Max deepth7
DecisionGini
Min samples to split2
SplitterBest
Table 6. Results obtained in the evaluation process.
ClassAccuracy
%
Precision
%
Recall
%
F1 Score
%
Rotor100100100100
Healthy1008910094
10%-stator
3-phase
100100100100
50%-stator
1-phase
10010010095
50%-stator
2-phase
88.84908994
30%-stator
2-phase
100100100100
10%-stator
2-phase
100100100100
10%-stator
1-phase
100100100100
30%-stator
3-phase
100100100100
30%-stator
1-phase
87.531008893
Cooling100100100100
Average 98.098.098.098.0
Table 7. Comparison of the results obtained by applying the proposed methodology (NN, neural network; SVM, support vector machine; RF, random forest; RVM, relevance vector machine).
WorksMethodsClassesAccuracy
%
Precision
%
Recall
%
F1 Score
%
Huda et al.
 [14]
Statistical features
and NN
282.481.184.682.8
Tran et al.
 [49]
Image descompostion
and RVM
4100---
Glowacz et al.
 [46]
Image segmentation
and NN
3100---
Bai et al.
 [50]
Image enhancement
and NN
692.5---
Janssens et al.
 [43]
Statistical features
and SVM
888.290.688.289.5
Lozanov et al.
 [44]
Statistical features
and SVM
383.3---
Karvelis et al.
 [16]
Image segmentation
and ML
591.489.790.290.4
Charitha et al.
 [45]
Statistical features
and RF
697.2---
Najafi et al.
 [22]
Image segmentation
and RF
1193.892.193.292.6
ProposedCNN feature extraction
and DT
1198.098.098.098.0
Disclaimer/Publisher’s Note: The statements, opinions and data contained in all publications are solely those of the individual author(s) and contributor(s) and not of MDPI and/or the editor(s). MDPI and/or the editor(s) disclaim responsibility for any injury to people or property resulting from any ideas, methods, instructions or products referred to in the content.

