Article

Structural Health Monitoring of Laminated Composites Using Lightweight Transfer Learning

Department of Mechanical, Robotics and Energy Engineering, Dongguk University, 30 Pildong-ro 1-gil, Jung-gu, Seoul 04620, Republic of Korea
*
Author to whom correspondence should be addressed.
Machines 2024, 12(9), 589; https://doi.org/10.3390/machines12090589
Submission received: 23 July 2024 / Revised: 22 August 2024 / Accepted: 23 August 2024 / Published: 25 August 2024

Abstract

:
Due to their excellent strength-to-weight ratio, composite laminates are gradually being substituted for traditional metallic materials in a variety of industries. However, due to their orthotropic nature, composite laminates are prone to several different types of damage, with delamination being the most prevalent and serious. Therefore, deep learning-based methods that use sensor data to conduct autonomous health monitoring have drawn much interest in structural health monitoring (SHM). However, the direct application of these models is restricted by a lack of training data, necessitating the use of transfer learning. The commonly used transfer learning models are computationally expensive; therefore, the present research proposes lightweight transfer learning (LTL) models for the SHM of composites. The use of an EfficientNet–based LTL model only requires the fine-tuning of target vibration data rather than training from scratch. Wavelet-transformed vibrational data from various classes of composite laminates are utilized to confirm the effectiveness of the proposed method. Moreover, various assessment measures are applied to assess model performance on unseen test datasets. The outcomes of the validation show that the pre-trained EfficientNet–based LTL model could successfully perform the SHM of composite laminates, achieving high values regarding accuracy, precision, recall, and F1-score.

1. Introduction

Laminated composites possess notably higher specific strength compared to conventional metallic materials, leading to enhanced mechanical properties and substantial weight reduction [1]. The advantages of composite laminates have led to a substantial rise in their use across numerous mobility and engineering industries [1,2]. In contrast, because of their orthotropic behavior, composite laminates are vulnerable to various types of damage, including matrix cracking, fiber breakage, and delamination [3]. In structural composites, the main cause of concern across all of these damage types is delamination [4,5]. In real-world applications, delamination substantially decreases the safety of composite frameworks and poses an extreme risk to their reliability.
Recently, data-driven structural health monitoring (SHM) techniques have been providing a cutting-edge approach that helps maintain structural integrity and streamlines maintenance processes for engineering applications [6,7]. The internal nature of delamination in composite materials renders conventional visual inspections inadequate, necessitating the use of advanced SHM techniques to identify and address these concealed structural vulnerabilities [8]. Therefore, to detect damage in composite structures, various kinds of non-destructive evaluation techniques and SHM approaches have been investigated [9]. Despite their effectiveness, most of these approaches demand considerable operator expertise for successful implementation. These techniques tend to be costly, time-intensive, and complicated in nature. Moreover, the inspection process typically requires the composite structures to be out of service and utilizes specialized signal generation equipment, leading to additional operational disruptions. These restrictions significantly undermine the inherent durability advantages of composite structures, rendering them unsuitable for applications where catastrophic failure is unacceptable. Consequently, vibration-based monitoring methods have gained popularity as an accessible and promising alternative for the SHM of composites. This method provides a simple, efficient, and reliable solution by merely attaching vibration sensors to the structure and analyzing the resulting dynamic responses [10,11,12].
In the context of composite structures, researchers often encounter limitations in accessing comprehensive data, particularly for damage detection, as subjecting these materials to damage carries significant risks. To address this data scarcity, researchers have explored various methods to generate sufficient data for various health classes, including experimentation, numerical simulation, and data augmentation approaches [1]. However, because of the orthotropic nature of composites, the development of extensive experimental setups is complicated. Due to these challenges, only a limited number of damage scenarios can be studied in the experimental setup. Therefore, most of the research work carried out numerical simulation or data augmentation to overcome this data limitation. Escobar et al. classified damage in composites using a variety of machine learning (ML) and neural network-based (NN) models and used the finite element (FE) method to overcome the problem of data scarcity [13]. Another work proposed a convolutional neural network (CNN) to identify and detect delamination in a laminated composite using vibration data [14]. The amount of training data was increased by coupling the mathematical model for healthy and damaged cases. Likewise, FE approaches have been used for the SHM of composite laminates [15,16]. Although simulated data can yield sufficient outcomes for the health monitoring of composite structures, the FE process requires significant field expertise and rigorous validation. This results in a time-consuming, challenging, and non-generalizable simulation process for a variety of structures. On the other hand, data augmentation methods typically enhance the robustness and generalization capability of deep learning-based SHM techniques [17,18,19]. While these methods are suitable for computer vision tasks, such as flipping, cropping, rotation, and color variation, they are generally inappropriate for SHM applications [20,21,22]. This is because these traditional data augmentation techniques can disturb the dynamic characteristics of the signals. Therefore, the commonly used approach for data augmentation involves simulating the exact behavior of the composite [19]. While simulation-based augmentation can yield decent results, it is challenging to replicate the precise behavior of composites since it requires a physical understanding of the system. Therefore, training a deep learning model from scratch using the simulated data as augmented data is a tedious procedure. Thus, the goal of the current study is to resolve the issue of data scarcity in the health monitoring of composites using lightweight pre-trained models, without using data augmentation, simulation, and extensive experimentation.
Recently, transfer learning approaches have gained attention due to their excellent performance using limited training data [23]. To identify the degree of damage in laminated composites, Fotouhi et al. [24] used a pre-trained AlexNet model on a collection of visual inspection data. The outcomes showed that, with appropriate computing time, the AlexNet model was superior to the ResNet-50 TL model and other user-defined DL models. Zhao et al. [25] proposed the real-time damage detection of composite laminates using the VGG−16-based transfer learning model. Rai and Mitra [26] used a ResNet-based pre-trained model for the real-time SHM of composite laminates using Lamb waves. A ResNet-based transfer learning model has also been developed by utilizing digital image correlation images for damage detection in composites [27]. Khan et al. [19] compared different transfer learning approaches for delamination detection in composites and found that the GoogleNet model shows the highest validation accuracy. Moreover, a comparison between AlexNet and YoloNet demonstrated that although the YoloNet model shows better damage detection performance, it requires extensive computational resources during training, owing to its deep and complex architecture [28]. These results demonstrate that the excessive depth of these pre-trained models can provide high accuracy in the health monitoring of composite laminates; however, they are computationally expensive to build due to the complex nature of such models.
The application of traditional transfer learning approaches, with their large deep architectures, is restricted in the real-time SHM of composite laminates. Therefore, this study explores the potential of lightweight transfer learning (LTL) models that can achieve precise and efficient SHM of composite laminates. Thus, the contribution of this article is two-fold: (a) the SHM of laminated composites with limited data, and (b) the use of LTL models that can provide real-time monitoring of composite structures. To achieve these objectives, the EfficientNet model is proposed, which scales model dimensions uniformly with a compound scaling method, achieving high performance with lightweight architecture. The proposed approach was applied to experimental vibrational data collected from composite laminates. Raw vibrational data for each health state were processed through the continuous wavelet transform (CWT) to acquire scalogram images which possess both temporal and spectral characteristics. The EfficientNet model was trained on these scalogram images to develop an efficient SHM framework for composite laminates. The performance of the model was then evaluated using multiple metrics, such as accuracy, confusion matrix, precision, recall, and F1-score.

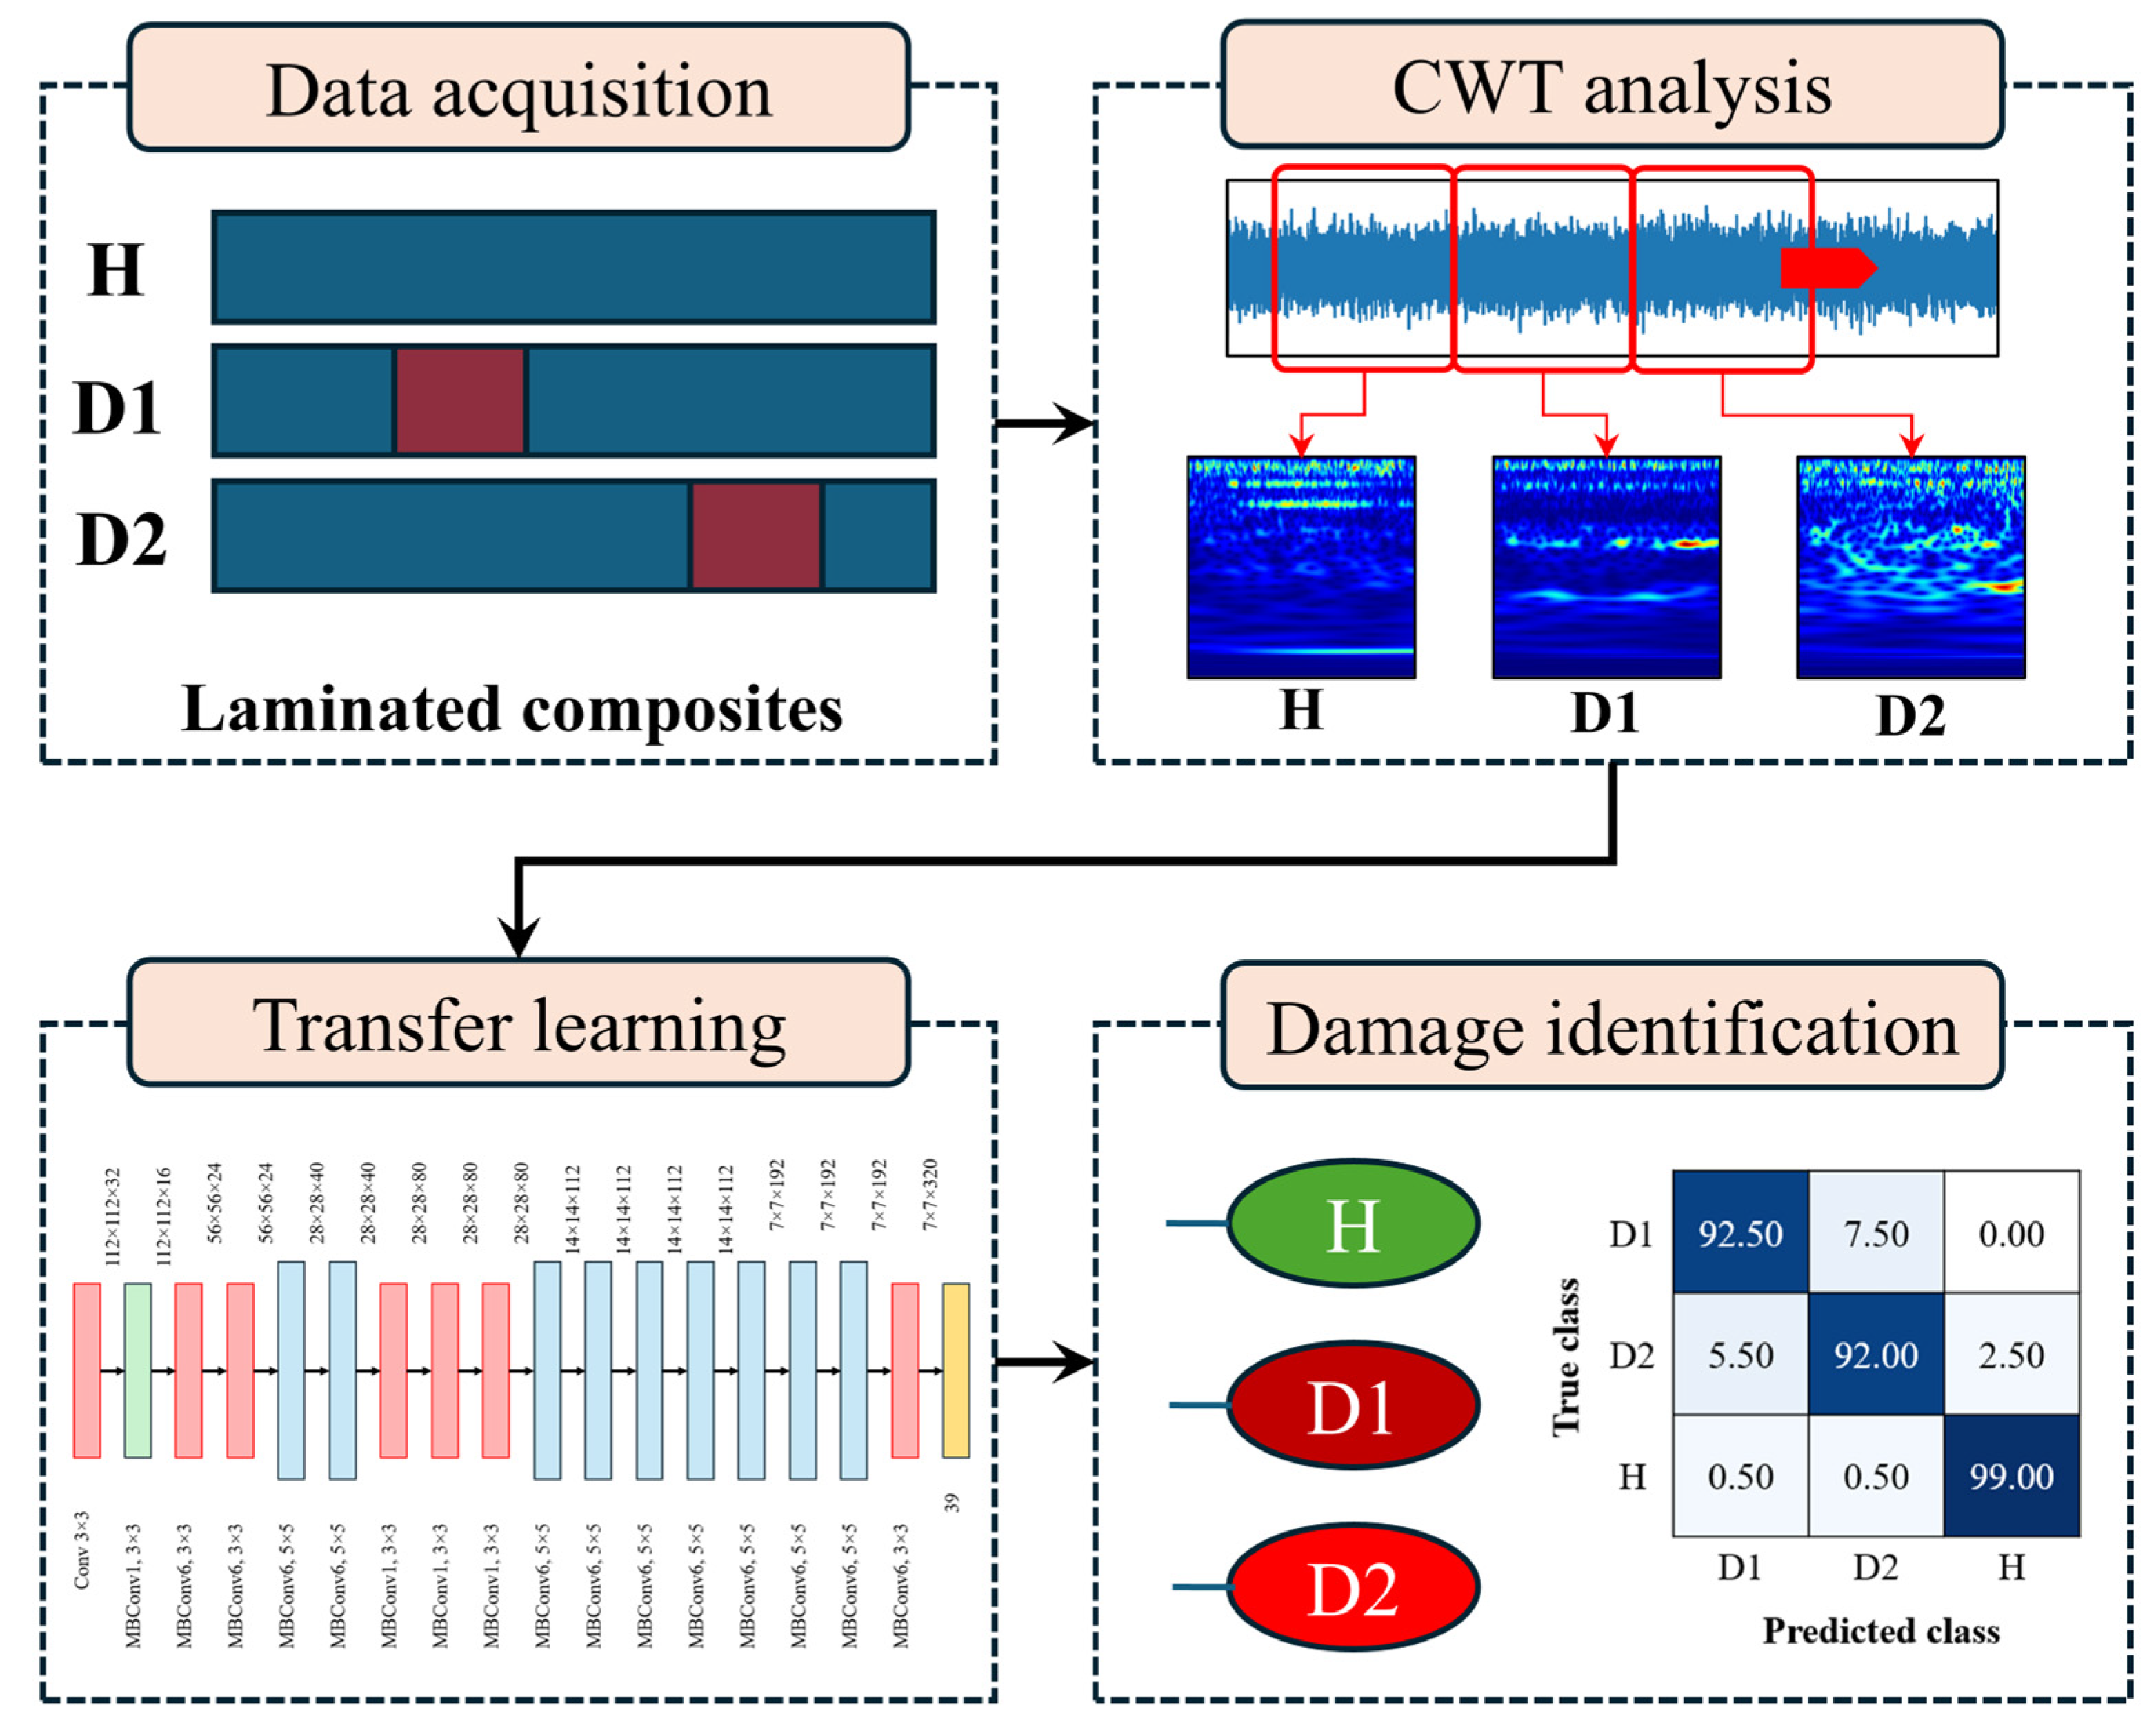
2. The Proposed Methodology

This study proposes the use of LTL models for the SHM of composite laminates. Figure 1 shows the proposed methodology, which comprises (a) data acquisition from the experimental setup, (b) the conversion of raw vibrational data to scalogram images using the CWT, (c) fine-tuning of the EfficientNet model on scalogram images, and (d) health state identification of the composite laminates. In the first step, the vibration data are acquired from laminated composite samples for three health states. These health states include one healthy case and two delamination damage cases. The raw vibration data are then processed through the continuous wavelet transform to obtain images. In the third step, the LTL model is trained on the image data. In the final step, the trained LTL model is used to make predictions in identifying the health status of the composites. The evaluation is performed using a confusion matrix and several other matrices. The transfer learning approach involves training the LTL model on scalogram images. During training, the model learns the features of each class through its layers. These layers are mainly composed of convolutional neural networks. The following sections include a description of the convolutional neural networks and the EfficientNet–based LTL model used in this study.

2.1. Convolutional Neural Network (CNN)

Convolutional neural networks (CNNs), which are intended for image recognition applications, imitate the human visual system [29]. The process begins with the generation of a feature map by convolving kernels or filters of varying sizes with specific sections of the input data. This involves calculating the dot product between a predetermined subset of the input data and a weighted and biased matrix of adjustable parameters [30]. A typical CNN model consists of several layers, including convolutional, dense, pooling, flattening, and classification layers [31,32]. The following describes the operation of the layers used in this study:
The convolutional layer is the core component of the CNN model, performing convolution operations on regions of scalograms to generate feature maps mathematically:
X m i = C m = 1 M W m m i X m i 1 + B m i
where W is the weight matrix, is the convolution operation, B is the bias of the filter, and C is the activation function. Additionally, m and m stand for the index of the input and output feature maps, respectively. This work utilizes CNN with Swish activation, which enhances the nonlinearity of the network and potentially improves gradient-based optimization during training, compared to traditional activation functions, like ReLU. The pooling layer reduces the dimensions of feature maps, enhancing feature detection and optimizing network parameters. Maximum and average pooling operations are employed to improve image segregation by using the maximum or average value of the convoluted layer. The flattening layer converts square-shaped feature maps into a flat structure, facilitating interpretation and classification through fully connected layers. A dense layer interprets learned features by connecting each neuron to all preceding neurons. An activation function introduces nonlinearity, enhancing the ability of the network to capture complex patterns.

2.2. Transfer Learning

Deep learning typically requires a substantial amount of data. Data insufficiency can lead to underfitting during training. Transfer learning addresses this challenge by pre-training a high-performing model on a large dataset and utilizing its learned features for a specific task with a smaller dataset [33]. Lightweight CNNs have become essential in deep learning, helping to retain high accuracy while minimizing computational complexity and memory usage, making them ideal for deployment on devices with limited resources [34]. Thus, lightweight transfer learning refers to transfer learning models with fewer parameters and reduced computational requirements, making them suitable for deployment in resource-constrained environments. Table 1 shows the total number of parameters and the size of some of the commonly used transfer learning models in comparison with the lightweight models. The evolution of CNN architectures has seen a transition from heavy models like AlexNet, which consumes more than 200 MB of memory, to more compact and efficient models [35]. This shift addresses the high resource demands and limitations of deploying large-scale models in practical settings, especially in edge intelligence applications [36]. Various strategies have been employed to design lightweight CNNs, including manual and automated approaches. By incorporating some specialized convolution paradigms, such as group convolution, separable convolution, and dilated convolution, manual design lowers the number of parameters and computational complexity [37]. Manual design relies on expert knowledge to balance accuracy, efficiency, and computational consumption. In contrast, automated machine learning (AutoML) methods use search algorithms to optimize network models with minimal human intervention. The AutoML approach involves exploring search spaces at different levels: cell level, stage level, and layer level. Each level targets specific optimization areas, such as reducing fragmentation and frequent memory access issues highlighted by deep learning models [36,38]. This study utilizes the EfficientNet–based LTL for the SHM of laminated composites. EfficientNet models are known for their use of AutoML techniques to efficiently scale up models by optimizing network depth, width, and resolution [39]. This approach allows them to achieve better performance with fewer parameters, addressing issues like fragmentation and memory access problems, which are typical in deep learning models.

2.3. EfficientNet Model

EfficientNet has emerged as a leading model in deep learning, particularly for image classification tasks on the ImageNet dataset. Unlike traditional CNNs, EfficientNet employs the Swish activation function, instead of the ReLU, to enhance performance [40]. The goal of EfficientNet is to create more efficient models with fewer parameters. This is achieved through compound scaling, which uniformly scales depth, width, and resolution, leading to better performance, without a proportional increase in computational load. To generate the required target network, the baseline network is first subjected to the compound scaling approach, which involves developing a scaling factor for various dimensions under given resource restrictions [40,41]. The fundamental component of EfficientNet is the mobile inverted bottleneck convolution (MBConv), first seen in MobileNetV2 [42]. MBConv layers expand and then compress channels, connecting bottlenecks with fewer channels than expansion layers, significantly reducing the number of floating-point operations per second (FLOPS). This architecture utilizes depth-wise separable convolutions, which reduce computations by a factor of “ k 2 ”, where k is the kernel size [42]. With the compound scaling method, the depth ( d ), width ( w ), and resolution ( r ) of the model are all uniformly scaled using a coefficient ψ . This scaling is governed by constants α, β, and γ, which are determined via grid search under fixed resource constraints [40]. The scaling equations are as follows:
d e p t h   :   d = α ψ w i d t h   :   w = β ψ r e s o l u t i o n   :   r = γ ψ α ,   β , γ 1
These constants ( α , β , γ ) determine how additional resources are distributed across network dimensions, while ψ controls the overall scaling. EfficientNet–B0 serves as the baseline model, which is then extended to EfficientNet–B1 to B7 through a two-step process. First, assuming twice the resources are available, a grid search is performed with ψ = 1 to find the optimal values for α , β , and γ . Second, these values are fixed, and the baseline network is scaled using different ψ values to obtain the larger models. This innovative scaling method allows EfficientNet to achieve superior performance efficiently [41]. This research utilizes the EfficientNet–B0 baseline model, and Figure 2 shows its architectural details. The bottom text in the figure represents the sequence of the MBConv layers, while the text at the top represents the shape of the output feature map after each layer. All layers of the EfficientNet model are initially pre-trained using the ImageNet dataset. Later, the final classification layer of the trained model is removed, and three new layers are added. These layers include a global average pooling (GAP) layer, a dense layer, and another dense layer for classification. The purpose of the global average pooling layer is to reduce each feature map to a single value by averaging, effectively summarizing the feature extracted by the EfficientNet layers. All three newly added layers are trainable, while the previous layer weights are frozen while training on the target vibration scalograms of composites.

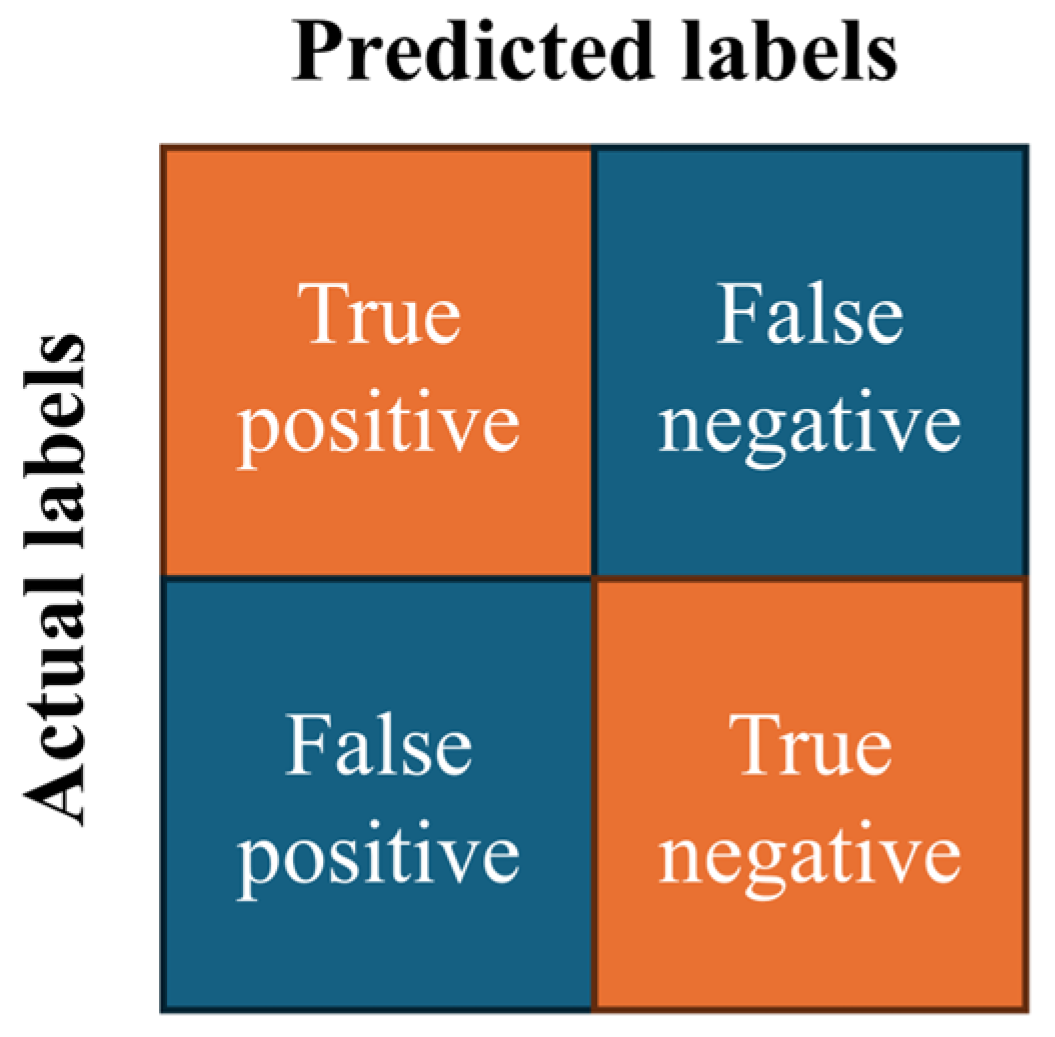
2.4. Performance Evaluation Metrics

The effectiveness of the LTL models was assessed using several performance metrics, namely accuracy, confusion matrices, precision, recall, and F1-score. Below are the mathematical formulae for calculating these metrics using true positive ( T p ), true negative ( T n ), false positive ( F p ), and false negative ( F n ) predictions [43,44]:
A c c u r a c y = T p + T n T p + T n + F n + F p
P r e c i s i o n = T p T p + F p
R e c a l l = T p T p + F n
F 1 s c o r e = 2 T p 2 T p + F n + F p
where true positive indicates the correctly identified health state, false positive is the incorrect identification of a health state, false negative is when the SHM method fails to detect a health state that is actually present, and true negative is when the model identifies the other health states correctly. These metrics are obtained from the confusion matrix shown in Figure 3, which provides an overview of both true and predicted outputs. Therefore, both the confusion matrix and its derived evaluation metrics were utilized to estimate the SHM performance of the LTL models.

3. Vibration Data for Composite Laminates

3.1. Dataset Description

Composite samples manufactured through a hot press compression modeling process using carbon fiber prepreg [0/90/0/90]s were used in this study. Laminated composite plates with dimensions of 350 mm × 350 mm were obtained through this process, as shown in Figure 4a. The developed composites contained three health states: healthy (H), delamination–1 (D1), and delamination–2 (D2). The delaminations were induced in the mid-plane of the composites using a Teflon film. Both delaminations were of identical size (50 mm × 50 mm); however, D1 was closer to the clamped side, while D2 was located closer to the free end of the cantilever beam configuration during experimentation. The delaminations were deliberately sized identically to demonstrate the detection of damage at different locations within the composite structure. This approach addresses the challenge of identifying adjacent damages that may possess similar dynamic characteristics. Moreover, the delaminations with identical size are also easy to produce in laminated composites, facilitating the manufacturing process. Five different samples of each health state were used in the experiments to account for the manufacturing and experimentation uncertainties, as shown in Figure 4b. The edges of the developed composites were rough due to manual layup; therefore, the rough edges were removed. After removing the rough edges, the dimensions of each sample were 300 mm × 50 mm, and five such samples for each health state were obtained to mitigate potential inconsistencies from the manufacturing process, reducing the likelihood of false data and ensuring the reliability of data acquisition.
A data collection (DAQ) system, an excitation system, and a vibration system made up the experimental setup. The schematic representation of the experimental setup is shown in Figure 5. For this study, the excitation setup comprised a LabVIEW PC that generated random impulses using MATLAB Simulink 10.0. The random excitations were transported to the shaker by an amplifier and an excitation data-gathering system for the excitation system. Using cantilever boundary conditions, the vibration apparatus applied shaker excitation to the composite specimens that were fixed into the shaker in a cantilever beam configuration. The accelerometer connected to the free end of the composites represented the main component of the DAQ system, which recorded random excitations from three different health states. Additionally, it had a DAQ system to gather the broadened impulses and an amplifier to amplify the collected data. Vibration data were recorded for a period of 15 s from five composite samples, representing all structural conditions, at a sampling rate of 2.5 kHz. Furthermore, 10 stochastic responses were captured from each sample to enhance the dataset diversity. As a result, these 10 random responses, combined with five samples per health state, generated 50 stochastic scenarios for each condition, demonstrating significant variability. The collected data were in the form of a 1D signal, which could be transformed into 2D images. This preprocessing enabled the extraction of discriminative features that assisted in accurately diagnosing various composite health states.

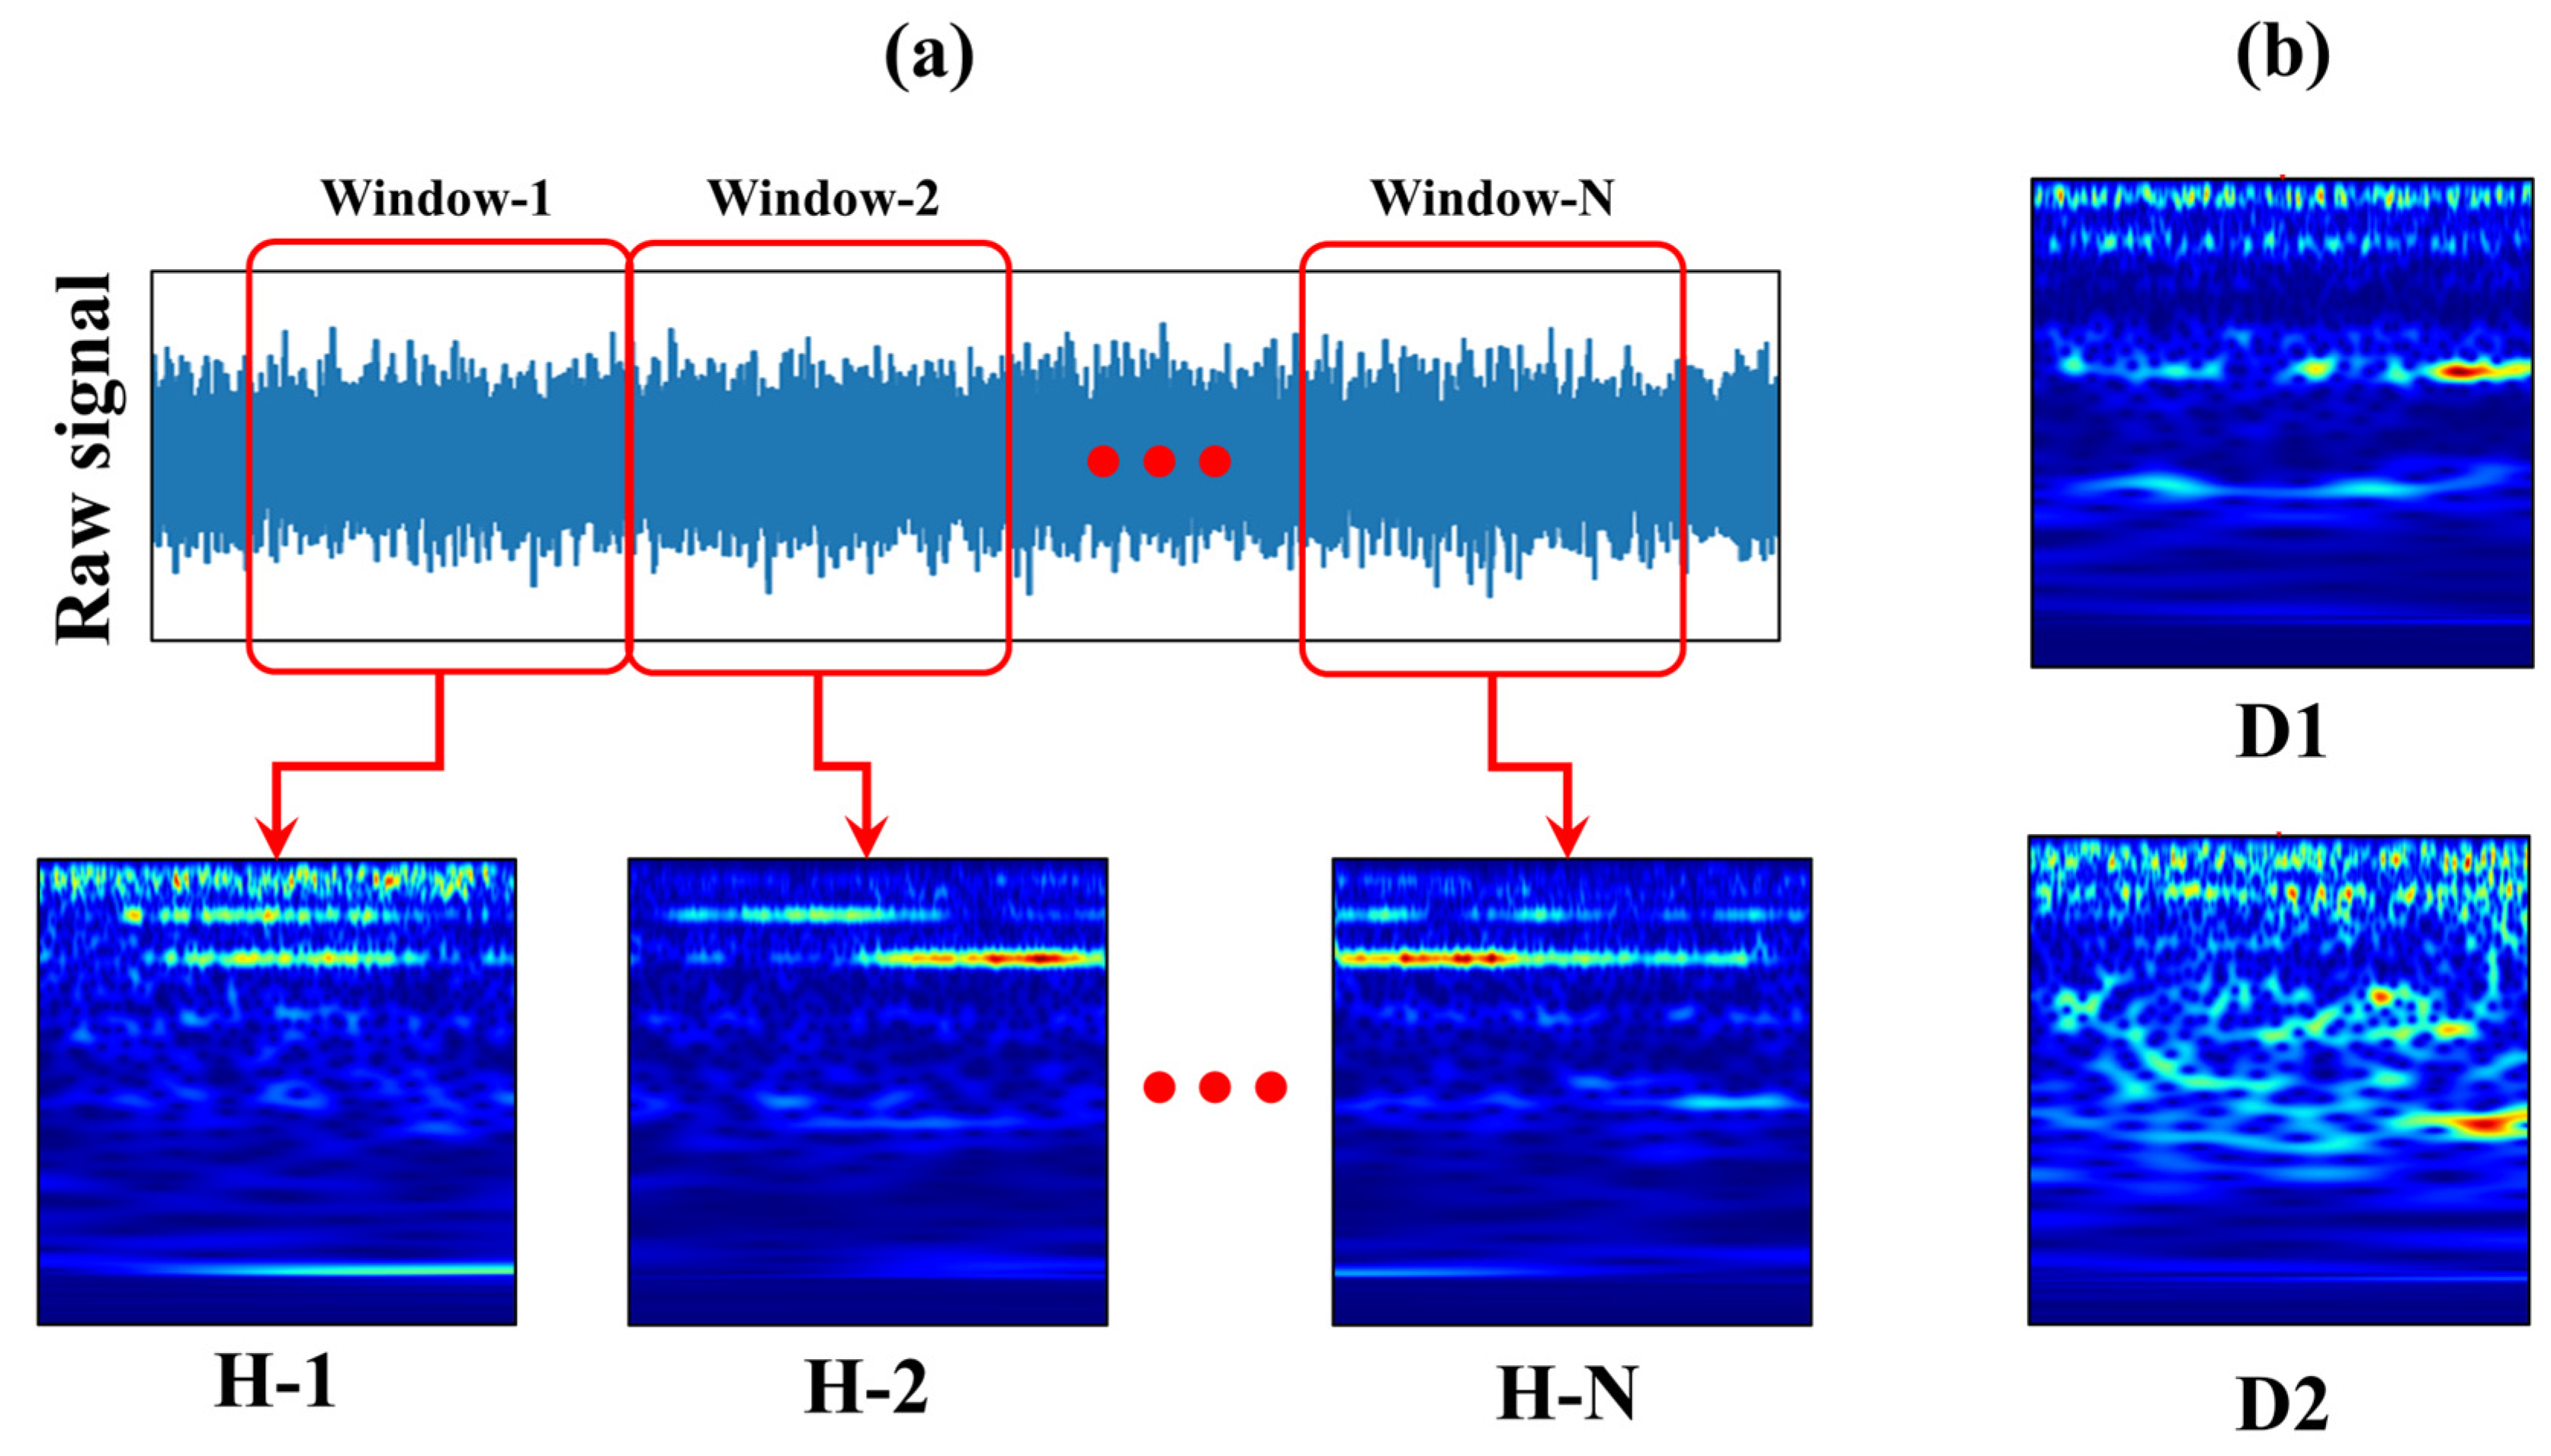
3.2. Data Conversion and Splitting

The continuous wavelet transform (CWT) of a signal transforms it into scalograms that are depicted as a time–frequency representation [45]. In contrast to the spectrogram, the scalogram is especially useful for evaluating signals found in engineering applications that have different characteristics at different scales, like slow-moving events that are periodically broken up by sudden transients. This approach enhances time localization for short-duration, high-frequency events and facilitates frequency tracking for longer-duration, low-frequency events. The method involves resampling the signal using a wavelet that is time-shifted and scaled to generate the CWT. Wavelets are known for their oscillatory nature and diverse amplitude values. A prototype wavelet is employed for scalability and transitional operations. The prototype wavelet is dynamically adjusted by the CWT scaling, which stretches and shrinks it. Stretching results in long-duration, low-frequency wavelets that are appropriate for isolating prolonged, low-frequency events, whereas shrinking produces wavelets with short durations and high frequencies, which are perfect for detecting dynamic events [46]. In this study, the CWT was used to transform the 1D data into 2D scalogram images for better learning of the LTL models. Figure 6a shows the windows for the healthy signals and their scalogram images. The length of the signal obtained through a single random response comprised 37,500 data points. The same number of data points were obtained for all five samples of the same health state. Therefore, the total length of a single response signal for all samples of each health state was concatenated to a single signal of length 187,500 data points. This resulted in 100 images using a window size of 1875, without any overlapping. Ten such random responses were obtained for all five samples, resulting in a total of 1000 scalogram images for each health state. A similar process was repeated for the two damage cases, D1 and D2. Example scalogram images for D1 and D2 are shown in Figure 6b. Therefore, a total of 3000 scalogram images were generated, belonging to three health states: H, D1, and D2. The obtained images were then resized to a 224 × 224 pixel size, which is equivalent to the input size required by the LTL models. These scalogram images represent the time–frequency distribution of signals, with color scales indicating energy intensity—warmer colors (red and yellow) signify higher energy levels, and cooler colors (blue) represent lower energy levels. These patterns help identify structural health, where distinct high-energy regions correlate with the presence of damage. Given the controlled setup and consistent patterns, the variations are attributed more to introduced delaminations rather than potential manufacturing defects or experimental uncertainties. To improve the generalization ability of the LTL model, data from six responses comprising 1800 images were used for training, data from two responses comprising 600 images were used for validation, and data from the remaining two responses comprising 600 images were used for testing. This approach ensures that the model is trained on a diverse dataset (from multiple random responses and multiple samples), validated using fine-tuned hyperparameters, and tested on unseen data to evaluate performance accurately. Splitting the data in this manner aims to enhance the model’s robustness and ability to generalize to new, unseen data, which is crucial for reliable performance in real-world applications.

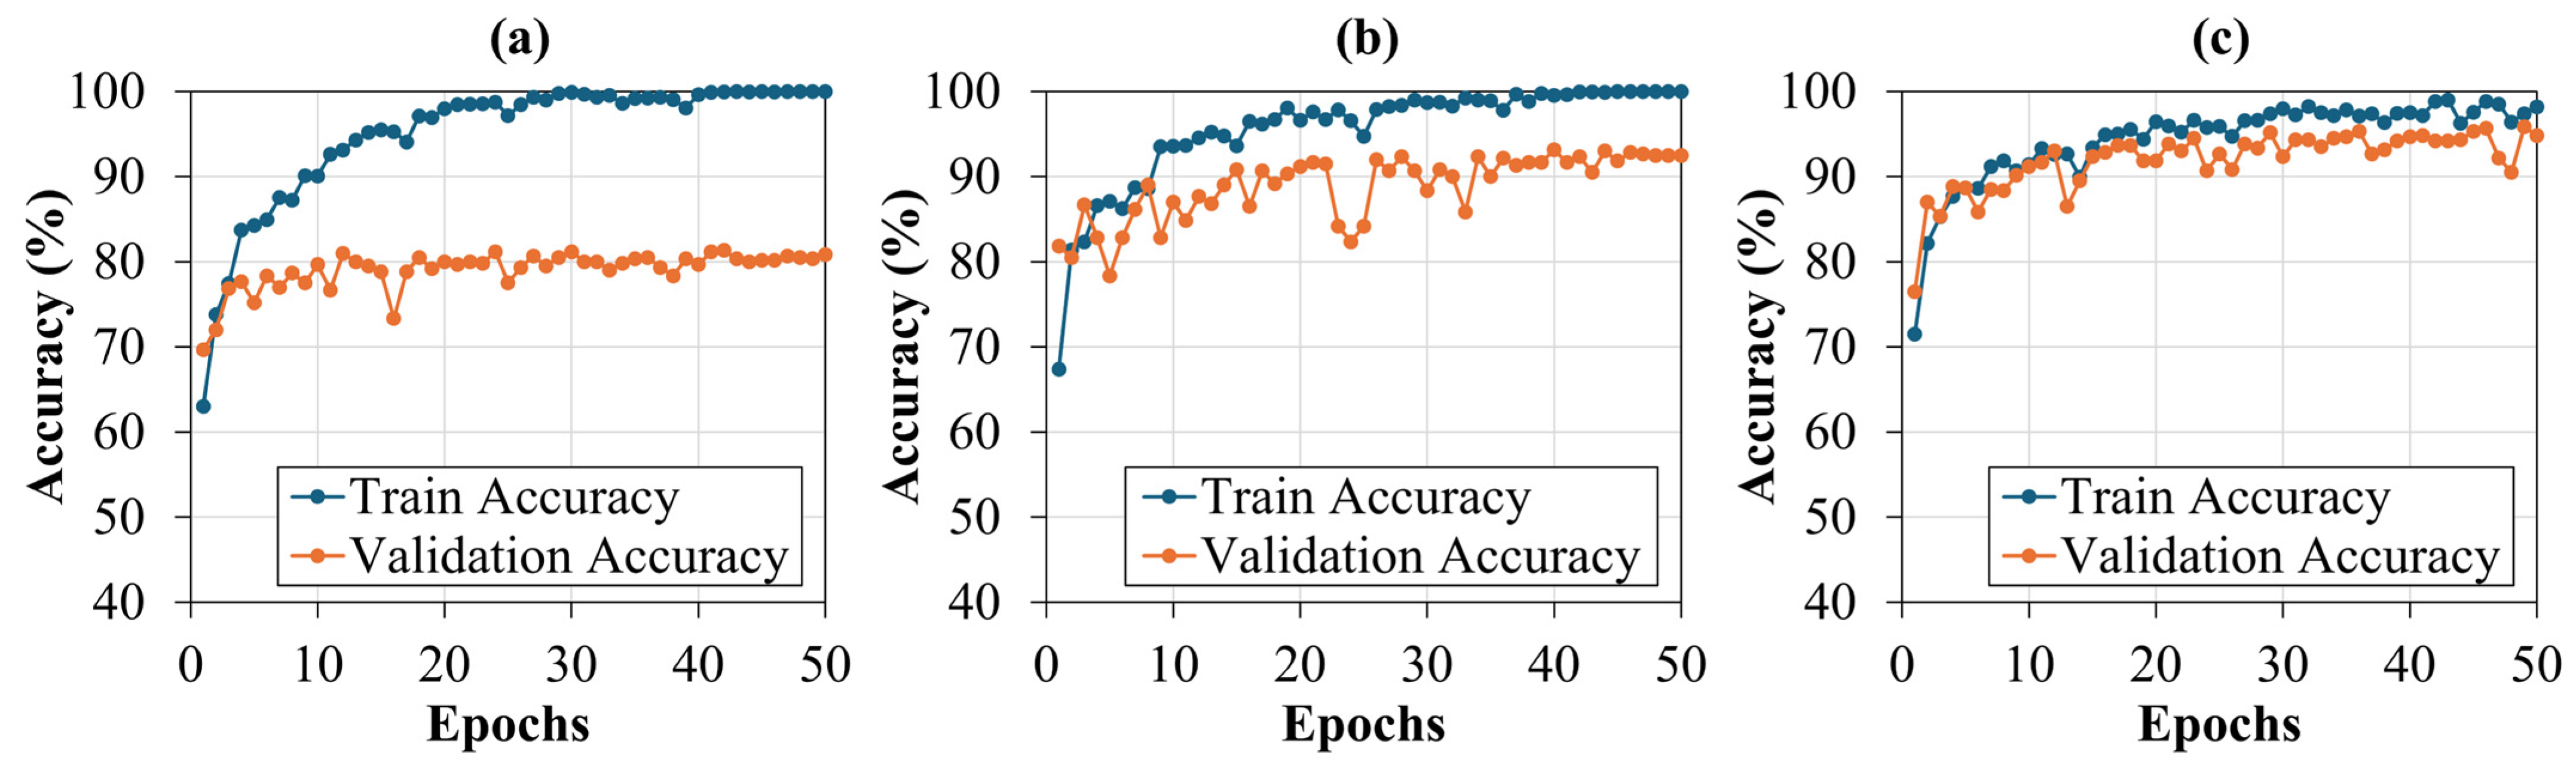
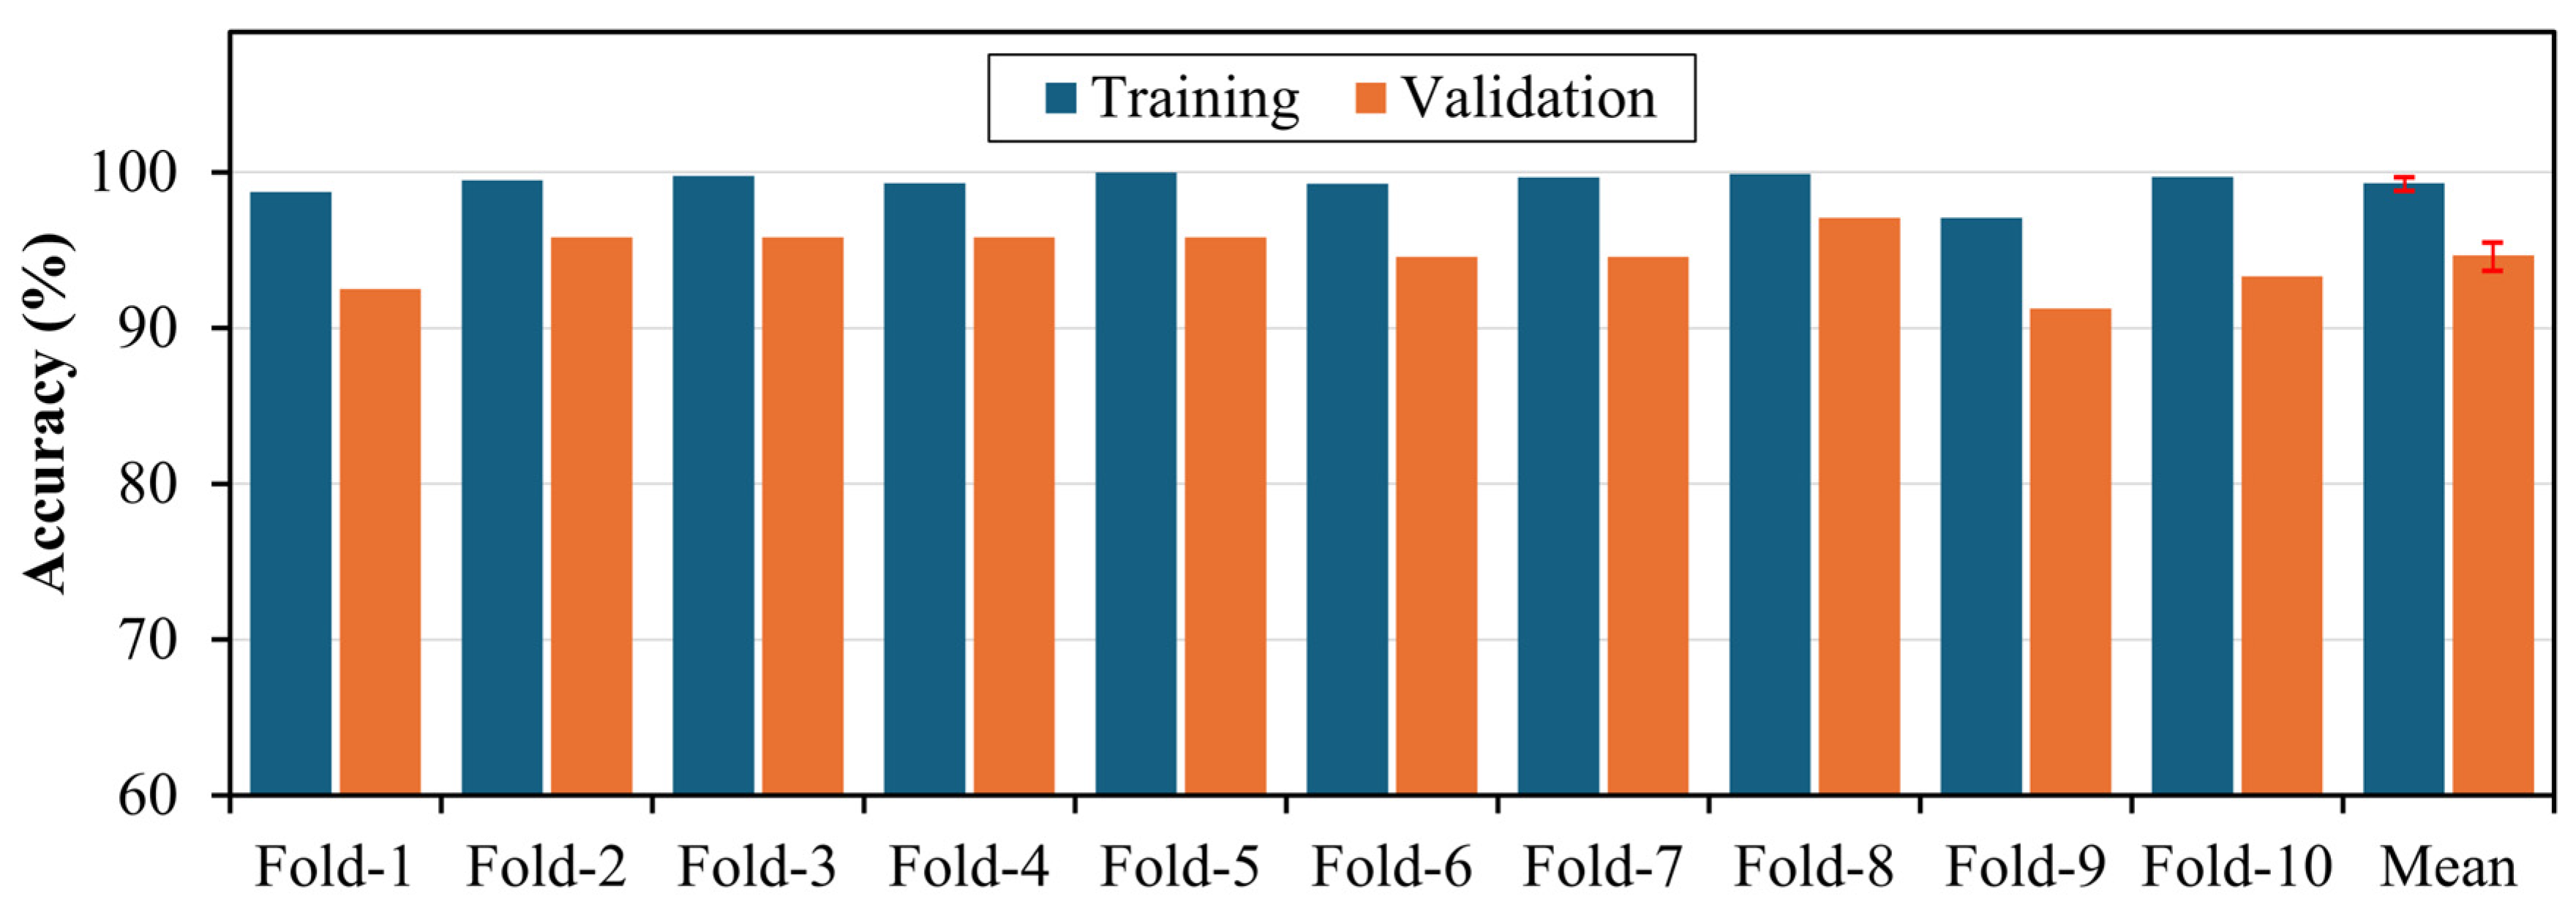
4. Results and Validation

An LTL model based on the EfficientNet architecture was utilized, as detailed in Section 2.3 of this study. All layer weights were frozen, and global average pooling (GAP) was applied, followed by the addition of a dense layer before the classification layer. Only the top three layers of the model were retrained (fine-tuned) on the target vibration data from composite laminates. Using feature maps taken from the EfficientNet architecture and random weight initialization, only the top layers were trained. The base model was trained only once on the training data, rather than multiple times across different training sessions, which is a major benefit of the suggested technique. Moreover, the lightweight nature of EfficientNet helped to complete the training process quicker compared to the traditional transfer learning models. Consequently, this training method shows a much faster learning curve at a lower computing cost. The effectiveness of the proposed EfficientNet was also checked against other lightweight transfer learning models, such as MobileNet and NASNetMobile, as shown in Table 1. All models were trained for 50 epochs, with identical GAP and dense layers added on the top. Figure 7 plots the training curves for the developed models and shows that all models converge within 50 epochs, showcasing their ability to learn faster. Both the NASNetMobile and MobileNet models showed a training accuracy of 100%, while validation accuracies of (80.83 and 92.50)% were achieved, respectively. In contrast, the proposed EfficientNet model showed an accuracies of (99.78 and 94.83)% for training and validation, respectively. The results suggest that the NASNetMobile model shows significant overfitting due to the large difference between the training and the validation accuracies. However, the overfitting was reduced when using the MobileNet and EfficientNet models. The EfficientNet model showed better convergence and less overfitting, as compared to the other lightweight transfer learning models. This demonstrates the effectiveness of using EfficientNet–based pre-trained models for the SHM of composite laminates when there is a lack of training data.
A 10-fold cross-validation strategy validates the generalization ability of the EfficientNet-based model. This approach rigorously tests the performance of the model across different data subsets, minimizing the risk of overfitting and ensuring that the results are not dependent on any specific data split. The results derived from our 10-fold cross-validation are shown in Figure 8. It can be observed that the training and validation accuracies are consistent among all folds. The mean accuracies for 10-fold are shown in the last columns, indicating training and validation accuracies of (99.30 ± 0.82)% and (94.67 ± 1.72)%, respectively. The low standard deviation in both training and validation accuracies indicates that the performance of the model is stable and reliable across different data splits. This further confirms the robustness of the EfficientNet-based model for SHM applications.
To ensure a better evaluation of the LTL models, they were evaluated on unseen test datasets using the assessment metrics mentioned in Section 2.3. The evaluation of unseen data is useful for determining the model’s capacity for generalization. Additionally, if the performance of the trained model on the testing set is noticeably worse, this suggests overfitting to the training set. The NASNetMobile, MobileNet, and EfficientNet models showed testing accuracies of (83.67, 92.50, and 94.50)%, respectively. Figure 9 displays the confusion matrices (CMs) for the three LTL models. A CM is a tabular representation of a classification model’s predictions, where diagonal terms indicate correct classifications (Tp and Tn), while off-diagonal terms denote incorrect classifications (Fp and Fn). The diagonal cell values of the NASNetMobile model are reduced, suggesting inefficient classification of all health states (particularly D2). Furthermore, for damaged states D1 and D2, the model shows higher values in the off-diagonal cells compared to the diagonal cells. This reflects that even though the health state is classified with better accuracy overall, it is still confused with D2. The MobileNet model showed better accuracy in classifying each health state compared to the NASNetMobile model. The EfficientNet model showed very high accuracy in identifying healthy states (99.00%), while damages D1 and D2 were classified with accuracy values of (92.50 and 92.00)%, respectively. However, note that the EfficientNet model showed more consistent results for classifying the damage states compared to the other LTL models. Due to the nature of the same-sized damages present in the composite laminates, there still exists confusion in identifying D1 and D2, but there are fewer misclassified instances for the damage states compared to the NASNetMobile and MobileNet models. This confusion is due to their identical sizes and adjacent locations, which likely result in similar dynamic characteristics. This overlap in the dynamic characteristics is reflected in the scalogram images, where some common high-intensity regions are present for both D1 and D2, contributing to the misclassification between these states.
Several more assessment measures are derived to provide a more in-depth understanding of the performance of each model. Table 2 displays metrics such as the precision, recall, and F1-score for each composite laminate health state. The EfficientNet model provided more accurately predicted scenarios for all health states in terms of precision, which measures the proportion of true positive predictions to all positive predictions. The maximum values for precision reached for D1, D2, and H were (93.91, 92.00, and 97.54)%, respectively. These results show that, in comparison to other LTL models, the model has a larger percentage of accurately predicted occurrences for D1 and D2 and is exceptionally efficient in predicting healthy conditions. In the case of recall, which represents the proportion of true positives correctly identified by the LTL model out of all actual positives in the dataset, EfficientNet achieved maximum recall values of 92.00% for D2 and 99.00% for H. In the case of D1, the highest recall was achieved by the MobileNet model, but the increase compared to the EfficientNet model was only 1.5%. The F1-score represents the harmonic mean of precision and recall, offering a balanced metric that combines both aspects of a classifier’s performance into a single measure. The highest F1-scores of (93.20 and 92.00)% were also found for the EfficientNet model in both damaged cases (D1 and D2). Additionally, an F1-score of 98.26% was obtained for H using the EfficientNet model. Therefore, the results depict that the pre-trained EfficientNet model outperformed other LTL models for the SHM of laminated composites.
In summary, this study establishes the practicality of using LTL models for the SHM of composite laminates. The method effectively evaluates laminated composites with varying delaminations that exhibit similar response characteristics. In addition, to enhance the dependability of the suggested method for practical use, ten random responses were obtained for every sample of each health condition. This approach enables the model to acquire the structural response from a range of responses, enhancing its adaptability and robustness. Future directions could explore extending these techniques into unsupervised learning, potentially broadening the methodology for the SHM of composite laminates under conditions with scarce data.

5. Conclusions

In this paper, a lightweight transfer learning-based technique for composite laminate structural health monitoring was presented. The suggested method was validated using vibrational data that were collected from the experimental setup. Time–frequency scalogram images from CWT analysis were utilized to enhance the feature representation of the experimental data. Various LTL models, including NASNetMobile, MobileNet, and EfficientNet, were evaluated. The results indicated that the NASNetMobile model is susceptible to overfitting, while MobileNet and EfficientNet achieved superior classification performance. EfficientNet achieved notable F1-scores for the D1, D2, and H states, having values of (93.20, 92.00, and 98.26)%, respectively, after fine-tuning global average pooling and adding a dense layer on the vibrational dataset post-pre-training on ImageNet, with locked layer weights. By utilizing the lightweight design of LTL models, the proposed approach demonstrated better results, along with a superior generalization capability. Moreover, the performance of the EfficientNet model did not significantly decline on the test dataset; rather, it declined by 5.28% from the training accuracy and experienced a decline of only 0.33% compared to the validation accuracy. This reduction is minimal compared to the decreases for the NASNetMobile and MobileNet models. Consequently, the prevalent problem of insufficient training data was addressed, particularly in situations where, due to damage conditions, composite laminates could not provide large data. Furthermore, using an LTL model lowers the computational time and expenses associated with model training. Thus, as the suggested method merely requires fine-tuning the previously trained EfficientNet–based LTL model, it may readily be expanded for various boundary conditions and composite structures. This simple fine-tuning approach increases the generalization and robustness of composite laminate SHM, and it is also straightforward to adapt for diverse composite structures. The current study focused on delaminations of the same size at different locations; future research could include delaminations of varying sizes and locations within laminated composite structures. Moreover, standard non-destructive inspection (NDI) could also be utilized to validate the health states of the composites. These pre-tested health states will ensure that high-quality data from each health state are obtained and avoid the problem of false information during model development and validation. Furthermore, while the proposed framework effectively addresses the issue of limited data in the SHM of composite structures, it is important to acknowledge the potential limitations in scenarios with extreme data scarcity. Future work could also explore advanced techniques such as semi-supervised learning and AI-based synthetic data generation to enhance model robustness. Additionally, the creation of public databases within the SHM of composite structures could further resolve data scarcity issues, ensuring broader applicability and improved performance in real-world applications.

Author Contributions

M.M.A.: Data Curation, Investigation, Methodology, Validation, Writing—Original Draft. I.R.: Methodology, Visualization, Writing—Original Draft. M.S.: Methodology, Visualization, Writing—Original Draft. H.S.K.: Supervision, Writing—Review and Editing, Funding Acquisition. All authors have read and agreed to the published version of the manuscript.

Funding

This work was supported by the National Research Foundation of Korea (NRF) grant, funded by the Korea government (MSIT) (No. 2020R1A2C1006613).

Data Availability Statement

Data will be made available upon request.

Conflicts of Interest

The authors declare no conflicts of interest.

References

  1. Azad, M.M.; Cheon, Y.; Raouf, I.; Khalid, S.; Kim, H.S. Intelligent Computational Methods for Damage Detection of Laminated Composite Structures for Mobility Applications: A Comprehensive Review. Arch. Comput. Methods Eng. 2024, 1–29. [Google Scholar] [CrossRef]
  2. Chang, H.-S.; Huang, J.-H.; Tsai, J.-L. Predicting Mechanical Properties of Unidirectional Composites Using Machine Learning. Multiscale Sci. Eng. 2022, 4, 202–210. [Google Scholar] [CrossRef]
  3. Khalid, S.; Kim, H.S. Recent Studies on Stress Function-Based Approaches for the Free Edge Stress Analysis of Smart Composite Laminates: A Brief Review. Multiscale Sci. Eng. 2022, 4, 73–78. [Google Scholar] [CrossRef]
  4. Chen, R.; Li, S.; Zhou, Y.; Qiu, X.; Li, P.; Zhang, H.; Wang, Z. Damage Formation and Evolution Mechanisms in Drilling CFRP with Prefabricated Delamination Defects: Simulation and Experimentation. J. Mater. Res. Technol. 2023, 26, 6994–7011. [Google Scholar] [CrossRef]
  5. Khan, A.; Kim, H.S. A Brief Overview of Delamination Localization in Laminated Composites. Multiscale Sci. Eng. 2022, 4, 102–110. [Google Scholar] [CrossRef]
  6. Raouf, I.; Lee, H.; Kim, H.S. Mechanical Fault Detection Based on Machine Learning for Robotic RV Reducer Using Electrical Current Signature Analysis: A Data-Driven Approach. J. Comput. Des. Eng. 2022, 9, 417–433. [Google Scholar] [CrossRef]
  7. Azimi, M.; Eslamlou, A.; Pekcan, G. Data-Driven Structural Health Monitoring and Damage Detection through Deep Learning: State-of-the-Art Review. Sensors 2020, 20, 2778. [Google Scholar] [CrossRef]
  8. Staszewski, W.J.; Mahzan, S.; Traynor, R. Health Monitoring of Aerospace Composite Structures—Active and Passive Approach. Compos. Sci. Technol. 2009, 69, 1678–1685. [Google Scholar] [CrossRef]
  9. Li, D.; Zhou, J.; Ou, J. Damage, Nondestructive Evaluation and Rehabilitation of FRP Composite-RC Structure: A Review. Constr. Build. Mater. 2021, 271, 121551. [Google Scholar] [CrossRef]
  10. Toh, G.; Park, J. Review of Vibration-Based Structural Health Monitoring Using Deep Learning. Appl. Sci. 2020, 10, 1680. [Google Scholar] [CrossRef]
  11. Zhang, C.; Mousavi, A.A.; Masri, S.F.; Gholipour, G.; Yan, K.; Li, X. Vibration Feature Extraction Using Signal Processing Techniques for Structural Health Monitoring: A Review. Mech. Syst. Signal Process. 2022, 177, 109175. [Google Scholar] [CrossRef]
  12. Zou, C.; Ibrahim, Z.; Hashim, H.; Jamadin, A.; Ayough, P. Nonlinear Analysis of Reinforced Concrete Slabs under High-Cyclic Fatigue Loading. J. Mater. Res. Technol. 2022, 21, 992–1012. [Google Scholar] [CrossRef]
  13. Diaz-Escobar, J.; Díaz-Montiel, P.; Venkataraman, S.; Díaz-Ramírez, A. Classification and Characterization of Damage in Composite Laminates Using Electrical Resistance Tomography and Supervised Machine Learning. Struct. Control Health Monit. 2023, 2023, 1675867. [Google Scholar] [CrossRef]
  14. Gu, R.; Li, Y.; Zhang, S.; Zhu, J.; Pang, X.; Liu, Z. Structural Vibration-Based Identification of Delamination in CFRP Cylinders Using Complex Frequency Domain Correlation and CNN. Compos. Struct. 2023, 321, 117299. [Google Scholar] [CrossRef]
  15. Viotti, I.D.; Gomes, G.F. Delamination Identification in Sandwich Composite Structures Using Machine Learning Techniques. Comput. Struct. 2023, 280, 106990. [Google Scholar] [CrossRef]
  16. Ijjeh, A.A.; Ullah, S.; Kudela, P. Full Wavefield Processing by Using FCN for Delamination Detection. Mech. Syst. Signal Process. 2021, 153, 107537. [Google Scholar] [CrossRef]
  17. Hernández-García, A.; König, P. Further Advantages of Data Augmentation on Convolutional Neural Networks. In Proceedings of the 27th International Conference on Artificial Neural Networks, Rhodes, Greece, 4–7 October 2018; pp. 95–103. [Google Scholar]
  18. Tang, S.; Yuan, S.; Zhu, Y. Data Preprocessing Techniques in Convolutional Neural Network Based on Fault Diagnosis towards Rotating Machinery. IEEE Access 2020, 8, 149487–149496. [Google Scholar] [CrossRef]
  19. Khan, A.; Raouf, I.; Noh, Y.R.; Lee, D.; Sohn, J.W.; Kim, H.S. Autonomous Assessment of Delamination in Laminated Composites Using Deep Learning and Data Augmentation. Compos. Struct. 2022, 290, 115502. [Google Scholar] [CrossRef]
  20. Tan, X.; Sun, X.; Chen, W.; Du, B.; Ye, J.; Sun, L. Investigation on the Data Augmentation Using Machine Learning Algorithms in Structural Health Monitoring Information. Struct. Health Monit. 2021, 20, 2054–2068. [Google Scholar] [CrossRef]
  21. Mumuni, A.; Mumuni, F. Data Augmentation: A Comprehensive Survey of Modern Approaches. Array 2022, 16, 100258. [Google Scholar] [CrossRef]
  22. Özdemir, Ö.; Sönmez, E.B. Attention Mechanism and Mixup Data Augmentation for Classification of COVID-19 Computed Tomography Images. J. King Saud Univ. Comput. Inf. Sci. 2022, 34, 6199–6207. [Google Scholar] [CrossRef]
  23. Raouf, I.; Kumar, P.; Lee, H.; Kim, H.S. Transfer Learning-Based Intelligent Fault Detection Approach for the Industrial Robotic System. Mathematics 2023, 11, 945. [Google Scholar] [CrossRef]
  24. Fotouhi, S.; Pashmforoush, F.; Bodaghi, M.; Fotouhi, M. Autonomous Damage Recognition in Visual Inspection of Laminated Composite Structures Using Deep Learning. Compos. Struct. 2021, 268, 113960. [Google Scholar] [CrossRef]
  25. Zhao, J.; Xie, W.; Yu, D.; Yang, Q.; Meng, S.; Lyu, Q. Deep Transfer Learning Approach for Localization of Damage Area in Composite Laminates Using Acoustic Emission Signal. Polymers 2023, 15, 1520. [Google Scholar] [CrossRef] [PubMed]
  26. Rai, A.; Mitra, M. A Transfer Learning Approach for Damage Diagnosis in Composite Laminated Plate Using Lamb Waves. Smart Mater. Struct. 2022, 31, 065002. [Google Scholar] [CrossRef]
  27. Wang, Y.; Luo, Q.; Xie, H.; Li, Q.; Sun, G. Digital Image Correlation (DIC) Based Damage Detection for CFRP Laminates by Using Machine Learning Based Image Semantic Segmentation. Int. J. Mech. Sci. 2022, 230, 107529. [Google Scholar] [CrossRef]
  28. Saeed, N.; King, N.; Said, Z.; Omar, M.A. Automatic Defects Detection in CFRP Thermograms, Using Convolutional Neural Networks and Transfer Learning. Infrared Phys. Technol. 2019, 102, 103048. [Google Scholar] [CrossRef]
  29. Wu, D.; Chen, D.; Yu, G. New Health Indicator Construction and Fault Detection Network for Rolling Bearings via Convolutional Auto-Encoder and Contrast Learning. Machines 2024, 12, 362. [Google Scholar] [CrossRef]
  30. Albelwi, S.; Mahmood, A. A Framework for Designing the Architectures of Deep Convolutional Neural Networks. Entropy 2017, 19, 242. [Google Scholar] [CrossRef]
  31. Jiang, C.; Zhou, Q.; Lei, J.; Wang, X. A Two-Stage Structural Damage Detection Method Based on 1D-CNN and SVM. Appl. Sci. 2022, 12, 10394. [Google Scholar] [CrossRef]
  32. Iosifidis, A.; Tefas, A. Deep Learning for Robot Perception and Cognition; Academic Press: Cambridge, MA, USA, 2022; ISBN 0/323/88572/1. [Google Scholar]
  33. Azad, M.M.; Kumar, P.; Kim, H.S. Delamination Detection in CFRP Laminates Using Deep Transfer Learning with Limited Experimental Data. J. Mater. Res. Technol. 2024, 29, 3024–3035. [Google Scholar] [CrossRef]
  34. Liu, H.-I.; Galindo, M.; Xie, H.; Wong, L.-K.; Shuai, H.-H.; Li, Y.-H.; Cheng, W.-H. Lightweight Deep Learning for Resource-Constrained Environments: A Survey. ACM Comput. Surv. 2024, 56, 1–42. [Google Scholar] [CrossRef]
  35. Simonyan, K.; Zisserman, A. Very Deep Convolutional Networks for Large-Scale Image Recognition. arXiv 2014, arXiv:14091556. [Google Scholar]
  36. Chen, F.; Li, S.; Han, J.; Ren, F.; Yang, Z. Review of Lightweight Deep Convolutional Neural Networks. Arch. Comput. Methods Eng. 2023, 31, 1915–1937. [Google Scholar] [CrossRef]
  37. Chollet, F. Xception: Deep Learning with Depthwise Separable Convolutions. In Proceedings of the IEEE Conference on Computer Vision and Pattern Recognition, Honolulu, HI, USA, 21–26 July 2017; pp. 1251–1258. [Google Scholar]
  38. Ma, N.; Zhang, X.; Zheng, H.-T.; Sun, J. Shufflenet v2: Practical Guidelines for Efficient Cnn Architecture Design. In Proceedings of the European Conference on Computer Vision (ECCV), Munich, Germany, 8–14 September 2018; pp. 116–131. [Google Scholar]
  39. Konovalenko, I.; Maruschak, P.; Brezinová, J.; Prentkovskis, O.; Brezina, J. Research of U-Net-Based CNN Architectures for Metal Surface Defect Detection. Machines 2022, 10, 327. [Google Scholar] [CrossRef]
  40. Tan, M.; Le, Q. Efficientnet: Rethinking Model Scaling for Convolutional Neural Networks. In Proceedings of the International Conference on Machine Learning, PMLR, Long Beach, CA, USA, 10–15 June 2019; pp. 6105–6114. [Google Scholar]
  41. Atila, Ü.; Uçar, M.; Akyol, K.; Uçar, E. Plant Leaf Disease Classification Using EfficientNet Deep Learning Model. Ecol. Inform. 2021, 61, 101182. [Google Scholar] [CrossRef]
  42. Sandler, M.; Howard, A.; Zhu, M.; Zhmoginov, A.; Chen, L.-C. Mobilenetv2: Inverted Residuals and Linear Bottlenecks. In Proceedings of the IEEE Conference on Computer Vision and Pattern Recognition, Salt Lake City, UT, USA, 18–22 June 2018; pp. 4510–4520. [Google Scholar]
  43. Sokolova, M.; Lapalme, G. A Systematic Analysis of Performance Measures for Classification Tasks. Inf. Process. Manag. 2009, 45, 427–437. [Google Scholar] [CrossRef]
  44. Galar, M.; Fernández, A.; Barrenechea, E.; Bustince, H.; Herrera, F. An Overview of Ensemble Methods for Binary Classifiers in Multi-Class Problems: Experimental Study on One-vs-One and One-vs-All Schemes. Pattern Recognit. 2011, 44, 1761–1776. [Google Scholar] [CrossRef]
  45. Aslan, M. CNN Based Efficient Approach for Emotion Recognition. J. King Saud Univ. Comput. Inf. Sci. 2022, 34, 7335–7346. [Google Scholar] [CrossRef]
  46. Liu, Y.; Li, Z.; Zhang, W. Crack Detection of Fibre Reinforced Composite Beams Based on Continuous Wavelet Transform. Nondestruct. Test. Eval. 2010, 25, 25–44. [Google Scholar] [CrossRef]
Figure 1. The proposed framework for the LTL-based SHM of composite laminates.
Machines 12 00589 g001
Figure 2. The architecture of the proposed EfficientNet–based lightweight transfer learning model.
Machines 12 00589 g002
Figure 3. Confusion matrix showing the distribution of true positives, false negatives, false positives, and true negatives in classification.
Machines 12 00589 g003
Figure 4. (a) The composite plate obtained after the hot press compression molding process and (b) the five samples obtained for each health state, where the red highlighted area shows the location of the damage, and the black shaded region on the left shows the clamping of the samples in the cantilever beam configuration during the vibration testing. The schematic on the bottom shows the location of the seeded delaminations from a cross-sectional view present at the mid-plane.
Machines 12 00589 g004
Figure 5. A schematic of the health states and the experimental setup used to extract the vibrational data from composite laminates.
Machines 12 00589 g005
Figure 6. (a) The transformation of raw vibrational data into scalogram images using CWT analysis for the healthy laminated composites; (b) examples of scalogram images for damage states D1 and D2.
Machines 12 00589 g006
Figure 7. The training curves of the lightweight transfer learning models based on the number of epochs: (a) NASNetMobile, (b) MobileNet, and (c) EfficientNet.
Machines 12 00589 g007
Figure 8. The training and validation accuracies for each fold of the EfficientNet model based on 10-fold cross-validation.
Machines 12 00589 g008
Figure 9. The CMs for the (a) NASNetMobile, (b) MobileNet, and (c) EfficientNet models, obtained using unseen test datasets.
Machines 12 00589 g009
Table 1. The number of parameters and the size of the model for some commonly used transfer learning models in comparison to the LTL models.
Transfer Learning ModelNumber of Parameters (Million)Size of Model (Mbs)
AlexNet61.10233.07
DenseNet-1218.0630.44
ResNet-5025.6497.59
VGG-16138.36527.79
InceptionV323.8590.86
NASNetMobile5.3220.18
MobileNet4.2516.14
EfficientNet5.3320.17
Table 2. Comparison of the performance of the LTL models for the SHM of composite laminates using precision, recall, and F1-score.
Health StateLTL ModelPrecision (%)Recall (%)F1-Score (%)
D1NASNetMobile82.4484.5083.46
MobileNet90.3894.0092.16
EfficientNet93.9192.5093.20
D2NASNetMobile80.2079.0079.60
MobileNet90.0090.0090.00
EfficientNet92.0092.0092.00
HNASNetMobile88.3887.5087.94
MobileNet97.4093.5095.41
EfficientNet97.5499.0098.26
Disclaimer/Publisher’s Note: The statements, opinions and data contained in all publications are solely those of the individual author(s) and contributor(s) and not of MDPI and/or the editor(s). MDPI and/or the editor(s) disclaim responsibility for any injury to people or property resulting from any ideas, methods, instructions or products referred to in the content.

