Article

Optimization of the Femtosecond Laser Machining Process for Single Crystal Diamond Using Response Surface Methodology

1
School of Mechanical and Electrical Engineering, Hunan City University, Yiyang 413000, China
2
College of Mechanical and Vehicle Engineering, Hunan University, Changsha 410082, China
3
Shandong Taikai Power Switchgear Co., Ltd., Taian 271000, China
*
Author to whom correspondence should be addressed.
Machines 2024, 12(9), 614; https://doi.org/10.3390/machines12090614
Submission received: 19 August 2024 / Revised: 1 September 2024 / Accepted: 2 September 2024 / Published: 3 September 2024
(This article belongs to the Special Issue Design and Manufacturing for Lightweight Components and Structures)

Abstract

:
Femtosecond laser machining offers high precision and minimal thermal impact, making it a promising technique for processing hard and brittle materials like single-crystal diamonds (SCDs). In this study, the femtosecond laser machining process for SCD material was systematically optimized to improve both machining efficiency and quality. Initial single-factor experiments were conducted to explore the effects of key process parameters—laser power, scanning speed, and number of scans—on machining performance. Subsequently, response surface methodology (RSM)-based experiments designed using the Box–Behnken method were employed to comprehensively refine the process. A regression model was developed to analyze the data, and the interaction effects of the parameters were thoroughly evaluated. The validated model identified an optimal set of parameters, resulting in a significant improvement in machining performance. This research provides a comprehensive framework for optimizing femtosecond laser machining processes, offering valuable insights critical for the production of advanced lightweight components in industries such as aerospace, optical instruments, and high-performance electronics.

1. Introduction

The unique crystal structure of diamond material combined with the high bond energy of its C-C covalent bonds provides exceptional hardness, wear resistance, and chemical stability, along with low thermal conductivity and high electrical insulation [1,2,3]. With continuous advancements in synthetic diamond fabrication technologies, particularly through the refinement of High-Pressure High Temperature (HPHT) and Chemical Vapor Deposition (CVD) methods, the performance of synthetic SCD closely rivals that of natural diamonds [4]. Consequently, SCD is now widely employed not only in precision cutting tools but also in the production of lightweight components across industries such as aerospace, optical instruments, and high-performance electronics, where the need to reduce component weight without compromising strength and durability is critical [5,6,7].
Despite the diamond’s exceptional physical properties, its extreme hardness introduces substantial challenges in machining [8]. Traditional mechanical methods often suffer from low efficiency, excessive tool wear, and inconsistent quality, especially when dealing with complex microstructures. As a non-contact method, laser machining has become a preferred technique for diamond machining due to its high energy density and precision [9,10]. Femtosecond laser technology, characterized by its ultra-short pulse duration, has recently shown considerable potential in the precision machining of hard and brittle materials. Compared to conventional lasers, femtosecond laser machining greatly reduces the heat-affected zone, resulting in higher precision and improved surface quality [11,12].
Progress has been made in the study of femtosecond laser machining of diamond materials. Konov et al. [13,14] investigated the interior graphitization of CVD diamonds under femtosecond laser irradiation, examining the effects of laser pulse width and ambient pressure on the properties of graphitized conductive wires and surface etching rates. Wang et al. [15] demonstrated the application of femtosecond laser technology in the precise separation of SCD films, showing its potential for separating grown diamond films from their substrates. Zhao et al. [16] explore the fabrication of CVD microarray diamond tools using a femtosecond laser, focusing on the optimization of cutting-edge quality, material removal efficiency, and tool performance in micro-texture processing. Ackerl et al. [17] utilized ultra-short pulsed laser to manufacture diamond grinding tools, achieving high precision with enhanced grain protrusion and minimal geometric deviation.
Despite these significant advancements, most studies primarily focused on the ablation mechanism of SCD and optimization through single-factor experiments. RSM offers a systematic approach to exploring multi-factor interactions and optimizing process parameters. It enables the construction of predictive models that accurately describe the relationships between process parameters and desired outcomes [18]. In terms of femtosecond laser machining, the application of RSM has gained recognition for its effectiveness in optimizing complex processes. Hu et al. [19] applied RSM to optimize femtosecond laser processing of SiC/SiC ceramic matrix composites, developing reliable models for predicting surface roughness, groove dimensions, and material removal rates. Chatterjee et al. [20] utilized RSM to optimize pulsed laser microdrilling of titanium alloys, identify critical parameters that influence the hole quality, and significantly improve the overall process efficiency and material integrity.
In this study, the femtosecond laser machining process for SCD material was systematically optimized using both single-factor experiments and RSM to improve the machining quality and efficiency simultaneously, i.e., maximizing the ablation width and depth while minimizing surface roughness. Initial single-factor experiments were conducted to evaluate the effects of key process parameters, including laser power, scanning speed, and the number of scans, on machining performance. A mathematical model was developed using RSM to describe the relationships between process parameters and machining outcomes. The interactions among these parameters were comprehensively analyzed, and the optimized parameters were validated through subsequent experiments, providing practical insights for the femtosecond laser machining of SCD and other hard and brittle materials.

2. Materials and Experiments

2.1. Materials

The synthetic SCD plate used in the femtosecond laser machining experiments is provided by Henan Huanghe Whirlwind Co., Ltd., Xuchang, China with a dimension of 4 mm × 4 mm × 1 mm. The SCD was prepared using the HTHP method. It exhibits a pale yellow color because some carbon atoms in its crystal structure were replaced by nitrogen impurities. Table 1 presents the properties and parameters of the synthetic SCD material.

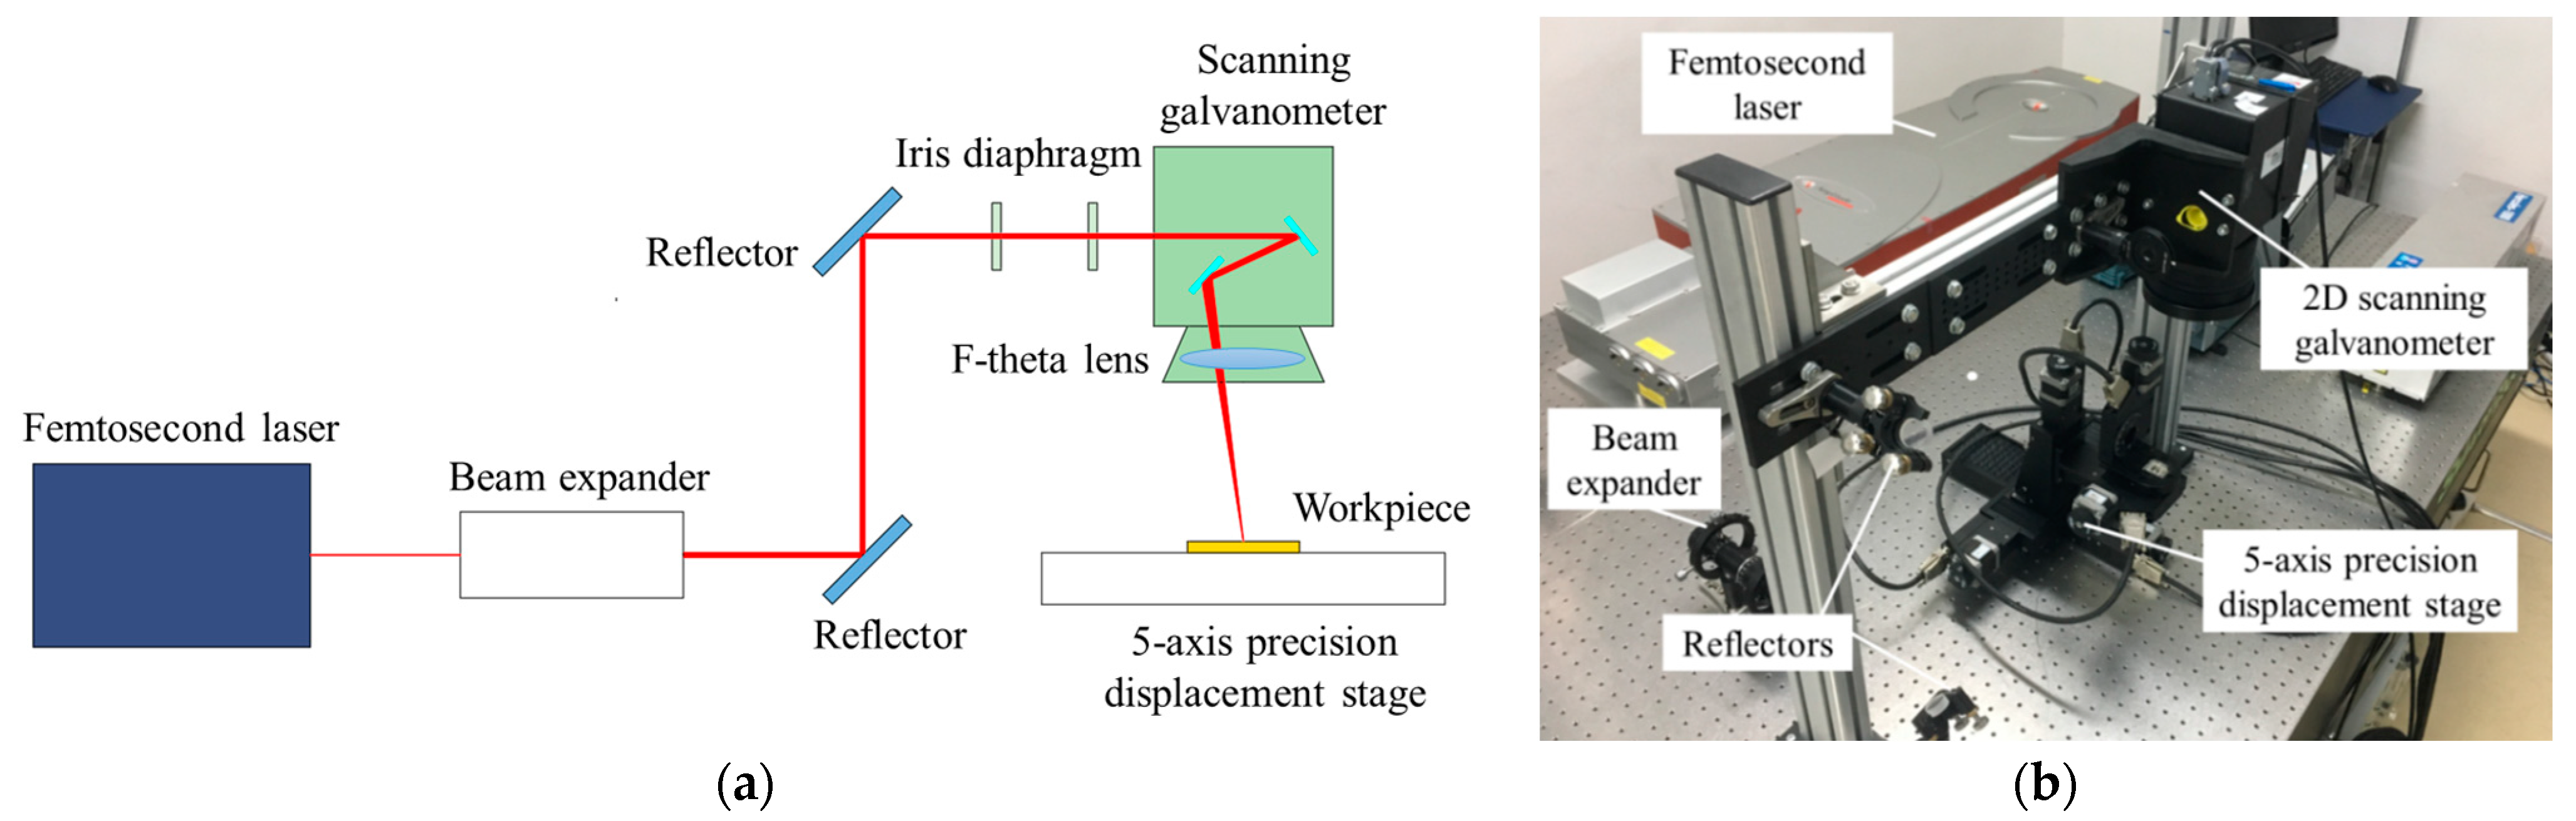
2.2. Experimental Methods and Apparatus

The laser machining experiments were conducted via an Amplitude Systems Ti: Sapphire femtosecond laser. It provides a maximum power of 36 W, a minimum pulse width of 250 fs, and a center wavelength of 1030 nm. The femtosecond laser machining experimental setup consists of a femtosecond laser, a SCANLAB 2D scanning galvanometer, a beam expander, several reflectors, and a five-axis precision displacement platform on which the SCD sample is mounted, as shown in Figure 1. The focusing lens of the galvanometer has a focal length of 160 mm, producing a Gaussian spatial distribution beam with a spot diameter of approximately 30 μm at the focal plane.
The SCD sample was cleaned with an ultrasonic cleaning machine before and after the femtosecond laser machining experiments. A series of single-pass microgroove machining was conducted on the surface of SCD samples, as it represents the most common and fundamental processes in diamond machining. After femtosecond laser irradiation, the ablation width and depth of the machined microgrooves were observed by a TESCAN field emission SEM and measured by a KEYENCE VHX 3D digital microscope, which also measured the surface roughness at the deepest point on the bottom surface of the grooves.

2.3. Single-Factor Experiments Setup

In femtosecond laser machining experiments, the selection of process parameters is critical for determining the machining quality and efficiency of SCD. To identify suitable parameter ranges for RSM experiments, it is necessary to start with single-factor experimental studies. These studies systematically investigate the effects of key laser machining parameters, including laser power, scanning speed and the number of scans, on ablation width, ablation depth and surface roughness of the SCD microgrooves. The specific parameters used in these experiments are presented in Table 2.

2.4. RSM Experiments Setup

The RSM is employed to design experiments for the femtosecond laser machining process of SCD material based on the insights gained from single-factor experimental studies. The correlations between various experimental parameters and the response values are investigated, leading to further optimization of the machining parameters.
The RSM utilizes multivariate regression to develop empirical models that approximate the laser machining process behavior. The widely used second-order polynomial in RSM is represented in Equation (1) [21].
y = β 0 + j = 1 k β j x j + j = 1 k β j j x j 2 + i < j j = 2 k β i j x i x j + ε
where βi,j = 0, 1, …, k is the regression coefficients, ε is the introduced random errors.
The experimental design is carried out using the Box–Behnken Design (BBD) method, a common approach in RSM known for its efficiency in reducing the number of experimental runs. A mathematical model using RSM is developed with Design-Expert software (v13) to assess the influence of key laser machining parameters on the quality and efficiency of SCD machining. The laser machining parameters and their ranges for the BBD are determined based on the results from single-factor experiments.

3. Results and Discussion

3.1. Single-Factor Experiments

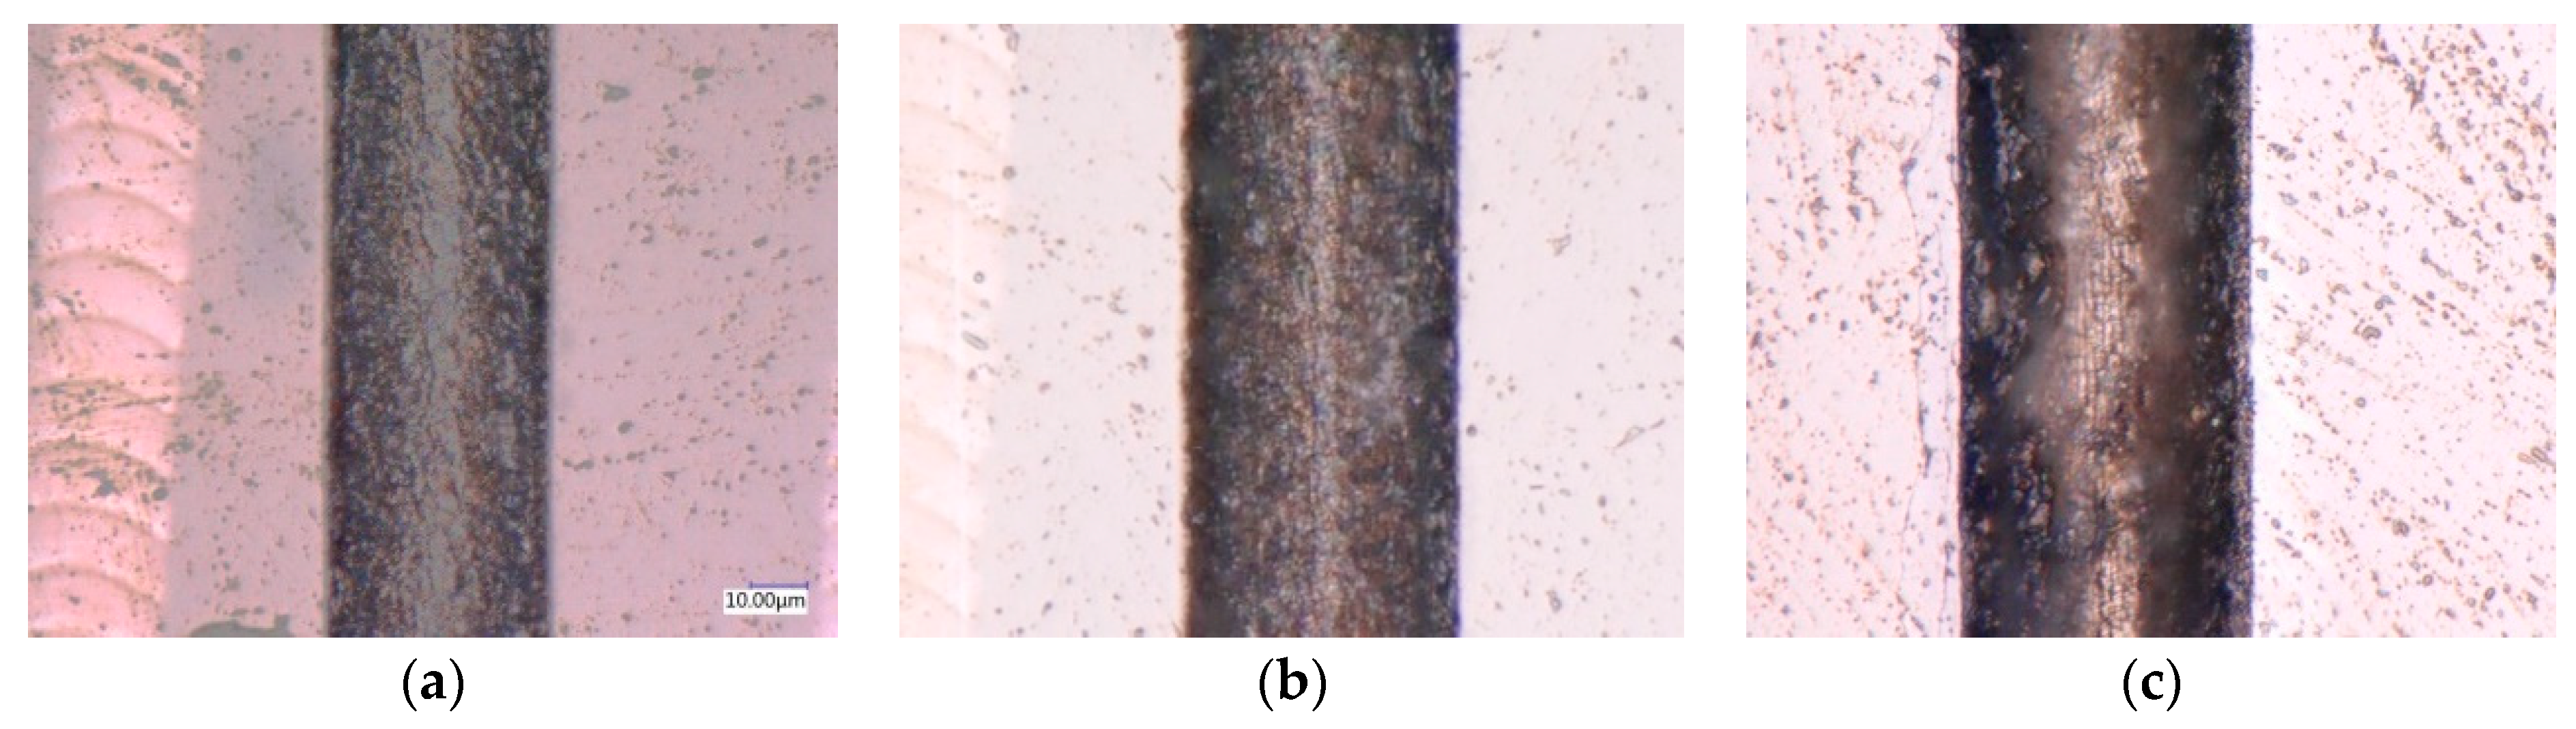
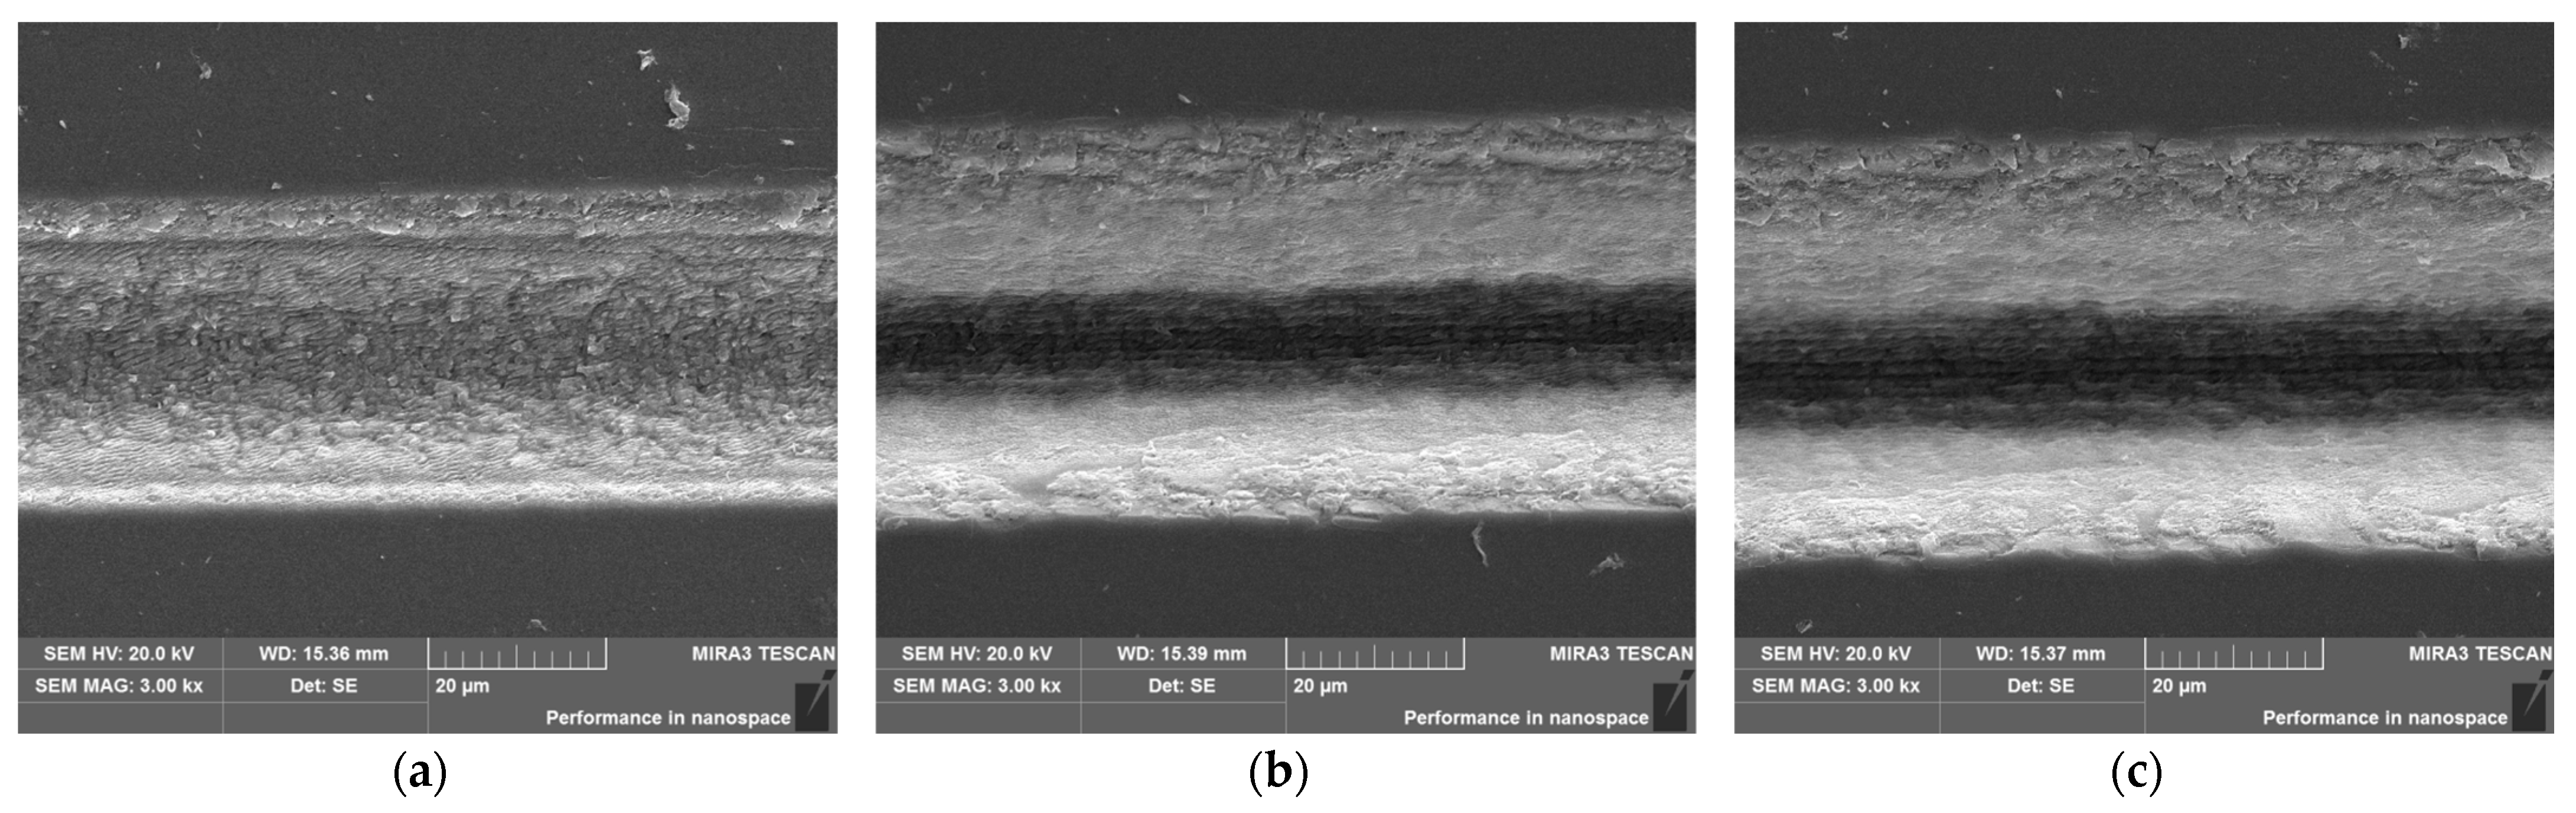
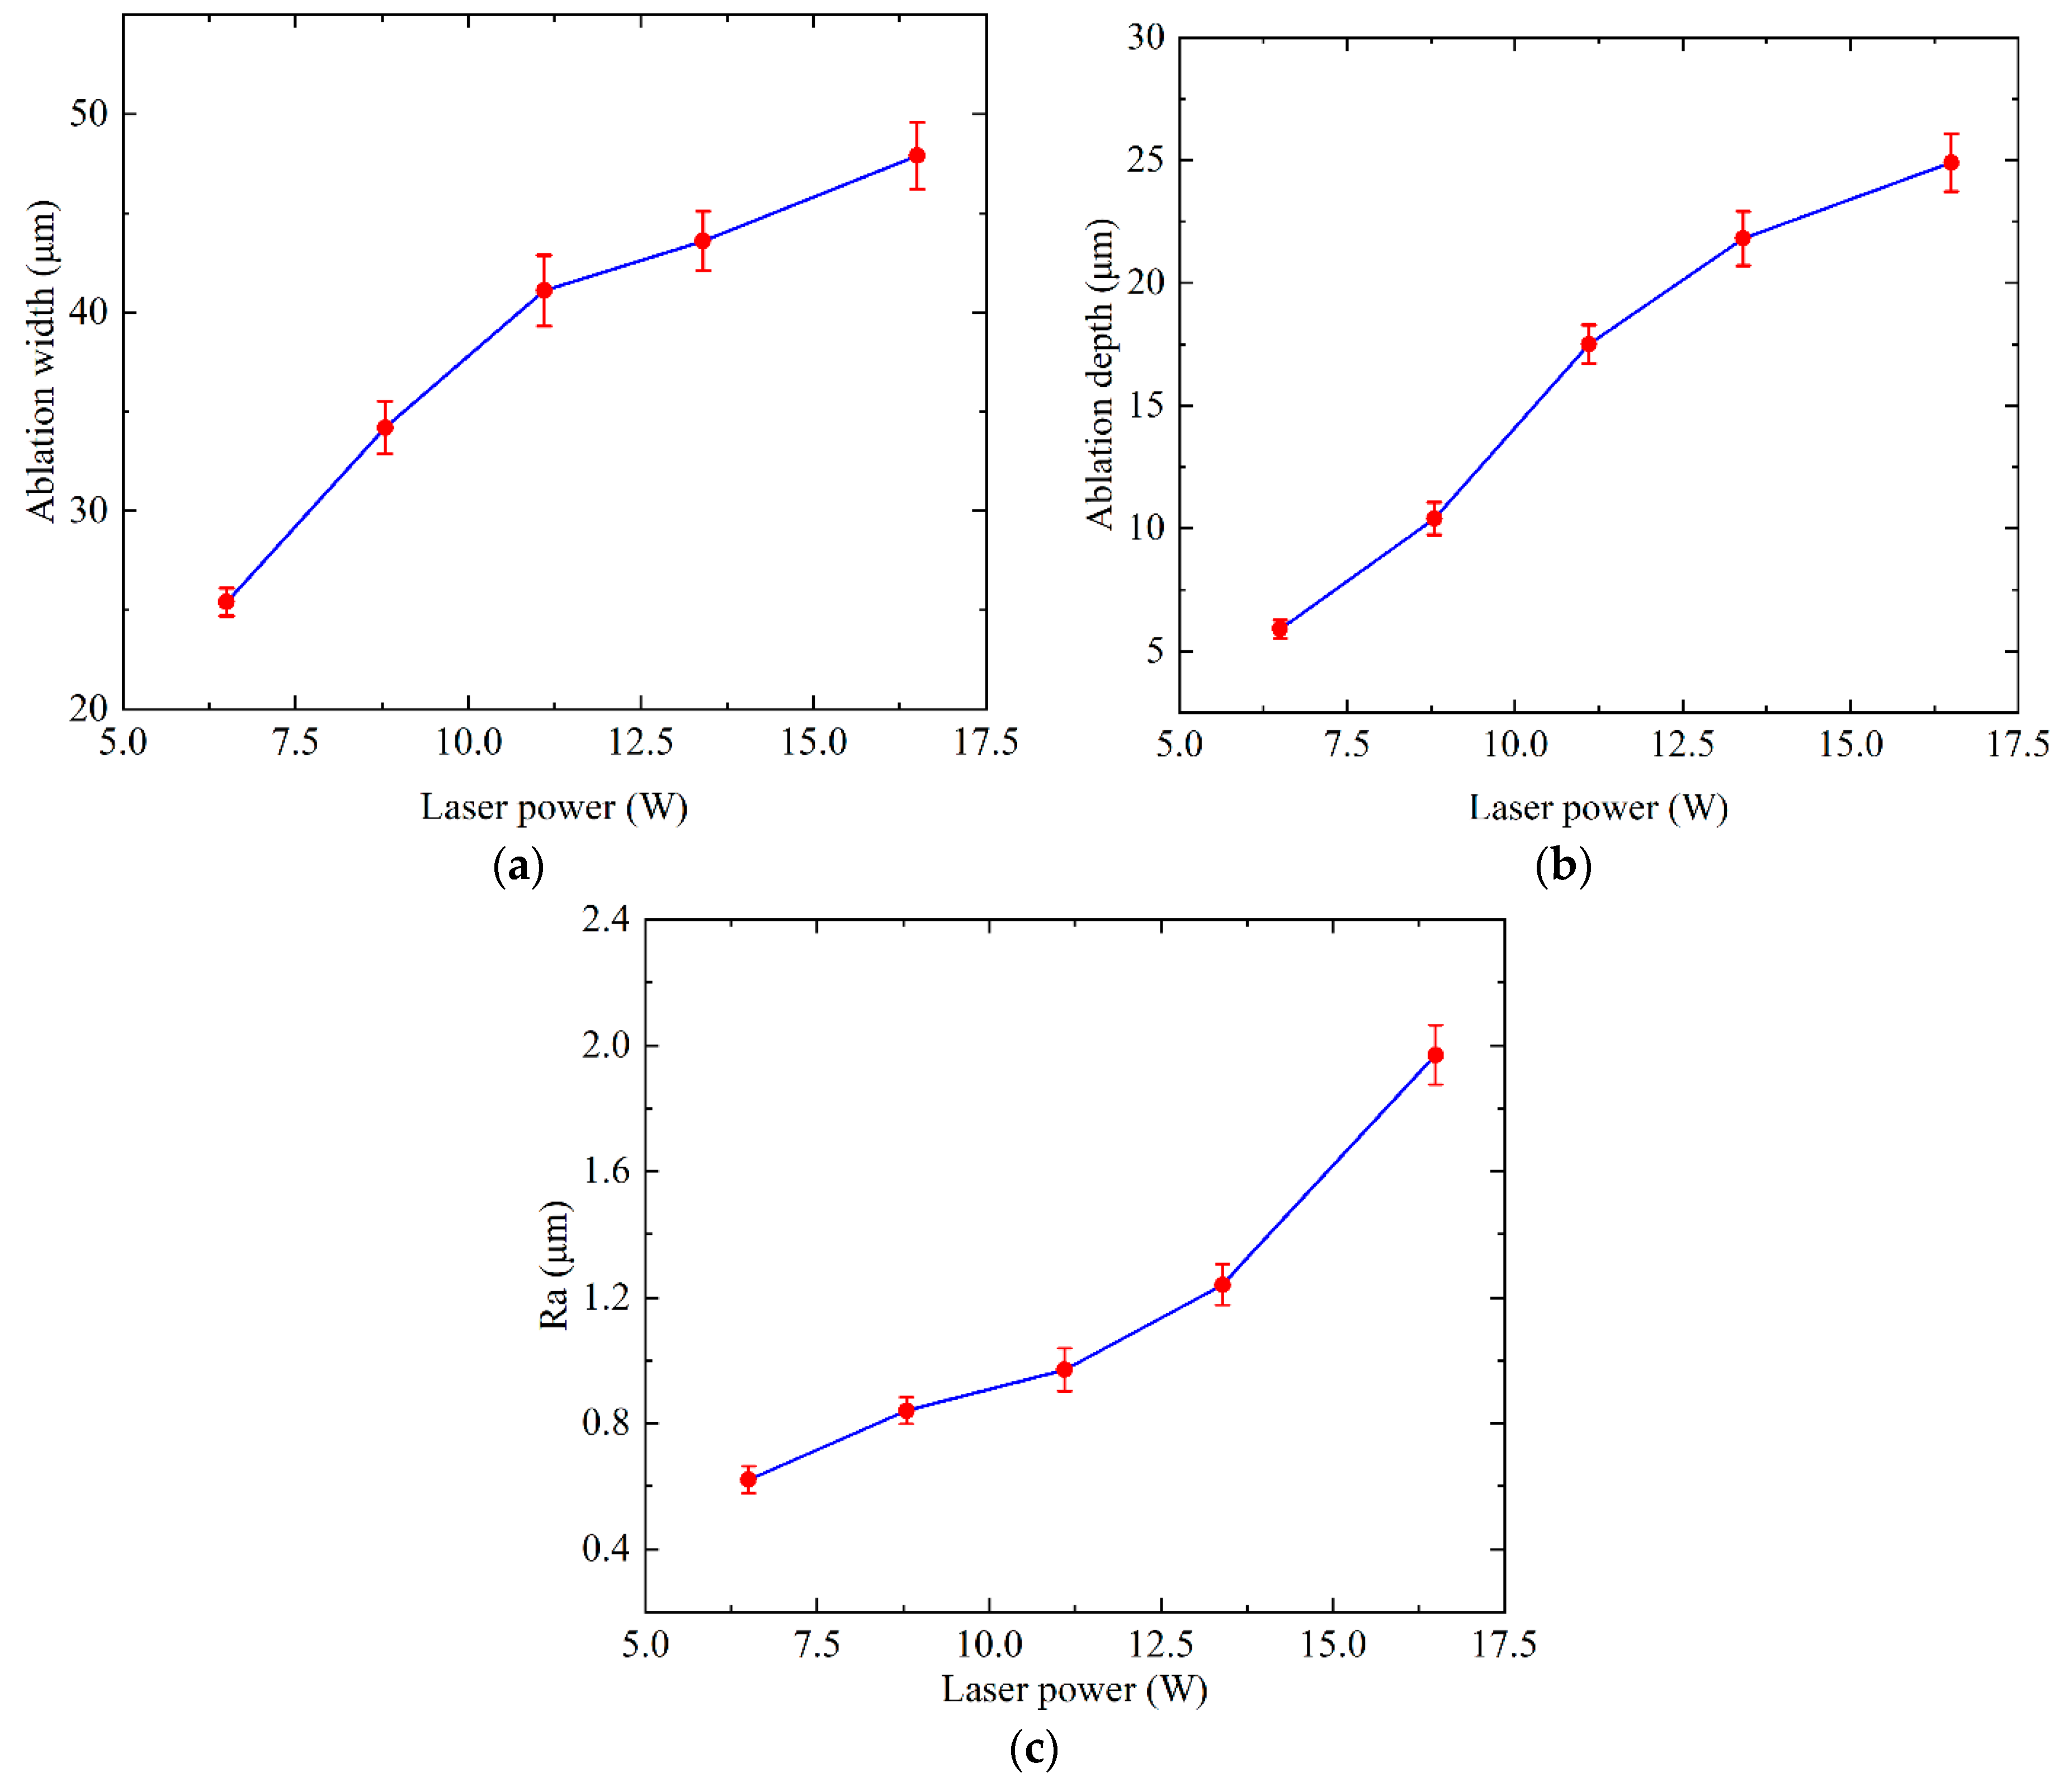
3.1.1. Influence of Laser Power

To investigate the influence of laser power on the machining efficiency and quality, single-pass linear scanning was performed on the SCD surface using various laser powers. The laser power parameters used in the experiments were 6.5 W, 9.6 W, 11.1 W, 13.4 W, and 16.5 W. The scanning speed was kept constant at 2 m/s and the number of scans was set to 100. Each set of parameters was repeated five times, and the same applies throughout.
After femtosecond laser machining, the microscopic morphology of the SCD microgrooves was observed using a 3D digital microscope and SEM. Figure 2 shows the structure and surface morphology of the microgrooves on the SCD surface machined with laser powers of 6.5 W, 11.1 W, and 16.5 W, respectively. These images were obtained using the 3D digital microscope at a magnification of 1000×.
Figure 3 shows the microgroove structure and surface morphology observed under SEM at a magnification of 3000× for the same laser power conditions. As shown in Figure 2a and Figure 3a, at a laser power of 6.5 W, the laser power density applied to the surface of SCD is relatively low, resulting in a weaker material ablation effect. Consequently, the machined microgroove structure remains well-preserved, with a smooth surface and regular, crack-free edges. However, the depth and width of the microgroove are comparatively small, indicating low machining efficiency. When the laser power is increased to 11.1 W, the ablation depth and width of the machined microgroove on the SCD surface increase significantly, as shown in Figure 2b and Figure 3b. Despite the increased laser power, the surface quality of the laser machined area remains good, with regular straight edges and no significant cracks. As the laser power further increases to 16.5 W, the ablation depth and width of the microgrooves exhibit a slight increase, but the heat-affected zone becomes more pronounced. This is accompanied by the appearance of cracks and irregular material fragmentation at the groove edges, leading to a deterioration in the surface quality of the machined area, as shown in Figure 2c and Figure 3c.
The ablation width, ablation depth and bottom surface roughness of the microgrooves machined on the SCD plate were measured using a 3D digital microscope. The influence of laser power on the ablation width, ablation depth and surface roughness of the microgrooves are presented in Figure 4.
Figure 4a shows that with the increase in laser power, the ablation width of the microgrooves in the laser machining SCD plate gradually increases. When the laser power exceeds 11.1 W, the increase in ablation width tends to slow down. This is because, for femtosecond laser pulses with a Gaussian spatial distribution, higher laser power raises both the single pulse energy and the laser energy density. Consequently, the area within the laser focal spot that exceeds the material’s ablation threshold also expands, resulting in a wider ablation microgroove on the material surface. Figure 4b illustrates that the ablation depth of the microgrooves in SCD also increases with higher laser power. With other machining parameters kept constant, an increase in laser power results in higher single-pulse energy and consequently greater material removal per pulse, leading to an increased cumulative ablation depth. Figure 4c shows that the surface roughness at the bottom of the microgrooves increases with laser power. At laser powers above 11.1 W, the quality of the groove bottom surface deteriorates significantly. This is primarily due to the laser power density exceeding the ablation threshold of SCD material, causing the removal mechanism to transition from sublimation to explosive phase change, which leads to irregular material removal.

3.1.2. Influence of Scanning Speed

Experiments are also conducted to investigate the influence of scanning speed on machining efficiency and quality. The scanning speed ranged from 1 m/s to 3 m/s, with a laser power of 11.1 W, and a constant scanning time of 100. The variation trends of ablation width, ablation depth and surface roughness of the microgrooves with scanning speed are illustrated in Figure 5.
Figure 5a depicts that as the laser scanning speed increases, the width of the machined microgrooves in SCD does not show significant changes. This can be attributed to the fact that variations in scanning speed do not affect the effective range of the laser focus spot, which is crucial in determining the ablation width. Figure 5b illustrates that an increase in laser scanning speed leads to a reduction in the depth of microgrooves. This trend is more significant at lower scanning speeds. The underlying mechanism is that higher scanning speeds decrease the overlap rate of the laser spot along the scanning direction. Consequently, the decrease in the number of laser pulses irradiating a specified area per unit of time results in a reduction in the accumulated material removal, thereby reducing the ablation depth. Figure 5c shows that the surface roughness of microgrooves decreases with increasing laser scanning speed. As the scanning speed rises, the overlap rate of the laser spot decreases, leading to less energy accumulation on the surface. This reduction in accumulated energy helps to minimize thermal stress and prevent the recondensation of ablation byproducts, resulting in a smoother surface finish.

3.1.3. Influence of Number of Scans

The influence of the number of scans on machining efficiency and quality is also examined. The number of scans varied from 50 to 200, with a laser power of 11.1 W and a scanning speed of 2 m/s. Figure 6 illustrates the trends in ablation width, ablation depth and surface roughness of the microgrooves as the number of scans increases.
From Figure 6a, it is evident that increasing the number of scans does not significantly affect the width of the microgrooves, as the effective range of the laser focus spot remains consistent despite repeated scanning. Figure 6b shows that the ablation depth gradually increases with the number of scans. This is attributed to the higher number of effective pulses and the accumulation of pulse energy in the ablation area, leading to greater material removal. However, once the ablation depth reaches a certain threshold, the rate of increase slows down. This deceleration is caused by the shielding effect of ablation byproducts and plasma, as well as the defocusing of the laser spot. Figure 6c indicates that a higher number of scans significantly degrades the surface quality of the machined microgroove. This deterioration is caused by the excessive accumulation of laser pulse energy, which leads to the diffusion of surplus energy into the surrounding areas, resulting in defects such as recast layers and thermal cracks.

3.2. RSM Experiments

3.2.1. Response Surface Experimental Design and Results

Based on the results of the single-factor experiments, laser power, scanning speed and the number of scans were identified as significant factors influencing the machining efficiency and quality of SCD. The process parameters and their levels for the RSM experiments were determined by selecting the ranges that exhibited notable variations in machining results observed during the single-factor studies, as detailed in Table 3.
To achieve comprehensive and robust optimization of the process parameters in femtosecond laser machining of SCD material, three critical response values, ablation width, ablation depth and surface roughness were selected for RSM analysis. These response values were chosen due to their significant impact on the overall machining quality and efficiency. A total of 17 experimental groups were designed using the BBD method, ensuring a thorough exploration of the parameter space and enabling accurate modeling of the response surfaces. The results of these experiments are presented in Table 4.

3.2.2. Variance Analysis for RSM Model

An analysis of variance (ANOVA) was performed using Design-Expert software to assess the significance of the input process parameters on response values. The ANOVA results for ablation width are presented in Table 5. In the analysis, the p-value is calculated based on the F-distribution, serving as a key indicator of the model’s reliability. A p-value below 0.05 indicates that the model terms are statistically significant. In this case, a p-value of ≤0.0001 denotes a highly significant fit of the model. The Lack of Fit F-value of 0.14 suggests that the Lack of Fit is not significant relative to the pure error. The goodness of fit is supported by an R2 value of 0.9932 and an adjusted R2 of 0.9845, both of which are close to 1, reinforcing the robustness of the model. The Adequate precision measures the signal-to-noise ratio, and a value of 31.49 which exceeds the minimum threshold of 4, indicates a strong signal and confirms that the model is well-suited for navigating the design space.
The mathematical regression model of ablation width developed by Design-Expert is:
W A = 41.69 + 10.92 P 0.23 v + 0.39 N + 0.30 P v + 0.26 P N 0.19 v N 5.66 P 2 0.91 v 2 + 0.58 N 2
The results of ANOVA for ablation depth are presented in Table 6. In the regression model, a p-value of ≤0.0001 indicates a highly significant fit of the model. The Lack of Fit F-value of 3.67 suggests that the Lack of Fit is not significant relative to the pure error. The goodness of fit R2 is 0.9870 and the adjusted R2 is 0.9702, indicating that the model is robust. An Adequate Precision value of 25.84 reflects satisfactory predictability of the regression model.
The mathematical regression model of ablation depth is obtained as:
h A = 18.33 + 10.82 P 9.2 v + 8.75 N 5.23 P v + 4.86 P N 3.97 v N 2.66 P 2 + 4.12 v 2 + 0.84 N 2
Table 7 presents the ANOVA results for surface roughness Ra. The model’s high significance is indicated by a p-value of ≤0.0001. The Lack of Fit F-value of 2.61 shows that the Lack of Fit is not significant when compared to the pure error. The model’s robustness is further evidenced by an R2 value of 0.9965 and an adjusted R2 of 0.9920. Furthermore, an Adequate Precision value of 45.82 suggests a satisfactory signal level, indicating that the regression model has strong predictive capability.
The mathematical regression model of surface roughness Ra is obtained as:
R a = 1.08 + 0.66 P 0.71 v + 0.65 N 0.4 P v + 0.39 P N 0.36 v N 0.005 P 2 + 0.29 v 2 + 0.22 N 2

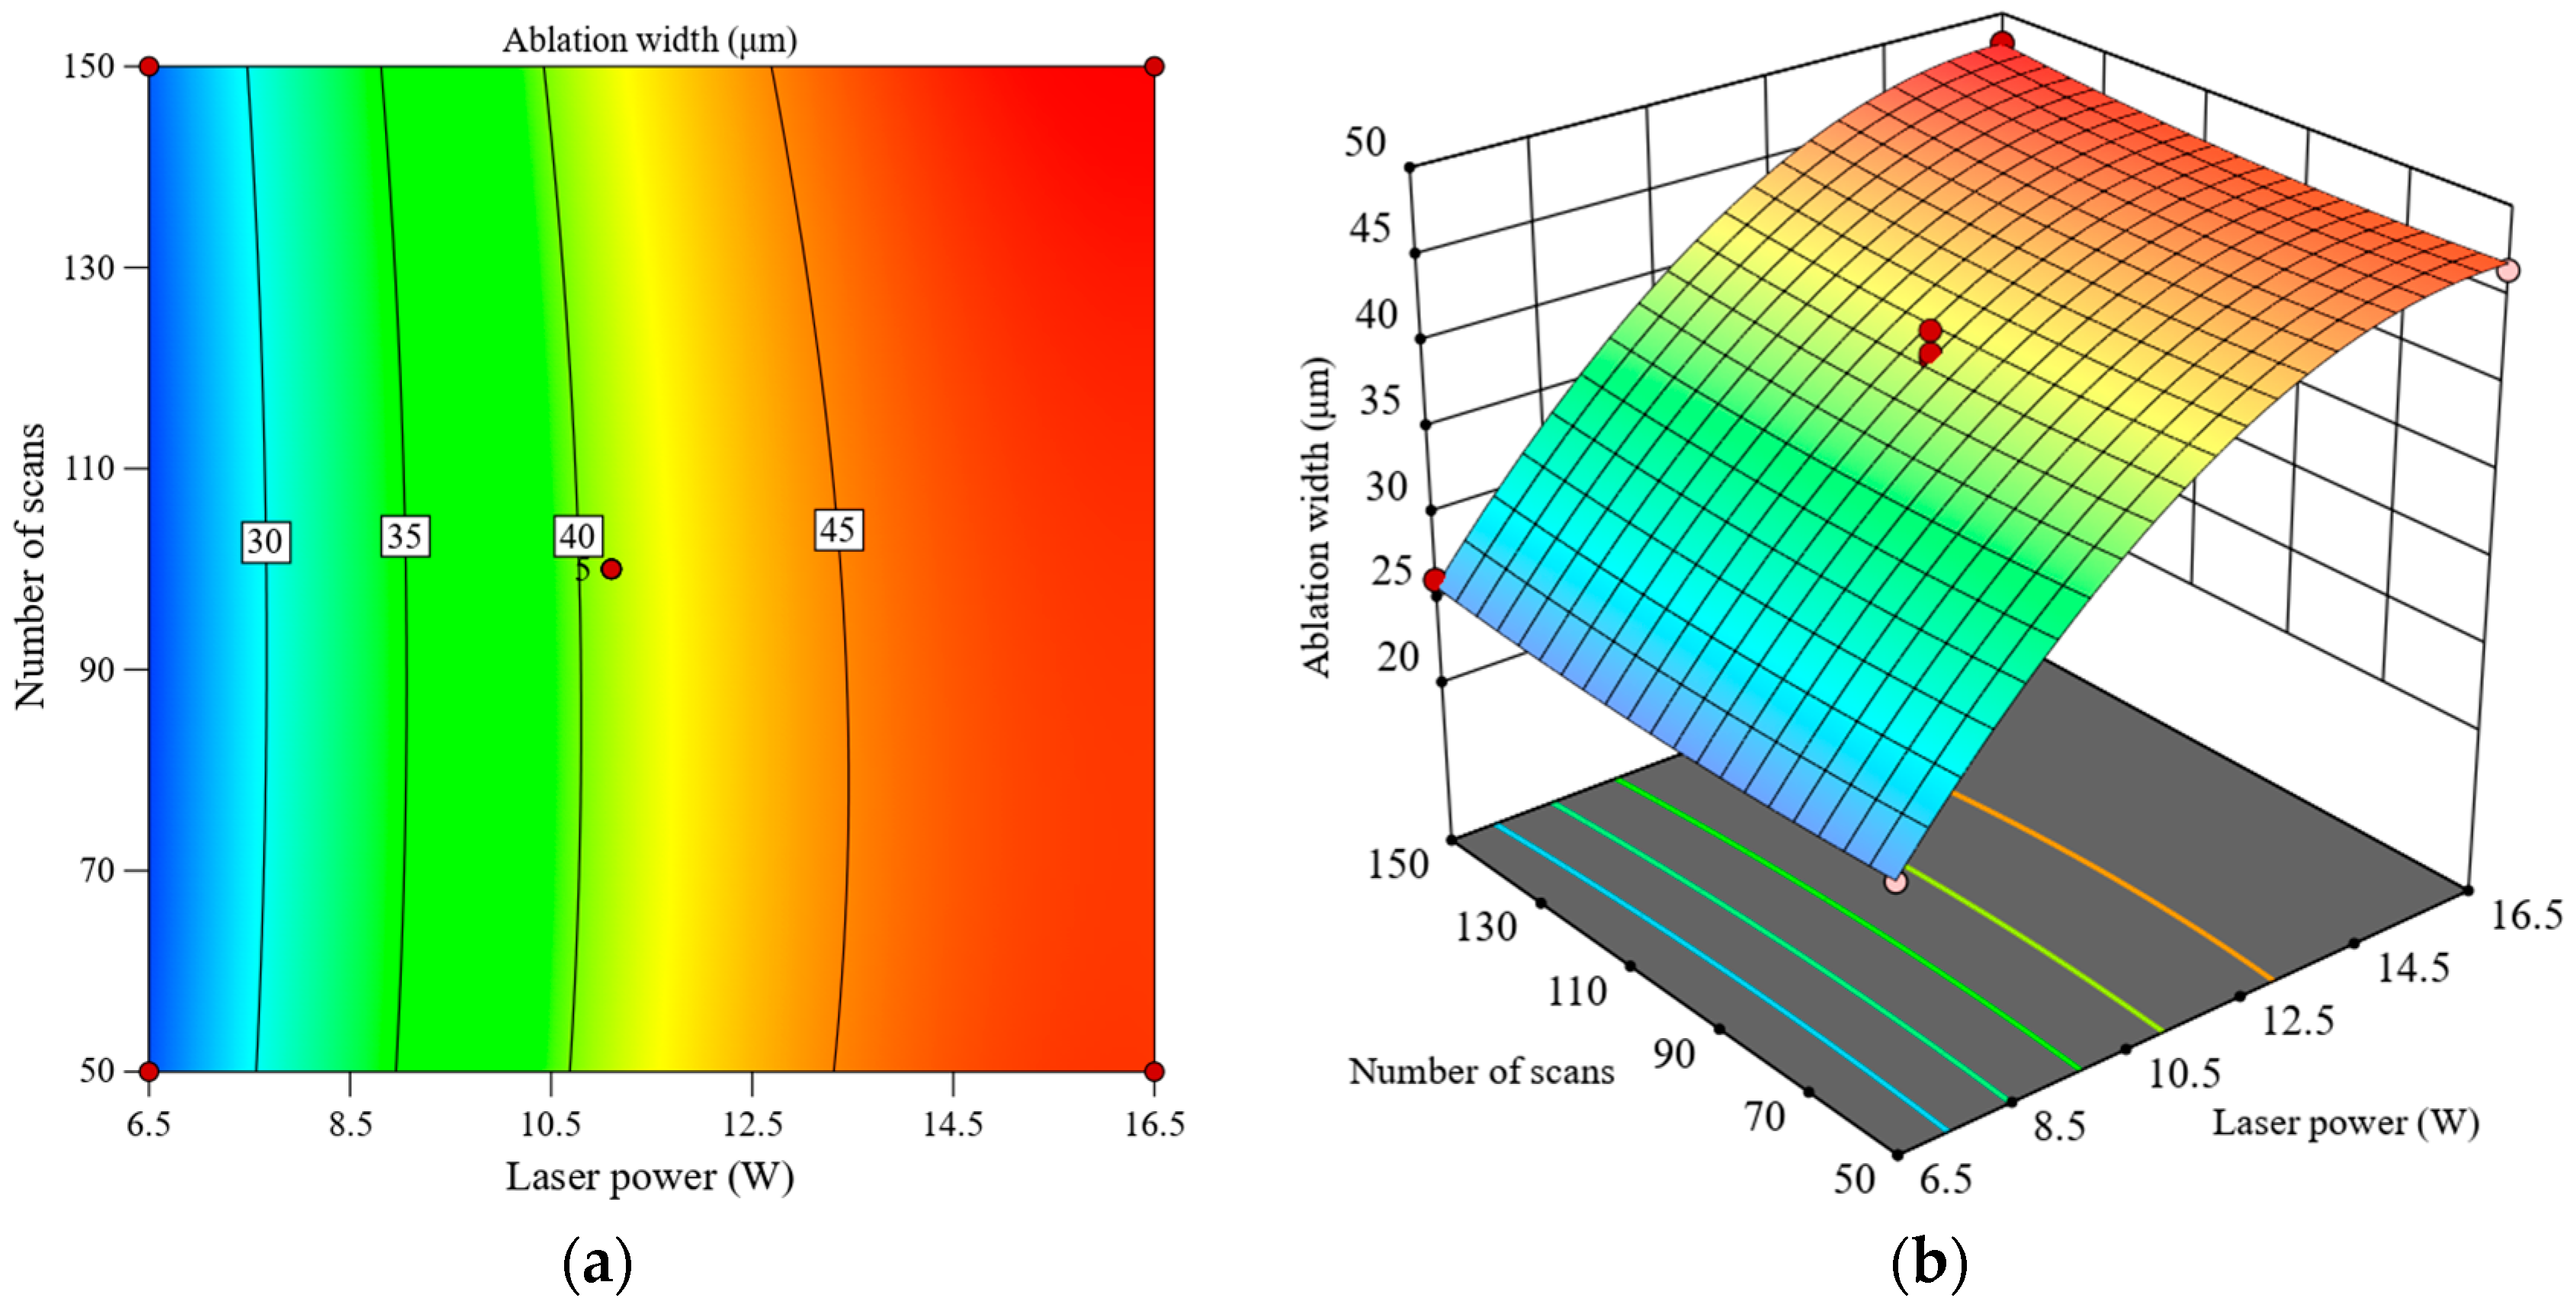
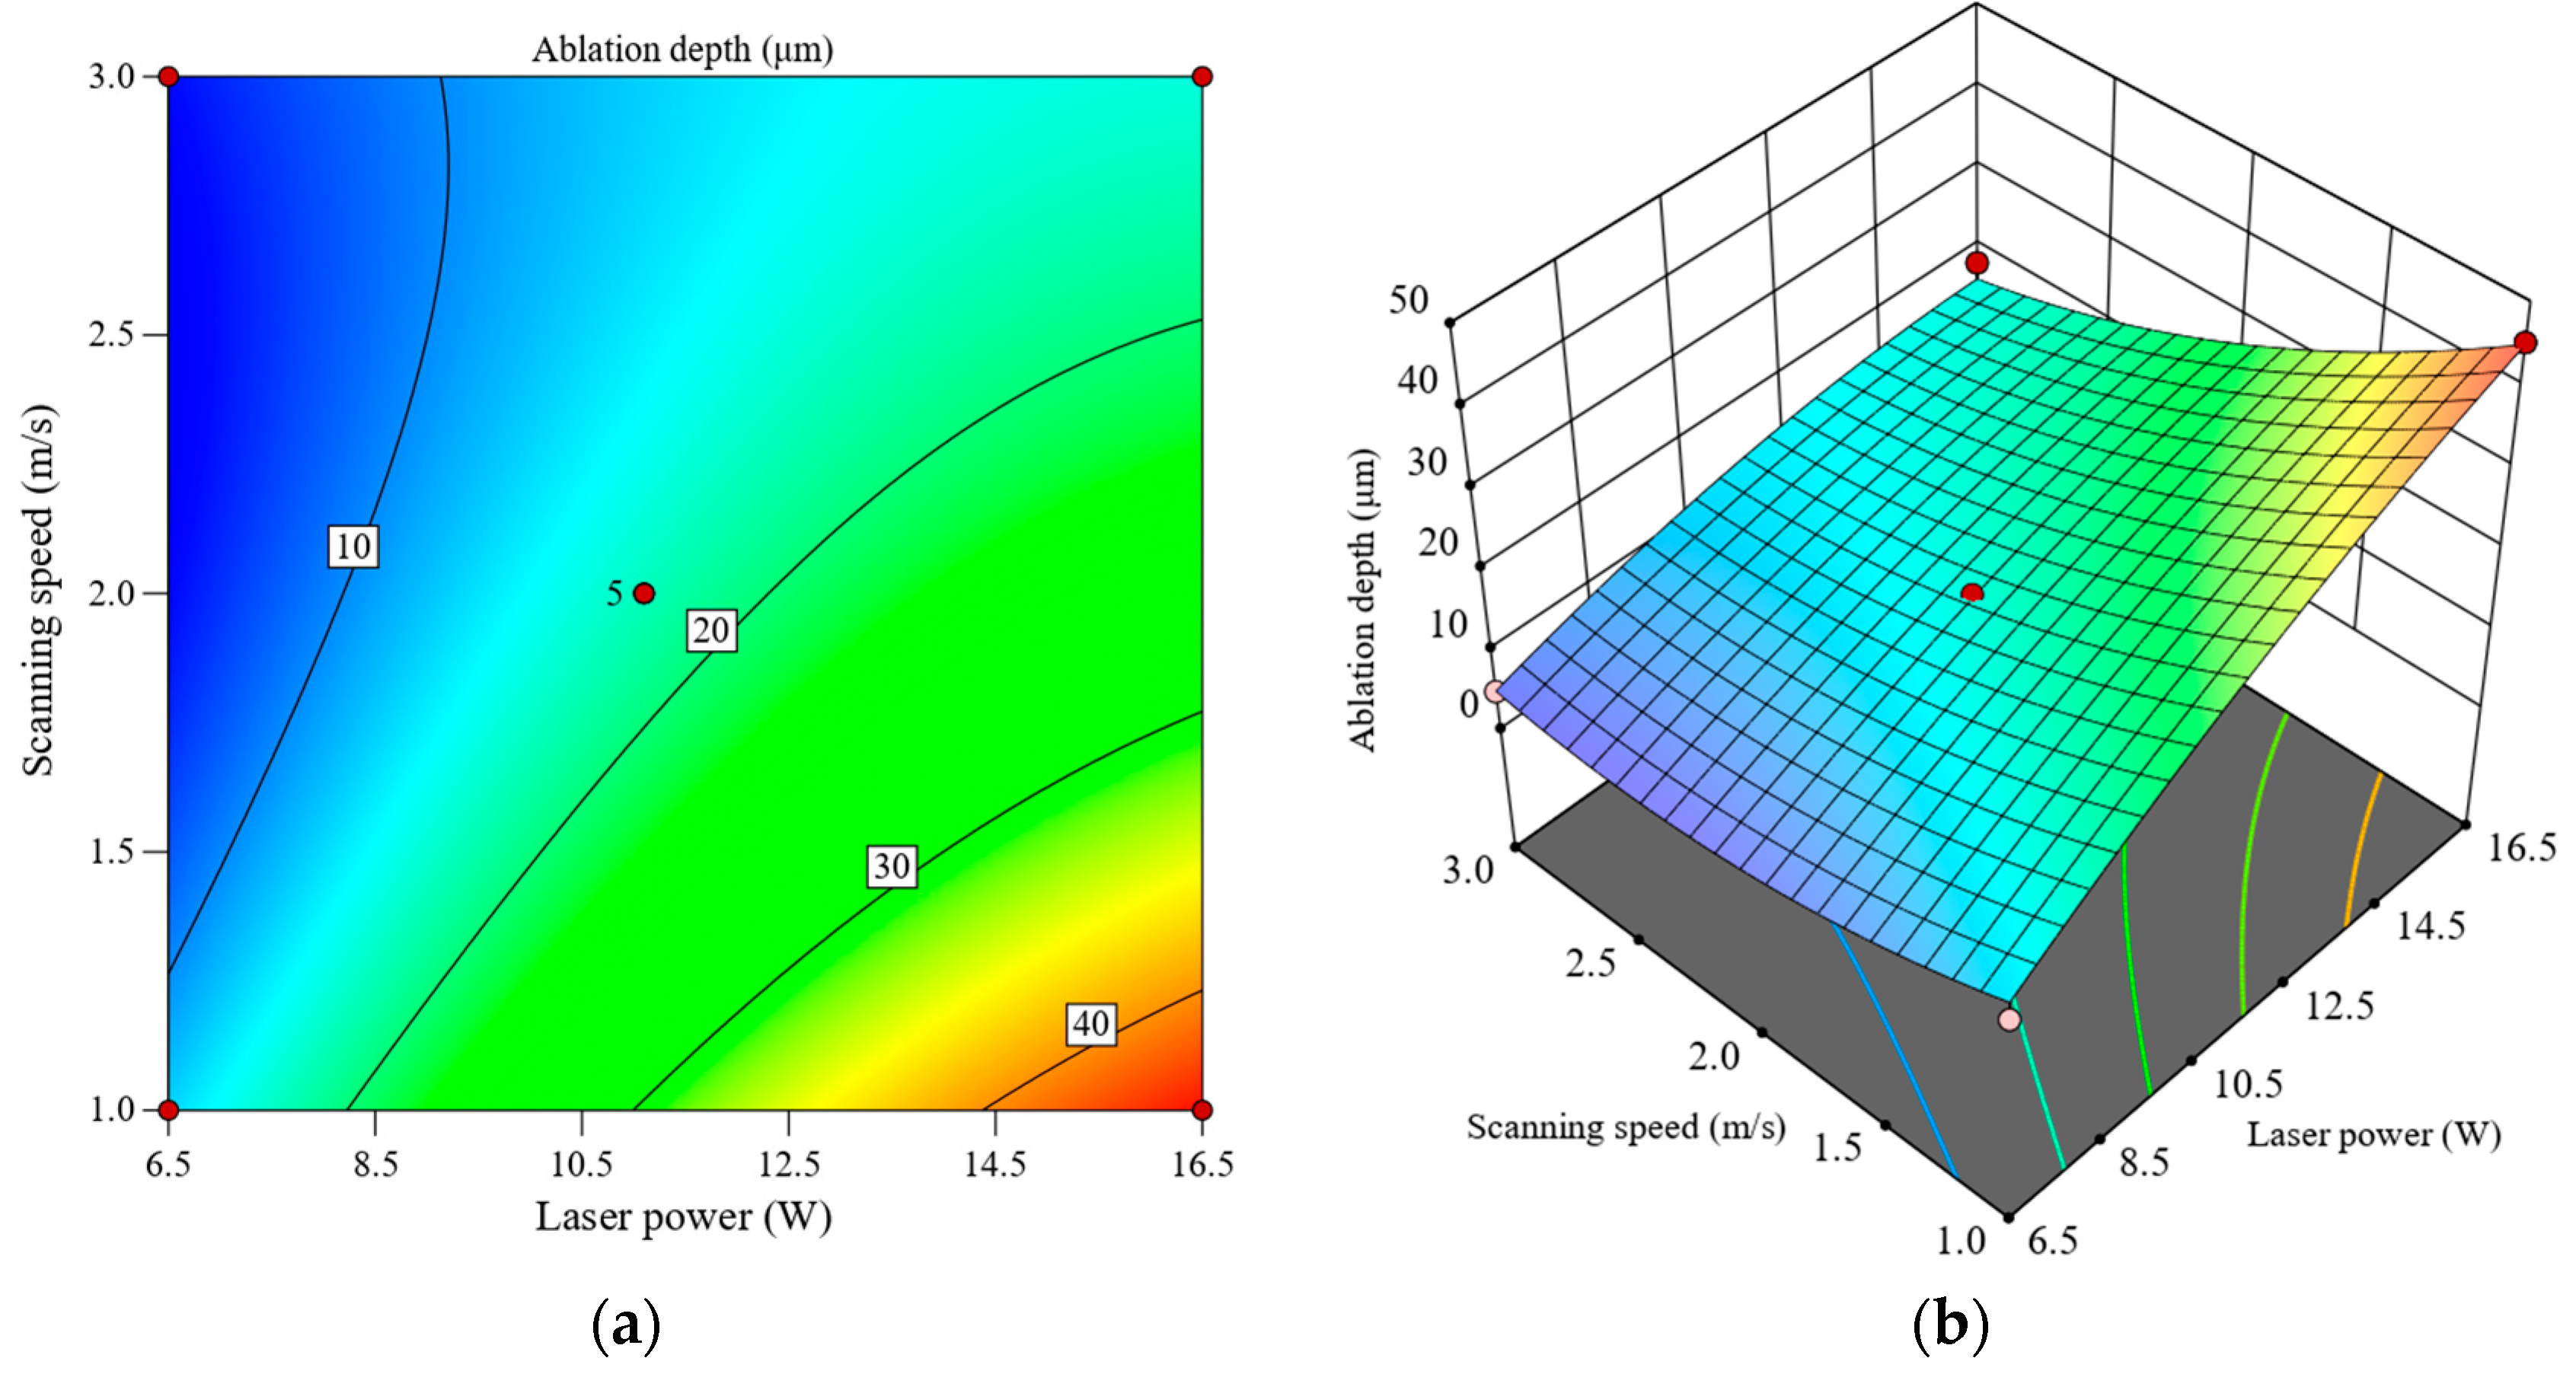
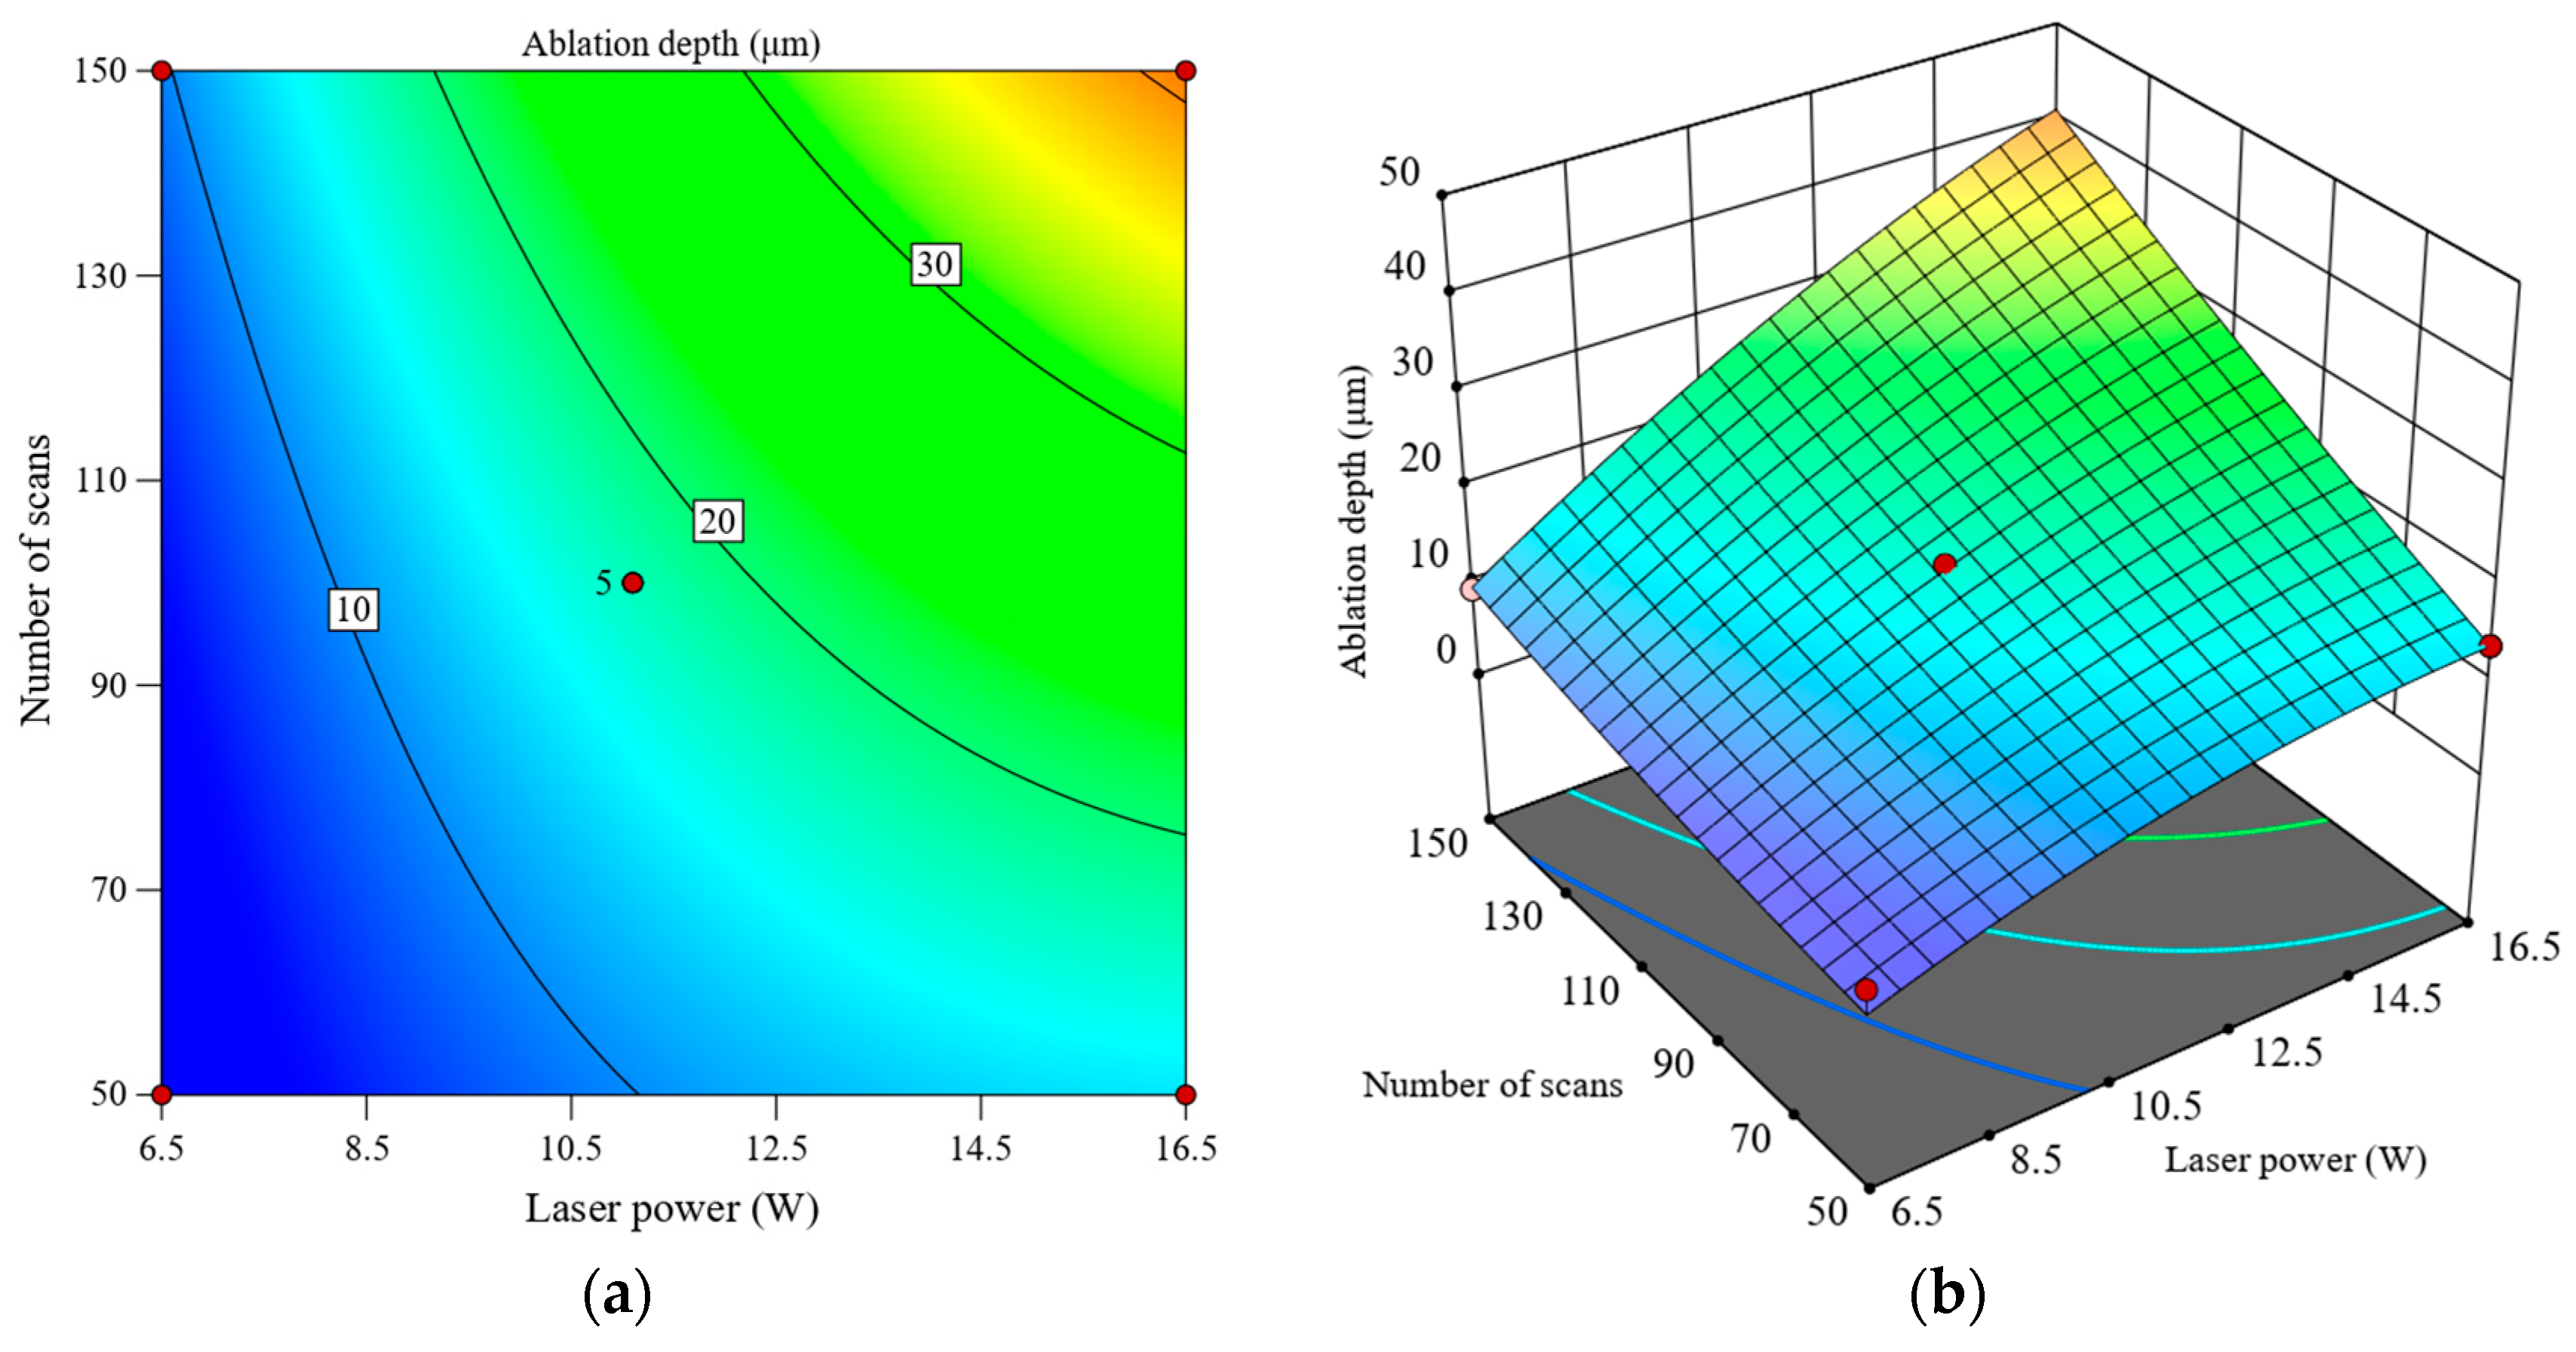
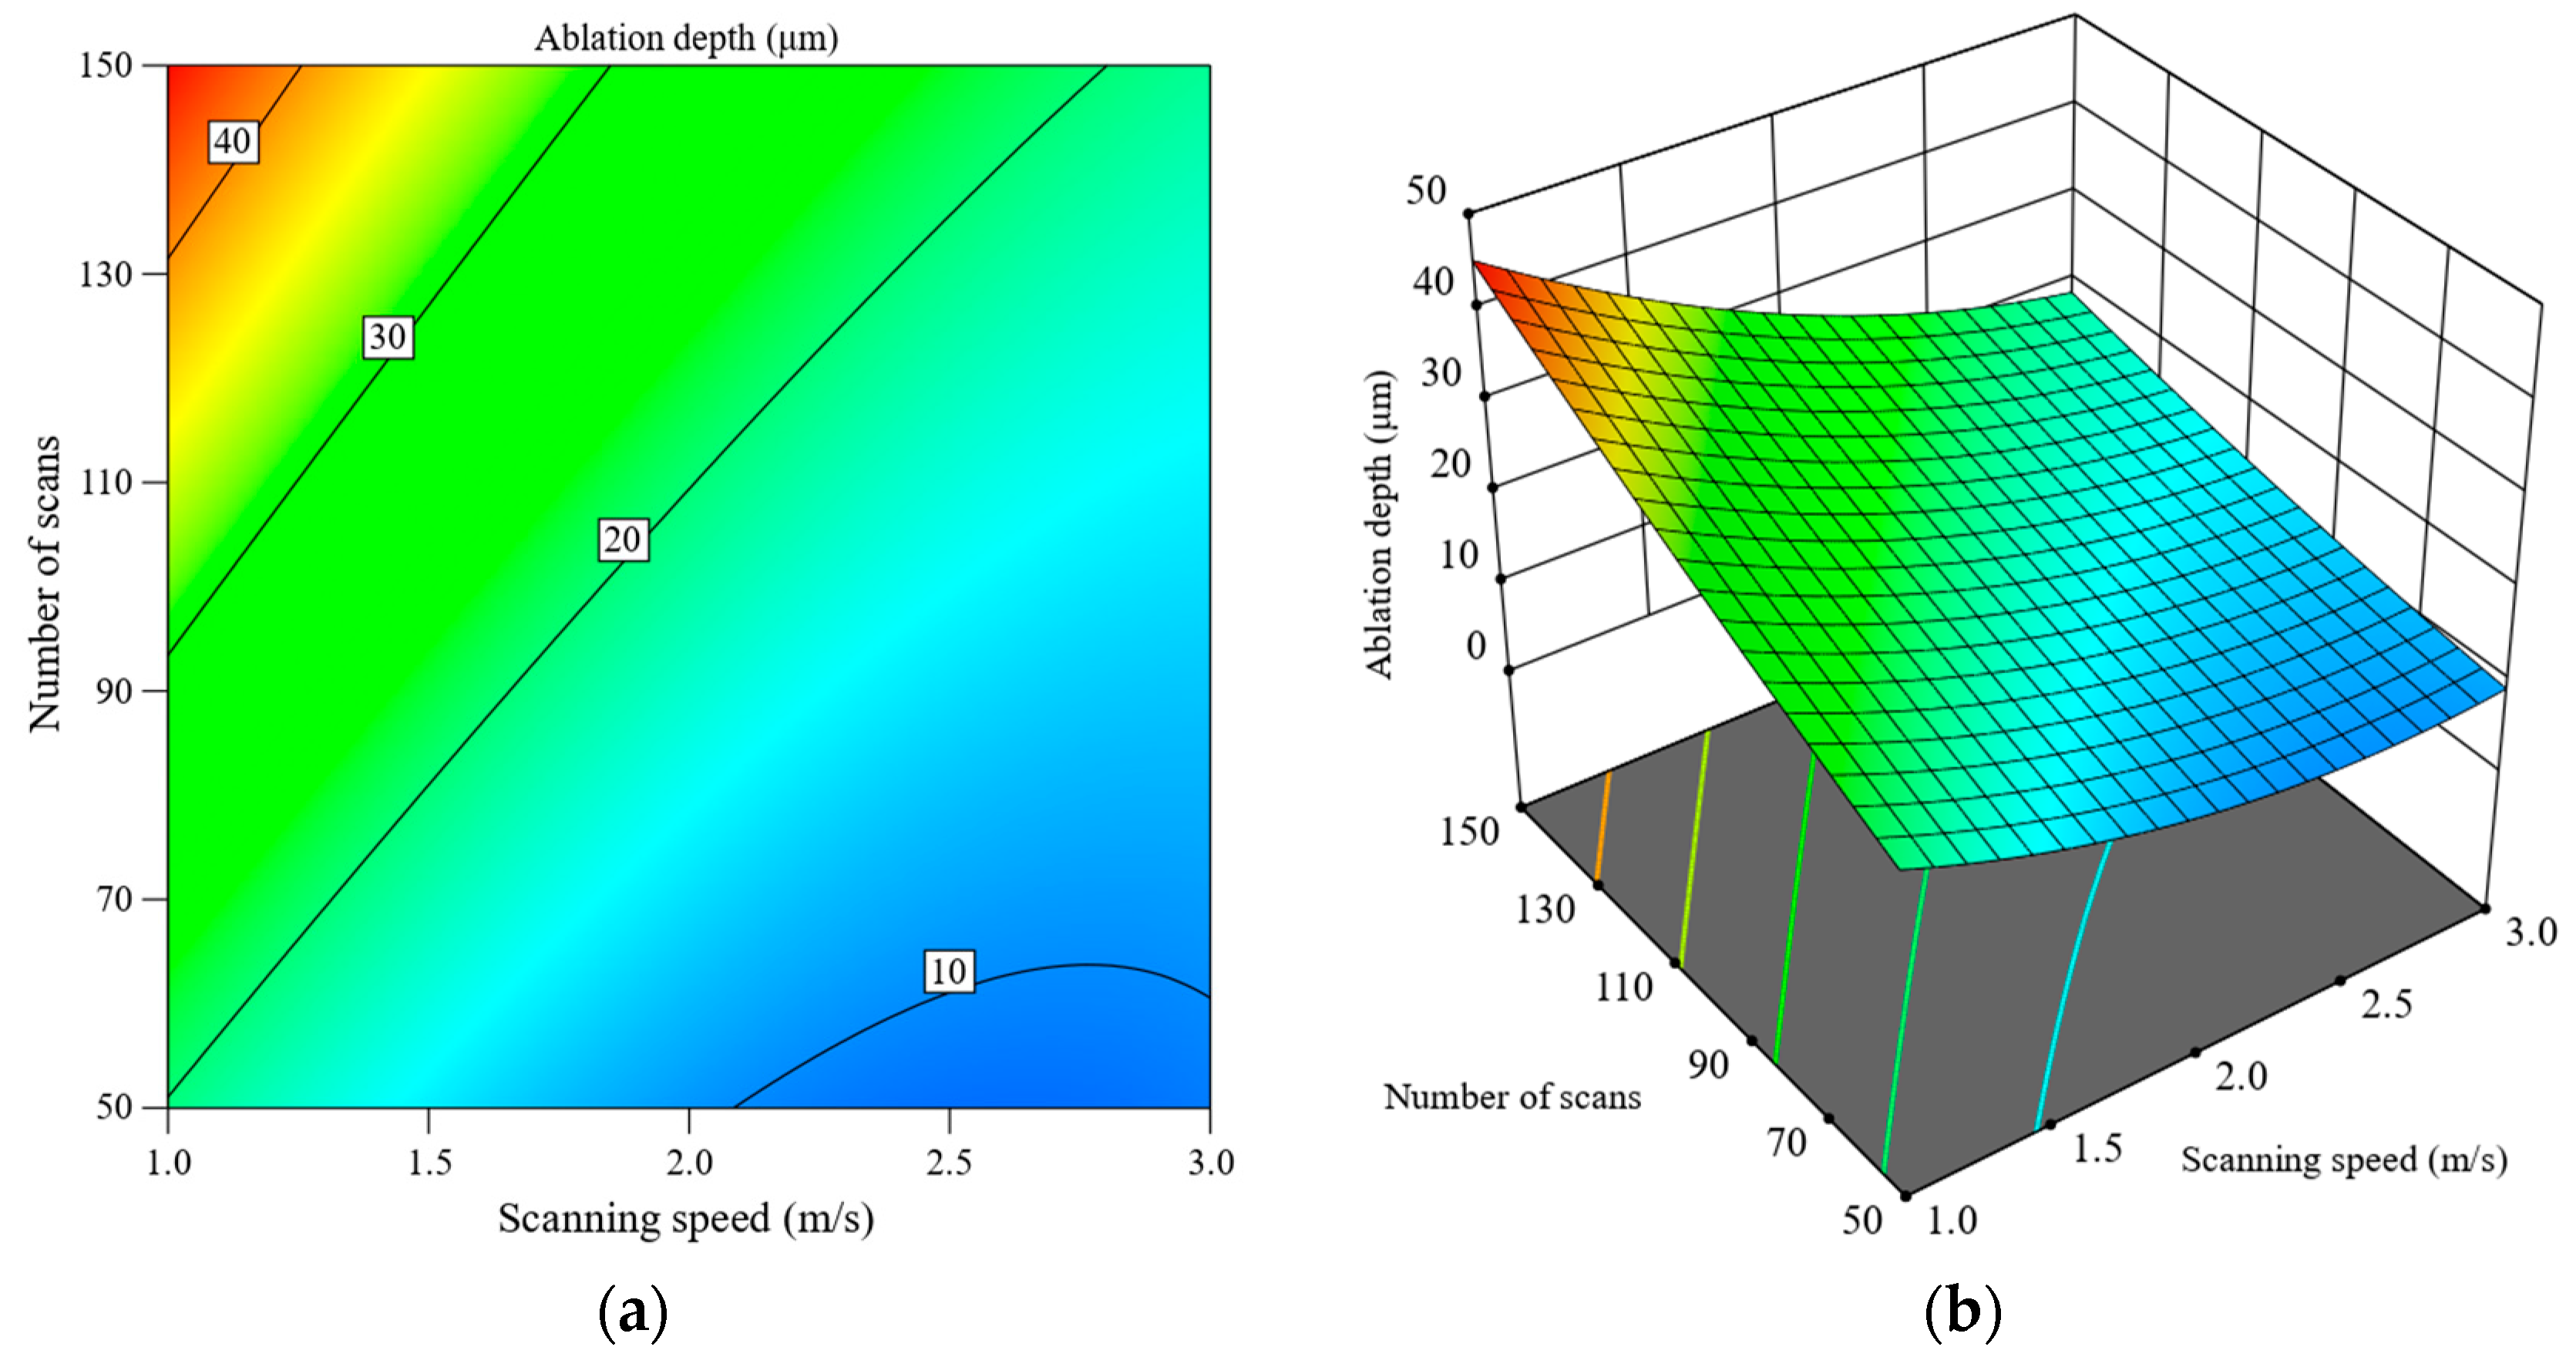
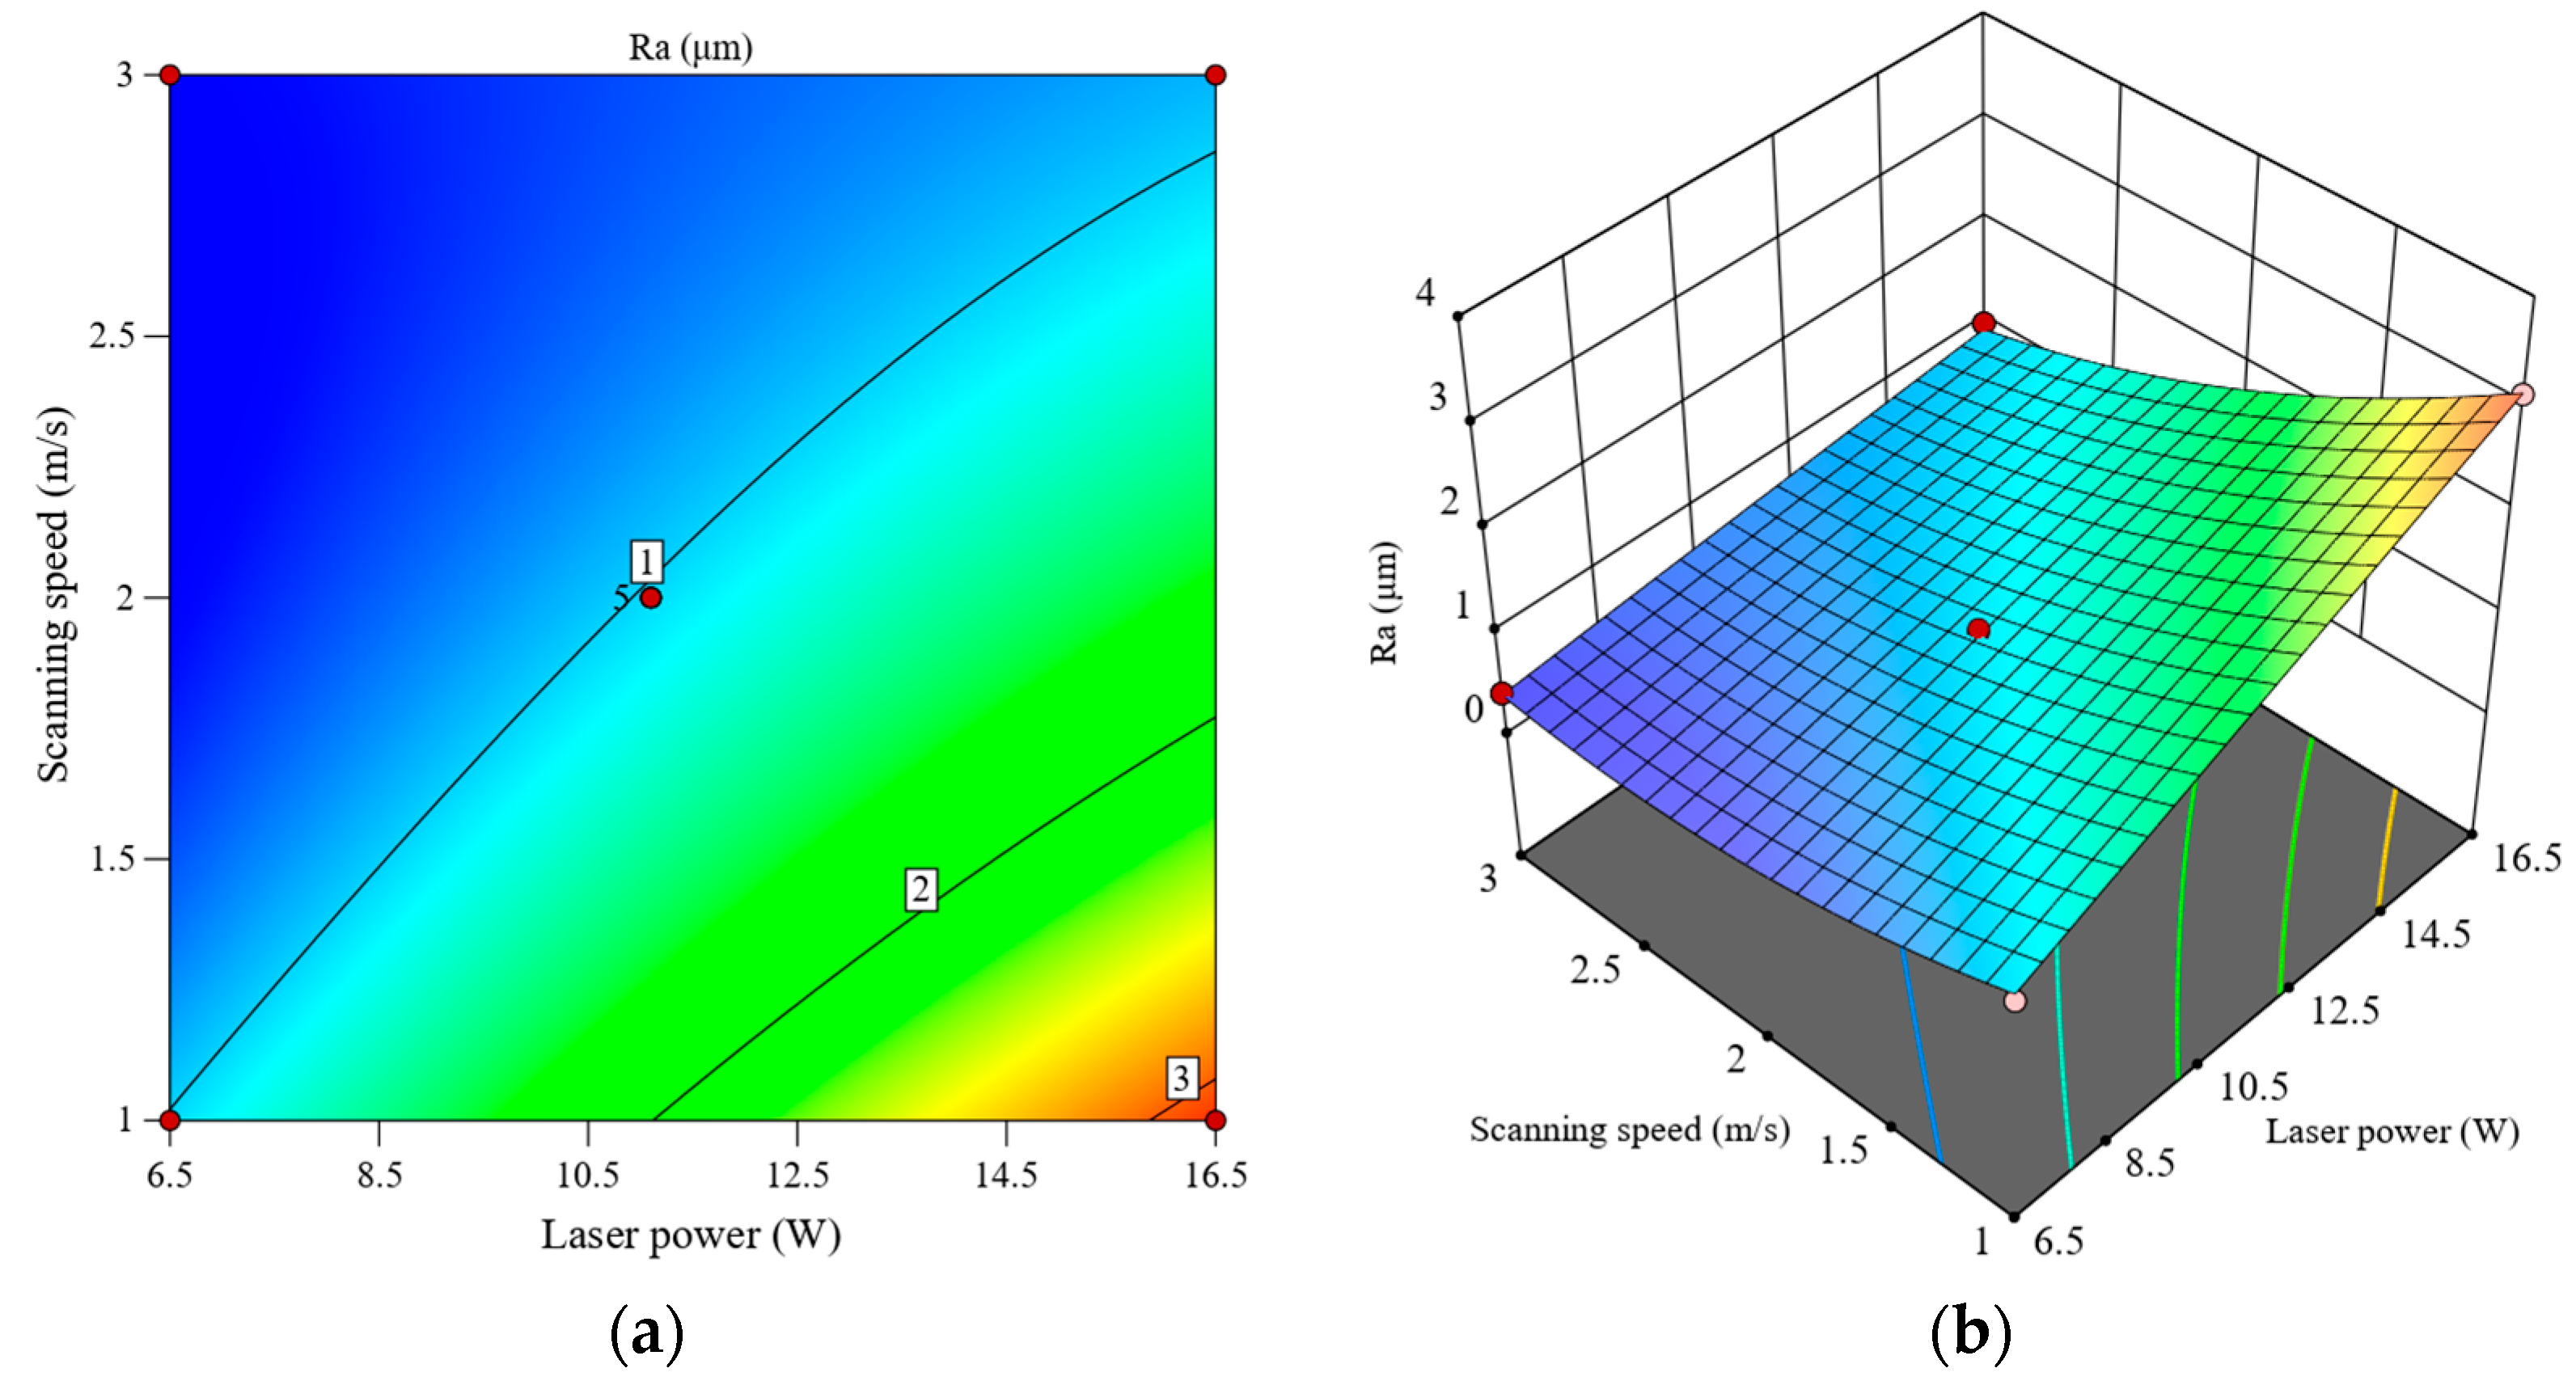
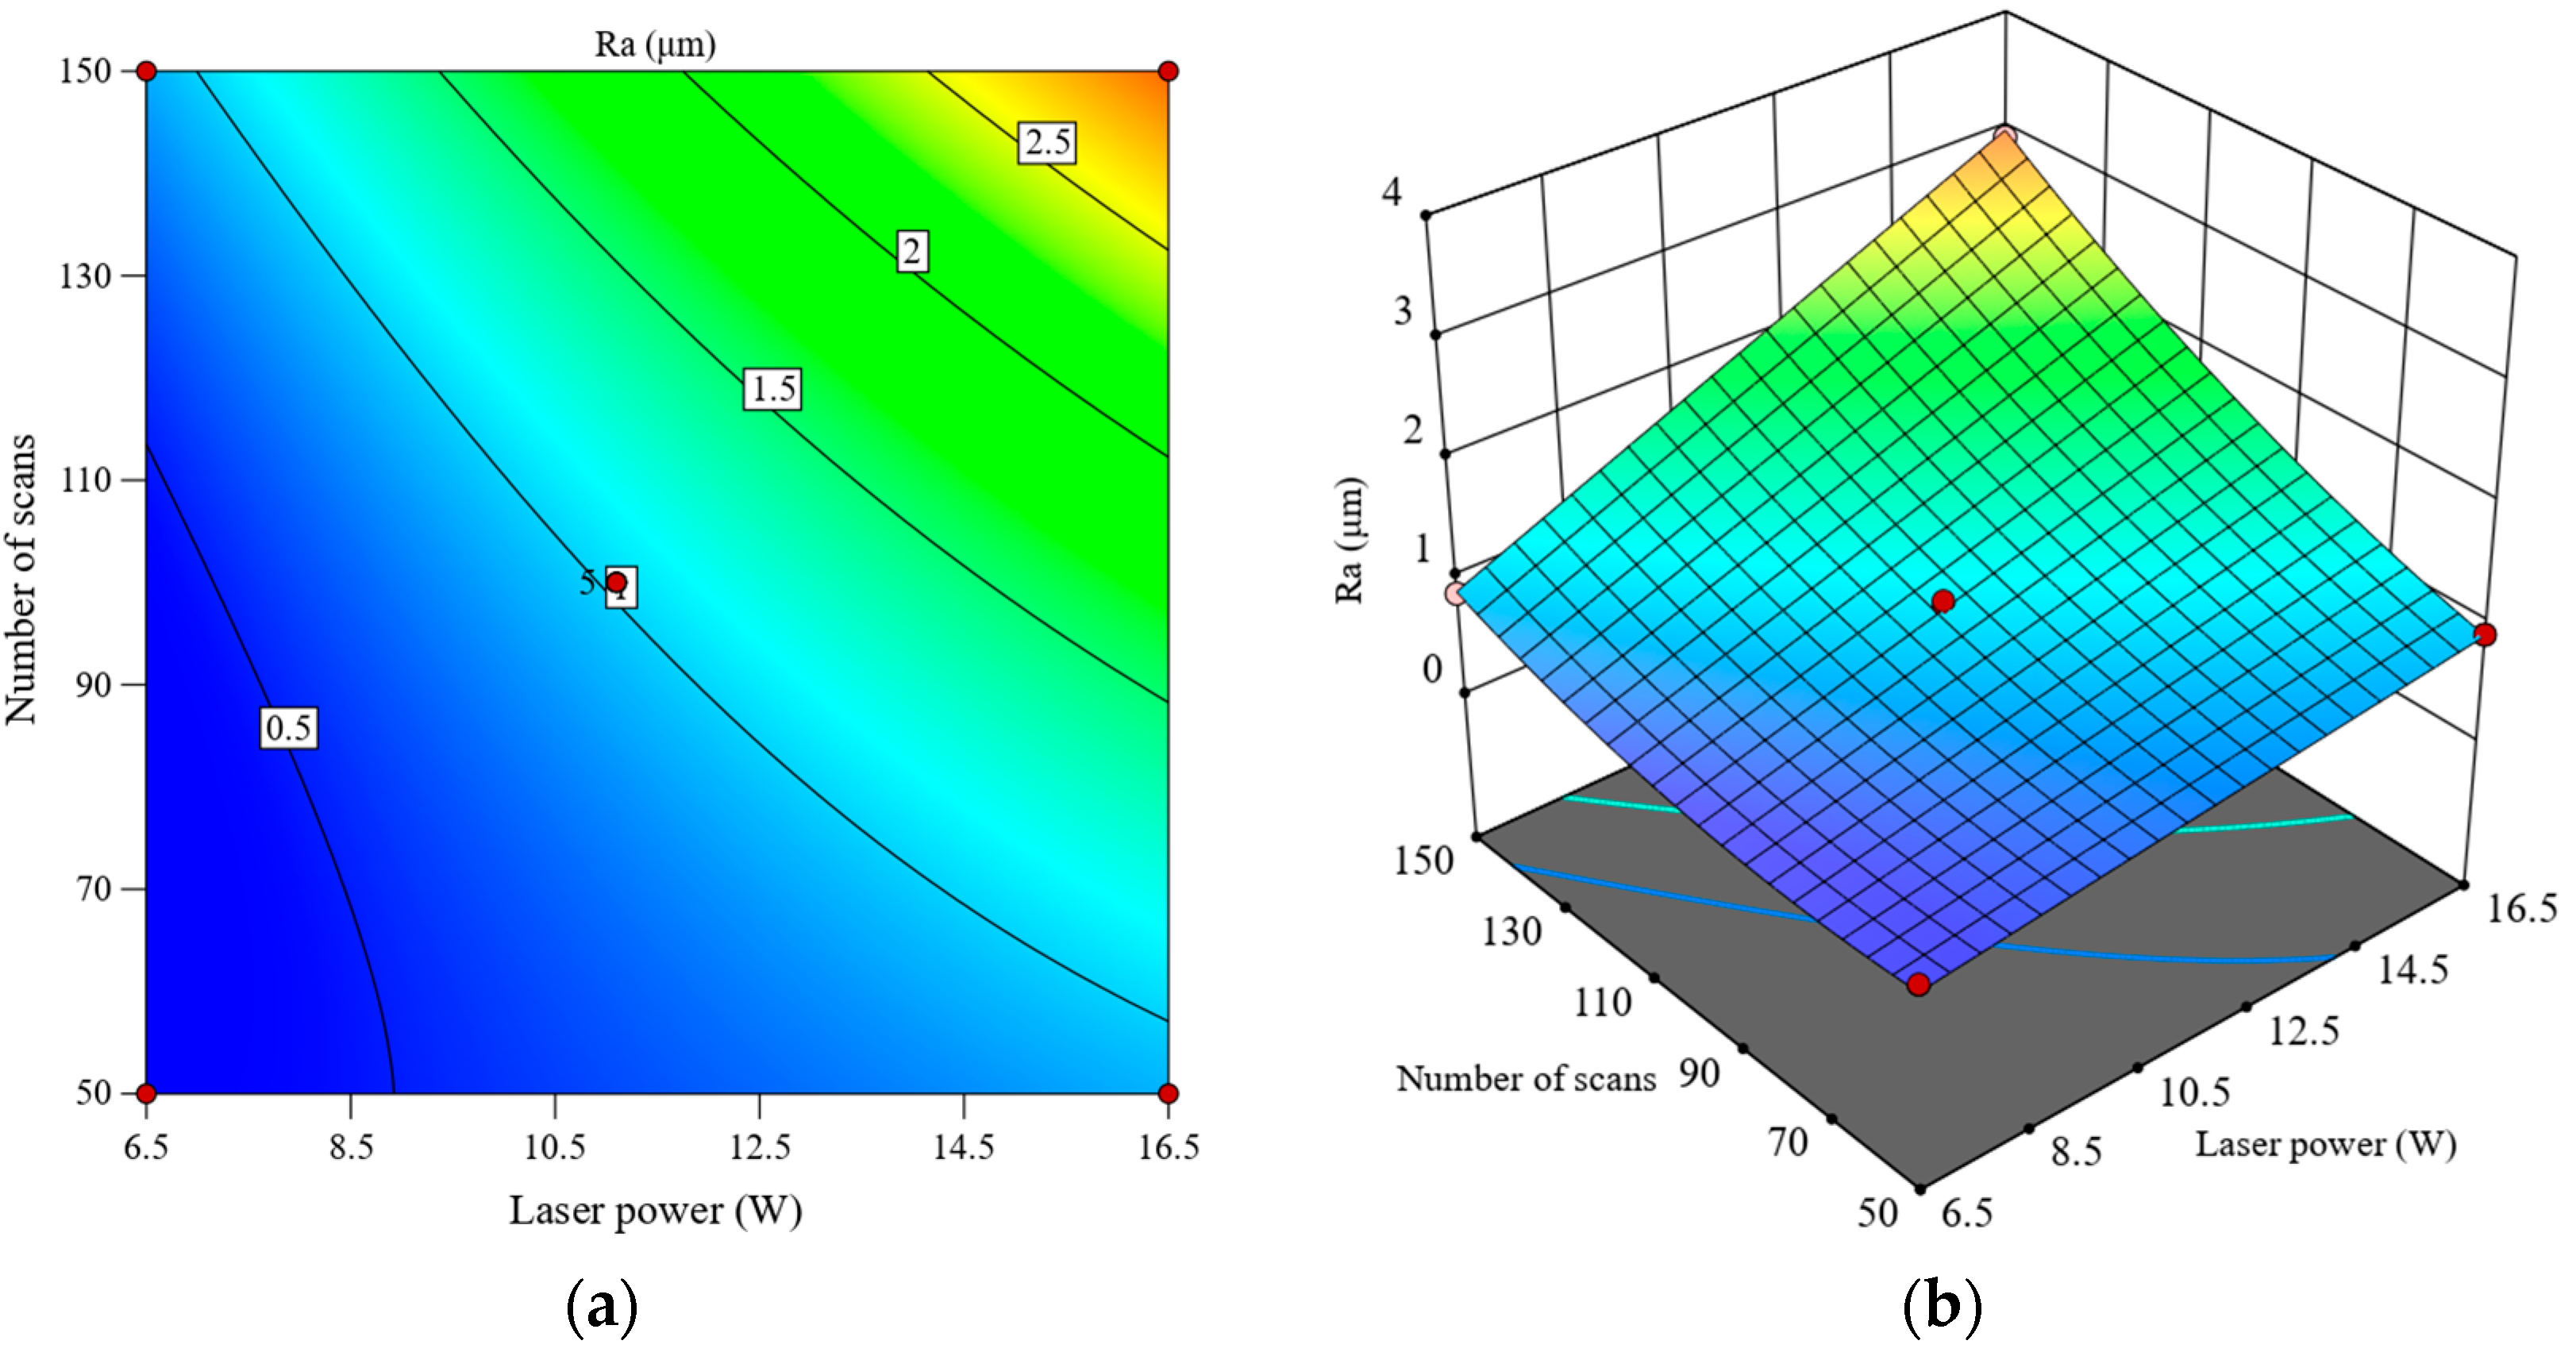
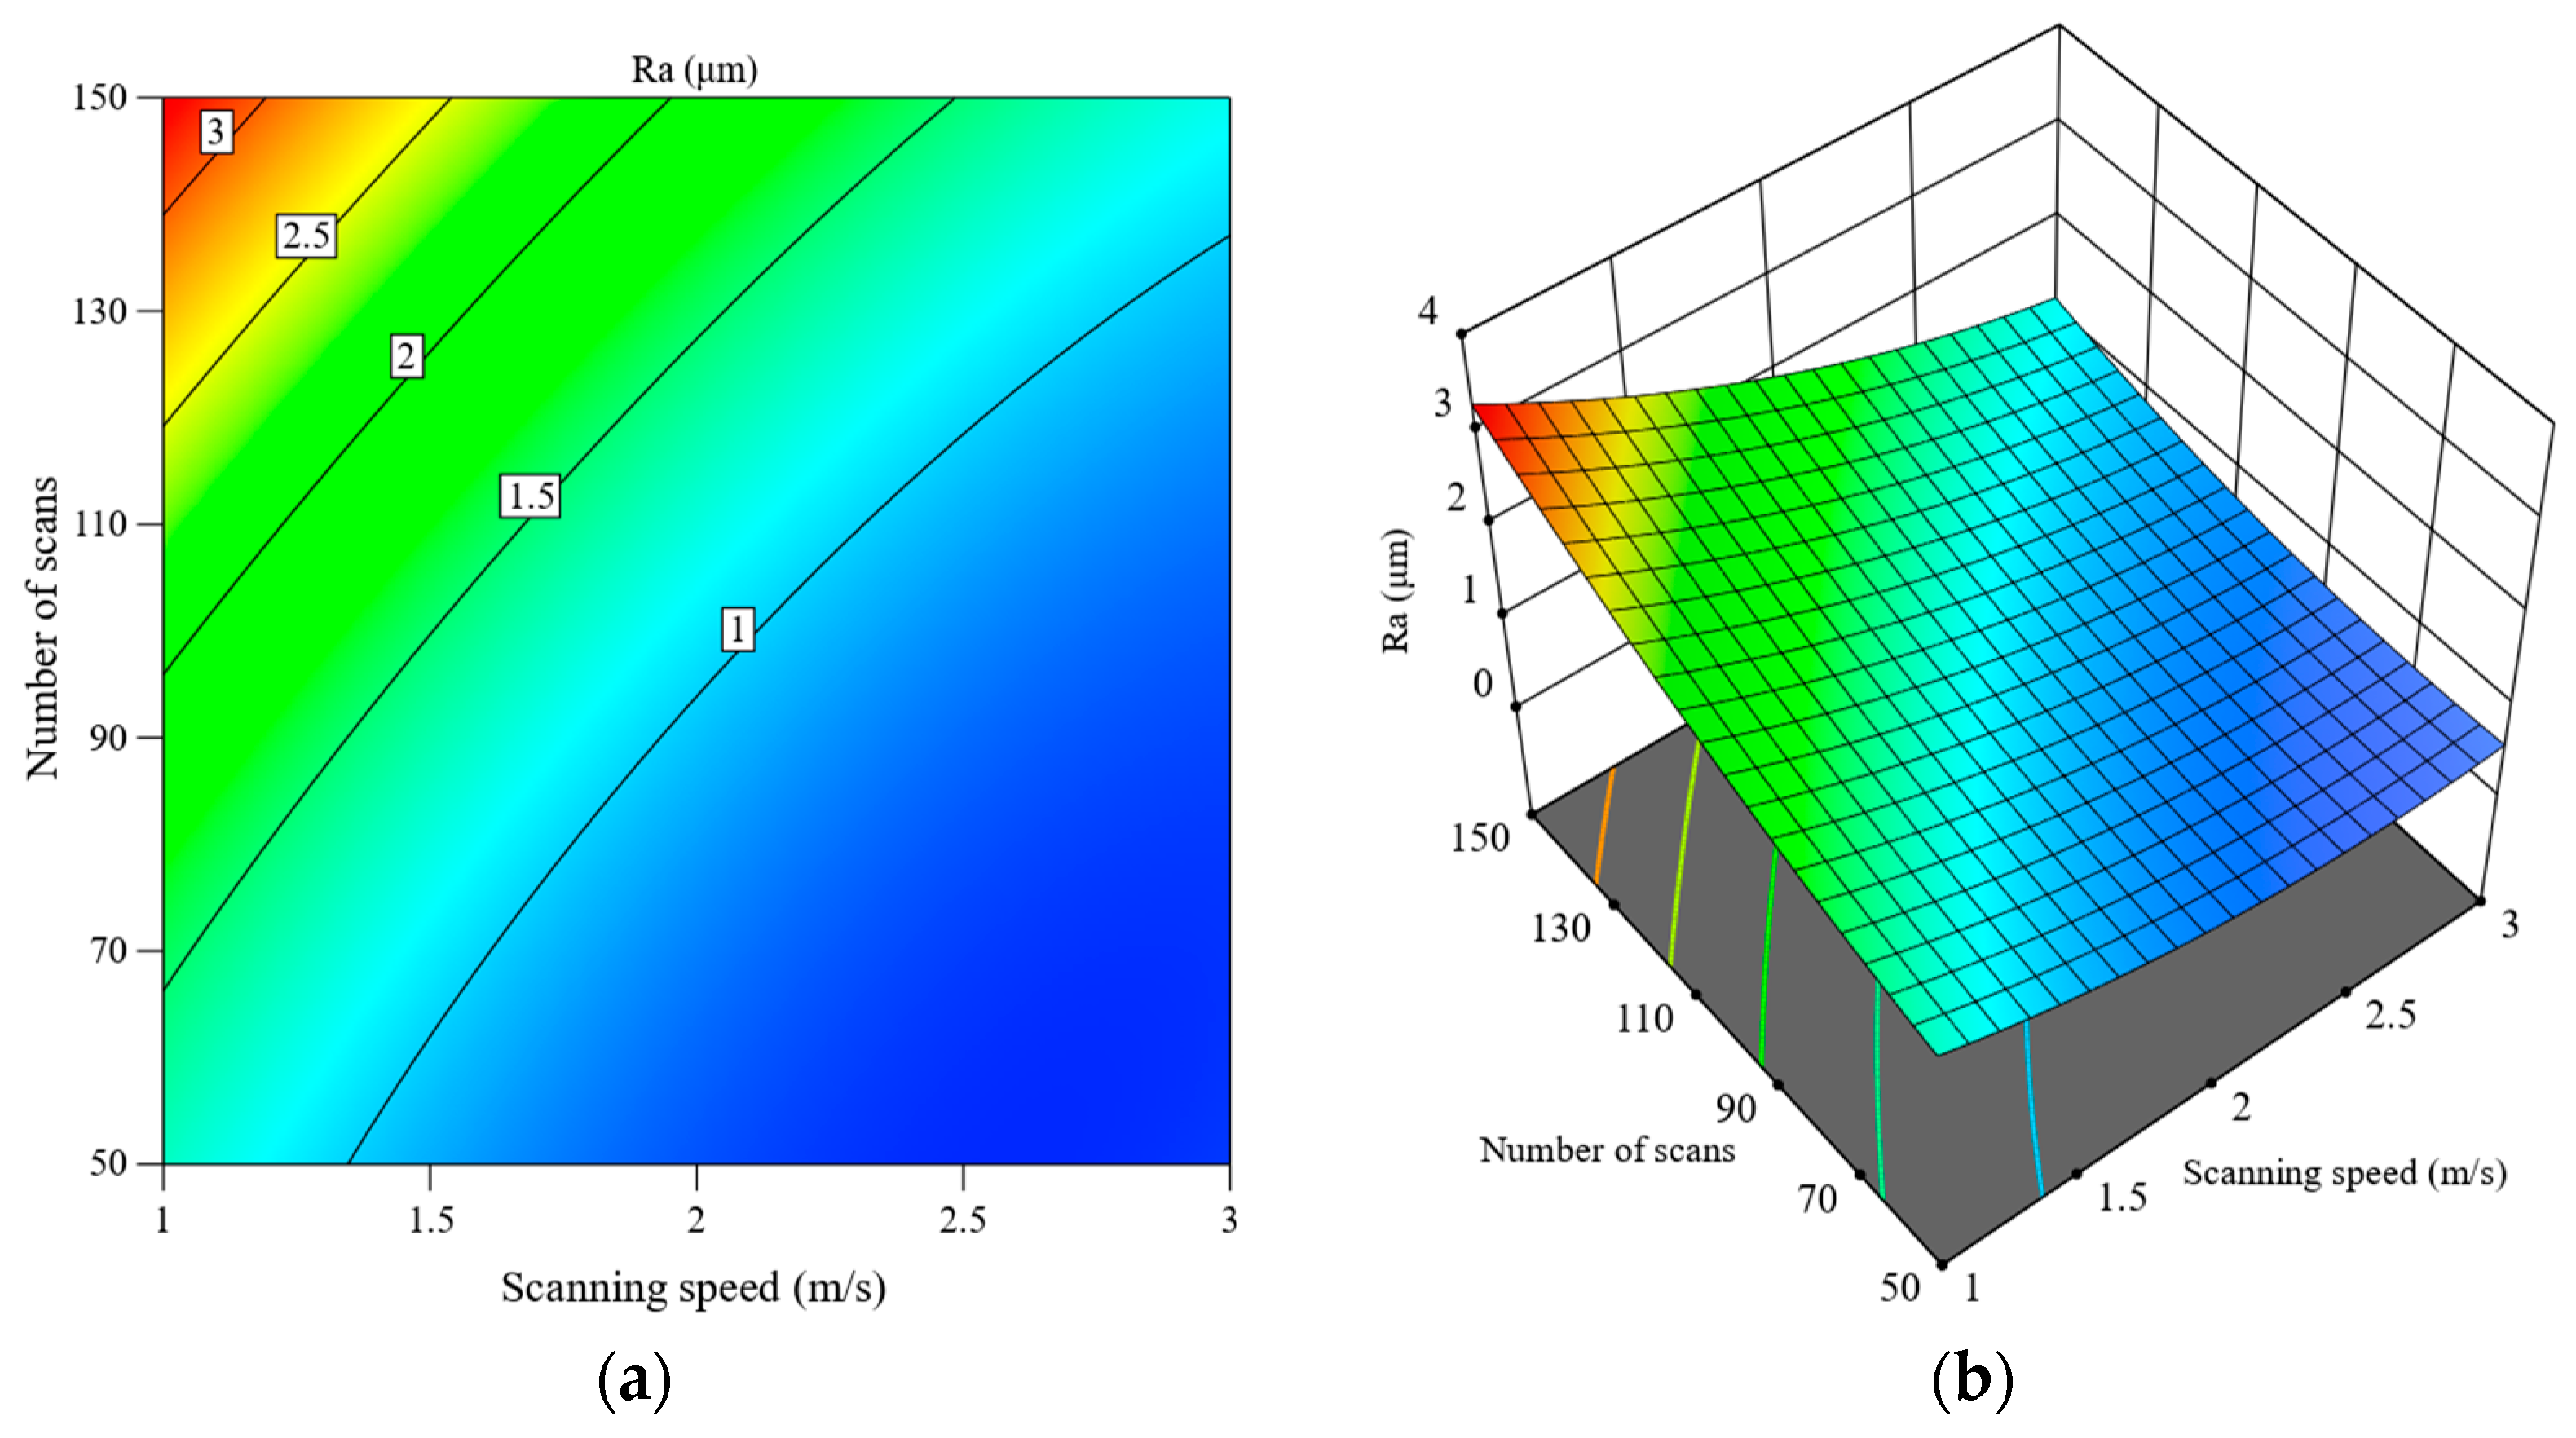
3.2.3. Interactive Effects Analysis of Process Parameters

The interactive effect of laser power and scanning speed on the ablation width in femtosecond laser machining of SCD is illustrated in Figure 7. It is evident that increasing laser power leads to a wider ablation width, while the variation in scanning speed has a relatively minor effect. This is because higher laser power increases the energy density, leading to more substantial material removal and consequently a broader ablation width. In contrast, variations in scanning speed do not significantly alter the effective range of the laser focus spot, which primarily determines the ablation width. Therefore, scanning speed has a less pronounced impact on ablation width compared to laser power.
Figure 8 shows the interactive effect of laser power and the number of scans on the ablation width in femtosecond laser machining. The ablation width is predominantly influenced by laser power rather than the number of scans. As laser power increases, the ablation width expands due to more extensive material removal. However, increasing the number of scans does not significantly affect the width of the microgrooves, as the effective range of the laser focus spot remains consistent despite repeated scanning.
Figure 9 illustrates the interactive effect of scanning speed and the number of scans on ablation width. The closely spaced contour lines with minimal variation indicate that changes in scanning speed and number of scans have little effect on ablation width. Therefore, it can be concluded that neither parameter significantly impacts the ablation width.
Figure 10 illustrates the significant interactive effects of laser power and scanning speed on the ablation depth in femtosecond laser machining of SCD material. Under conditions of low laser power and high scanning speed, the ablation depth decreases notably. This reduction occurs because the combination of low power and high scanning speed results in lower laser energy density and shorter irradiation time on the SCD surface, which prevents effective material removal and consequently reduces the ablation depth. Conversely, as the laser power increases and the scanning speed slows down, the ablation depth correspondingly increases.
The interactive effect of laser power and the number of scans on the ablation depth in femtosecond laser machining is depicted in Figure 11. When operating under conditions of low laser power and a minimal number of scans, the ablation depth decreases significantly. This reduction is primarily attributed to the limited cumulative laser energy delivered to the SCD material, as the combination of low power and fewer scans does not provide sufficient energy to achieve substantial material removal.
Figure 12 shows the interactive effect of laser scanning speed and the number of scans on the ablation depth in femtosecond laser machining. It can be observed that a lower scanning speed and a maximal number of scans yield a deeper ablation depth. In contrast, increasing the scanning speed and reducing the number of scans results in a shallower ablation depth.
Figure 13 depicts the interactive effect of laser power and scanning speed on the surface roughness in femtosecond laser machining. It can be observed that higher laser power, coupled with lower scanning speed, significantly increases the surface roughness. In contrast, as scanning speed is elevated and laser power reduced, surface roughness decreases, leading to a smoother finish.
The interactive effect of laser power and the number of scans on surface roughness is illustrated in Figure 14. The figure clearly shows that the combination of the highest laser power and the maximum number of scans produces the roughest surface. In contrast, lowering both laser power and the number of scans results in improved surface quality.
Figure 15 presents the interactive effect of scanning speed and the number of scans on surface roughness. The figure shows that a lower scanning speed combined with a higher number of scans tends to increase surface roughness, while higher scanning speeds paired with fewer scans result in a smoother surface.

3.2.4. Model Validation and Parameters Optimization

Figure 16 illustrates the correlation between the predicted and actual values of ablation width, ablation depth, and Ra in the RSM models. The predicted outcomes generated by the RSM model show a strong alignment with the actual experimental results. To assess the accuracy of the RSM model, three sets of parameters were randomly selected from the experimental data for comparative validation tests, as detailed in Table 8. The validation results showed that the error between predicted and actual values was within 8%, indicating a high degree of consistency. This consistency confirms the RSM model’s effectiveness in accurately predicting both machining efficiency and quality during femtosecond laser machining of SCD.
The optimization of femtosecond laser machining process parameters was carried out. Within the specified range of process parameters, the optimization criteria focused on maximizing ablation width and depth while minimizing surface roughness. Considering the precision of the experimental equipment, the obtained parameters were rounded. The optimal combination of process parameters determined is as follows: a laser power of 14.7 W, a scanning speed of 2.77 m/s, and 117 scans. Using these parameters in the mathematical model, the predicted ablation width is 46.11 μm, the ablation depth is 20.03 μm, and the surface roughness is 1.17 μm. Subsequent femtosecond laser machining of SCD with these optimized parameters resulted in an actual ablation width of 45.48 μm, ablation depth of 20.71 μm, and surface roughness of 1.10 μm, yielding errors of 1.39%, 3.28%, and 6.36%, respectively. These results demonstrate that the predicted values closely align with the experimental outcomes, confirming the effectiveness of the process parameters optimized through the RSM model.

4. Conclusions

In this study, the optimization of femtosecond laser machining process parameters for single crystal diamond, with the aim of maximizing ablation width and depth while minimizing surface roughness, was systematically conducted using response surface methodology. The key findings and conclusions are summarized as follows:
(1)
Increasing laser power initially results in greater ablation width and depth, but continued increases in laser power led to a deterioration in surface roughness. Higher scanning speeds reduce ablation depth and improve surface smoothness. Increasing the number of scans further deepens the microgrooves but can negatively impact the surface quality.
(2)
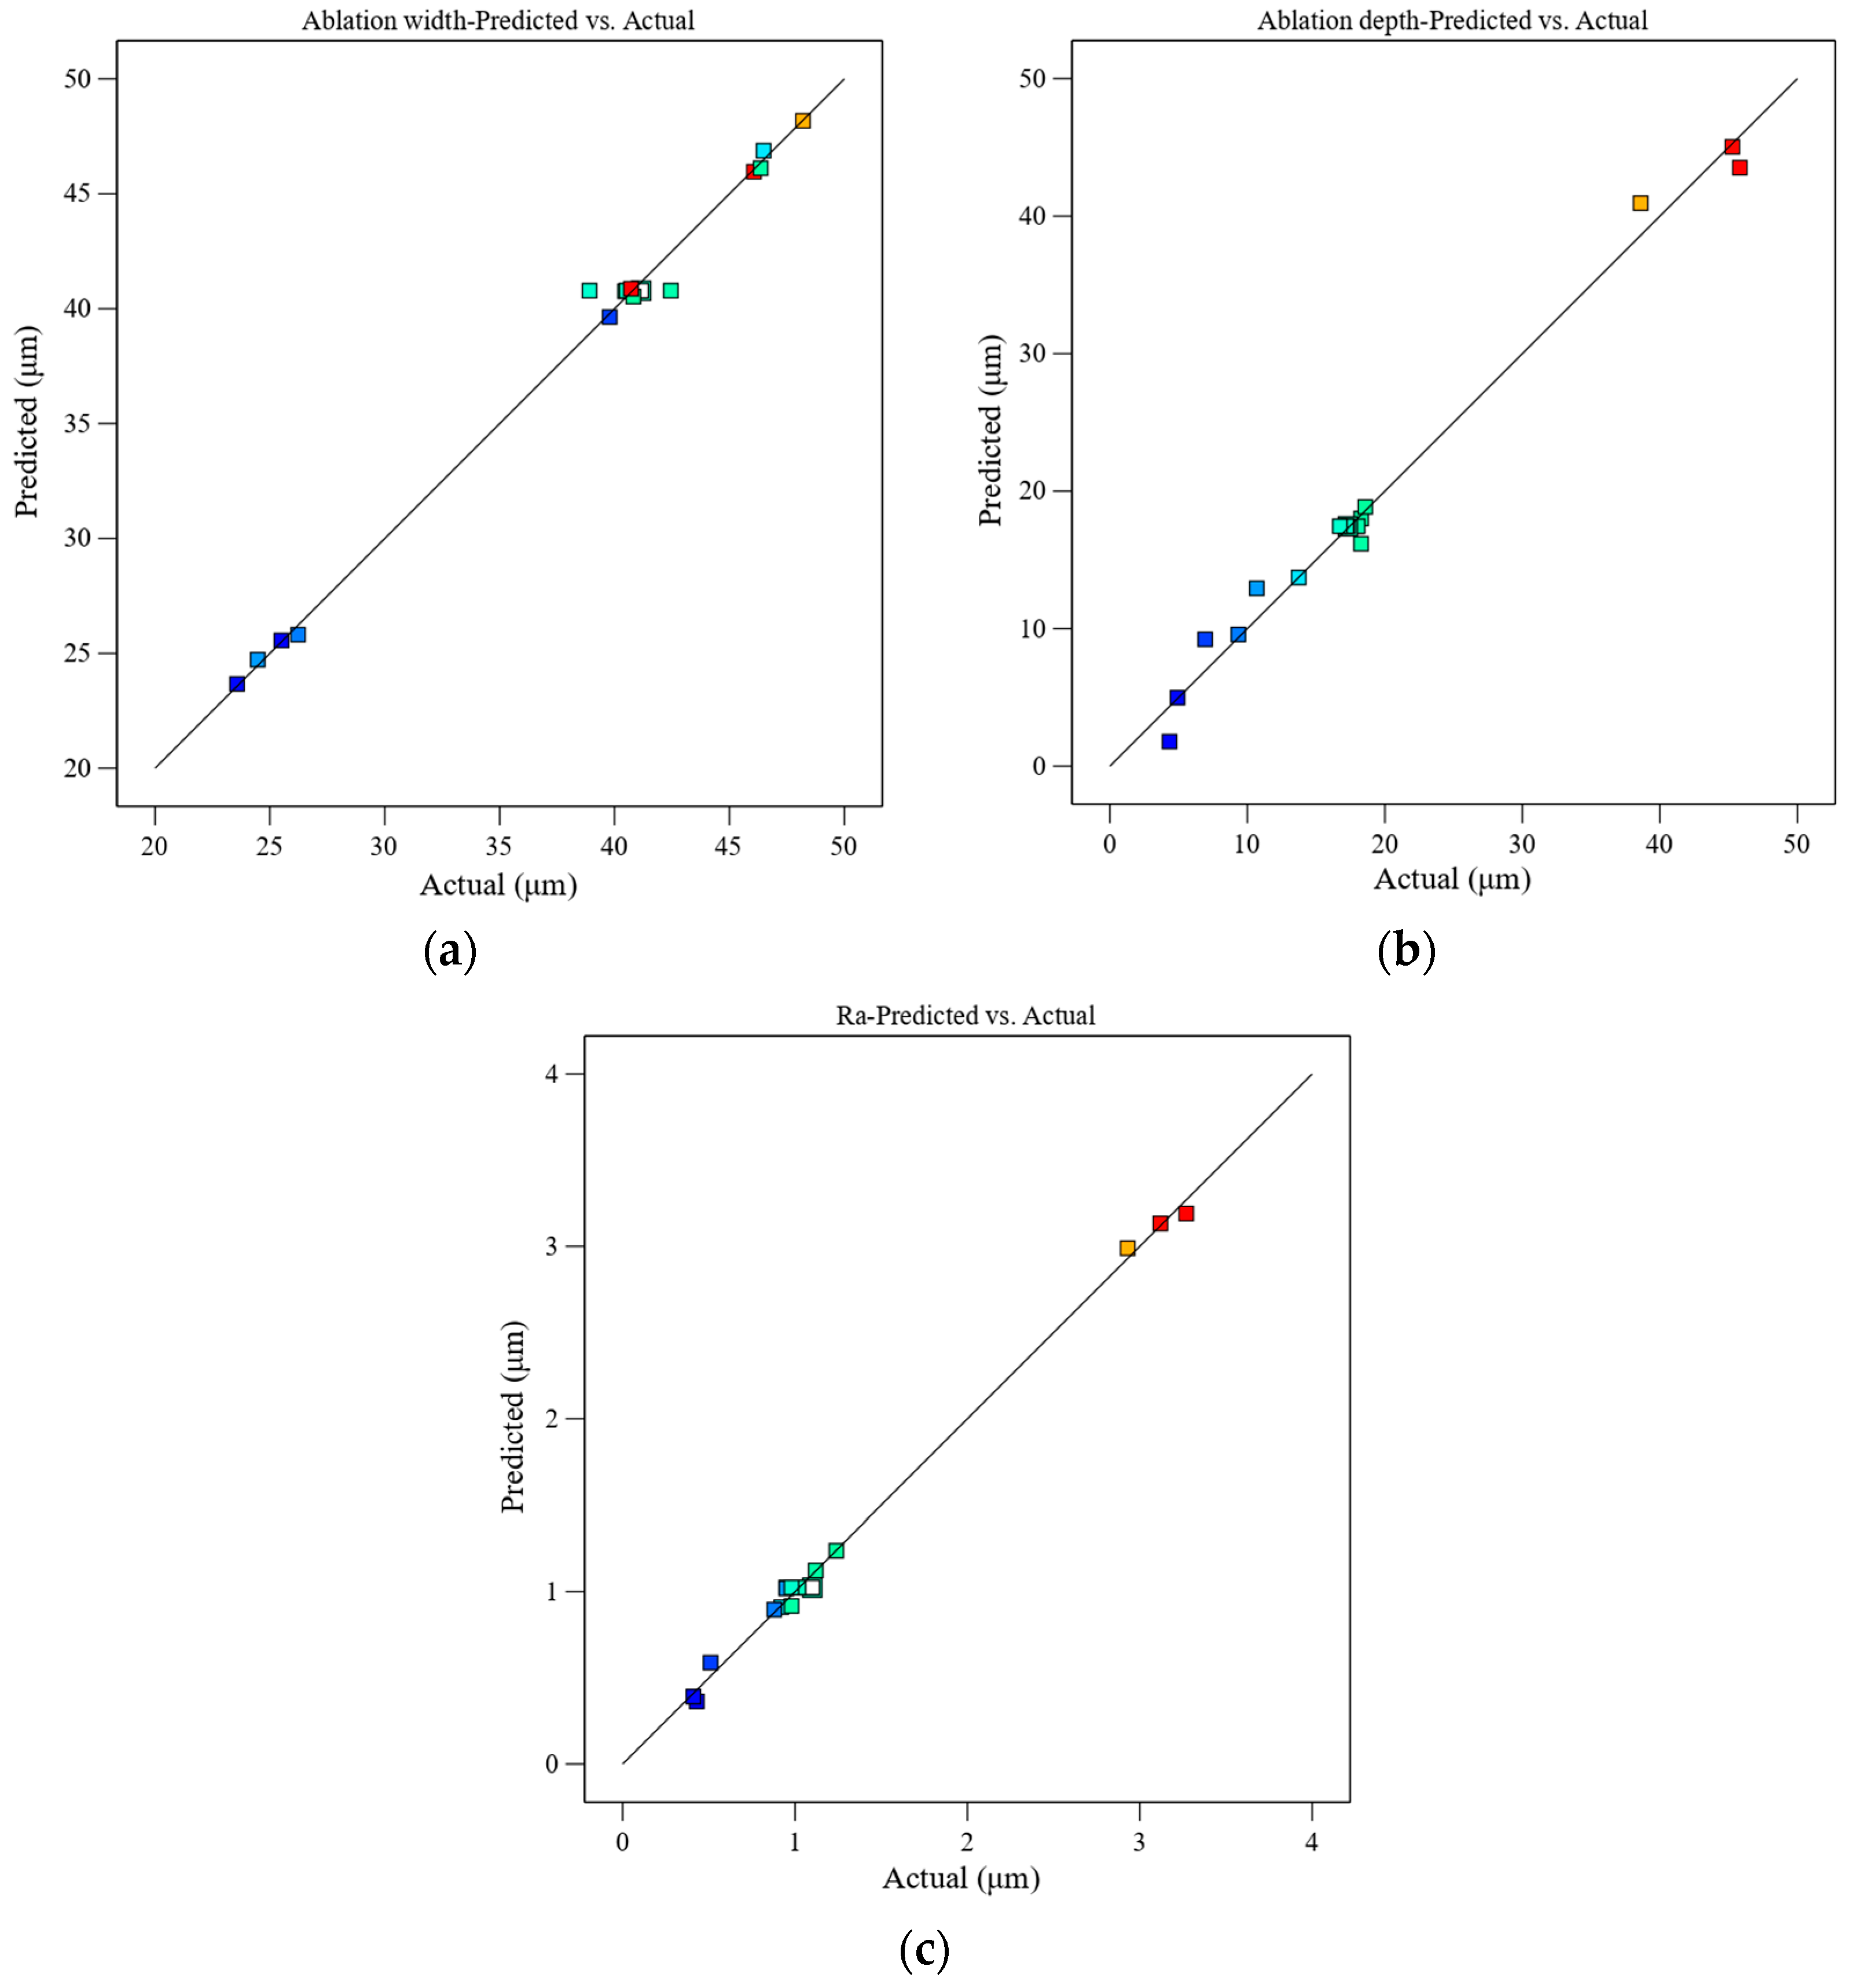
The ANOVA results confirm that the RSM model is statistically significant and provides reliable predictive capability for the responses. The interactive effects analysis, depicted through response surface and contour plots, revealed that laser power has a dominant influence on ablation width, whereas scanning speed and the number of scans play comparatively minor roles. However, both ablation width and surface roughness are significantly impacted by the combined interaction of these three parameters.
(3)
The optimal combination of parameters was determined to be a laser power of 14.7 W, a scanning speed of 2.77 m/s, and 117 scans. Using these optimized parameters, the actual results achieved were an ablation width of 45.48 μm, an ablation depth of 20.71 μm, and a surface roughness of 1.10 μm, with minimal deviation from the predicted values. This high level of precision affirms the reliability of the RSM model and its effectiveness in optimizing femtosecond laser machining processes for SCD.

Author Contributions

Conceptualization, J.Y.; methodology, J.Y. and C.M.; software, C.M. and Q.Z.; validation, J.Y. and C.C.; formal analysis, J.Y., C.M. and C.C.; investigation, J.Y.; resources, C.M.; data curation, J.Y., C.C. and Y.L.; writing—original draft preparation, J.Y.; writing—review and editing, C.M. and C.C.; visualization, Q.Z. and Y.L.; supervision, G.Z.; project administration, G.Z.; funding acquisition, J.Y., G.Z., C.C. and Q.Z. All authors have read and agreed to the published version of the manuscript.

Funding

This research was funded by Scientific Research Foundation of Hunan Provincial Education Department [grant numbers 23A0565, 18B449 and 22A0565], Natural Science Foundation of Hunan Province [grant numbers 2023JJ50340 and 2024JJ7084], and Innovation and Entrepreneurship Training Program for Hunan College Students [grant number S202411527079].

Institutional Review Board Statement

Not applicable.

Informed Consent Statement

Not applicable.

Data Availability Statement

Data will be made available on request.

Conflicts of Interest

Author Chuanbo Ming is employed by the company Shandong Taikai Power Switchgear Co., Ltd. The remaining authors declare that the research was conducted in the absence of any commercial or financial relationships that could be construed as a potential conflict of interest.

References

  1. Rizzo, A.; Goel, S.; Grilli, M.L.; Iglesias, R.; Jaworska, L.; Lapkovskis, V.; Novak, P.; Postolnyi, B.O.; Valerini, D. The Critical Raw Materials in Cutting Tools for Machining Applications: A Review. Materials 2020, 13, 1377. [Google Scholar] [CrossRef] [PubMed]
  2. Jiang, G.; Jianguo, Z.; Yanan, P.; Renke, K.; Yoshiharu, N.; Paul, S.; Xiaobin, Y.; Baorui, W.; Dongming, G. A Critical Review on the Chemical Wear and Wear Suppression of Diamond Tools in Diamond Cutting of Ferrous Metals. Int. J. Extrem. Manuf. 2020, 2, 012001. [Google Scholar] [CrossRef]
  3. Li, G.; Rahim, M.Z.; Pan, W.; Wen, C.; Ding, S. The Manufacturing and the Application of Polycrystalline Diamond Tools—A Comprehensive Review. J. Manuf. Process. 2020, 56, 400–416. [Google Scholar] [CrossRef]
  4. Shimaoka, T.; Yamada, H.; Chayahara, A. Fabrication of Self-Standing Large (111) Single Crystal Diamond Using Bulk Growth of (100) CVD Diamond and Lift-off Process. Diam. Relat. Mater. 2024, 142, 110781. [Google Scholar] [CrossRef]
  5. Zhang, T.; Pramanik, G.; Zhang, K.; Gulka, M.; Wang, L.; Jing, J.; Xu, F.; Li, Z.; Wei, Q.; Cigler, P.; et al. Toward Quantitative Bio-Sensing with Nitrogen-Vacancy Center in Diamond. ACS Sens. 2021, 6, 2077–2107. [Google Scholar] [CrossRef] [PubMed]
  6. Heupel, J.; Pallmann, M.; Körber, J.; Merz, R.; Kopnarski, M.; Stöhr, R.; Reithmaier, J.P.; Hunger, D.; Popov, C. Fabrication and Characterization of Single-Crystal Diamond Membranes for Quantum Photonics with Tunable Microcavities. Micromachines 2020, 11, 1080. [Google Scholar] [CrossRef]
  7. Zhang, J.; Wang, J.; Zhang, G.; Huo, Z.; Huang, Z.; Wu, L. A Review of Diamond Synthesis, Modification Technology, and Cutting Tool Application in Ultra-Precision Machining. Mater. Des. 2024, 237, 112577. [Google Scholar] [CrossRef]
  8. Luo, H.; Ajmal, K.M.; Liu, W.; Yamamura, K.; Deng, H. Polishing and Planarization of Single Crystal Diamonds: State-of-the-Art and Perspectives. Int. J. Extrem. Manuf. 2021, 3, abe915. [Google Scholar] [CrossRef]
  9. Mouhamadali, F.; Equis, S.; Saeidi, F.; Best, J.P.; Cantoni, M.; Hoffmann, P.; Wasmer, K. Nanosecond Pulsed Laser-Processing of CVD Diamond. Opt. Lasers Eng. 2020, 126, 105917. [Google Scholar] [CrossRef]
  10. Lin, Z.; Ji, L.; Wang, W. Precision Machining of Single Crystal Diamond Cutting Tool via Picosecond Laser Irradiation. Int. J. Refract. Met. Hard Mater. 2023, 114, 106226. [Google Scholar] [CrossRef]
  11. Zhao, J.; Zhang, C.; Liu, F.; Cheng, G.J. Understanding Femtosecond Laser Internal Scribing of Diamond by Atomic Simulation: Phase Transition, Structure and Property. Carbon N. Y. 2021, 175, 352–363. [Google Scholar] [CrossRef]
  12. Ali, B.; Litvinyuk, I.V.; Rybachuk, M. Femtosecond Laser Micromachining of Diamond: Current Research Status, Applications and Challenges. Carbon N. Y. 2021, 179, 209–226. [Google Scholar] [CrossRef]
  13. Gololobov, V.M.; Kononenko, V.V.; Konov, V.I. Laser Nanoablation of a Diamond Surface in Air and Vacuum. Opt. Laser Technol. 2020, 131, 106396. [Google Scholar] [CrossRef]
  14. Ashikkalieva, K.K.; Kononenko, T.V.; Ashkinazi, E.E.; Obraztsova, E.A.; Mikhutkin, A.A.; Timofeev, A.A.; Konov, V.I. Internal Structure and Conductivity of Laser-Induced Graphitized Wires inside Diamond. Diam. Relat. Mater. 2022, 128, 109243. [Google Scholar] [CrossRef]
  15. Wang, F.; Shan, C.; Yan, J.P.; Fu, J.; Garuma Abdisa, D.; Zhu, T.F.; Wang, W.; Chen, F.; Zhang, J.W.; Wang, H.X.; et al. Application of Femtosecond Laser Technique in Single Crystal Diamond Film Separation. Diam. Relat. Mater. 2016, 63, 69–74. [Google Scholar] [CrossRef]
  16. Zhao, Y.; Liu, H.; Yu, T.; Hong, M. Fabrication of High Hardness Microarray Diamond Tools by Femtosecond Laser Ablation. Opt. Laser Technol. 2021, 140, 107014. [Google Scholar] [CrossRef]
  17. Ackerl, N.; Warhanek, M.; Gysel, J.; Wegener, K. Ultra-Short Pulsed Laser Conditioning of Metallic-Bonded Diamond Grinding Tools. Mater. Des. 2020, 189, 108530. [Google Scholar] [CrossRef]
  18. Han, R.; Song, G.; Liu, X.; Zhang, Z.; Liu, L. The Mathematical Model for the Prediction and Optimization of Weld Bead Geometry in All-Position Low-Power Pulsed Laser-MAG Hybrid Welding. Int. J. Adv. Manuf. Technol. 2023, 126, 5245–5258. [Google Scholar] [CrossRef]
  19. Hu, T.; Yuan, S.; Wei, J.; Liu, Y.; Zhang, Z. Micro-Grooves Machining and Optimizing on SiC/SiC Composites by Femtosecond Laser-Based on Response Surface Methodology. Ceram. Int. 2024, 50, 1665–1682. [Google Scholar] [CrossRef]
  20. Chatterjee, S.; Mahapatra, S.S.; Xu, J.; Brabazon, D. Influence of Parameters on Performance Characteristics and Defects during Laser Microdrilling of Titanium Alloys Using RSM. Int. J. Adv. Manuf. Technol. 2023, 129, 4569–4587. [Google Scholar] [CrossRef]
  21. Bibili Nzengue, A.G.; Mpofu, K.; Mathe, N.R.; Muvunzi, R. Optimising a Processing Window for the Production of Aluminium Silicon-12 Samples via Selective Laser Melting. J. Mater. Res. Technol. 2024, 28, 1062–1073. [Google Scholar] [CrossRef]
Figure 1. Femtosecond laser machining experimental setup, (a) Schematic of the laser transmission path, (b) experimental platform.
Machines 12 00614 g001
Figure 2. Microgroove structure and surface morphology of SCD observed under 3D digital microscope at different laser powers, (a) P = 6.5 W, (b) P = 11.1 W, (c) P = 16.5 W.
Machines 12 00614 g002
Figure 3. Microgroove structure and surface morphology of SCD observed under SEM at different laser powers, (a) P = 6.5 W, (b) P = 11.1 W, (c) P = 16.5 W.
Machines 12 00614 g003
Figure 4. Influence of laser power on (a) ablation width, (b) ablation depth and (c) Ra.
Machines 12 00614 g004
Figure 5. Influence of scanning speed on (a) ablation width, (b) ablation depth and (c) Ra.
Machines 12 00614 g005
Figure 6. Influence of number of scans on (a) ablation width, (b) ablation depth and (c) Ra.
Machines 12 00614 g006
Figure 7. Interactive effect of laser power and scanning speed on ablation width, (a) contour plot, (b) response surface plot.
Machines 12 00614 g007
Figure 8. Interactive effect of laser power and number of scans on ablation width, (a) contour plot, (b) response surface plot.
Machines 12 00614 g008
Figure 9. Interactive effect of scanning speed and number of scans on ablation width, (a) contour plot, (b) response surface plot.
Machines 12 00614 g009
Figure 10. Interactive effect of laser power and scanning speed on ablation depth, (a) contour plot, (b) response surface plot.
Machines 12 00614 g010
Figure 11. Interactive effect of laser power and number of scans on ablation depth, (a) contour plot, (b) response surface plot.
Machines 12 00614 g011
Figure 12. Interactive effect of scanning speed and number of scans on ablation depth, (a) contour plot, (b) response surface plot.
Machines 12 00614 g012
Figure 13. Interactive effect of laser power and scanning speed on Ra, (a) contour plot, (b) response surface plot.
Machines 12 00614 g013
Figure 14. Interactive effect of laser power and number of scans on Ra, (a) contour plot, (b) response surface plot.
Machines 12 00614 g014
Figure 15. Interactive effect of scanning speed and number of scans on Ra, (a) contour plot, (b) response surface plot.
Machines 12 00614 g015
Figure 16. Comparison of the predicted values and actual values, (a) ablation width, (b) ablation depth, (c) Ra.
Machines 12 00614 g016
Table 1. Properties and parameters of the synthetic SCD [10].
ParametersValue
Density (kg/m3)3515
Thermal conductivity (W/mK)2000
Thermal expansion coefficient (10−6 K−1)1.1
Elastic modulus (GPa)960
Refractive index2.417
Absorptivity (@1030 nm)0.25
Table 2. Laser machining parameters of single-factor experiments.
Process ParametersValue
Laser power P (W)6.5, 8.8, 11.1, 13.4, 16.5
Scanning speed v (m/s)1.0, 1.5, 2.0, 2.5, 3.0
Number of scans N50, 75, 100, 125, 150, 175, 200
Defocusing distance D (mm)0
Pulse repetition rate f (kHz)175
Table 3. Process parameters of RSM experiments.
Process ParametersLevel
−101
Laser power P (W)6.511.116.5
Scanning speed v (m/s)123
Number of scans N50100150
Table 4. Design matrix of RSM and measured values.
No.Process ParametersMeasured Values
Laser Power
P (W)
Scanning Speed
v (m/s)
Number of Scans
N
Ablation Width WA (μm)Ablation Depth hA (μm)Surface Roughness
Ra (μm)
116.525046.4913.740.92
211.1315040.4618.281.12
311.1210038.9116.730.98
46.5310023.574.920.41
511.1115040.7245.823.27
66.5110024.4710.690.95
76.525025.504.340.43
811.1210040.8818.030.95
916.5215048.2038.602.93
1011.1210041.1617.321.10
1111.115040.8218.581.24
1216.5310046.3618.270.98
136.5215026.239.350.88
1416.5110046.0745.283.12
1511.135039.796.940.51
1611.1210040.5217.211.02
1711.1210042.4517.941.07
Table 5. ANOVA results of ablation width regression model.
SourceSum of SquaresDOFMean SquareF-Valuep-ValueProb. > F
Model1057.309117.48114.12<0.0001significant
P953.751953.75926.50<0.0001
v0.405010.40500.39350.5504
N1.1911.191.160.3174
Pv0.369210.36920.35870.5681
PN0.277310.27730.26930.6198
vN0.148210.14820.14400.7156
P2132.921132.92129.12<0.0001
v23.5013.503.400.1076
N21.3911.391.350.2826
Residual7.2171.03
Lack of Fit0.698230.23270.140.9290not significant
Pure Error6.5141.63
Cor. Total1064.5116
Standard deviation = 1.01R2 = 0.9932
Mean = 38.39Adjusted R2 = 0.9845
Coefficient of variation = 2.64Adeq Precision = 31.4887
Table 6. ANOVA results of ablation depth regression model.
SourceSum of SquaresDOFMean SquareF-Valuep-ValueProb. > F
Model2523.649280.4058.86<0.0001significant
P937.231937.23196.75<0.0001
v675.581675.58141.82<0.0001
N610.641610.64128.19<0.0001
Pv109.731109.7323.040.0020
PN94.77194.7719.900.0029
vN63.20163.2013.270.0083
P229.31129.316.150.0422
v271.50171.5015.010.0061
N22.9612.960.62110.4565
Residual33.3474.76
Lack of Fit32.18310.733.670.1436not significant
Pure Error1.1740.2923
Cor. Total2556.9816
Standard deviation = 2.18R2 = 0.9870
Mean = 18.94Adjusted R2 = 0.9702
Coefficient of variation = 11.52Adeq Precision = 25.8398
Table 7. ANOVA results of surface roughness regression model.
SourceSum of SquaresDOFMean SquareF-Valuep-ValueProb. > F
Model12.9591.44222.39<0.0001significant
P3.4813.48538.48<0.0001
v4.0314.03622.70<0.0001
N3.4013.40525.41<0.0001
Pv0.631610.631697.60<0.0001
PN0.600910.600992.85<0.0001
vN0.504110.504177.89<0.0001
P20.000110.00010.01490.9062
v20.361510.361555.860.0001
N20.200110.200130.920.0009
Residual0.045370.0065
Lack of Fit0.030030.01002.610.1885not significant
Pure Error0.015340.0038
Cor. Total13.0016
Standard deviation = 0.0804R2 = 0.9965
Mean = 1.29Adjusted R2 = 0.9920
Coefficient of variation = 6.25Adeq Precision = 45.8217
Table 8. Results of RSM model accuracy.
No.Laser Power
P (W)
Scanning Speed
v (m/s)
Number of Scans N Ablation Width WA (μm)Ablation Depth hA (μm)Surface Roughness
Ra (μm)
46.53100Actual23.574.920.41
Predicted23.674.990.391
Error0.42%1.42%4.63%
811.12100Actual40.8818.030.95
Predicted40.7817.451.024
Error0.24%4.0%7.79%
316.52150Actual48.2038.62.93
Predicted48.1740.942.99
Error0.06%6.06%2.05%
Disclaimer/Publisher’s Note: The statements, opinions and data contained in all publications are solely those of the individual author(s) and contributor(s) and not of MDPI and/or the editor(s). MDPI and/or the editor(s) disclaim responsibility for any injury to people or property resulting from any ideas, methods, instructions or products referred to in the content.

