

An Investigation into the Optimal Dimple Geometry in a Single-Dimple Sliding Contact


Abstract

1. Introduction
- Adding material technologies;
- Removing material technologies;
- Material displacement technologies;
- Self-forming methods.
2. Methodology
2.1. Simulation Methodology
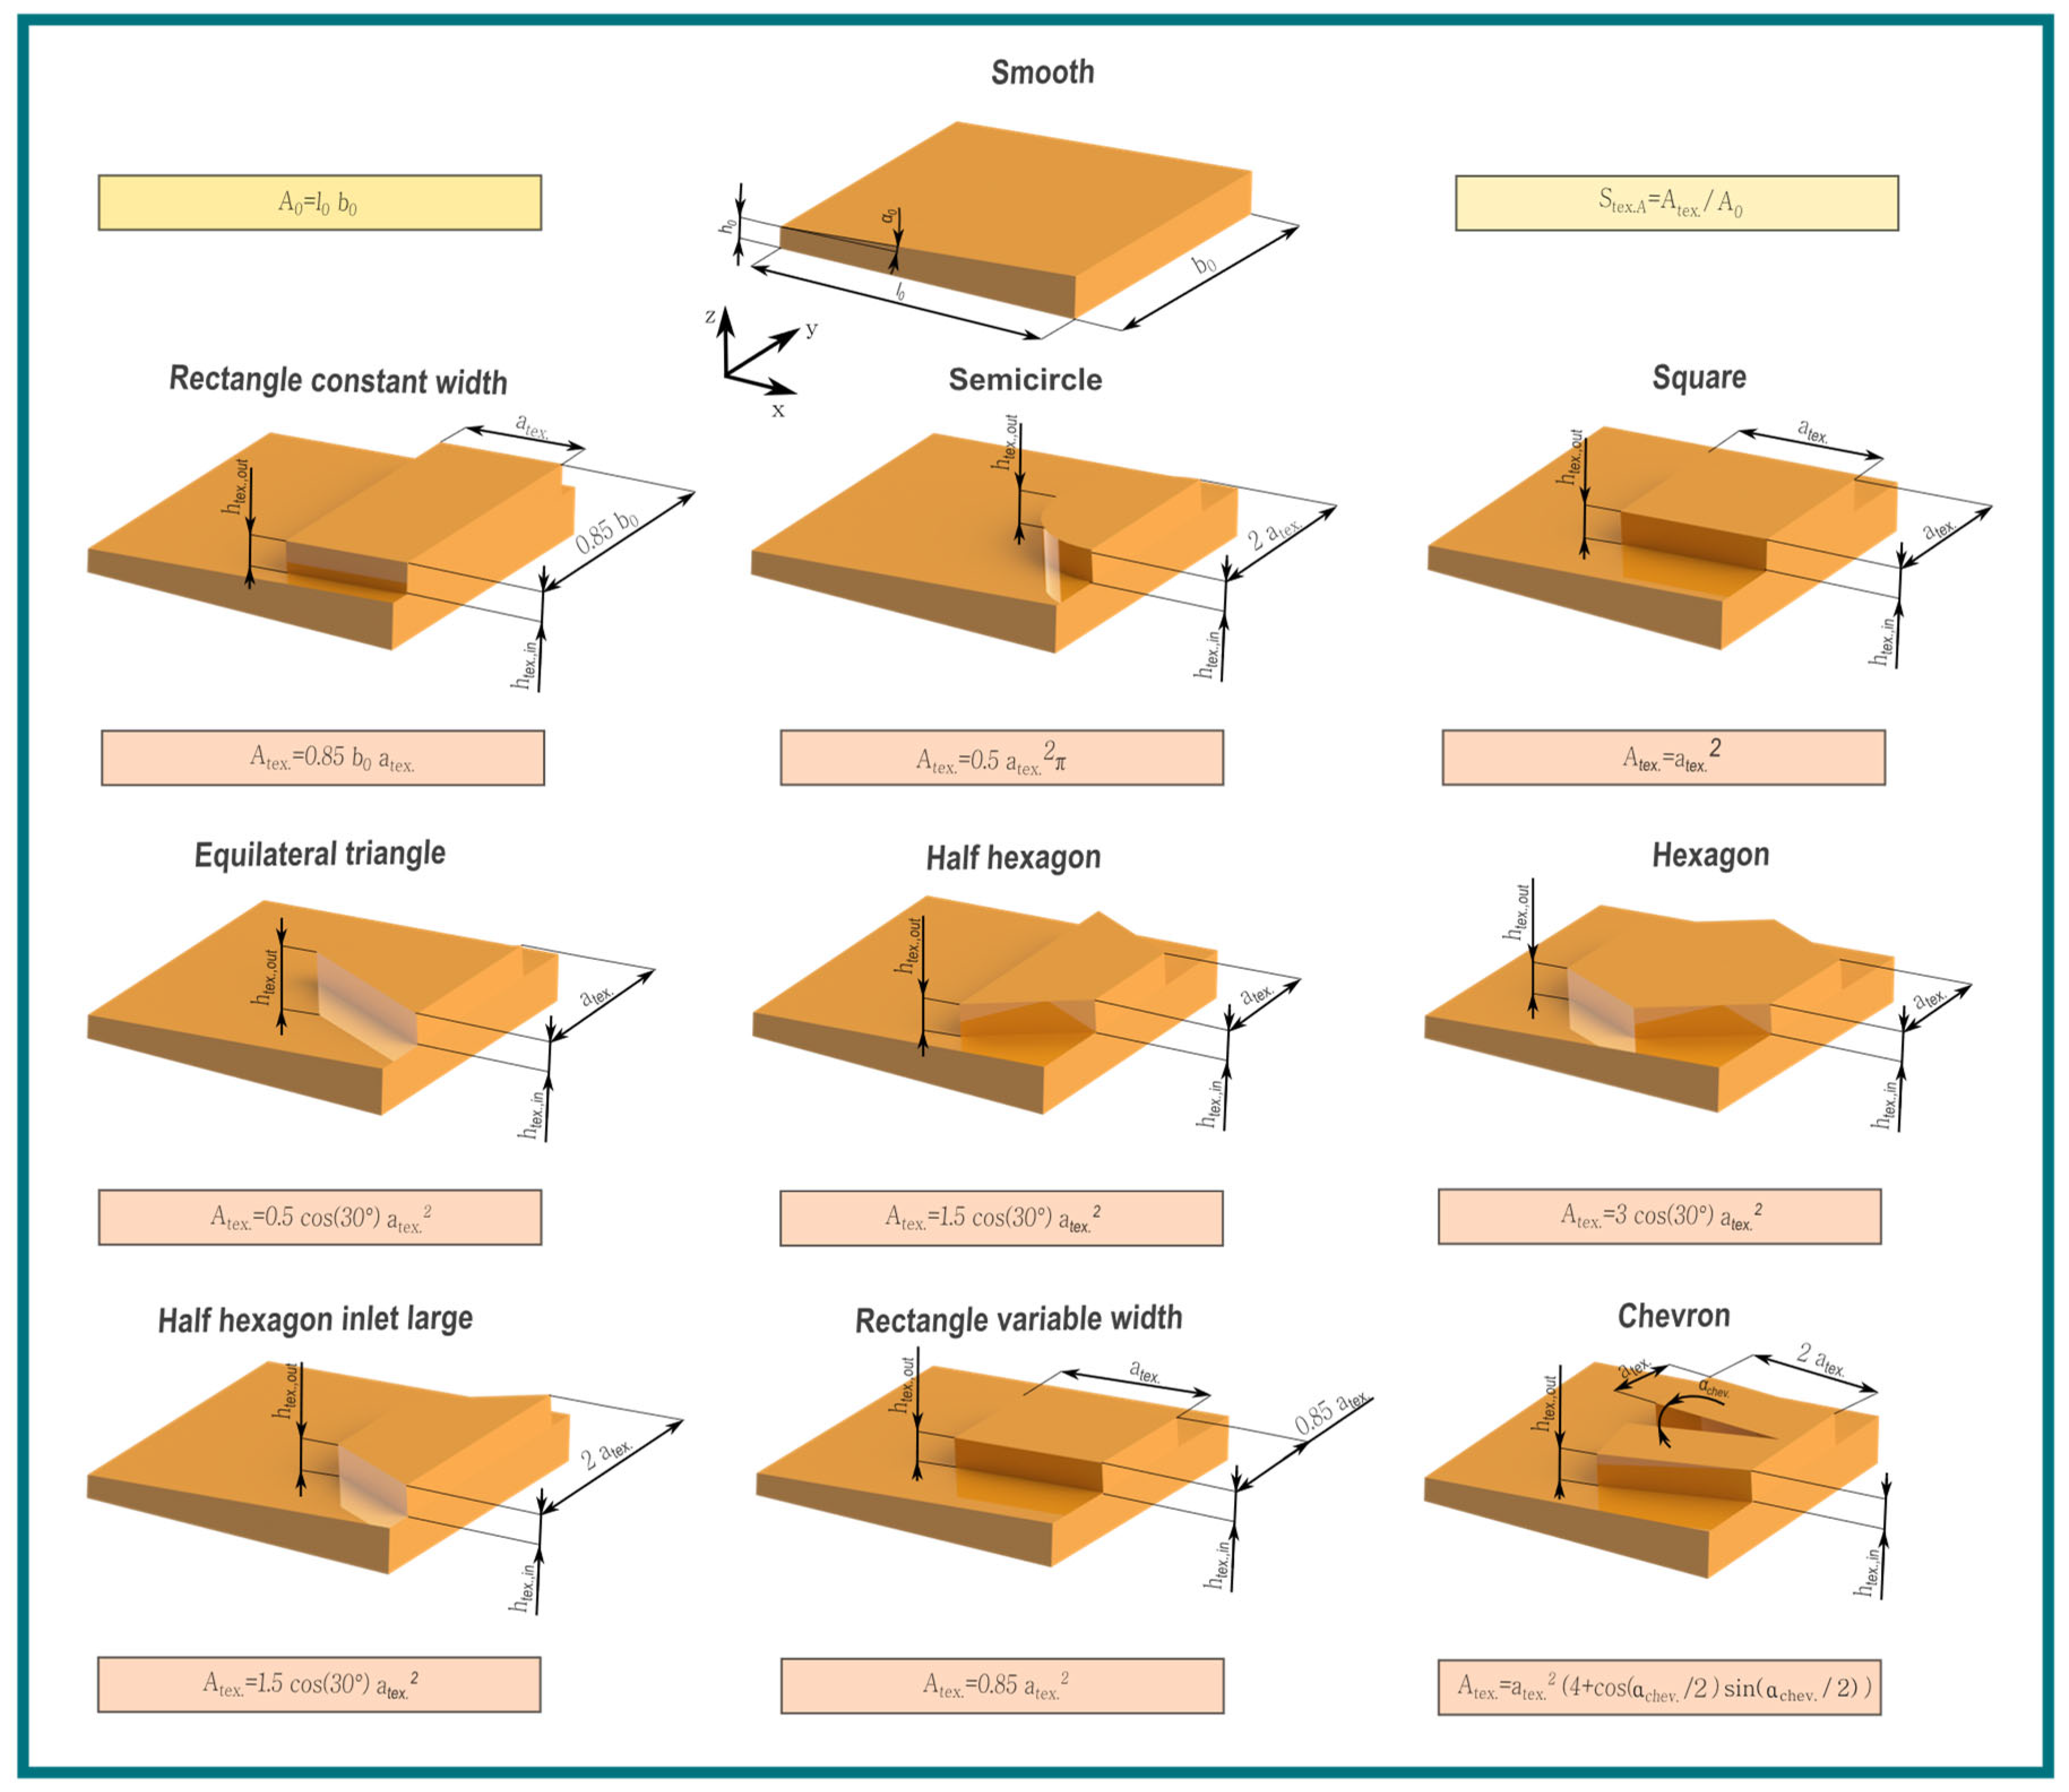
2.2. Texture Geometries and Simulation Parameters
3. Results
3.1. Influence of Texture Geometry for Constant Width
3.2. Influence of Pitch Angle
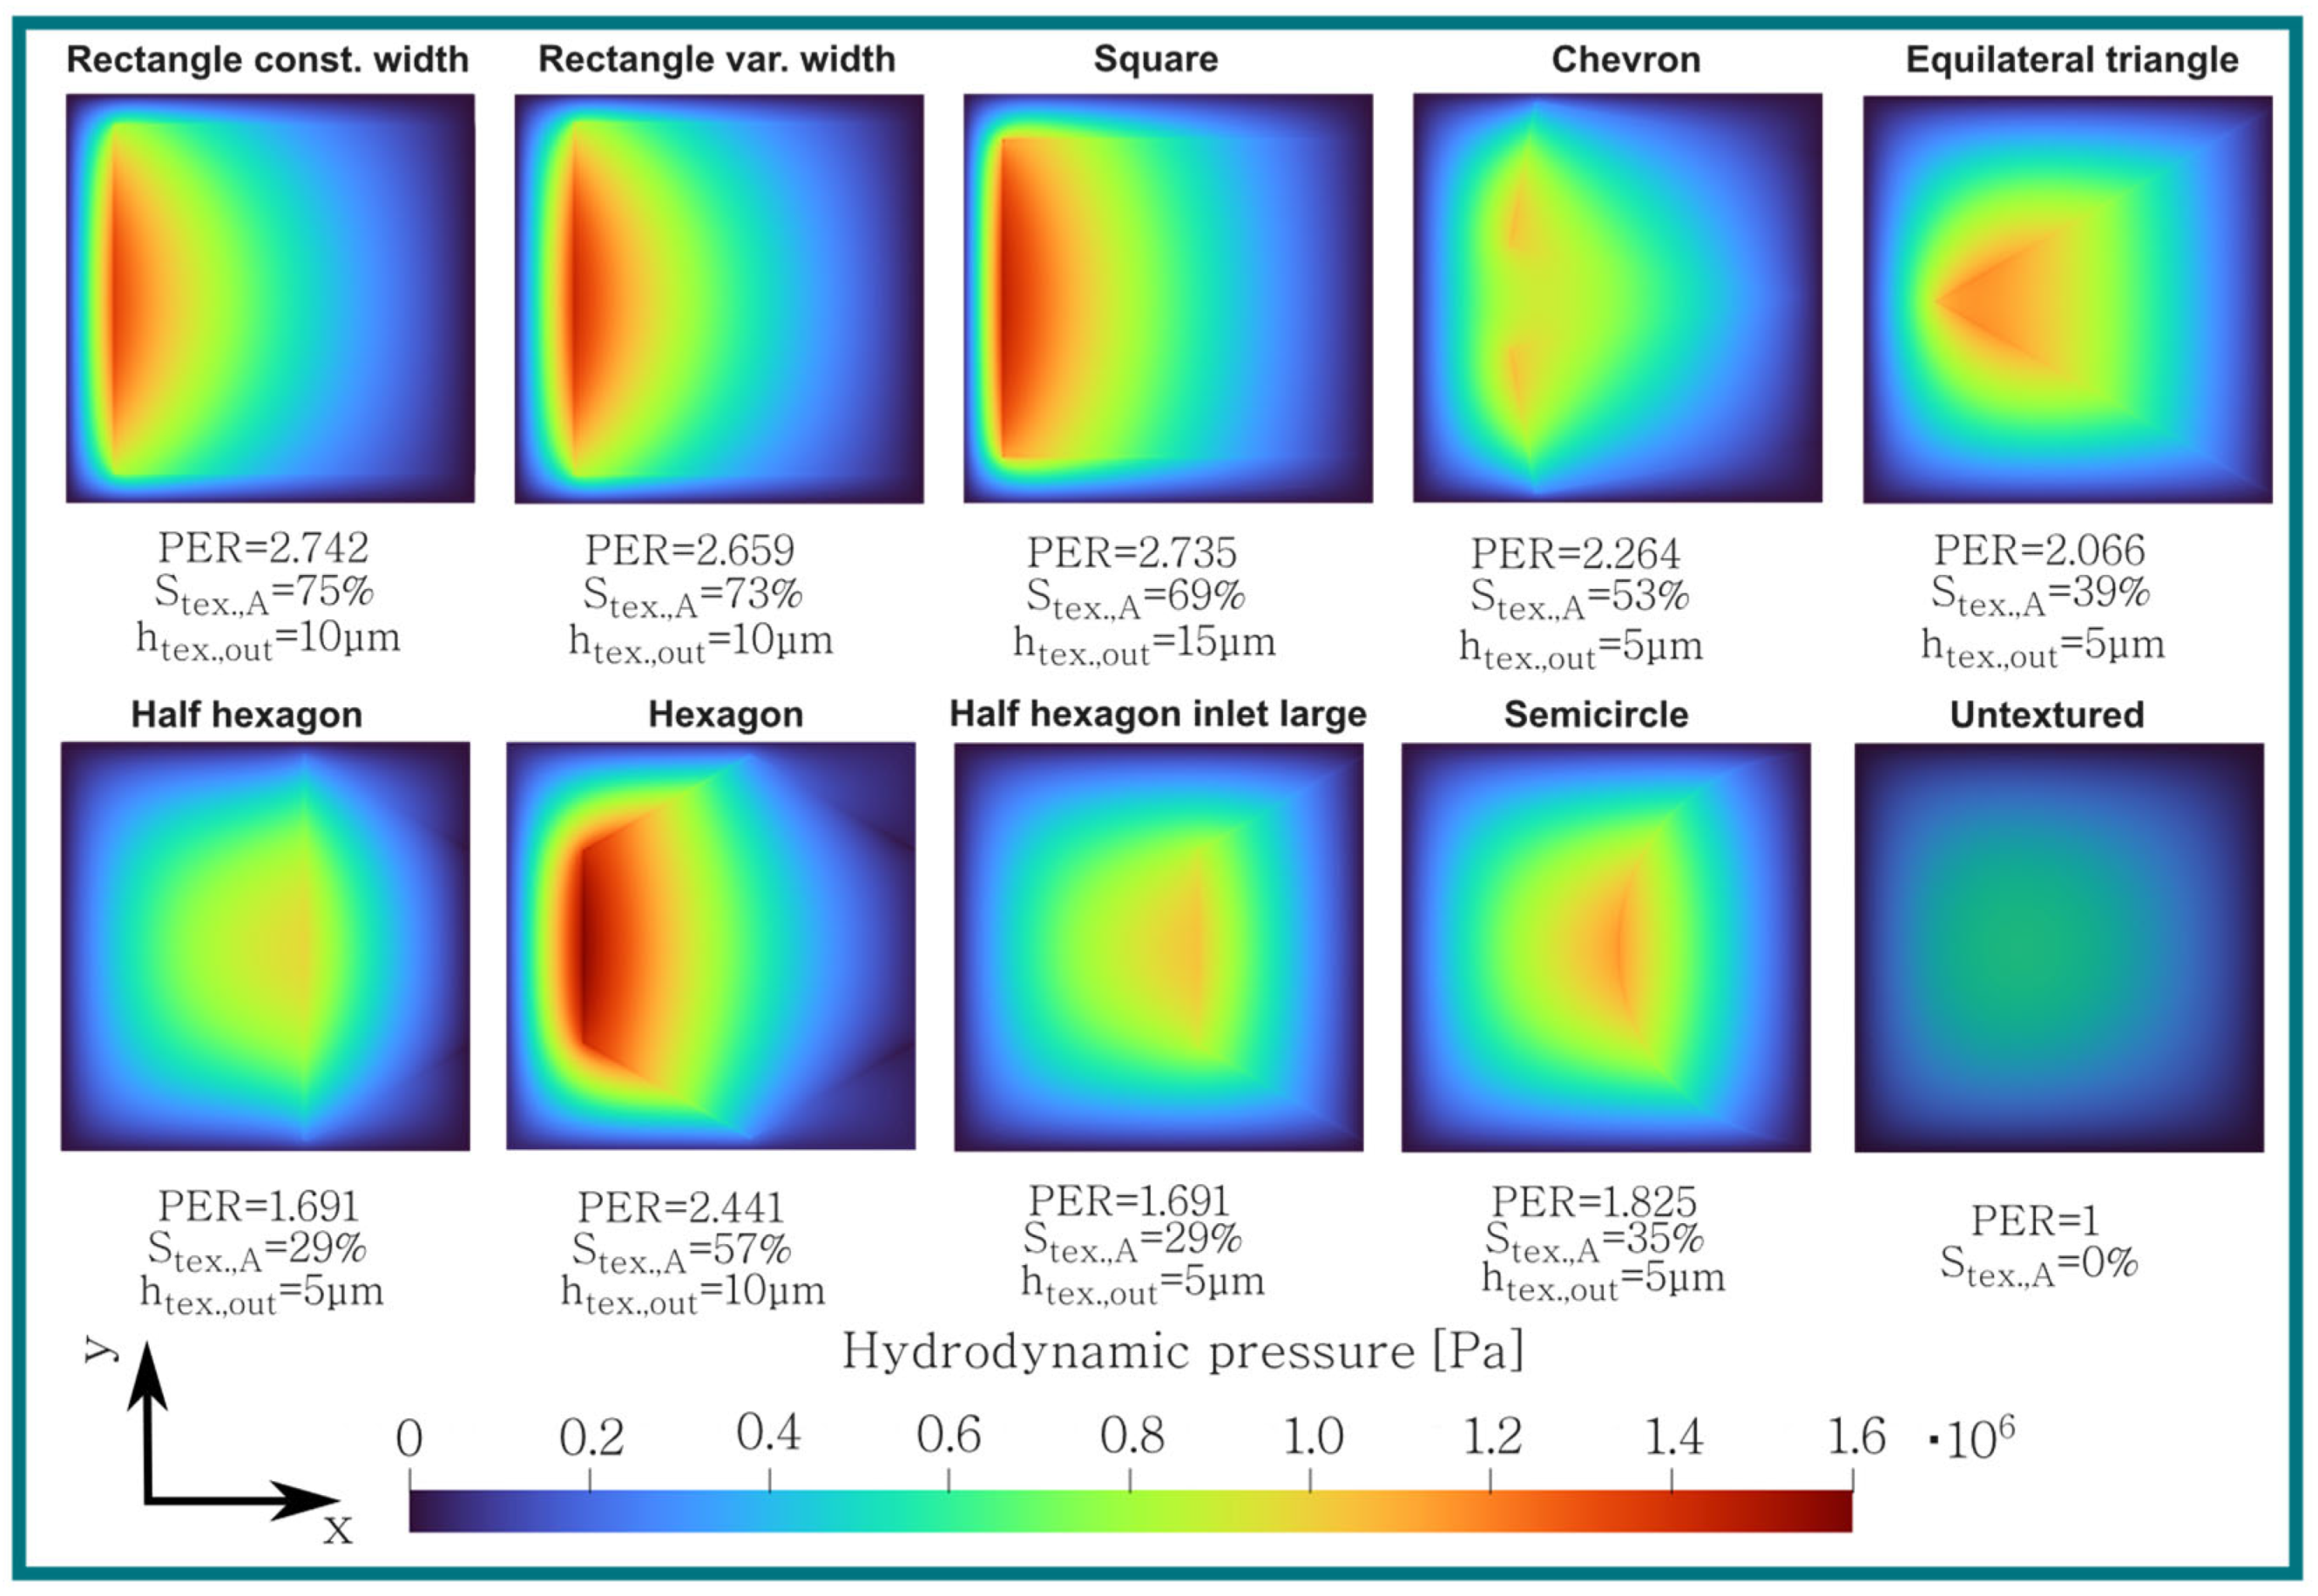
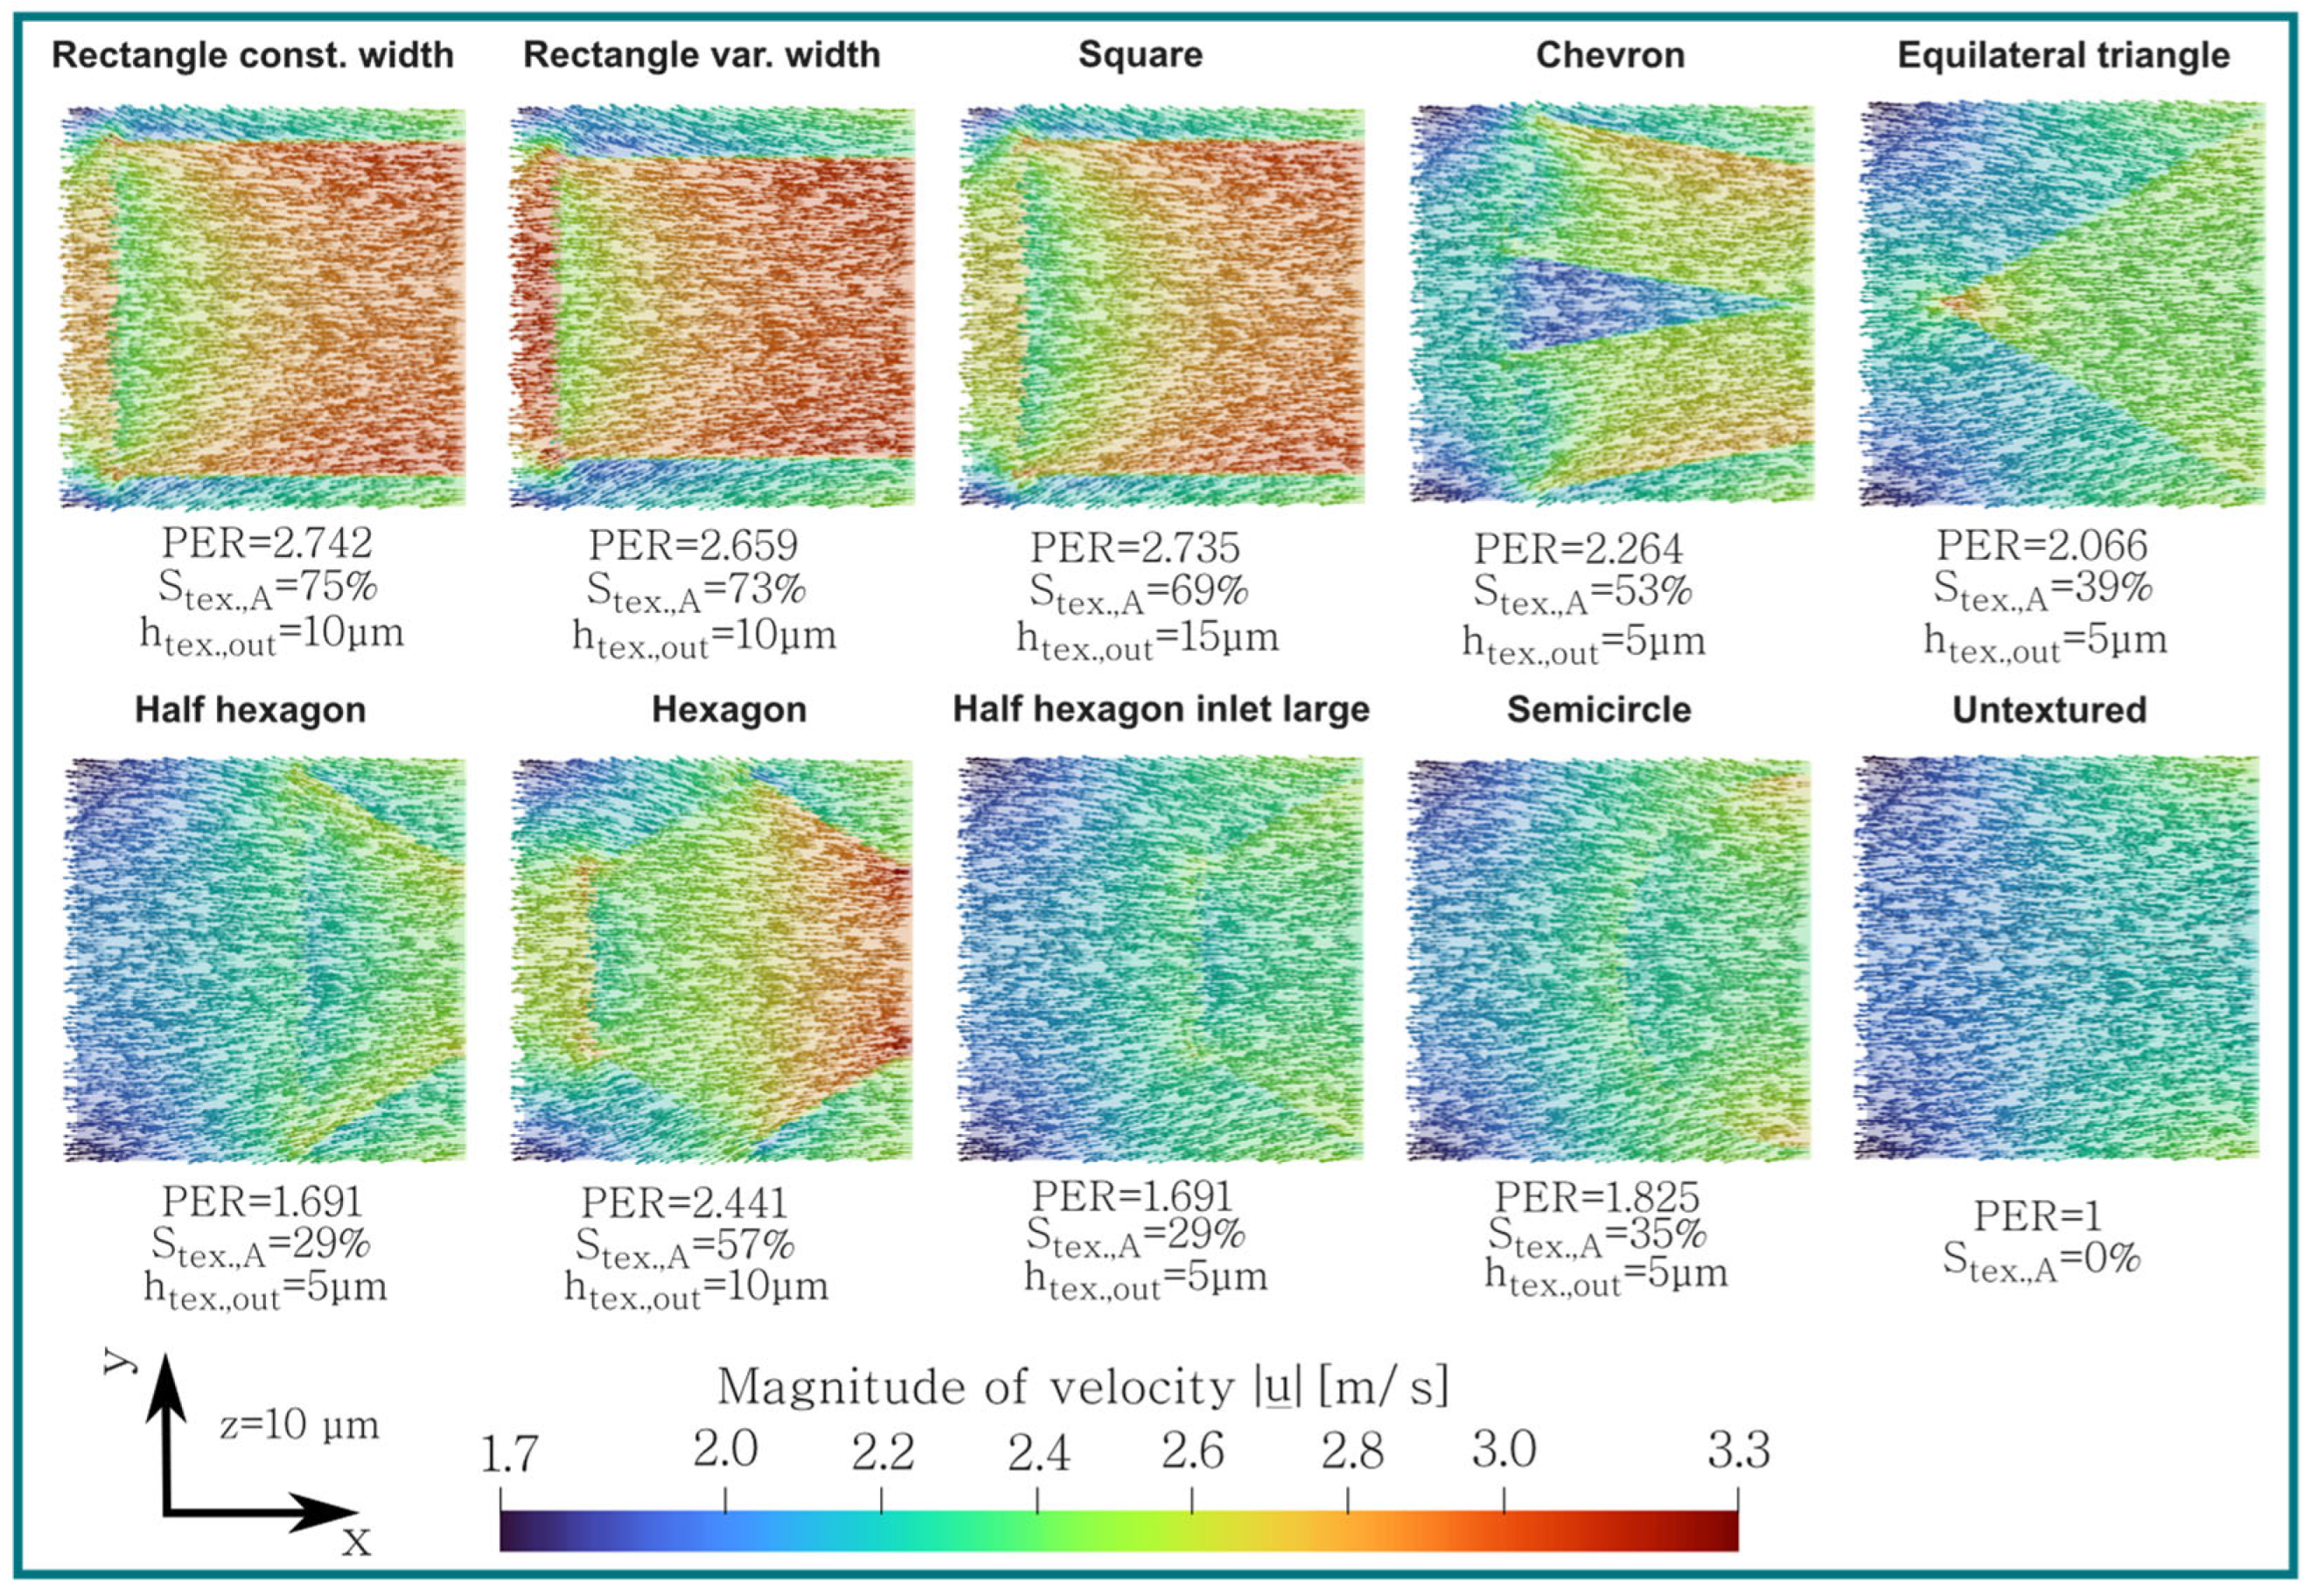
3.3. Pressure and Velocity Analyses of Best-Performing Geometries
4. Discussion
5. Conclusions
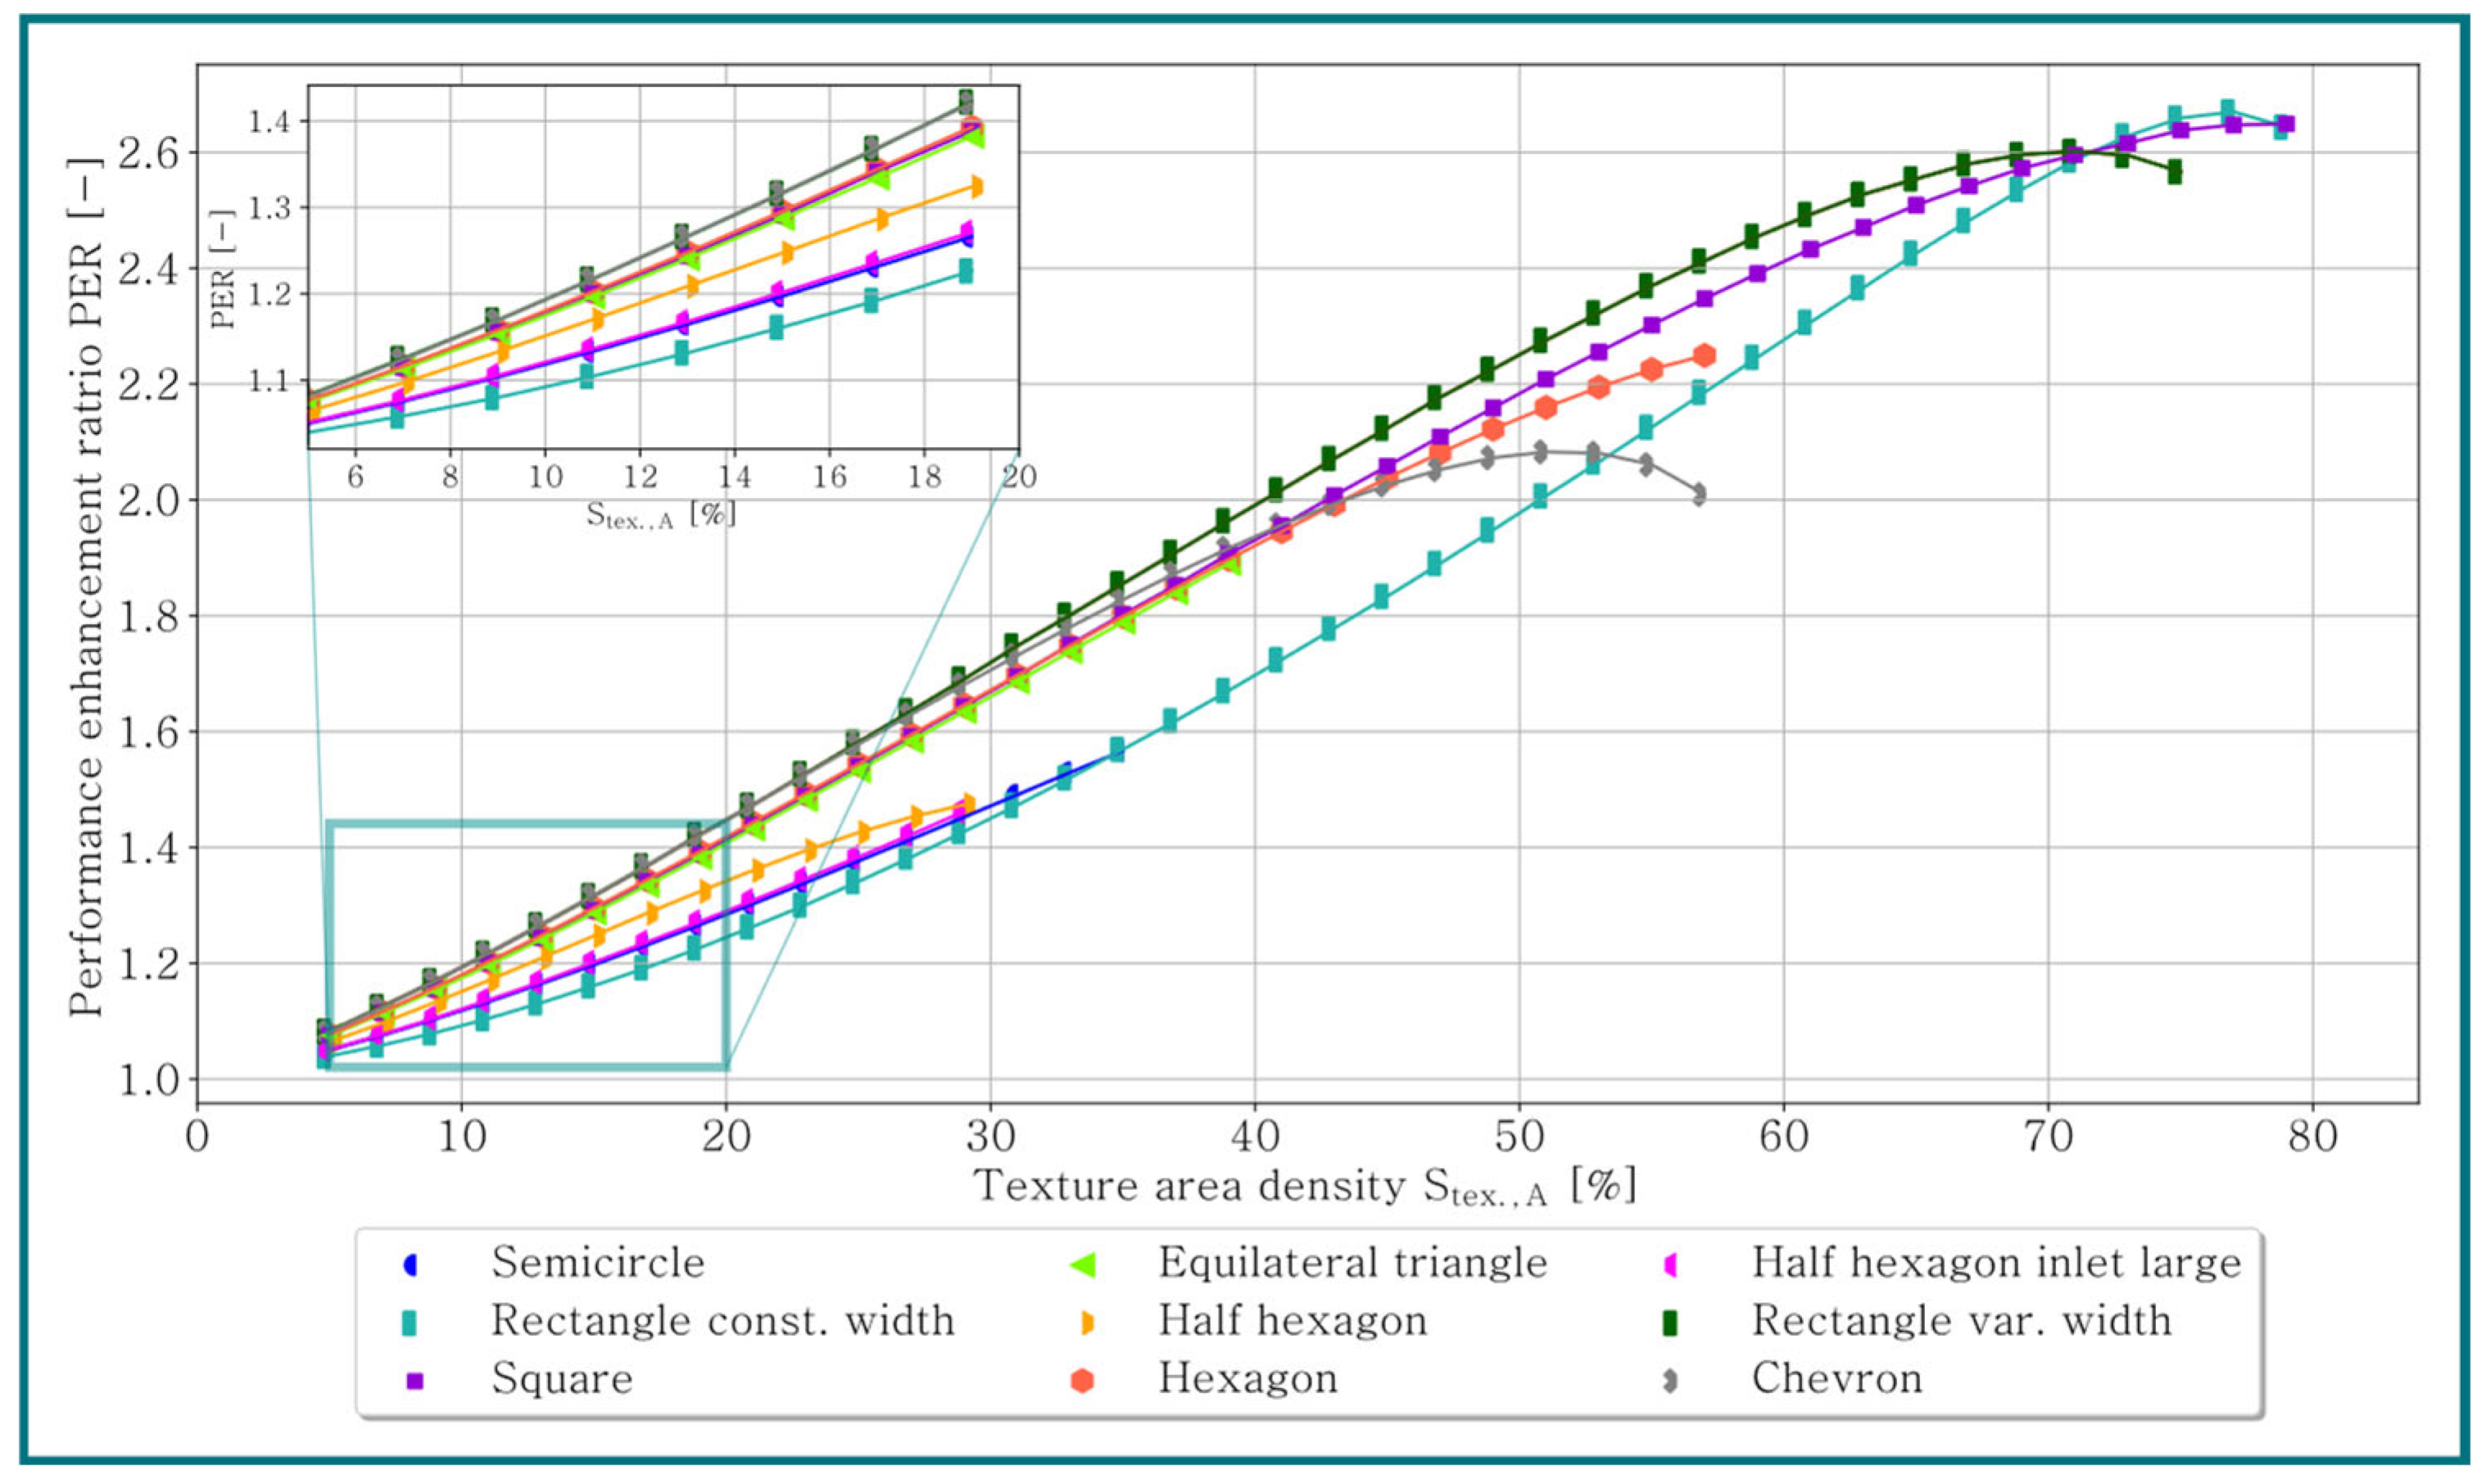
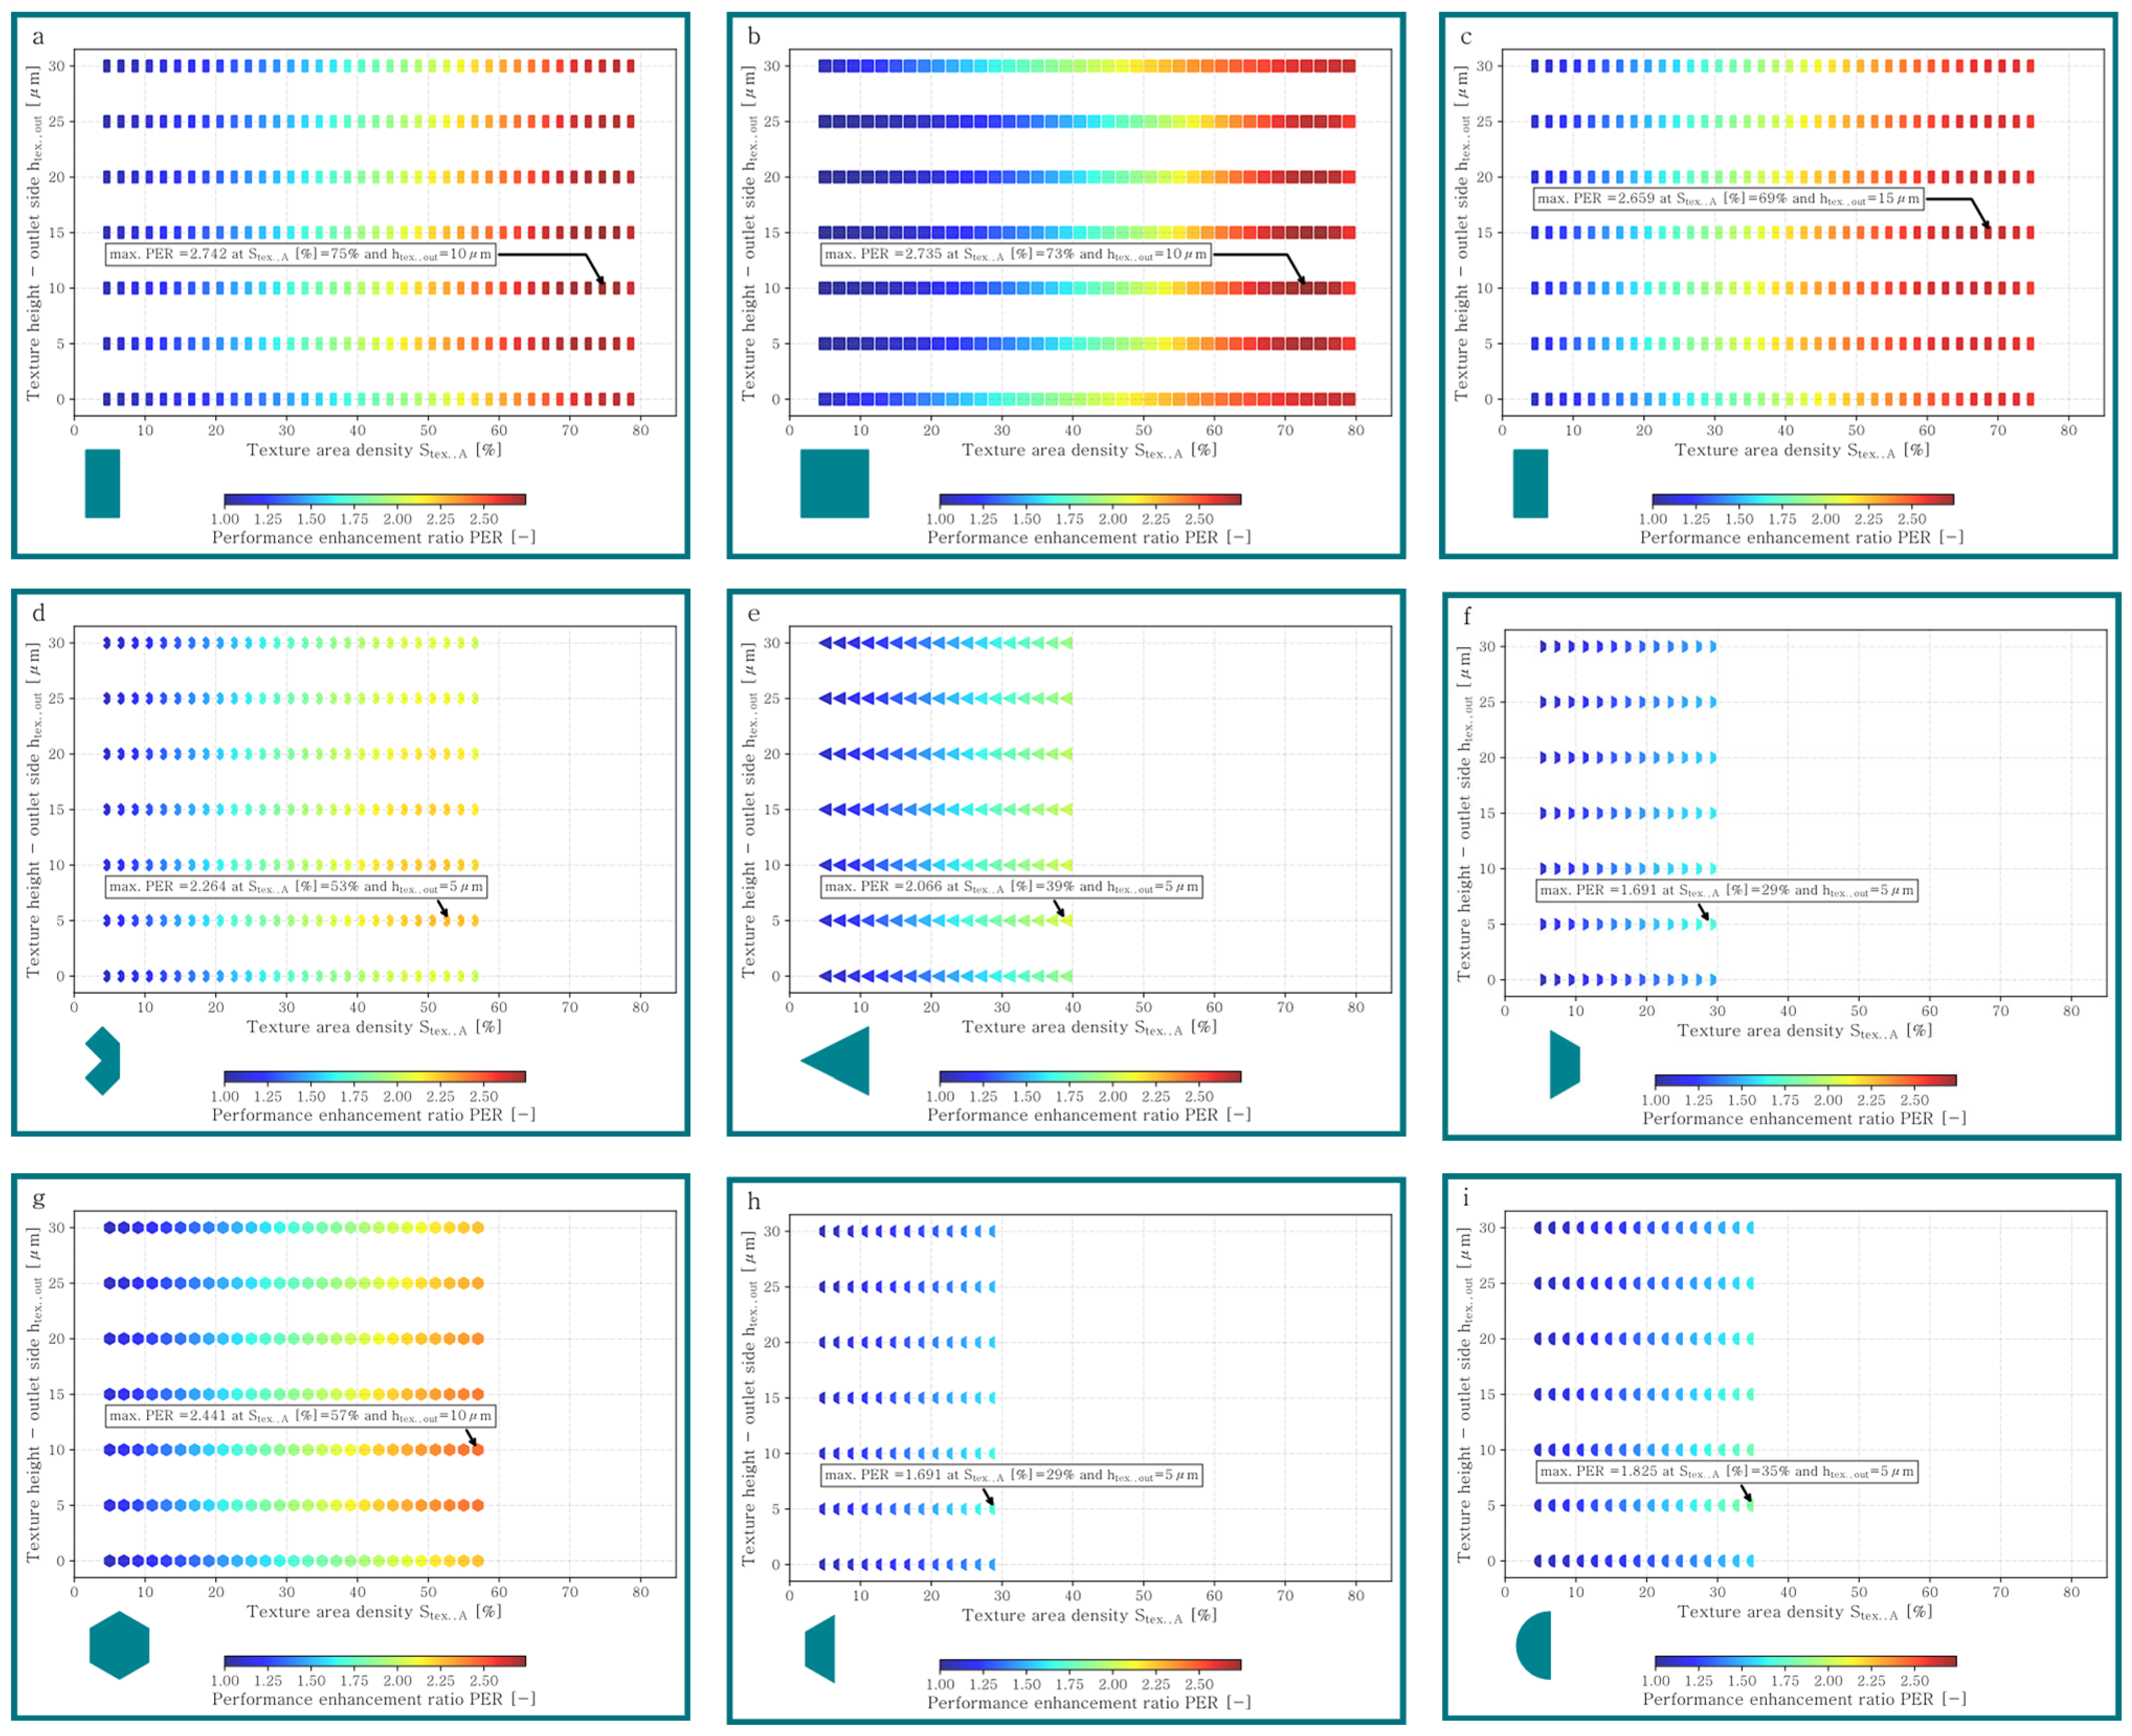
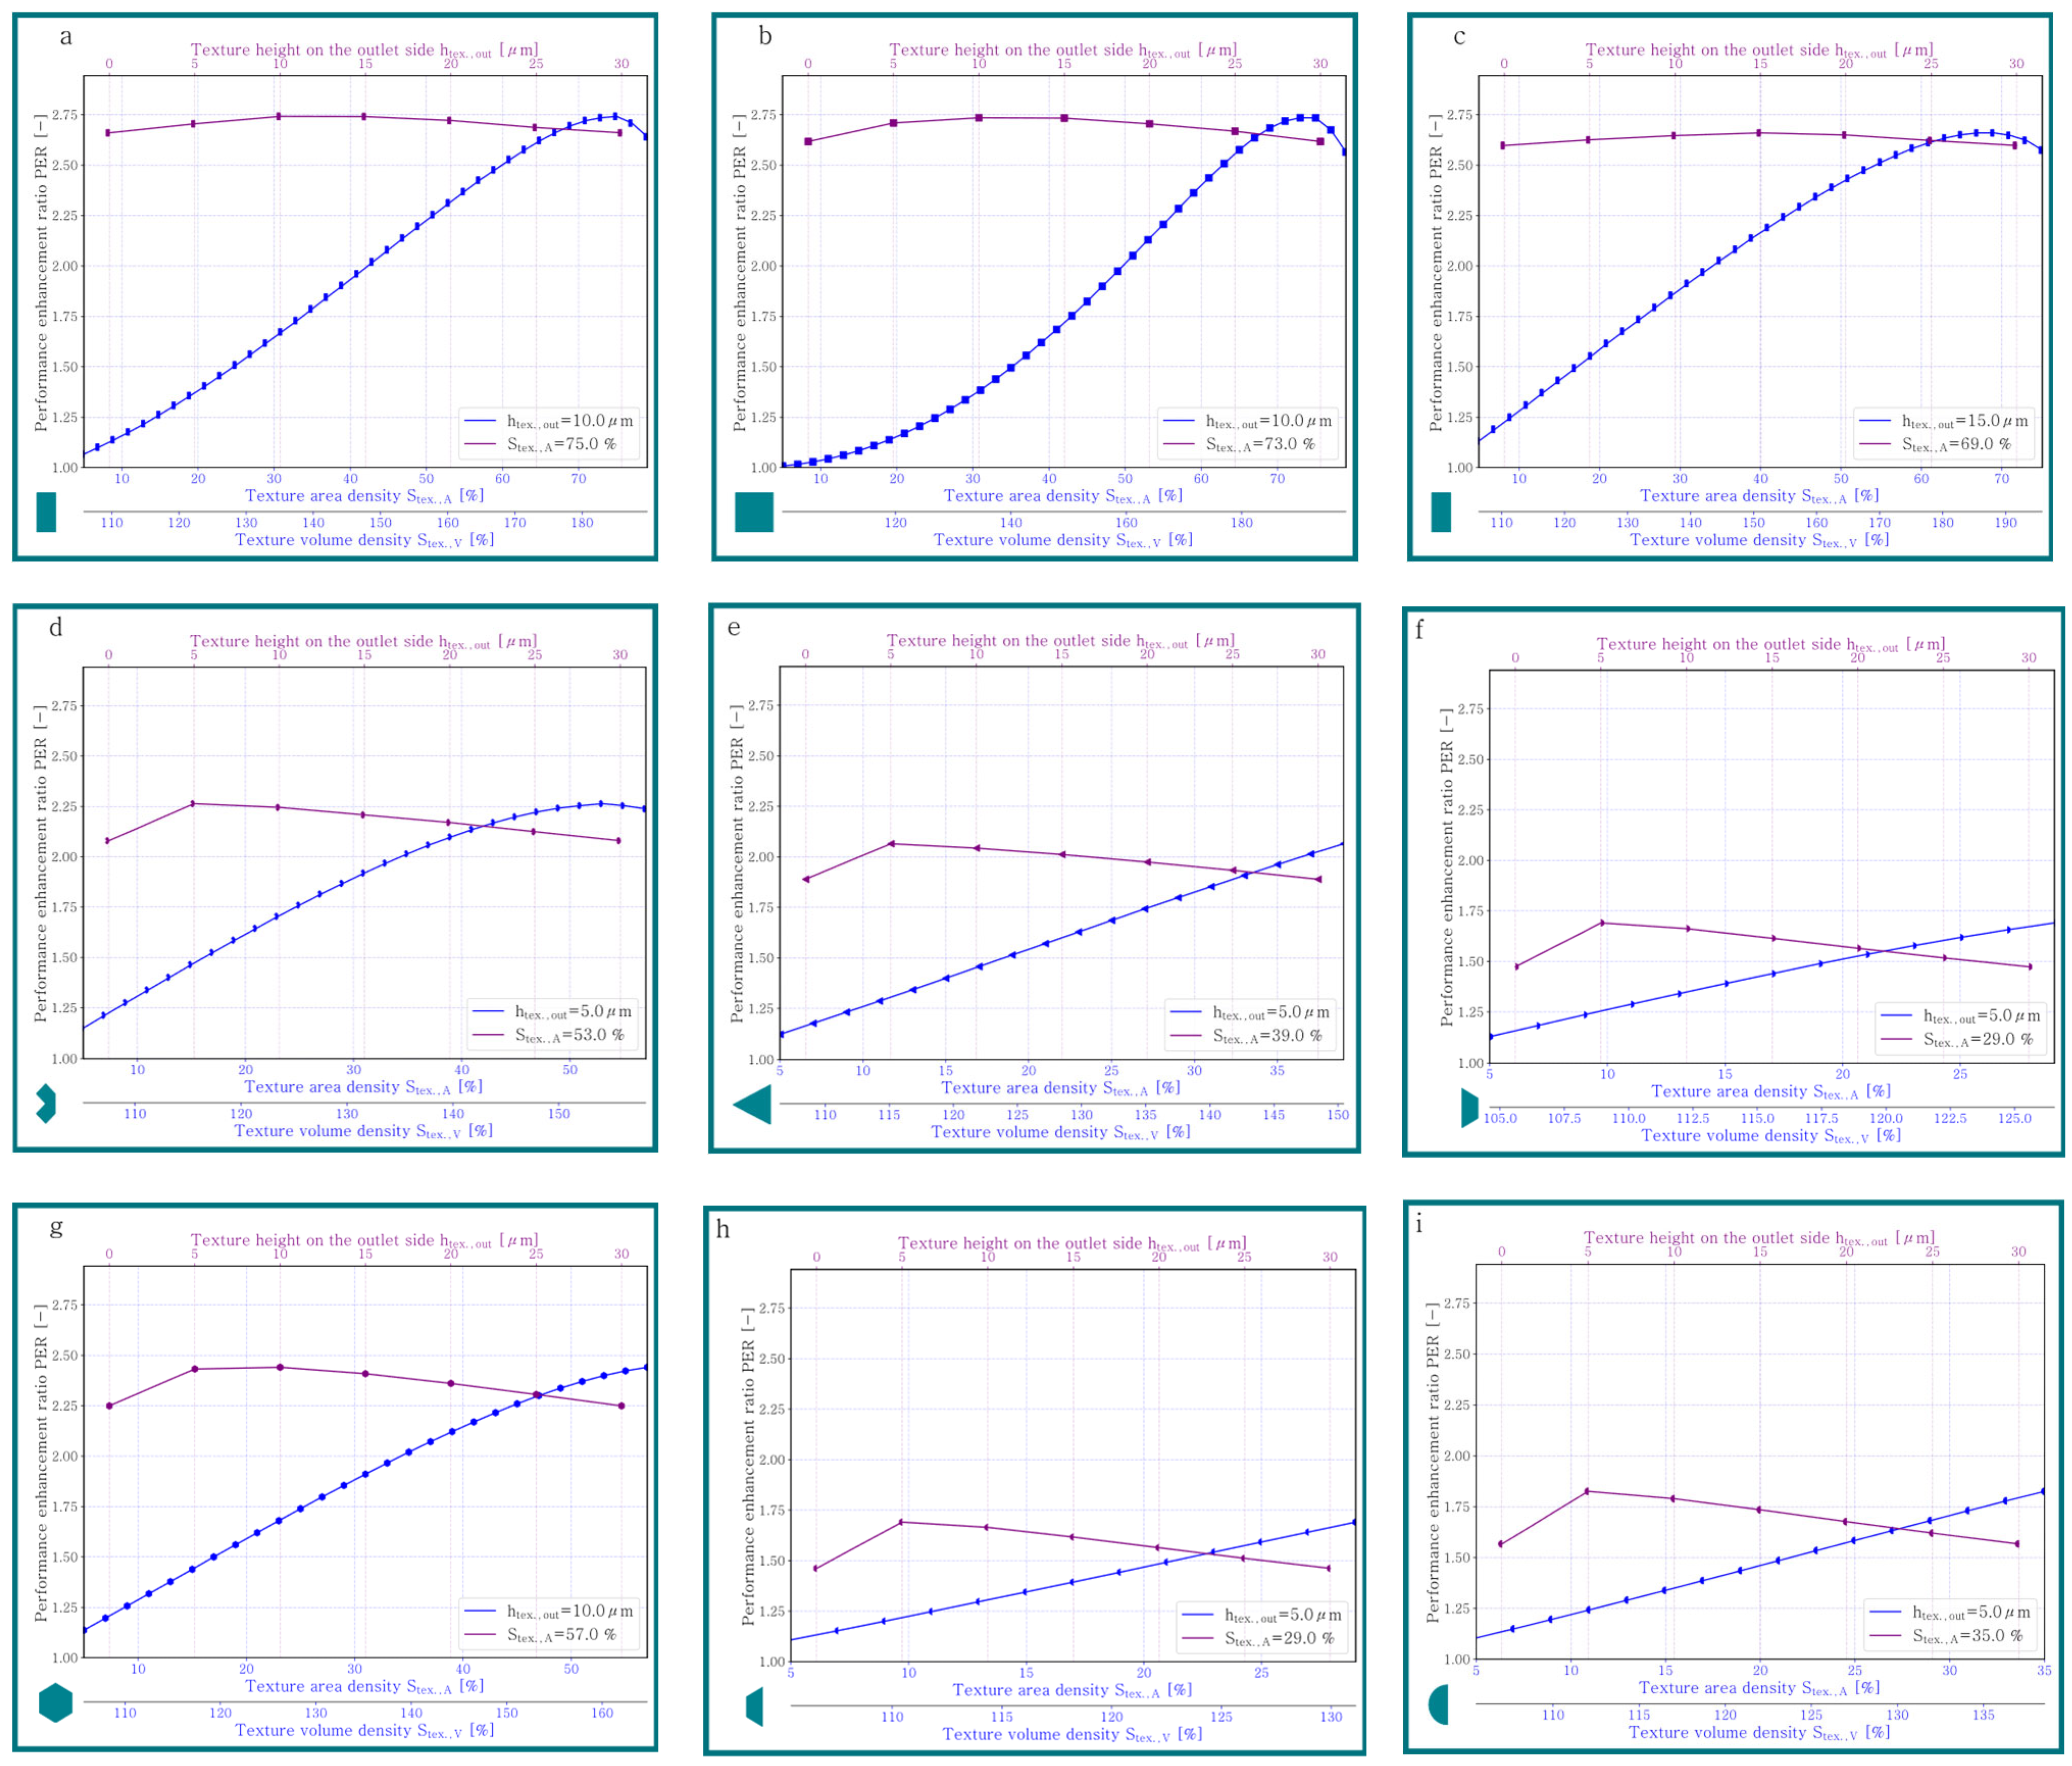
- Depending on the texture area density different texture geometries enhance the tribological performance the most (cf. Figure 11).
- The rectangle texture with a variable width enhances the tribological performance the most over a wide range of texture area densities (cf. example for and in Figure 11).
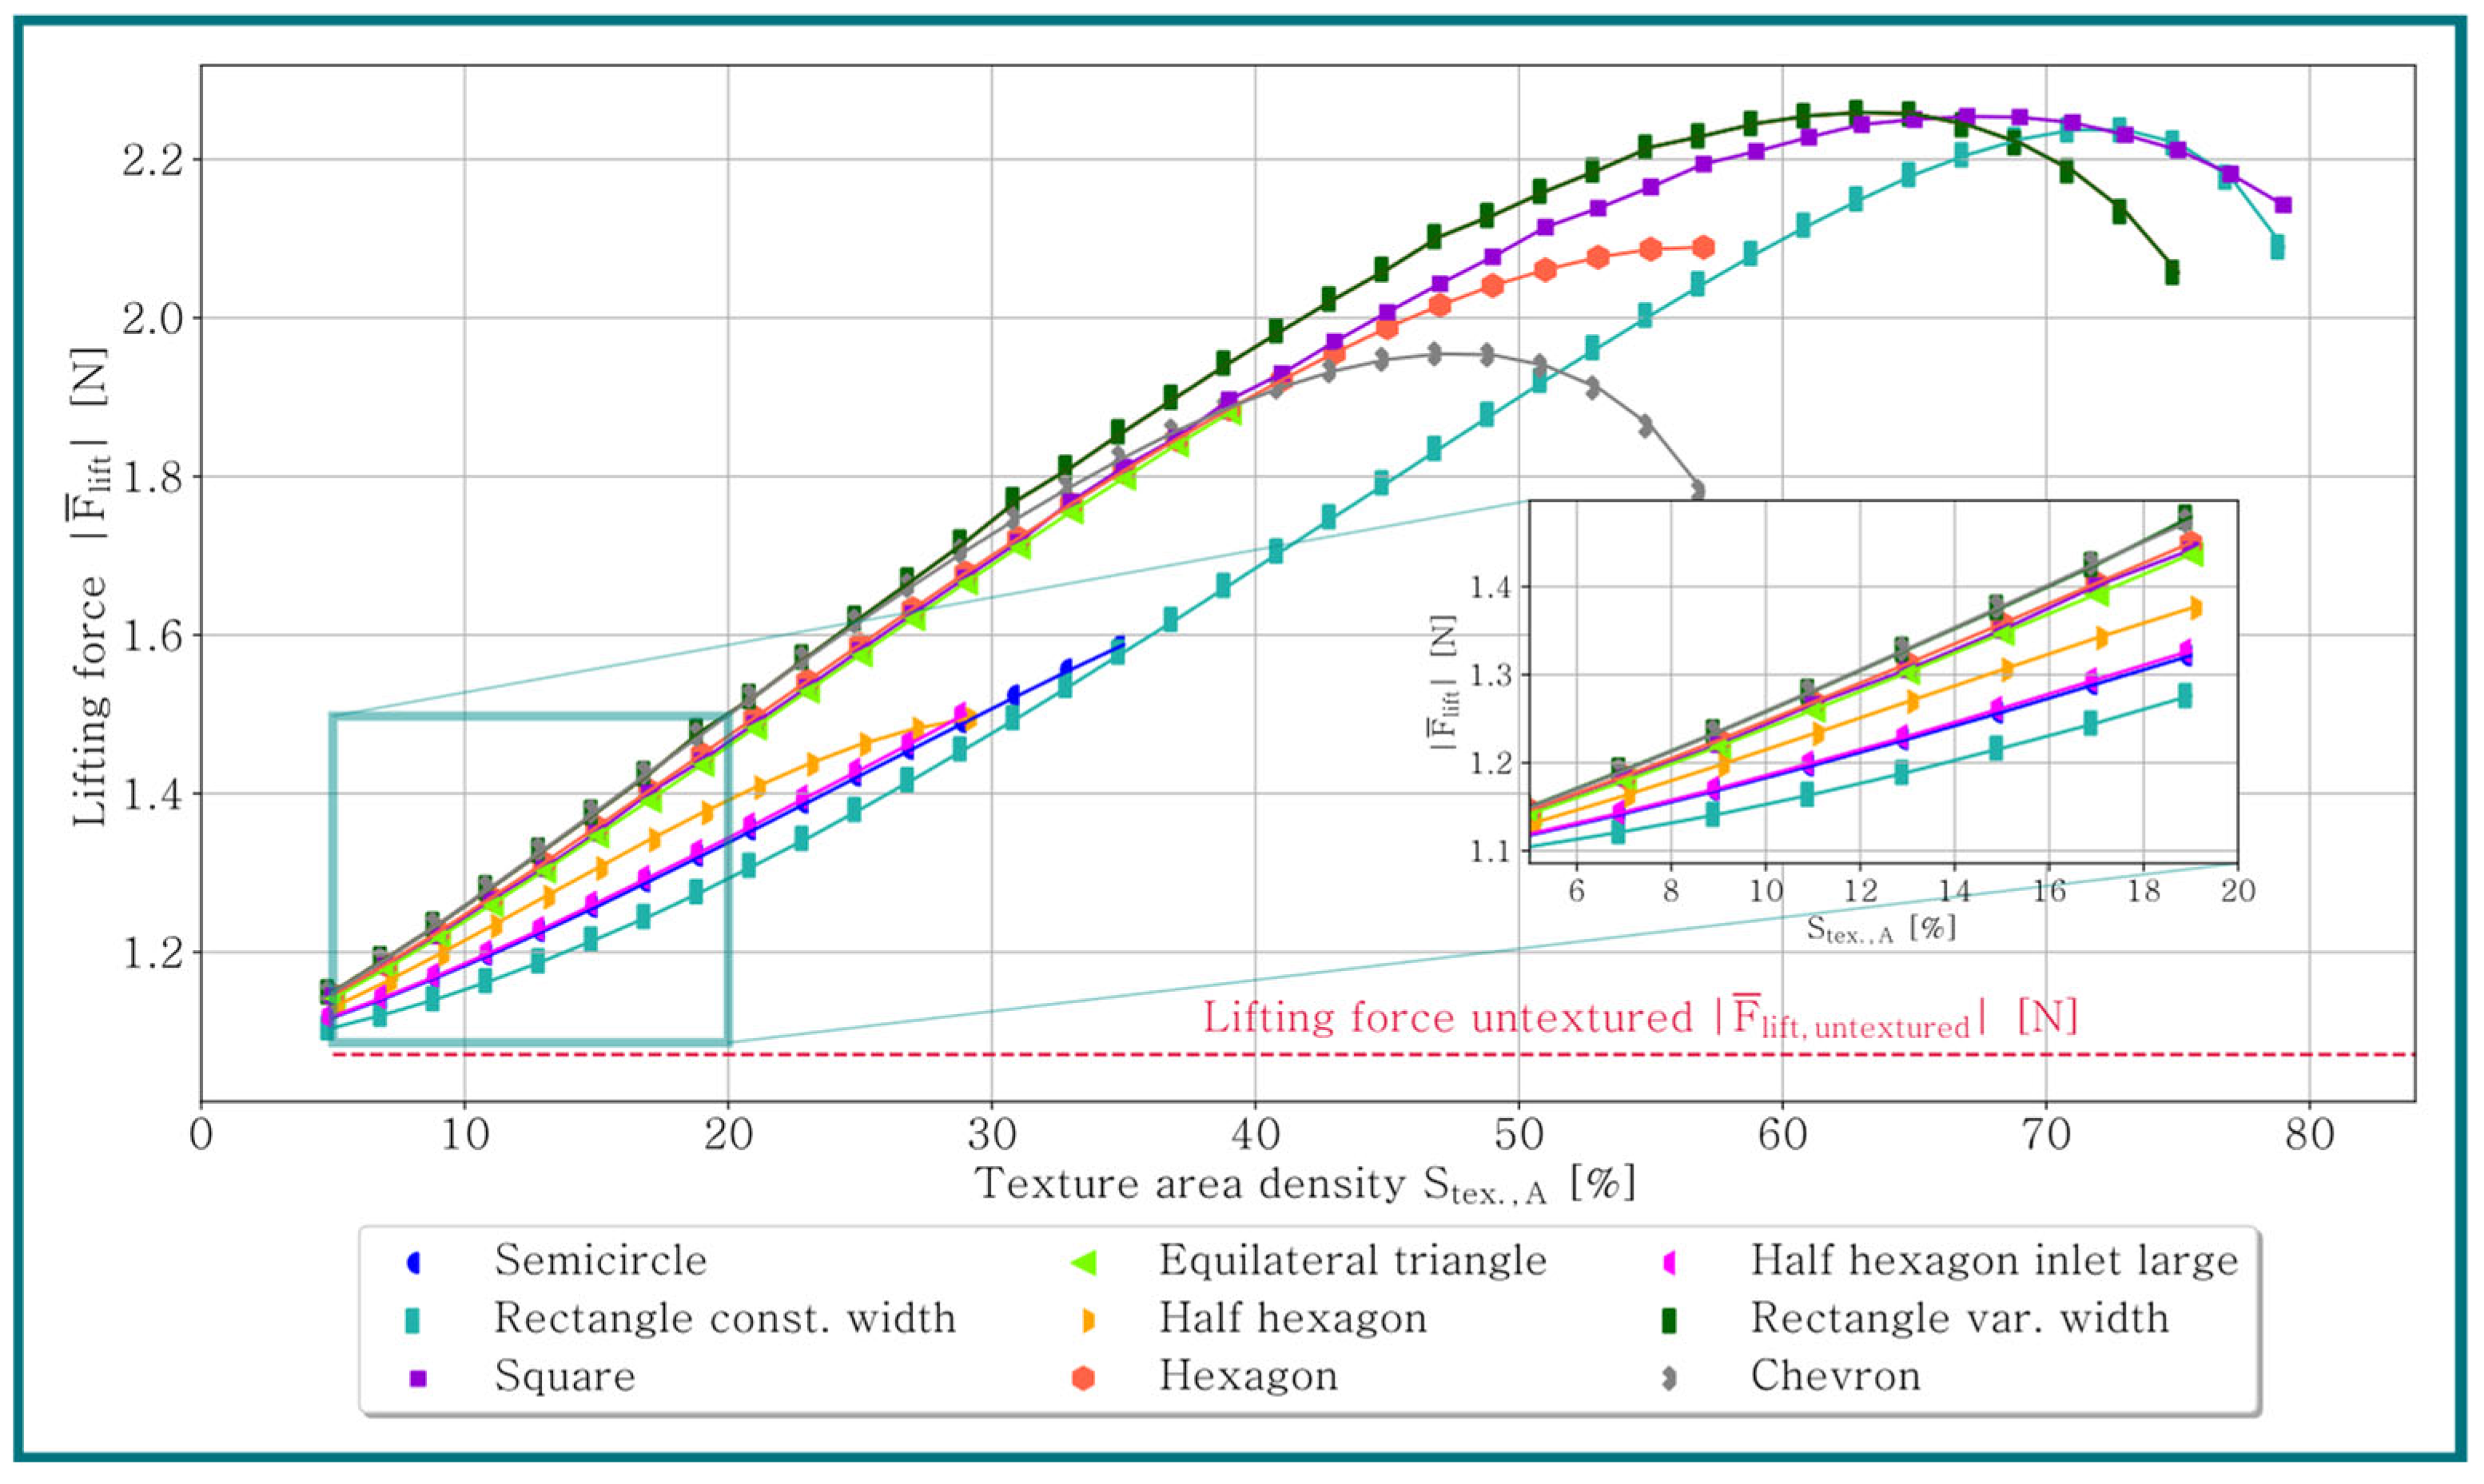
- For rectangle-, square- and chevron-shaped elements, a local maximum of the performance enhancement ratio (PER) exists. For all other geometries, simulations had to be aborted before reaching a maximum due to the requirement that the texture geometry cannot protrude the convergent oil film gap (cf. Figure 11).
- The drag force decreases with the increasing texture area density .
- A small step of the texture at the outlet side of the texture between 10 µm and 15 µm, corresponding to a pitch angle of the texture between 0.5° and 1.8°, improves the tribological performance (cf. Figure 11).
- The hexagon-shaped texture leads to the highest pressure, but as it is located in a smaller region, compared to other texture geometries, the lifting forces of the rectangle- and square-shaped textures are higher.
- Providing an additional volume flow at the inlet does not guarantee an improvement in tribological performance.
- Compared to a smooth convergent oil film gap, a significant increase in the volume flow can be observed (cf. Figure 11).
Author Contributions
Funding
Data Availability Statement
Conflicts of Interest
References
- Woydt, M. The importance of tribology for reducing CO2 emissions and for sustainability. Wear 2021, 474, 203768. [Google Scholar] [CrossRef]
- Grützmacher, P.G.; Profito, F.J.; Rosenkranz, A. Multi-Scale Surface Texturing in Tribology—Current Knowledge and Future Perspectives. Lubricants 2019, 7, 95. [Google Scholar] [CrossRef]
- Gussmagg, J.; Pusterhofer, M.; Summer, F.; Grün, F. Experimental visualization of the wear and scuffing evolution of a flake graphite cast iron cylinder liner. Wear 2023, 526, 204948. [Google Scholar] [CrossRef]
- Adatepe, H.; Bıyıklıoglu, A.; Sofuoglu, H. An experimental investigation on frictional behavior of statically loaded micro-grooved journal bearing. Tribol. Int. 2011, 44, 1942–1948. [Google Scholar] [CrossRef]
- Gropper, D.; Wang, L.; Harvey, T.J. Hydrodynamic lubrication of textured surfaces: A review of modeling techniques and key findings. Tribol. Int. 2016, 94, 509–529. [Google Scholar] [CrossRef]
- Vishnoi, M.; Kumar, P.; Murtaza, Q. Surface texturing techniques to enhance tribological performance: A review. Surf. Interfaces 2021, 27, 101463. [Google Scholar] [CrossRef]
- Lu, P.; Wood, R.J.K. Tribological performance of surface texturing in mechanical applications—A review. Surf. Topogr. Metrol. Prop. 2020, 8, 43001. [Google Scholar] [CrossRef]
- Marian, M.; Almqvist, A.; Rosenkranz, A.; Fillon, M. Numerical micro-texture optimization for lubricated contacts—A critical discussion. Friction 2022, 10, 1772–1809. [Google Scholar] [CrossRef]
- Bei, G.; Ma, C.; Wang, X.; Sun, J.; Ni, X. Study on Tribological Characteristics of Textured Surface under Convergent Oil Film Gap. Lubricants 2022, 10, 183. [Google Scholar] [CrossRef]
- Coblas, D.G.; Fatu, A.; Maoui, A.; Hajjam, M. Manufacturing textured surfaces: State of art and recent developments. Proc. Inst. Mech. Eng. Part J J. Eng. Tribol. 2015, 229, 3–29. [Google Scholar] [CrossRef]
- Osborn, L. Enhanced Tribological Properties of Surfaces Patterned with SU8/DLC Microstructures. Inq. Univ. Ark. Undergrad. Res. J. 2013, 15, 7. [Google Scholar]
- Dumitru, G.; Romano, V.; Weber, H.P.; Haefke, H.; Gerbig, Y.; Pflüger, E. Laser microstructuring of steel surfaces for tribological applications. Appl. Phys. A 2000, 70, 485–487. [Google Scholar] [CrossRef]
- Pettersson, U.; Jacobson, S. Tribological texturing of steel surfaces with a novel diamond embossing tool technique. Tribol. Int. 2006, 39, 695–700. [Google Scholar] [CrossRef]
- Duvvuru, R.S.; Jackson, R.L.; Hong, J.W. Self-Adapting Microscale Surface Grooves for Hydrodynamic Lubrication. Tribol. Trans. 2008, 52, 1–11. [Google Scholar] [CrossRef]
- Gherca, A.R.; Maspeyrot, P.; Hajjam, M.; Fatu, A. Influence of Texture Geometry on the Hydrodynamic Performances of Parallel Bearings. Tribol. Trans. 2013, 56, 321–332. [Google Scholar] [CrossRef]
- Singh, N.; Awasthi, R.K. Influence of texture geometries on the performance parameters of hydrodynamic journal bearing. Proc. Inst. Mech. Eng. Part J J. Eng. Tribol. 2021, 235, 2056–2072. [Google Scholar] [CrossRef]
- Uddin, M.S.; Ibatan, T.; Shankar, S. Influence of surface texture shape, geometry and orientation on hydrodynamic lubrication performance of plane-to-plane slider surfaces. Lubr. Sci. 2017, 29, 153–181. [Google Scholar] [CrossRef]
- Yu, H.; Wang, X.; Zhou, F. Geometric Shape Effects of Surface Texture on the Generation of Hydrodynamic Pressure Between Conformal Contacting Surfaces. Tribol. Lett. 2010, 37, 123–130. [Google Scholar] [CrossRef]
- Kumar, V.; Sharma, S.C. Influence of dimple geometry and micro-roughness orientation on performance of textured hybrid thrust pad bearing. Meccanica 2018, 53, 3579–3606. [Google Scholar] [CrossRef]
- Ji, J.; Fu, Y.; Bi, Q. Influence of Geometric Shapes on the Hydrodynamic Lubrication of a Partially Textured Slider With Micro-Grooves. J. Tribol. 2014, 136, 041702. [Google Scholar] [CrossRef]
- Wei, Y.; Tomkowski, R.; Archenti, A. Numerical Study of the Influence of Geometric Features of Dimple Texture on Hydrodynamic Pressure Generation. Metals 2020, 10, 361. [Google Scholar] [CrossRef]
- van Liem, N.; Zhenpeng, W.; Renqiang, J. Effect of shape/size and distribution of microgeometries of textures on tribo-performance of crankpin bearing. Proc. Inst. Mech. Eng. Part J J. Eng. Tribol. 2022, 236, 421–433. [Google Scholar] [CrossRef]
- Dobrica, M.B.; Fillon, M. About the validity of Reynolds equation and inertia effects in textured sliders of infinite width. Proc. Inst. Mech. Eng. Part J J. Eng. Tribol. 2009, 223, 69–78. [Google Scholar] [CrossRef]
- Almqvist, T.; Almqvist, A.; Larsson, R. A comparison between computational fluid dynamic and Reynolds approaches for simulating transient EHL line contacts. Tribol. Int. 2004, 37, 61–69. [Google Scholar] [CrossRef]
- Maier, M.; Pusterhofer, M.; Grün, F. Multiscale Wear Simulation in Textured, Lubricated Contacts. Coatings 2023, 13, 697. [Google Scholar] [CrossRef]
- Cupillard, S.; Glavatskih, S.; Cervantes, M.J. Inertia effects in textured hydrodynamic contacts. Proc. Inst. Mech. Eng. Part J J. Eng. Tribol. 2010, 224, 751–756. [Google Scholar] [CrossRef]
- Shibata, Y.; Enomoto, Y. Global Existence of Classical Solutions and Optimal Decay Rate for Compressible Flows via the Theory of Semigroups. In Handbook of Mathematical Analysis in Mechanics of Viscous Fluids; Giga, Y., Novotný, A., Eds.; Springer International Publishing: Cham, Switzerland, 2018; pp. 2085–2181. [Google Scholar]
- Scharf, R.; Maier, M.; Pusterhofer, M.; Grün, F. A Comprehensive Numerical Study of a Wedge-Shaped Textured Convergent Oil Film Gap. Lubricants 2024, 12, 121. [Google Scholar] [CrossRef]
- Concli, F. Equilibrium of a journal bearing: A simplified CFD-analytical coupled approach. WIT Trans. Eng. Sci. 2020, 128, 13–25. [Google Scholar]
- Merkle, C.L.; Feng, J.; Buelow, P.E. Computational modeling of sheet cavitation. In Proceedings of the 3rd International Symposium on Cavitation, Grenoble, France, 7–10 April 1998. [Google Scholar]
- Netgen/NGSolve Finite Element Tool. Available online: https://docu.ngsolve.org/latest/ (accessed on 27 August 2024).
- Savio, A.; Cianferra, M.; Armenio, V. Analysis of Performance of Cavitation Models with Analytically Calculated Coefficients. Energies 2021, 14, 6425. [Google Scholar] [CrossRef]
- Hong, B.; Lv, S.; Liu, Q.; Hou, J.; Ji, Y.; Gao, Z.; Gao, J.; Hu, J. A Simple Method to Evaluate the Vapor Pressure of Transformer Oil at Various Temperatures. Adv. Eng. Res. 2018, 2018, 170. [Google Scholar]
- OpenFoam. Available online: https://www.openfoam.com/ (accessed on 27 August 2024).
- Lang, O.R.; Steinhilper, W. Gleitlager: Berechnung und Konstruktion von Gleitlagern mit konstanter und zeitlich veränderlicher Belastung. In Mit 6 Arbeitsblättern, 1978th ed.; Springer: Berlin/Heidelberg, Germany, 2014. [Google Scholar]
- Sharma, S.; Jamwal, G.; Awasthi, R.K. Numerical study on steady state performance enhancement of partial textured hydrodynamic journal bearing. Ind. Lubr. Tribol. 2019, 71, 1055–1063. [Google Scholar] [CrossRef]
- Rahmani, R.; Shirvani, A.; Shirvani, H. Analytical analysis and optimisation of the Rayleigh step slider bearing. Tribol. Int. 2009, 42, 666–674. [Google Scholar] [CrossRef]
- Morris, N.; Leighton, M.; de La Cruz, M.; Rahmani, R.; Rahnejat, H.; Howell-Smith, S. Combined numerical and experimental investigation of the micro-hydrodynamics of chevron-based textured patterns influencing conjunctional friction of sliding contacts. Proc. Inst. Mech. Eng. Part J J. Eng. Tribol. 2015, 229, 316–335. [Google Scholar] [CrossRef]


| Parameters | |
|---|---|
| Density oil liquid | 860 kg/m3 |
| Density oil vapor | 0.13 kg/m3 |
| Dynamic viscosity liquid | 130 mPa s |
| Dynamic viscosity vapor | 0.02 mPa s |
| Condensation coefficient | 33.3 |
| Vaporization coefficient | 0.00155 |
| Vapor pressure | 165 Pa |
| Input velocity | 5 m/s |
| Reference time | |
| Geometry | [°] | |
|---|---|---|
| Rectangle constant width | 0.66 | Local maximum exists |
| Square | 0.67 | |
| Rectangle variable width | 0.52 | |
| Chevron | 0.94 | |
| Equilateral triangle | 0.87 | No local maximum exists |
| Half hexagon | 1.75 | |
| Hexagon | 0.71 | |
| Half hexagon (inlet large) | 1.75 | |
| Semicircle | 1.52 |
Disclaimer/Publisher’s Note: The statements, opinions and data contained in all publications are solely those of the individual author(s) and contributor(s) and not of MDPI and/or the editor(s). MDPI and/or the editor(s) disclaim responsibility for any injury to people or property resulting from any ideas, methods, instructions or products referred to in the content. |
© 2024 by the authors. Licensee MDPI, Basel, Switzerland. This article is an open access article distributed under the terms and conditions of the Creative Commons Attribution (CC BY) license (https://creativecommons.org/licenses/by/4.0/).
Share and Cite
Scharf, R.; Pusterhofer, M.; Gussmagg, J.; Grün, F. An Investigation into the Optimal Dimple Geometry in a Single-Dimple Sliding Contact. Machines 2024, 12, 622. https://doi.org/10.3390/machines12090622
Scharf R, Pusterhofer M, Gussmagg J, Grün F. An Investigation into the Optimal Dimple Geometry in a Single-Dimple Sliding Contact. Machines. 2024; 12(9):622. https://doi.org/10.3390/machines12090622
Chicago/Turabian StyleScharf, Raphael, Michael Pusterhofer, Jakob Gussmagg, and Florian Grün. 2024. "An Investigation into the Optimal Dimple Geometry in a Single-Dimple Sliding Contact" Machines 12, no. 9: 622. https://doi.org/10.3390/machines12090622
APA StyleScharf, R., Pusterhofer, M., Gussmagg, J., & Grün, F. (2024). An Investigation into the Optimal Dimple Geometry in a Single-Dimple Sliding Contact. Machines, 12(9), 622. https://doi.org/10.3390/machines12090622