Article

Analytical Modeling and Experimental Validation of the Coefficient of Friction in AlSi10Mg-SiC Composites

1
Department of Mathematics, Abdus Salam School of Mathematical Sciences (ASSMS), 68-B, New Muslim Town, Lahore 54600, Pakistan
2
Institute of Metal Science, Equipment and Technologies with Center for Hydro- and Aerodynamics “Acad. A. Balevski”, Bulgarian Academy of Sciences, 1574 Sofia, Bulgaria
*
Author to whom correspondence should be addressed.
Machines 2024, 12(9), 638; https://doi.org/10.3390/machines12090638
Submission received: 22 July 2024 / Revised: 9 September 2024 / Accepted: 10 September 2024 / Published: 12 September 2024
(This article belongs to the Special Issue Composites Machining in Manufacturing)

Abstract

:
Recognizing the lightweight nature and superior tribological properties of Al-based metal matrix composites, this study introduces a novel analytical model based on polynomial approximations, offering new insights into the mechanisms of dry friction in AlSi10Mg-SiC composite materials. Key findings highlight a significant reduction in the coefficient of friction (COF) and oscillation amplitudes in SiC-reinforced composites, indicating superior tribological performance compared to their unreinforced counterparts. This behavior is attributed to the effective distribution of SiC particles within the aluminum matrix, which mitigates the stick–slip motion commonly observed under dry sliding conditions. Importantly, the model using polynomial approximations is noted for its simplicity and ease of implementation in practice. The study’s conclusions not only underscore the benefits of SiC reinforcement in enhancing wear resistance but also contribute to the broader field of materials science by providing a robust framework for the predictive modeling of COF in various composite systems.

1. Introduction

Aluminum-based metal matrix composites (AMMCs) have emerged as a focal point in the study of dry friction due to their unique combination of lightweight properties and enhanced mechanical strength. These composites, incorporating reinforcements such as B4C [1], Al2O3 [2,3], and SiC [4,5], have been shown to significantly alter tribological behavior under dry sliding conditions, offering the potential for improved wear resistance and reduced friction. The integration of SiC particles into aluminum matrices not only contributes to the material’s hardness but also affects its frictional characteristics, making AMMCs particularly interesting for applications where both high performance and durability are required [4,6]. The exploration of dry friction in these composites is crucial for advancing the understanding of their behavior in real-world applications, where lubrication may be minimal or absent, and wear resistance is critical for the longevity and reliability of mechanical systems [7,8]. To ensure the effective application of AMMCs in real-world scenarios, a deep dive into the underlying frictional forces is essential, leading to the eventual necessity of their modeling.
Modeling the dry sliding wear behavior of AMMCs presents a complex challenge that requires a nuanced understanding of the material’s microstructure, the external conditions under which it operates, and the intrinsic properties of both the matrix and the reinforcing particles. The integration of hard particles into aluminum matrices has been shown to significantly influence the wear mechanisms, primarily through the processes of adhesion, plowing, and micro-cutting, leading to a diverse range of wear behaviors under dry sliding conditions [9,10]. These behaviors are often quantitatively described through wear models that consider the applied load, sliding speed, temperature, and material properties such as toughness and hardness [3,11,12,13].
One particularly interesting phenomenon observed in the context of dry sliding wear of different materials is the stick–slip motion. Stick–slip occurs when two surfaces alternate between sticking to each other and sliding over one another, typically resulting in a series of rapid starts and stops that can be felt as vibrations or heard as a squeaking noise [14]. This behavior is attributed to the cyclic variation in the coefficient of friction (COF) between the surfaces in contact. Research into the dynamics of systems with smooth friction–velocity curves, such as models of nonlinear spring masses, has shed light on the underlying mechanisms of the stick–slip motion. These studies reveal how various factors, including excitation speed, damping coefficients, and the stiffness and mass of components, influence the stability and behavior of stick–slip phenomena [15]. Furthermore, the analytical work presented in [16] specifically addresses stick–slip whirling oscillations in rotor/stator rubbing systems, offering a detailed examination of self-excited dry friction backward whirls and their impact on system dynamics, thereby enriching the understanding of the complex behaviors associated with the stick–slip motion. Research has particularly focused on the impact of harmonic external forces, leading to the development of two primary analytical strategies. Initially, exact solutions were explored for systems with one or two dimensions. Den Hartog [17] introduced a precise solution for the dynamic behavior in systems with a single degree of freedom, assuming the static and dynamic friction coefficients are the same. Following this, Shaw [18] adapted Den Hartog’s findings to situations where the static and dynamic friction coefficients differ, providing an analysis of the motion’s stability. Additionally, the work by Bensoussan et al. [19] introduces a novel approach using the theory of variational inequalities to elegantly and synthetically derive the existence and uniqueness of solutions for dynamical systems with dry friction under external forces, such as thermal expansion, further advancing the comprehension of friction-induced dynamics.
Despite the significant advancements in understanding the tribological behavior of AMMCs, a comprehensive model that accurately predicts the dry sliding wear behavior, especially under conditions leading to the stick–slip motion in open-cell structures and considering the reinforcement with non-homogeneously distributed SiC particles, remains elusive. This gap in the literature highlights the need for a more detailed exploration of the frictional characteristics of open-cell AMMCs, especially those reinforced with SiC particles. By focusing on the nuanced impact of SiC reinforcement on the friction properties of AlSi10Mg composites, the current research seeks to bridge this gap, offering new insights into the predictive modeling of AMMCs’ tribological performance.
The aim of the study is the development of an innovative analytical model that incorporates polynomial approximations to describe the COF’s dynamics, thus enabling a nuanced understanding of frictional interactions within the AlSi10Mg-SiC composite. This model is designed to account for the intricate oscillatory behavior of the COF. Building upon the insights obtained from a preceding investigation [20], this research aims to make significant strides in the predictive modeling of AMMCs’ tribological behavior. By providing a more accurate prediction model for dry sliding wear, especially in scenarios prone to the stick–slip motion, the study endeavors to offer a methodological approach for anticipating the wear characteristics of novel composite materials. The steady-state regime was chosen due to its more stable and consistent frictional behavior compared to the running-in phase, where extremes such as abrupt increases in wear or friction introduce significant variability. By focusing on the steady-state regime, the study seeks to create a reliable and generalizable model that can be applied in various engineering contexts, such as sliding bearings, where consistent performance is critical for optimizing material selection and ensuring the longevity of mechanical systems. The development of an analytical model for predicting COF is driven by the need for more efficient and reliable design processes in engineering applications. Such a model offers the ability to predict frictional behavior under varying conditions, which is essential for optimizing material performance and ensuring the longevity of mechanical systems. Importantly, the model utilizing polynomial approximations distinguishes itself through its simplicity and straightforward implementation in practical scenarios. By reducing reliance on extensive experimental testing, the model provides a cost-effective and time-efficient approach to material selection and design, particularly in industries where precise friction management is critical. Its computational efficiency facilitates swift execution on modern hardware, rendering it exceedingly accessible for engineers and researchers desiring to apply these insights toward the design and optimization of AlSi10Mg-SiC composites. This approach thereby enhances the composites’ application across a broad spectrum of engineering domains, leveraging the derived insights for improved material performance and utility. This research aims to deepen the understanding of friction processes in novel composite materials, thereby facilitating their optimized use in various engineering domains.

2. Materials and Methods

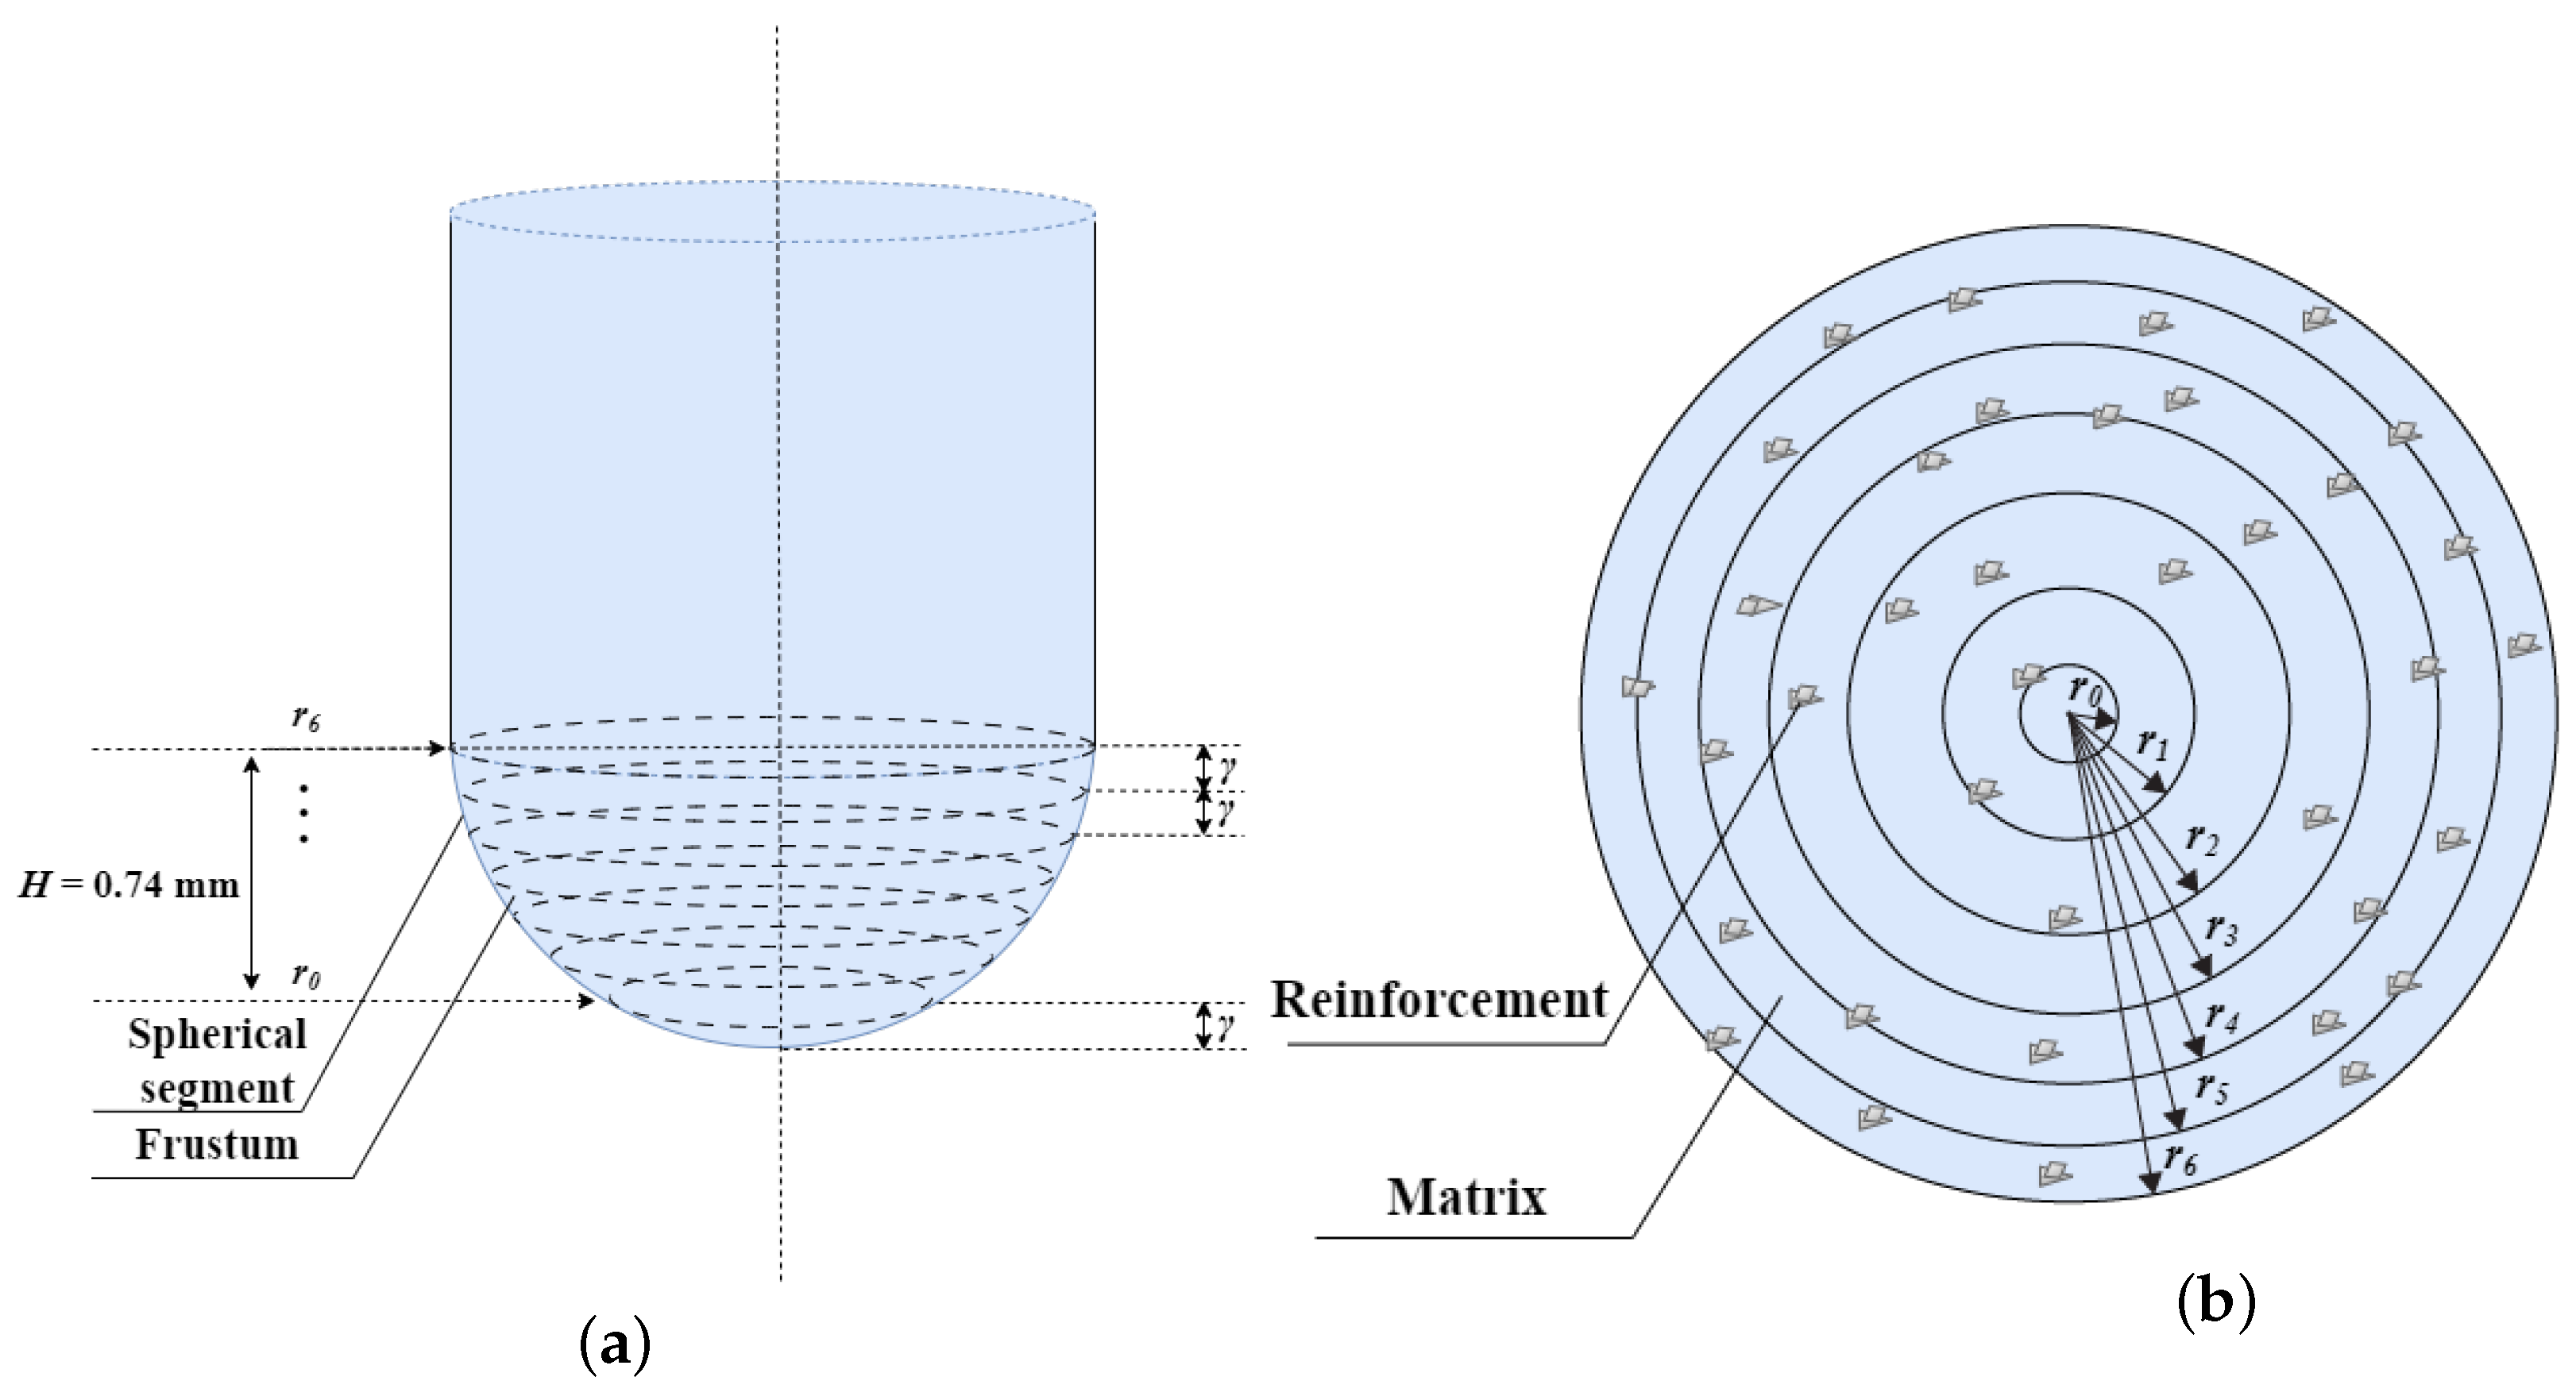
2.1. Fabrication of Composite Materials

Open-cell AlSi10Mg-SiC composites were fabricated by squeeze casting, a method selected for its proficiency in producing components with high integrity, minimal porosity, and enhanced mechanical properties [21,22]. High pressure (80 MPa) applied to the molten AlSi10Mg alloy during solidification ensures improved compaction and bonding of the SiC particles within the matrix, resulting in composites with superior hardness and wear resistance. Such a process yields composites exhibiting superior hardness and wear resistance, which is ideal for components requiring complex shapes and thin walls due to precise control over the microstructure not typically achievable with conventional casting methods. NaCl particles were used for salt preform preparation via the replication method to achieve the desired open-cell structure with pore sizes of 1000–1200 µm. Following this, the salt preform was infiltrated with the AlSi10Mg alloy, and the NaCl particles in the obtained composite were subsequently removed using an ultrasonic cleaner filled with 79 °C distilled water, perfecting the open-cell structure. AlSi10Mg alloy was chosen as the matrix material owing to its notable strength-to-weight ratio, exceptional castability, and robust mechanical properties at elevated temperatures. The incorporation of 5 wt.% SiC particles aimed to augment the tribological performance of the alloy, capitalizing on AlSi10Mg’s inherent properties to meet the requirements of applications necessitating both lightweight and durable materials. The particle size range for SiC, between 300 and 400 µm, was selected to strike a balance between enhancing the mechanical strength and wear resistance of the composite.
The fabrication process of the AlSi10Mg-SiC composites is elaborated in [20], which offers a foundational insight into the material’s microstructural attributes, significantly contributing to its observed tribological behavior. The present study builds upon this work, with the sole variation being the pore sizes of the composites: in the current investigation, the sizes range between 1000–1200 µm as opposed to the 800–1000 µm described previously, thereby examining the effects of this modification on the tribological properties.

2.2. Characterization Methods

Wear testing was performed using a pin-on-disc apparatus Ducom Rotary tribometer, TR-20 Ducom model (Bangalore, India), where a pin with a spherical tip (20 mm high and 10 mm in diameter) reinforced by 5 wt.% SiC particles (0.4 mm diameter) was rubbed against a rotating steel counter-disc made of steel EN-31, with a hardness of 62 HRC. The mean value of the asperity was measured at 1.5 µm (Ra), indicating the average roughness of the counter-disc’s surface. The experiment was conducted with a normal force (N) of 50 N and a linear velocity (v) of 1 m/s. The time intervals [ti−1,ti], where i ranges from 1 to n, were divided into 463 points, providing a detailed temporal analysis of the experiment. The diameter of the pin’s contact zone at the end of the experiment was measured to be 5.25 mm. This measurement allowed for the calculation of the corresponding radius (rw) of 2.625 mm. Additionally, the maximum distance measured in the vertical direction (ywymax) was determined to be 0.74 mm, which corresponds to the height of the spherical cap formed at the contact zone.
To analyze the evolution of the friction process, the experiment traced the COF values at 463 points in a time interval of 420 s, identifying two distinct material types: type-E, without reinforcing particles, and type-SE, reinforced with SiC particles composite. The goal was to quantitatively understand the COF evolution over time, focusing on the distinct behaviors of type-E and type-SE materials. For the analytical approximation of COF evolution, a polynomial model was employed to describe the oscillatory behavior of the COF for both material types. This approach allowed for a precise approximation of the COF’s dynamics over the experimental duration. The COF values for type-E and type-SE materials were modeled as functions of time, with polynomials capturing the mean, maximum, and minimum COF values across specified intervals. To determine the appropriate degree of the polynomial, various polynomial degrees were tested to capture the oscillatory behavior of the COF while avoiding overfitting. Higher-degree polynomials offer more flexibility to fit the data but risk fitting noise rather than the underlying trend. In this study, a third-degree polynomial was chosen for the mean COF approximation, as it provided a balance between fitting the data accurately and maintaining generalizability. For the upper and lower bounds (maximum and minimum COF), higher-degree polynomials (up to the sixth degree) were used, as these were better suited to model the more extreme deviations in the data. The coefficients a j for each degree of the polynomial were obtained through the least squares fitting process using standard numerical libraries. The goodness-of-fit for each polynomial was quantified by calculating the root mean square error (RMSE), providing a measure of how well the polynomial fits the smoothed experimental data. Additionally, residuals between the fitted and observed data were analyzed to ensure the model captured the underlying behavior without systematic bias. This mathematical framework facilitated a deeper understanding of the tribological characteristics of each material type, highlighting the influence of reinforcement on frictional behavior.

3. Results and Discussion

3.1. Experimental Results

In the experiment, two types of materials are utilized for the pin: the first type, which is not reinforced and has a COF denoted by μ E , and the second type, a specially engineered composite reinforced with ceramic particles with a COF denoted by μ S E and reinforced by SiC particles at a concentration of 5 wt.%. The pin is positioned orthogonally to the horizontal counter-disc surface. The objective of this experiment is to monitor the evolution of the COF values at specific time intervals [ti−1,ti] (i = 1, …, n), where n = 463 . Consequently, the COF values are recorded from μ 1 = μ ( t 1 ) to μ 463 = μ ( t 463 ) .
By analyzing the COF values obtained during the entire time period, one can study the evolution of the friction process in the experiment.
The resulting data for both COF μ E and μ S E are depicted in both curves in Figure 1. From the given subinterval [ t 67 ; t 463 ] [ t 1 ; t 463 ] , six new subintervals are combined, sweeping [ t 67 ; t 463 ] so that the evolution process can be traced more easily. The renumbered points begin at t 0 and continue to t 6 , corresponding to the original points t 67 through t 463 . The six new subintervals are detailed in Table 1.
To explore the SE-type material, the geometric model shown in Figure 2 is used. The new renumerated six subintervals are provided in Table 1:
t 67 t 0 , t 133 t 1 , t 199 t 2 , t 265 t 3 , t 331 t 4 , t 397 t 5 , t 463 t 6 .
For each time subinterval, a corresponding subinterval in the scale of r w = 2.625 [ mm ] is assigned, as shown in Table 2.
To examine the friction process between the pin for the SE-type composite and the counter-disc, an imaginary segmentation of the pin’s contact zone is considered, along with the worn-out part of the pin’s friction surface. Figure 2a shows that the diameters of the circular segments increase over time. Each segment contains two types of contact patches: the first type, due to the hard phase, forms an area that is less than or equal to 5 wt.% of the whole, as depicted in Figure 2b. These correspond to particles with greater hardness. The second type of contact patch is due to the matrix material, the AlSi10Mg alloy, which has a lower hardness compared to the ceramics. Note that after finishing the experiment, the pin’s wear in a vertical direction is H = 0.74 [ mm ] , i.e., the wear part is a “cap” of the spherical surface with the measured height H. To determine the segment’s measures, elementary geometric properties of the circle and its radius r j are used. Then, the following formula can be applied:
r j = ( j + 1 ) γ [ 2 R ( j + 1 ) γ ] , j = 0 , 1 , 2 , , 6 ,
where γ is the height (thickness) of the spherical frostums. It is obtained by γ = H / 7 , where H = 0.74 [mm] is the measured height of the wear in a vertical direction, which has a cap shape with the final radius r 6 , and R = 5 [mm]. The choice of equal distances γ between the sections of the frustum is due to the non-homogeneous and friable nature of the material, necessitating the determination and averaging of this distance to ensure accurate analysis of the wear process. The measuring shows that the evolution of the wear volume can be taken linearly in the frame of very small error (about 1–2%). Thus, the calculated radii (in [mm]) are as follows:
r 0 = 1.026 ; r 1 = 1.443 ; r 2 = 1.758 ; r 3 = 2.019 ; r 4 = 2.244 ; r 5 = 2.445 ; r 6 = 2.625 .
Note that the first part in the shape of a cap is ignored since the evolution process is analyzed from the first time interval [ t 0 ; t 1 ] and so on, that is [ 60 ; 120 ] (in [s]), as shown in Table 1. After the experiment, a circular section appears on the pin head with a radius of r w r max r 6 due to total wear. A finite number of adjacent subintervals among all 463 are combined to reduce the number of segments to six. Consequently, the circular wear zone is divided into a finite number of segments. In Figure 2b, it can be seen that in every segment there is a finite number of orthogonal projections of harder particles varying from 0 % to an uncertain number of percentages depending on the configuration of the harder particles in the corresponding frustums due to the non-homogeneous structure of the explored material.
The diameter of the ensemble of reinforcement particles is
d = max j l j , j = 1 , 2 , , m ( m number of all reinforcement particles in the pin s body ) ,
where l j is the diameter of the j-th particle, the maximum distance among all pairs of points belonging to the j-th particle, and d is the largest l j among all m particles with diameters l 1 , l 2 , , l m , which constitute 5 wt.% of the total volume of the pin.
The possibility that some of the hard particles may be positioned across two adjacent segments is not precluded. The subsequent analysis will focus on the friction process occurring at the interface between the pin and the counter-disc surface.

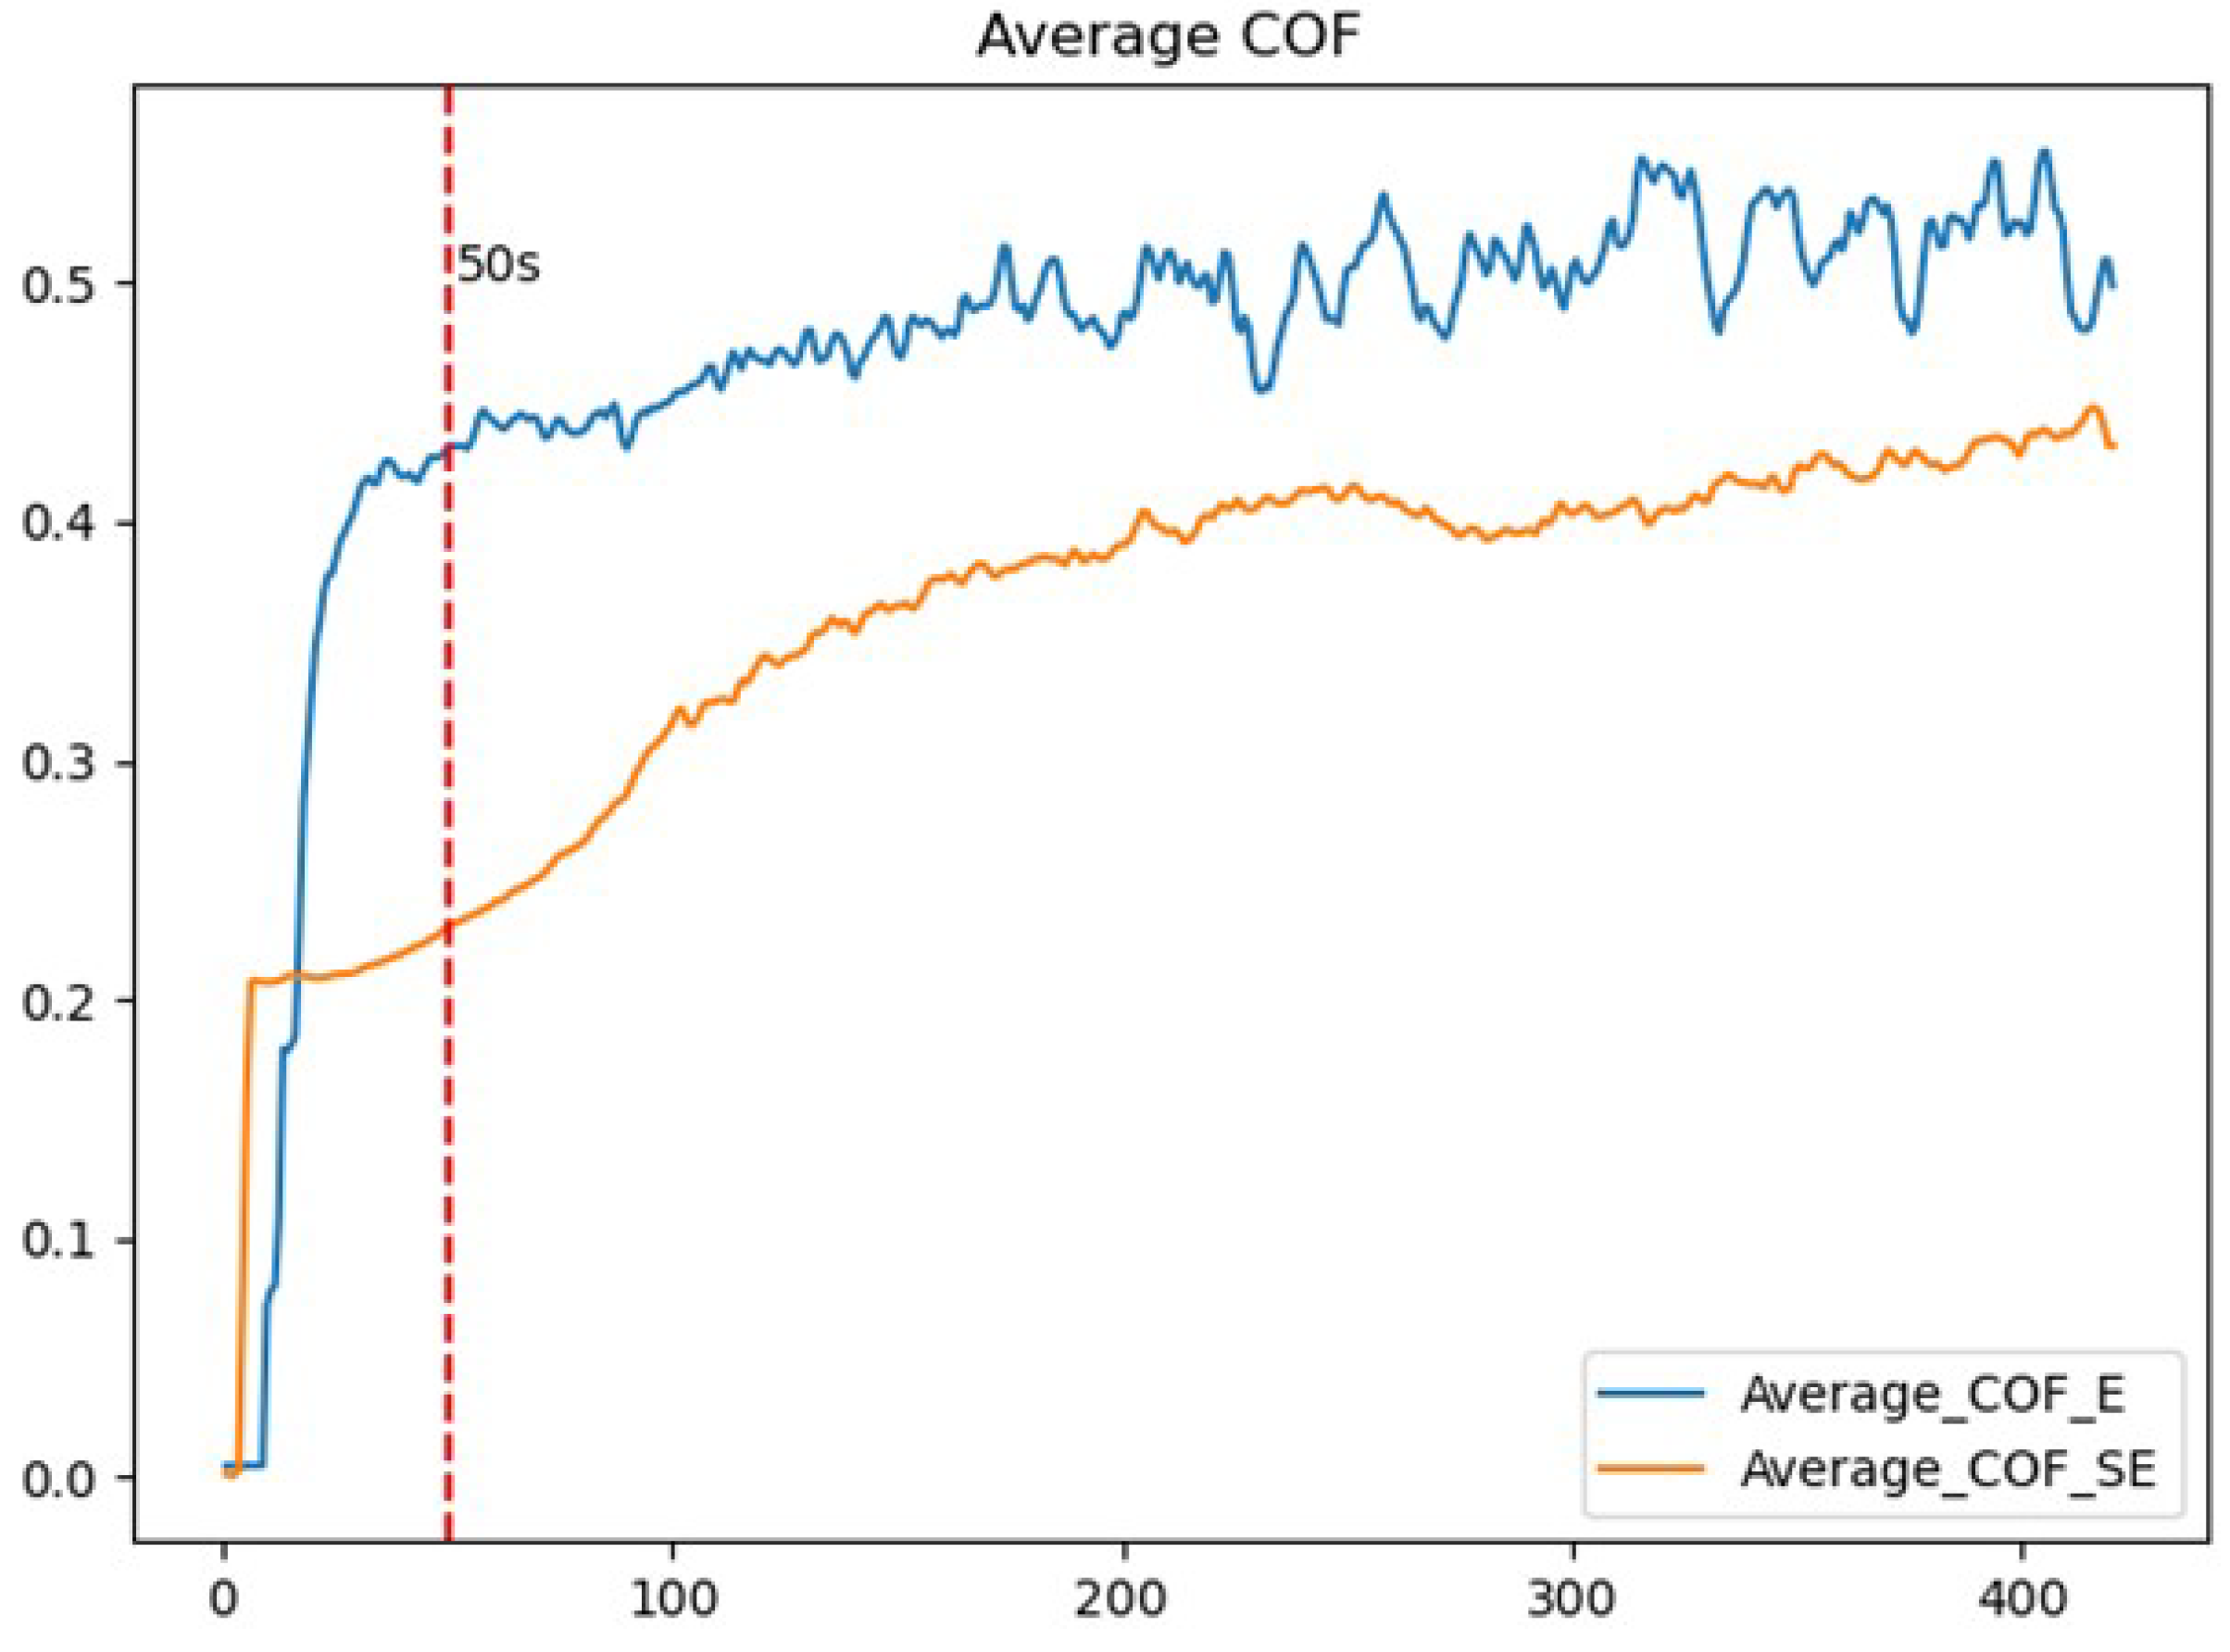
3.2. Mechanism of the Friction Coefficient Oscillation

From friction theory, it is known that when two surfaces slide against each other in a dry friction scenario, the motion is oscillatory rather than smooth. The phenomenon of ‘stick–slip’ oscillations has been analyzed by many authors in terms of kinetic friction-=velocity and the static friction-time of stick characteristics of the rubbing surfaces. For some details on this phenomenon, see E. Rabinowitcz [14]. The coefficient of friction, denoted as μ, can be defined as μ = F / N , where F represents the tangential (frictional) force and N is the normal force. The frictional force F does not remain constant but varies significantly over certain time intervals, as shown in (p. 47) [23]. This oscillatory effect is due to the ‘stick–slip’ effect and the inhomogeneity of the pin’s material, as observed in the geometric model, see Figure 2. The current experiment includes two types of pin materials, one being without reinforcement and the other being the composite with a reinforcing phase containing 5 wt.% SiC particles, where both the kinetic coefficient μ k and static coefficient μ s are established. The oscillation phenomenon is observed to a greater extent in material of the E type, primarily due to the ‘stick–slip’ effect. Through the pin-on-disc experiment, the values of the COF μ i = μ ( t i ) (for i = 1 , 2 , , 463 , thus n = 463 ) are determined (see Figure 2a and Table 1 and Table 2). In the case of the E-type material, which is homogeneous, the ‘stick–slip’ effect is clearly pronounced, resulting in greater oscillations of COF, unlike the type-SE material, where a comparatively smoother friction process is observed, as depicted in Figure 1. The contact patches are situated on imaginary segments appearing after each subinterval Δ t i with a mean radius of r ˜ i = 1/2 ( r i 1 + r i ) , i = 1 , . . . , 6 as the difference Δ r i = r i + 1 r i . The explored composite material of type SE, shaped as a spherical pin, contains two different phases. The first is a hard phase, 5 wt.% of the total volume, which includes polyhedral crystals (particles) with very sharp edges that cause tracks in the steel counterbody. The second phase is a softer material with lower hardness. The geometric model pertains to the pin-on-disc test. The number of cyclical segments increases by one for every time subinterval Δ t i . It is assumed that each segment contains 5 wt.% contact patches, which are projections of the reinforcement particles (see Figure 2a,b). Both the reinforcement particles and the matrix resemble those described in (p. 238) [23]. The statistical model evaluating the role of particle distribution and shape in two-body abrasion through statistical simulation is considered in [24]. However, due to the composites’ inherent inhomogeneity, it is concluded that this statistical model may be ineffective.
The decrease in oscillation amplitudes of μ S E , as shown in Figure 1 and Figure 3, results from the detachment of some particles during the experiment and the subsequent appearance of debris. This debris contributes to a third body alongside the chipped particles on the disc, while other particles persist longer, aiding in the reduction in the ‘stick–slip’ effect. Additionally, the SiC particles in the composite skeleton likely serve as reinforcements, enhancing the material’s strength and wear resistance. The diminished COF in the composite skeleton could be attributed to the improved lubrication properties of the SiC particles, which may lessen the contact and adhesion between the sliding surfaces, thus mitigating wear.

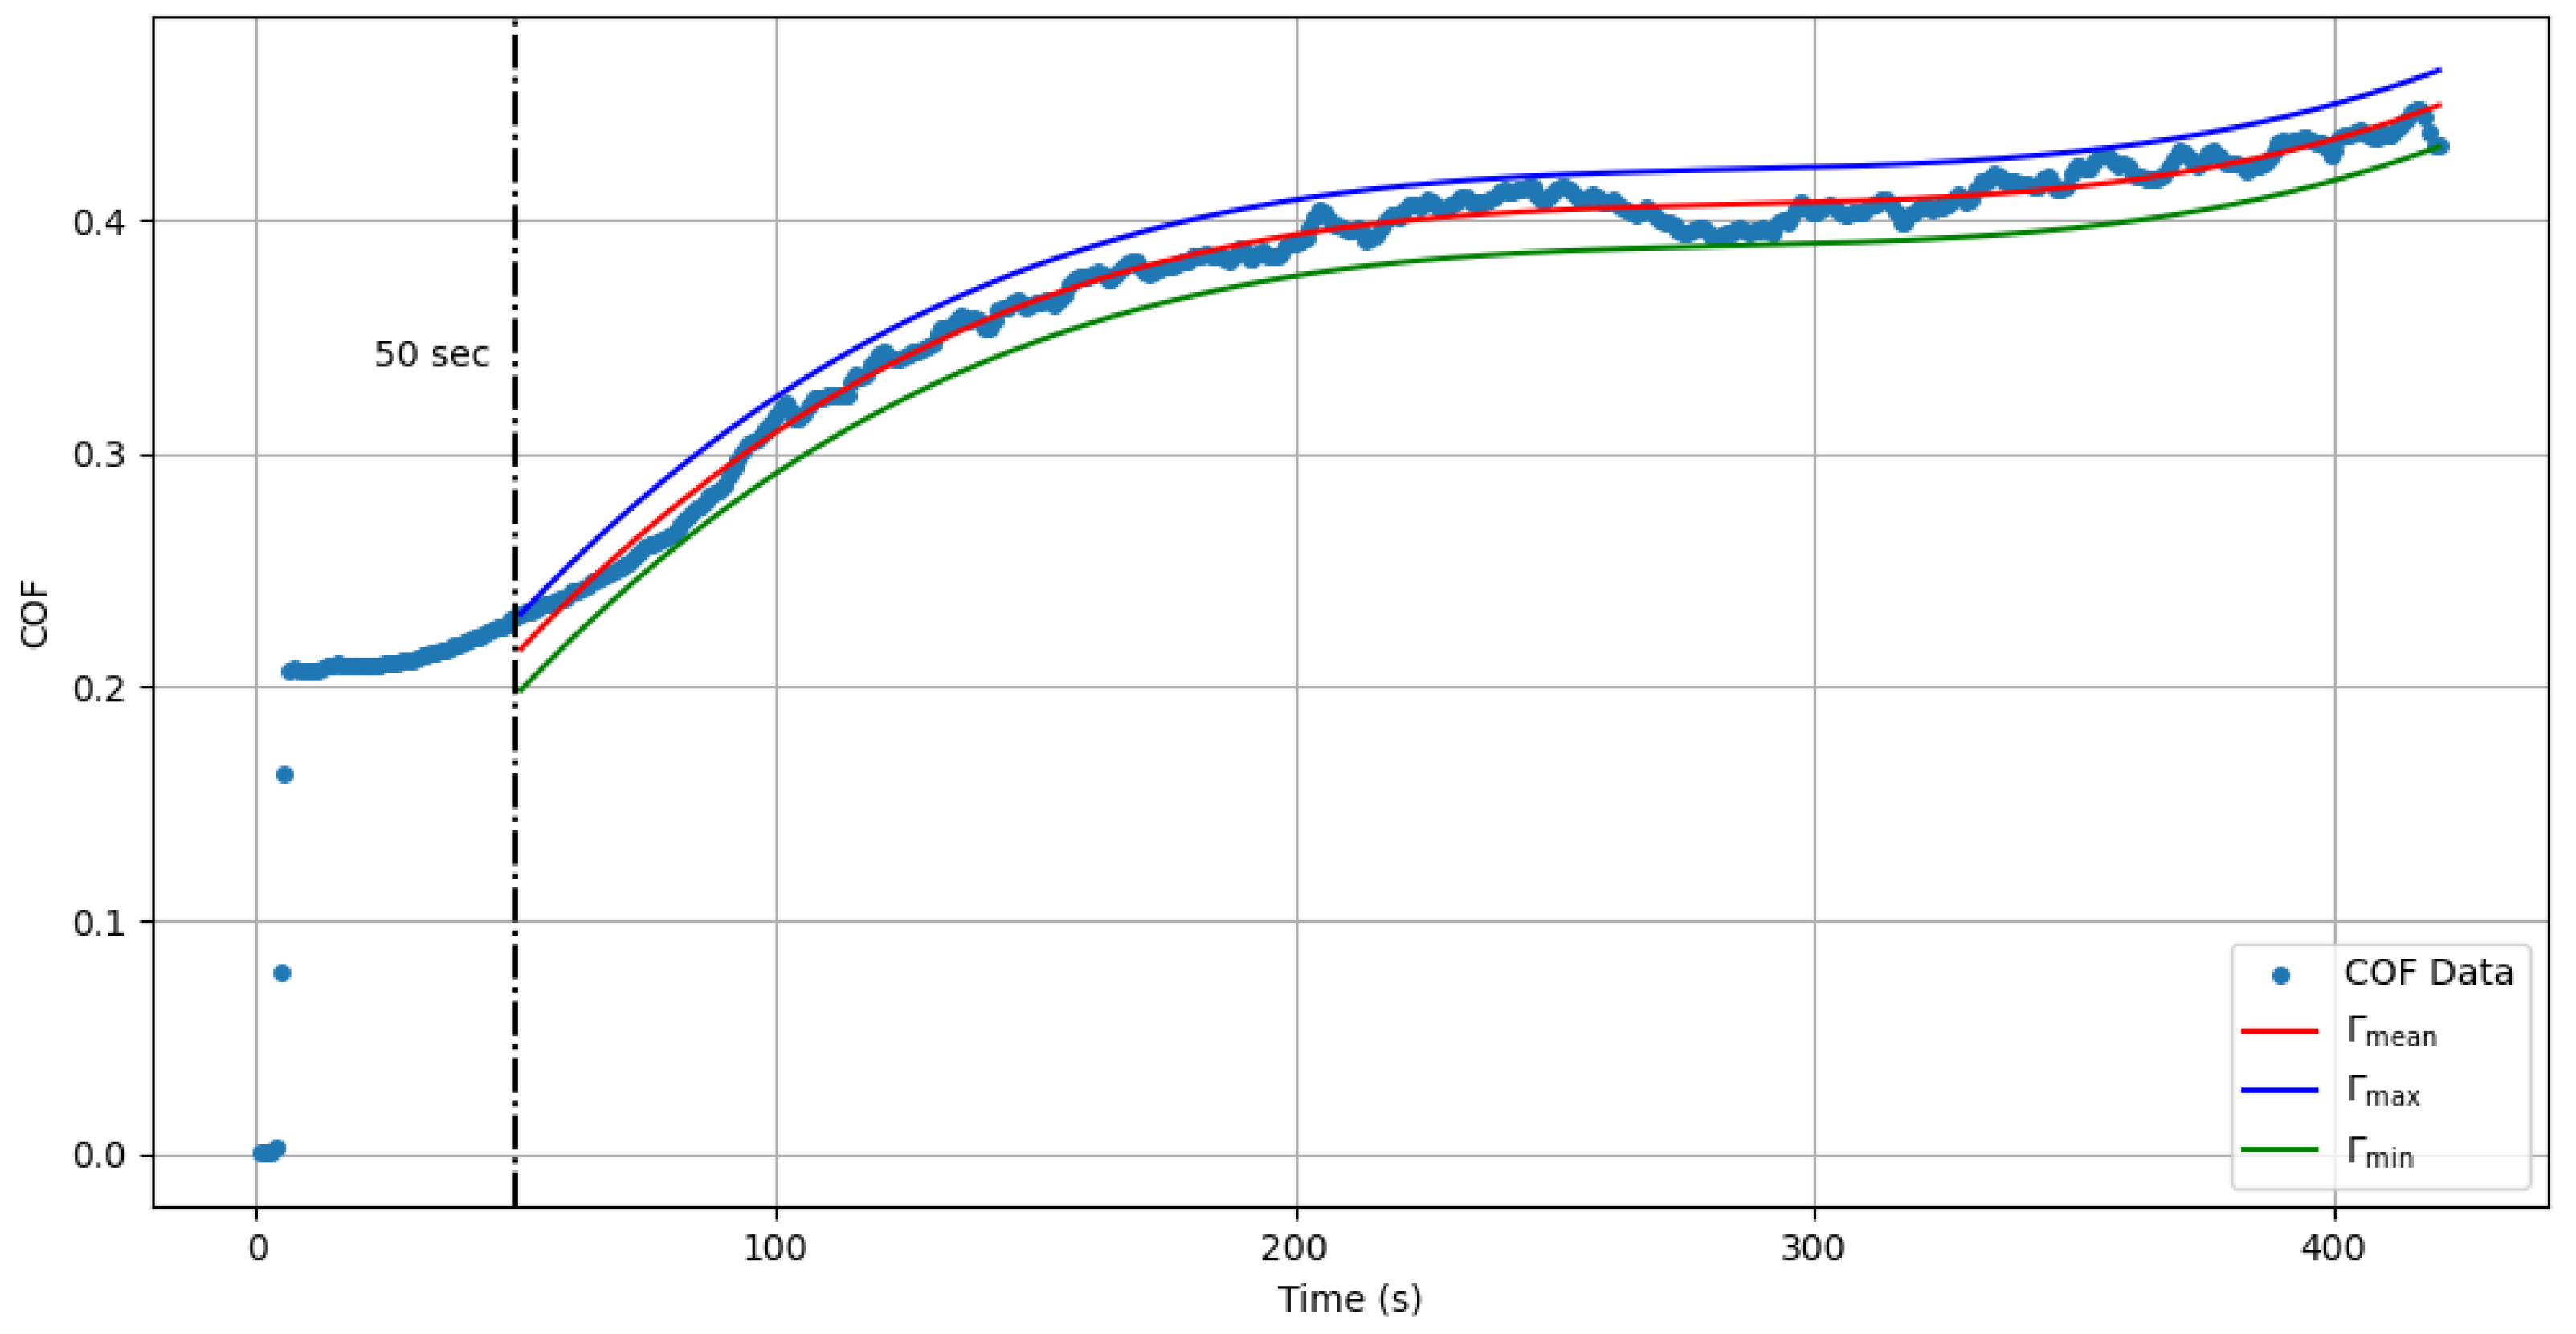
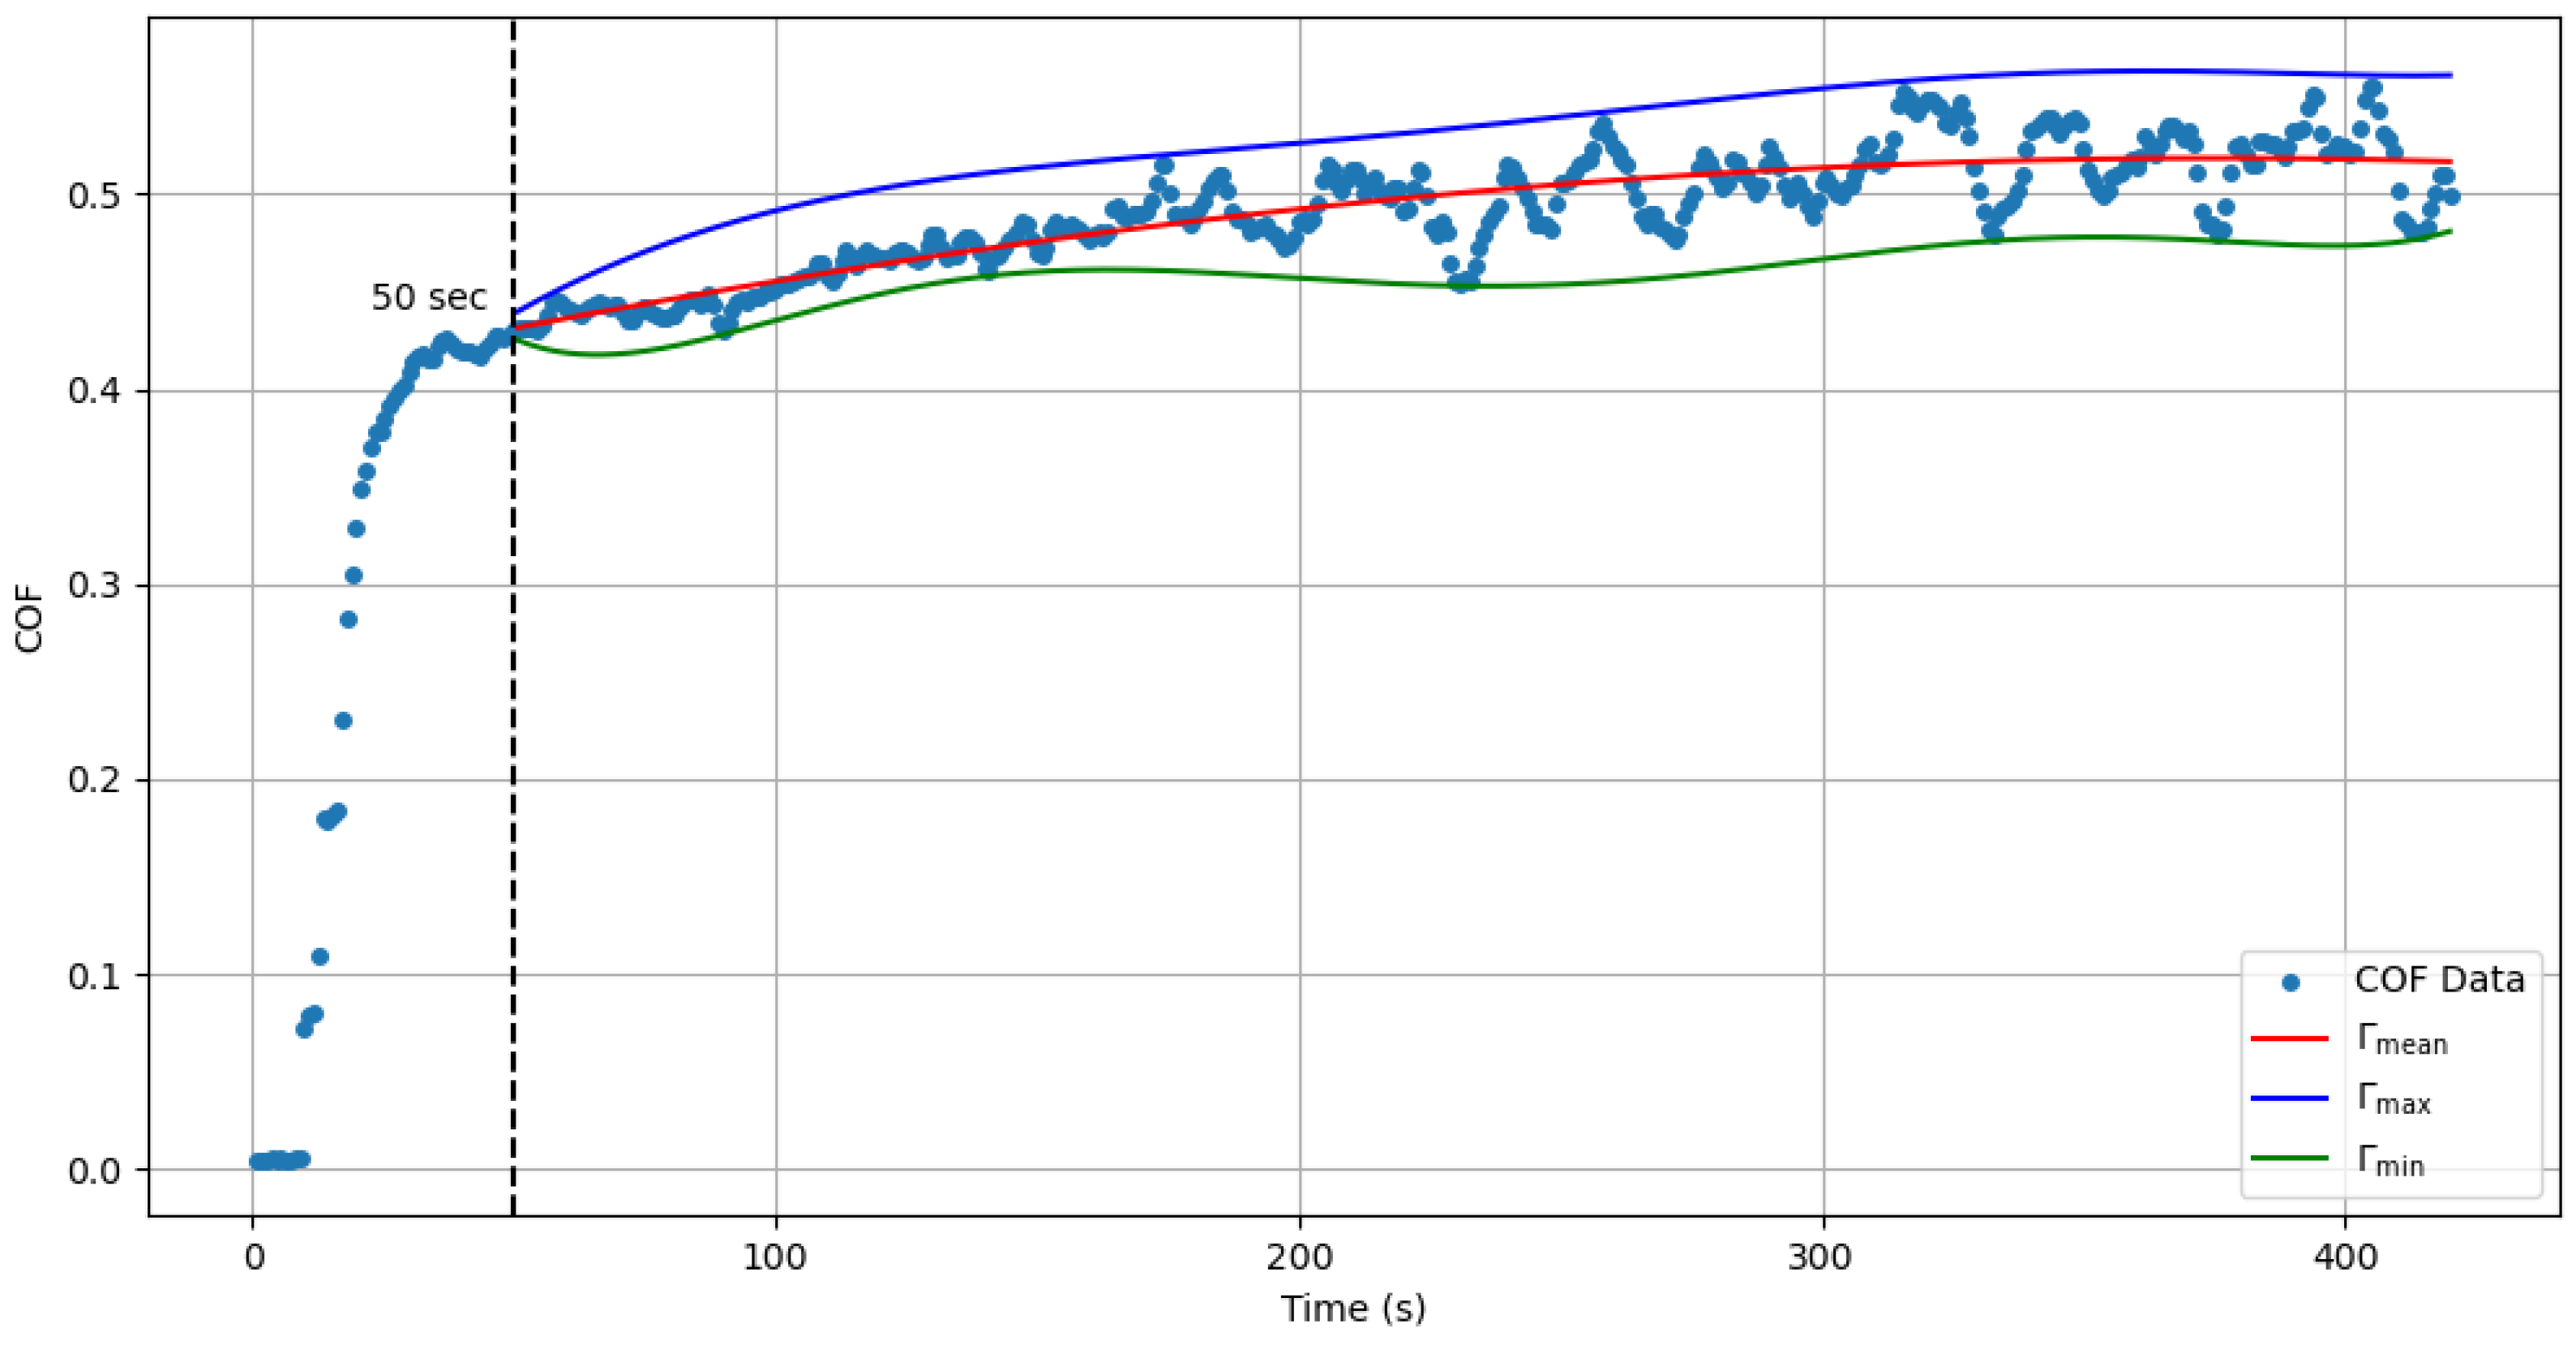
3.3. Analytical Approximation of Coefficient of Friction Evolution

An evolution model is formulated to describe the oscillations in COF values throughout the entire experimental duration, as evidenced in Figure 1. The graph reveals that the E-type material experiences larger oscillation amplitudes compared to the SE-type material. For the E-type material, larger amplitudes primarily result from the ‘stick–slip’ effect within the interval [ 50 ; 160 ] , with a significant increase in the subinterval [ 160 ; 463 ] . The COF values oscillate with distinguishable minimums and maximums. This observation suggests the possibility of constructing a dynamic model for μ as a function
μ = φ ( t , d , ρ h , θ ) ,
which depends continuously on time t, the temperature θ in the contact zone (measured at 34 °C the diameter d of the hard phase (ceramics), and the concentration ρ h of the hard phase in the composites (5 wt.%). The function φ varies, reflecting the set of possible distributions of hard particles (5 wt.%) within the pin’s entire volume. Acknowledging the infinite potential distributions, it is impractical to explicitly define φ ( t , d , ρ h , θ ) . In addition to the variables t, d, ρ h , and θ, other factors may occasionally serve as arguments in μ = φ ( μ , t , d , ρ h , θ , ) instead of the original function (1). Nevertheless, for this study, it is assumed that φ exclusively depends on t, d, ρ h , and θ, with d, ρ h , and θ acting as constant parameters. Within this framework, the following evolution equation is proposed, which is an ordinary differential equation (ODE):
μ ˙ = g ( μ ; t , d , ρ h , θ ) , where μ ˙ d μ d t .
The initial value problem, also known as the Cauchý problem, can be defined by the initial condition μ ( t 0 ) = μ 0 , where d and ρ h are parameters. If g in (2) is precisely determined, integrating the initial value problem should yield the solution (1). However, constructing a model based on the ODE (2) essentially requires defining the function g explicitly or, in challenging cases, implicitly. This task proves to be formidable due to the stochastic nature of the dynamic process. Experimental results suggest an approximation of the function φ analytically and globally within a specified interval. By examining the graph in Figure 1, it is logical to model the right-hand side of the ODE (2) as g = g 0 + Λ , expressed as
μ ˙ = g 0 ( μ ; t , d , ρ h , θ ) + Λ ( μ ; t , d , ρ h , θ ) ,
where g 0 ( μ ; t , d , ρ h , θ ) is a continuous function of its arguments, and Λ ( μ ; t , d , ρ h , θ ) is a stochastic function fluctuating with a series of extremums over the time interval. The stochastic function Λ ( μ ; t , d , ρ h , θ ) depends continuously on the concentration ρ h 0 of the reinforcing phase in the composite material. For the E-type material, ρ h = 0 . If the ODE (3) is solvable, it should have solutions in the form
μ i = f i ( t ; d , ρ h , θ ) + ω i ( t ; d , ρ h , θ ) ( i = 0 , 1 ) ,
where μ E μ 0 , μ S E μ 1 , indicating i = 0 for the COF E type, and i = 1 for the SE type. The functions f i ( t ; d , ρ h , θ ) are continuous, and ω i ( t ; d , ρ h , θ ) are oscillating functions that change sign stochastically due to the ‘stick–slip’ effect and the inhomogeneity of the pin material, as shown in Figure 3 and Figure 4. These functions depend continuously on ρ h 0 . Thus, for the E-type material ( ρ h = 0 ), oscillations have larger extremums, whereas for the SE-type material ( ρ h > 0 ), oscillations decrease significantly. Defining both Λ and ω adequately remains an open question due to the variability observed in each experiment under nearly identical conditions, making the problem exceedingly difficult. The comparison of friction processes for two different materials, as illustrated in Figure 1, indicates that the COF for type-SE material is lower than that for the E type. This reduction is attributed to the reinforcement of the material with particles, resulting in a structure with lower COF values throughout the experiment. However, the ‘stick–slip’ effect leads to minor oscillations of μ. In particular, μ E > μ S E for t [ 50 ; 420 ] . It is hypothesized that the reinforcing particles are mainly responsible for hindering sticking and facilitating slipping, resulting in lower μ S E values. The evolution of the friction process involves rolling debris composed of SiC particles, along with matrix and counter-disc materials, which act as a third body between the pin and the counter-disc. As new reinforcement particles emerge, μ S E values decrease. Observations indicate two types of contact patches on each pin segment: one involving reinforcement particles and the other the matrix. Reinforcement particles slightly plow into the counter-disc surface, creating asperities and microchannels. The experiment spans a complete time period t n = T > 0 , divided into equal-time subintervals T = i = 1 6 Δ t i . Consequently, wear evolves over discrete time intervals defined by points { t 0 , t 1 , t 2 , , t i 2 , t i 1 , , t n 1 , t n } ( t i < t i + 1 , i = 0 , 1 , , n 1 ), with wear increasing monotonically over time.
Figure 3. Graph of stochastic oscillating COF for the SE-type material.
Machines 12 00638 g003
Figure 4. Graph of stochastic oscillating COF for the E-type material.
Machines 12 00638 g004

3.4. Polynomial Approximations of the Evolution Process

The determination of the functions f and Λ presents a formidable challenge in the current research context and requires resolution. Observe the evolution of COF values ( μ E ) for materials classified as type E, depicted in Figure 4, which shows the graph of stochastic oscillating friction coefficient, and ( μ S E ) for materials classified as the SE type, depicted in Figure 3, which illustrates the graph of stochastic oscillating friction coefficient for the SE-type material, respectively.
Considering the evolution formula (4) and the graph of μ E , as shown in Figure 4, it can be deduced that the values of μ E are confined between an upper function and a lower function (upper graph Γ max and lower graph Γ min ). The mean values are used to approximate the primary graph of μ E , resulting in Γ mean . In the time interval [ 60 ; 420 ] , the approximating mean function, represented by Γ mean , is identified as a third-degree polynomial, deg P mean = 3 , with the expression which has the form
P mean ( t ) = i = 0 3 a j t j ,
where the coefficients of P mean ( t ) are as follows:
a 0 = 1.7195832469515593 · 10 10 ; a 1 = 6.857711756075562 · 10 7 ; a 2 = 0.0005878069115175986 ; a 3 = 0.40356673931748893 .
It is inferred that the function f ( t ; d , ρ , θ ) inequality (4) is essentially the aforementioned polynomial f ( t ; d , 0 , θ ) = P mean ( t )   ( ρ h = 0 ) for t within [ 60 ; 420 ] . The stochastic function ω ( t ; d , 0 , θ ) is constrained such that either P min ( t ) μ + ω ( t ; d , 0 , θ ) < P max ( t ) or P min ( t ) < μ + ω ( t ; d , 0 , θ ) P max ( t ) , where both P min ( t ) and P max ( t ) are polynomials. The upper approximating function with graph Γ max is a fifth-degree polynomial, deg P max = 5 , defined by
P max ( t ) = i = 0 5 b j t j ,
with coefficients as follows:
b 0 = 3.396563678542317 · 10 13 ; b 1 = 4.1386331926201087 · 10 10 ; b 2 = 1.889972781644898 · 10 7 ; b 3 = 3.853203713544166 · 10 5 ; b 4 = 0.0028481596158706026 ; b 5 = 0.5117144912864094 .
Conversely, the lower bounding function, depicted by graph Γ min , is a sixth-degree polynomial, deg P min = 6 defined by
P min ( t ) = i = 0 6 c j t j .
The coefficients for P min ( t ) are detailed below:
c 0 = 5.467278107536543 · 10 15 ; c 1 = 7.983721261050793 · 10 12 ; c 2 = 4.555441958838022 · 10 9 ; c 3 = 1.2780830042918004 · 10 6 ; c 4 = 0.00018136718920115001 ; c 5 = 0.011754455974607548 ; c 6 = 0.6939043083243749 .
According to the obtained data along with the graphs in Figure 4, the following relationship holds:
P min ( t ) < P mean ( t ) < P max ( t ) , in [ 60 ; 420 ] .
Upon examining the outcomes and the structure of the associated graphs, as shown in Figure 4, a hypothesis is proposed:
Hypothesis 1. 
There is a point  t 0 [ 60 ; 420 ] , such that for  t > t 0  the following inequality holds: 
P P max ( t ) P min ( t ) K E in [ 60 ; 420 ] ,
where  K E  is a positive constant. This constant, K, varies with the material type, specifically its density  ρ h .
Based on this hypothesis, the manifestation of K E is an intrinsic characteristic of the described composites. The estimation (9) suggests that the stochastic dynamical model stated by (2) has a solution (4) with stable oscillations. If this research delves deeper then it may include the theory of Lyapunov stability to the solution in (4), which will be the topic of another study in the future.
Oscillations in the COF arise stochastically, making it pertinent to ascertain the approximated frequency of these oscillations, defined as
ν E = number of oscillations measure of interval .
Determining the number of oscillations (successive minima and maxima), which amounts to m = 41 within the interval [ 50 ; 420 ] for the E-type material, results in a frequency of ν E = 41 / 370 0.1108 . These frequencies vary within specified ranges.
This investigation does not account for the temperature achieved through friction between the pin and counter-disc, as the measured temperature at the end of the friction process reaches only 70 °C, which is considered insignificant concerning the thermal properties of the AlSi10Mg matrix and the SiC reinforcement in the composite.
Adopting a similar methodology for the SE-type material, the analytical approximation of obtained results yields a third-degree polynomial for Q mean ( t ) :
Q mean ( t ) = i = 0 3 a j t j ,
with coefficients of Q mean ( t ) for the following numbers:
a 0 = 1.3955538510819163 · 10 8 ; a 1 = 1.1905171991794286 · 10 5 ; a 2 = 0.003440019298525378 ; a 3 = 0.07020478930698208 .
The function f ( t ; d , ρ , θ ) in the context of (4) is essentially the polynomial f ( t ; d , 0.05 , θ ) = Q mean ( t )   ( ρ h = 0.05 ) for t over the interval [ 60 ; 420 ] . The stochastic function ω ( t ; d , 0.05 , θ ) is bounded by Q min ( t ) ω ( t ; d , 0.05 , θ ) Q max ( t ) , with both Q min ( t ) and Q max ( t ) being polynomials. The upper bounding function, represented by Γ max is an eighth-degree polynomial, deg Q max = 8 , expressed as
Q max ( t ) = i = 0 8 b j t j ,
with the following coefficients:
b 0 = 3.9944302881872824 · 10 19 ; b 1 = 7.201316811134917 · 10 16 ; b 2 = 5.397724281105819 · 10 13 ; b 3 = 2.1819876675950026 · 10 10 ; b 4 = 5.165544254568304 · 10 8 ; b 5 = 7.270678700933443 · 10 6 ; b 6 = 0.0005832986735868071 ; b 7 = 0.02240277089409586 ; b 8 = 0.5423508655659959 .
The lower approximating function, depicted by Γ min , is also an eighth-degree polynomial, deg Q min = 8 , defined by
Q min ( t ) = i = 0 8 c j t j .
The coefficients for Q min ( t ) are listed below:
c 0 = 5.326920216186403 · 10 19 ; c 1 = 1.0013979835029418 · 10 15 ; c 2 = 7.907740774606883 · 10 13 ; c 3 = 3.4119206982097863 · 10 10 ; c 4 = 8.75607912417316 · 10 8 ; c 5 = 1.3593985531094182 · 10 5 ; c 6 = 0.0012295047720951224 ; c 7 = 0.056760435227899086 ; c 8 = 1.2400806344378377 .
Following the relationships (11), (12), and (13), it can be concluded that
Q min ( t ) < Q mean ( t ) < Q max ( t ) , t [ 60 ; 420 ] .
To visualize the estimate (14) for COF, refer to Figure 3. Examination of results for the SE-type material and corresponding graphs supports the validity of Hypothesis 1.
Q Q max ( t ) Q min ( t ) K S E in [ 60 ; 420 ] .
According to Formula (10) for the SE-type material, the oscillation frequency is ν S E = 28 / 370 0.075675 , significantly lower than ν E = 0.1108 .
To further elucidate the impact of SiC reinforcement on the tribological properties of AlSi10Mg-SiC composites, the study analyzes the maximum differences in the oscillation amplitudes of the COF between the unreinforced (E-type) and SiC-reinforced (SE-type) materials.
For case E (E-type material), the maximum difference between P max and P min is observed at t = 261.32 with a magnitude of K E = 0.0868 . This denotes the peak oscillatory behavior in the COF for the unreinforced composite.
In contrast, for case SE (SE-type material), the maximal divergence between Q max and Q min is recorded at t = 216.56 , showcasing a substantially lower value of K S E = 0.0170 . This measurement highlights the SiC-reinforced composite’s significantly more consistent tribological performance, characterized by reduced fluctuations in the COF. To quantify the fluctuation extends across the examined interval, we calculated the average of the highest differences between Q max and Q min observed in each subinterval. For case E, the calculated average of peak differences amounted to 0.0644 . Conversely, for case SE, the average was markedly lower, at 0.0135 , further evidencing the superior stability of the COF in SiC-reinforced composites. Such findings underscore the efficacy of SiC particles in dampening oscillatory behaviors within the tribological context.
These results corroborate the primary thesis posited within this manuscript; that is, the incorporation of SiC particles significantly enhances the tribological behavior of AlSi10Mg-SiC composites. Specifically, the reduced amplitude of oscillation in the COF for the SiC-reinforced composite (SE-type material) as opposed to its unreinforced counterpart (E-type material) evidences the beneficial impact of SiC reinforcement on stabilizing the frictional behavior. Consequently, this empirical evidence firmly supports the proposition that SiC reinforcement leads to an improvement in the wear resistance and overall tribological properties of AlSi10Mg-SiC composites.
From the polynomial approximations for the COF of E-type and SE-type materials, the following is true:
μ S E ( t ) < μ E ( t ) , t [ 60 , 420 ] .
The constant K S E is notably smaller than K E . This conclusion stems from comparing polynomial approximations for both materials. The determination of K E and K S E requires defining the functions
Φ E ( t ) = P ( t ) , Φ S E ( t ) = Q ( t ) , t [ 60 , 420 ] ,
defined in (9) and (15), respectively, and finding their extrema by solving
d Φ E d t = 0 , d Φ S E d t = 0 .
The roots of these equations are the extremal points. Subsequent application of a suitable sufficient condition, such as the sign of the second derivatives at extremal points, reveals the maxima. Furthermore, considering (8) and (16), the global inequalities
P max ( t ) > P mean ( t ) > P min ( t ) > Q max ( t ) > Q mean ( t ) > Q min ( t ) , t [ 60 , 420 ]
are established. The COF analytical approximations for E-type and SE-type materials generalize to
μ i = F i + ω i ( i = 0 , 1 ) ,
where ‘0’ indexes E-type material and ‘1’ indexes SE-type material. Furthermore,
F i = ( 1 i ) f ( t ; 0 , 0 , θ ) , ρ h = 0 , d = 0 ; i f ( t ; d , ρ h , θ ) , ρ h > 0 , d > 0 ,
where i = 0 for E-type or i = 1 for SE-type material, F i is either a continuous or smooth function, and ω i = ω i ( t ; d , ρ h , θ ) ( i = 0 , 1 ) is an oscillating function that is also continuous with respect to its arguments. This function changes its sign stochastically due to the ‘stick–slip’ effect as well as the inhomogeneity of the pin material, as illustrated in Figure 2a,b.
Since the SE-type material incorporates 5 wt.% reinforcement particles, the mathematical model in (19) can be extended through the definition of a homotopic mapping:
μ λ ( t ) = ( 1 λ ) ( f ( t ; 0 , 0 , θ ) + ω 0 + λ f ( t ; d , ρ h , θ ) + ω 1 ,
where λ appears as a parameter, λ [ 0 ; 1 ] . If λ = 0 , then μ 0 μ E , and if λ = 1 , then μ 1 μ S E . Here, d 0 is a fixed parameter and the state λ = 1 corresponds to some fixed value (in our case ρ h = 5 wt.%).
The latter will be discussed in some of our next articles.
The analytical model developed in this study offers several distinct advantages over machine learning (ML) approaches for predicting COF. While ML models often require extensive datasets and can be challenging to interpret due to their ’black box’ nature, the analytical model provides a transparent, physics-based understanding of the factors influencing COF. This transparency allows for a deeper insight into the material behavior and facilitates its application in cases where experimental data may be limited.
Furthermore, the model’s design is not inherently restricted to AlSi10Mg-SiC composites. By adjusting the input parameters and considering the specific material properties, the model can be adapted to predict COF across a broader spectrum of materials. This adaptability underscores the model’s potential as a general tool for COF prediction in various engineering materials, making it a valuable resource for both research and industrial applications.

4. Conclusions

This study presents a comprehensive analytical and experimental exploration into the tribological behavior of AlSi10Mg-SiC composites under dry sliding conditions. Through meticulous experimental procedures and innovative analytical modeling, the mechanisms governing the COF characteristics of these composites have been elucidated. The polynomial approximations of the COF for both E-type and SE-type materials reveal a clear advantage of SiC reinforcement in reducing the COF.
From the polynomial approximations for the COF of E-type and SE-type materials, it follows that the function μ E ( t ) majorizes μ S E ( t ) globally in the closed interval [60, 420], see Equation (16). The constant K S E is notably smaller than K E , suggesting the superior tribological performance of the SiC-reinforced composites. This analytical insight, complemented by experimental findings, underscores the potential of SiC reinforcement in applications demanding high durability and low friction.
The implications of this study extend beyond the specific insights into AlSi10Mg-SiC composites, contributing to a broader understanding of the role of reinforcements in metal matrix composites. The methodologies developed herein offer a framework for the predictive modeling of COF in various composite systems, facilitating the optimized use of these materials across numerous sectors. Practical applications of AlSi10Mg-SiC composites, as indicated by the findings, include automotive, aerospace, and industrial machinery components, where enhanced wear resistance and reduced COF are paramount. The research paves the way for future investigations into the microstructural characteristics contributing to the observed tribological performance and explores the potential of other types of reinforcements.
Importantly, the model using polynomial approximations stands out for its simplicity and ease of implementation in practice. Its computational efficiency allows for quick execution on modern hardware, making it highly accessible for engineers and researchers aiming to apply these insights to real-world materials and components. This practical applicability ensures that the advancements made through this study can readily contribute to the development of more durable and efficient composite materials. The determination of K E and K S E , alongside the global inequalities established through analytical modeling, serves as a foundation for further research into the dynamic oscillations of COF and the development of more stable composite materials. The introduction of a homotopic mapping approach, symbolized by μ λ ( t ) , offers a novel method for interpolating between the tribological properties of purely metallic and metal matrix composite materials, providing a new perspective on material design and optimization.
In conclusion, the study not only advances the state of knowledge regarding the tribological properties of AlSi10Mg-SiC composites but also introduces robust analytical tools for the broader field of materials science. The insights gained from this study are poised to inform the design and application of high-performance composite materials, addressing critical needs in engineering and technology.

Author Contributions

Conceptualization, M.K. and D.K.; methodology, M.K., D.K. and S.I.; software, M.K., D.K. and S.I.; validation, M.K., D.K. and S.I.; formal analysis, M.K., D.K. and S.I.; investigation, M.K., D.K. and S.I.; resources, M.K., D.K. and S.I.; data curation, M.K., D.K. and S.I.; writing—original draft preparation, M.K., D.K. and S.I.; writing—review and editing, M.K., D.K. and S.I.; visualization, M.K., D.K. and S.I.; supervision, D.K.; project administration, M.K.; funding acquisition, M.K. All authors have read and agreed to the published version of the manuscript.

Funding

This research was funded by the Bulgarian National Science Fund, Project KΠ-06-H57/20 “Fabrication of new type of self-lubricating antifriction metal matrix composite materials with improved mechanical and tribological properties”.

Data Availability Statement

Data will be made available upon request.

Conflicts of Interest

The authors declare no conflicts of interest.

References

  1. Kumar, A.; Kumar, M. Mechanical and Dry Sliding Wear Behaviour of B4C and Rice Husk Ash Reinfroced Al 7075 Alloy Hybrid Composite for Armors Application by Using Taguchi Techniques. Mater. Today Proc. 2020, 27, 2617–2625. [Google Scholar] [CrossRef]
  2. Arunkumar, S.; Ashokkumar, R.; Sundaram, M.S.; SukethKanna, K.M.; Vigneshwara, S. Optimization of Wear Behaviour of Al7075 Hybrid Metal Matrix Composites Using Taguchi Approach. Mater. Today Proc. 2020, 33, 570–577. [Google Scholar] [CrossRef]
  3. Aydin, F. The Investigation of the Effect of Particle Size on Wear Performance of AA7075/Al2O3 Composites Using Statistical Analysis and Different Machine Learning Methods. Adv. Powder Technol. 2021, 32, 445–463. [Google Scholar] [CrossRef]
  4. Alizadeh, A.; Khayami, A.; Karamouz, M.; Hajizamani, M. Mechanical Properties and Wear Behavior of Al5083 Matrix Composites Reinforced with High Amounts of SiC Particles Fabricated by Combined Stir Casting and Squeeze Casting; A Comparative Study. Ceram. Int. 2022, 48, 179–189. [Google Scholar] [CrossRef]
  5. Kolev, M. Friction Coefficient Data and Prediction Using Decision Tree Model for Open-Cell AlSi10Mg-SiC Composites under Dry-Sliding Condition; Mendeley Data, V1, 6 June 2023. [CrossRef]
  6. Maleki, K.; Alizadeh, A.; Hajizamani, M. Compressive Strength and Wear Properties of SiC/Al6061 Composites Reinforced with High Contents of SiC Fabricated by Pressure-Assisted Infiltration. Ceram. Int. 2021, 47, 2406–2413. [Google Scholar] [CrossRef]
  7. Popov, V.L. Contact Mechanics and Friction: Physical Principles and Applications; Springer: Berlin/Heidelberg, Germany, 2017; ISBN 9783662530801. [Google Scholar]
  8. Abdelbary, A.; Chang, L. 4-Friction and Wear. In Principles of Engineering Tribology; Abdelbary, A., Chang, L., Eds.; Academic Press: Cambridge, MA, USA, 2023; pp. 127–206. ISBN 9780323991155. [Google Scholar]
  9. Kumar Yadav, R.; Hasan, Z.; Husain Ansari, A. Investigation of Mechanical and Wear Behavior of Al Based SiC Reinforce Metal Matrix Composite. Mater. Today Proc. 2020, 21, 1537–1543. [Google Scholar] [CrossRef]
  10. Kumar, B.; Joshi, A.; Mer, K.K.S.; Prasad, L.; Pathak, M.K.; Saxena, K.K. The Impact of Centrifugal Casting Processing Parameters on the Wear Behaviour of Al Alloy/Al2O3 Functionally Graded Materials. Mater. Today Proc. 2022, 62, 2780–2786. [Google Scholar] [CrossRef]
  11. Kolev, M. Svm_friction: A Python Based Software for Calculating, Data Analysis and Modeling the Coefficient of Friction of Aluminum Metal Matrix Composites Using Support Vector Regression. Softw. Impacts 2023, 17, 100561. [Google Scholar] [CrossRef]
  12. Hasan, M.S.; Kordijazi, A.; Rohatgi, P.K.; Nosonovsky, M. Application of Triboinformatics Approach in Tribological Studies of Aluminum Alloys and Aluminum-Graphite Metal Matrix Composites. In Metal-Matrix Composites; The minerals, metals & materials series; Springer International Publishing: Cham, Switzerland, 2022; pp. 41–51. ISBN 9783030925666. [Google Scholar]
  13. Santhosh, N.; Praveena, B.A.; Jain, R.; Abul Hasan, M.; Islam, S.; Amir Khan, M.; Razak, A. Daniyal Analysis of Friction and Wear of Aluminium AA 5083/WC Composites for Building Applications Using Advanced Machine Learning Models. Ain Shams Eng. J. 2023, 14, 102090. [Google Scholar] [CrossRef]
  14. Rabinowicz, E. The Intrinsic Variables Affecting the Stick-Slip Process. Proc. Phys. Soc. 1958, 71, 668. [Google Scholar] [CrossRef]
  15. Amer, T.S.; Shaker, M.O.; Dahab, H.A. Analysis of the Stick-Slip Behavior of Coupled Oscillators with Dry Friction. J. Low Freq. Noise Vib. Act. Control 2023, 42, 1251–1275. [Google Scholar] [CrossRef]
  16. Wang, S.; Hong, L.; Jiang, J. Analytical Prediction on Stick-Slip Whirling Oscillations Induced by Dry Friction between a Rotating Imbalanced Rotor and a Flexibly Supported Stator. J. Sound Vib. 2021, 511, 116333. [Google Scholar] [CrossRef]
  17. Den Hartog, J.P. Forced Vibrations with Combined Coulomb and Viscous Friction. J. Fluids Eng. 1931, 53, 107–115. [Google Scholar] [CrossRef]
  18. Shaw, S.W. On the Dynamic Response of a System with Dry Friction. J. Sound Vib. 1986, 108, 305–325. [Google Scholar] [CrossRef]
  19. Bensoussan, A.; Brouste, A.; Cartiaux, F.B.; Mathey, C.; Mertz, L. Mathematical Formulation of a Dynamical System with Dry Friction Subjected to External Forces. Physica D 2021, 421, 132859. [Google Scholar] [CrossRef]
  20. Kolev, M.; Drenchev, L.; Petkov, V. Fabrication, Experimental Investigation and Prediction of Wear Behavior of Open-Cell AlSi10Mg-SiC Composite Materials. Metals 2023, 13, 814. [Google Scholar] [CrossRef]
  21. Zhang, C.; Liao, W.; Shan, Z.; Song, W.; Dong, X. Squeeze Casting of 4032 Aluminum Alloy and the Synergetic Enhancement of Strength and Ductility via Al-Ti-Nb-B Grain Refiner. Mater. Sci. Eng. A 2024, 896, 146233. [Google Scholar] [CrossRef]
  22. Pazhani, A.; Venkatraman, M.; Anthony Xavior, M.; Moganraj, A.; Batako, A.; Paulsamy, J.; Jayaseelan, J.; Anbalagan, A.; Shanthi Bavan, J. Synthesis and Characterisation of Graphene-Reinforced AA 2014 MMC Using Squeeze Casting Method for Lightweight Aerospace Structural Applications. Mater. Des. 2023, 230, 111990. [Google Scholar] [CrossRef]
  23. Menezes, P.L.; Nosonovsky, M.; Ingole, S.P.; Kailas, S.V.; Lovell, M.R. Tribology for Scientists and Engineers: From Basics to Advanced Concepts; Springer: New York, NY, USA, 2013. [Google Scholar] [CrossRef]
  24. De Pellegrin, D.V.; Stachowiak, G.W. Evaluating the role of particle distribution and shape in two-body abrasion by statistical simulation. Tribol. Int. 2004, 37, 255–270. [Google Scholar] [CrossRef]
Figure 1. Stochastic oscillating COF for both E- and SE-type materials.
Machines 12 00638 g001
Figure 2. Evolution of the SE-type composite’s structure over time: (a) segments in the sphere space, illustrating the increasing diameters of the circular segments; (b) contact area for the SE-type material.
Machines 12 00638 g002
Table 1. Time subintervals for SE-type materials.
Time [s][60; 120][120; 180][180; 240][240; 300][300; 360][360; 420]
[ t p ; t q ] [ t 67 ; t 133 ][ t 133 ; t 199 ][ t 199 ; t 265 ][ t 265 ; t 331 ][ t 331 ; t 397 ][ t 397 ; t 463 ]
Table 2. Subintervals in the scale of the radius r w for the SE-type material.
[ t p ; t q ] [ t 0 ; t 1 ][ t 1 ; t 2 ][ t 2 ; t 3 ][ t 3 ; t 4 ][ t 4 ; t 5 ][ t 5 ; t 6 ]
[ r i ; r i + 1 ] [1.026; 1.443][1.443; 1.758][1.758; 2.019][2.019; 2.244][2.244; 2.445][2.445; 2.625]
Disclaimer/Publisher’s Note: The statements, opinions and data contained in all publications are solely those of the individual author(s) and contributor(s) and not of MDPI and/or the editor(s). MDPI and/or the editor(s) disclaim responsibility for any injury to people or property resulting from any ideas, methods, instructions or products referred to in the content.

