Abstract
The subject of investigation presented in this article is a filling and draining system of the ship lock installed in the Gabčíkovo Waterworks. This article describes the operation and construction of the special regulation segments, i.e., the check gates that are situated in the ship locks. After the failure and replacement of the original check gate with the new, improved one, the strain gauge sensors were applied to the new check gate in order to determine stress distribution on the segment surface as well as the loading of the actuating arms. The application method and application places of the strain gauge sensors are described in detail. The performed measurements detected the occurrence of additional motional resistances during the opening and closing of the check gate. These resistances caused a partial non-functionality of the original check gate actuating mechanism.
1. Introduction
The waterworks in Slovakia, but also worldwide, are characterized by considerable national economic importance, especially for the whole water management and also for the power supply system in the given country. Waterworks utilize the potential energy of our water flows to produce ecologically clean electricity, improve conditions for ship sailing, and provide wide possibilities for recreational activities, sports, etc. These facts are emphasized in the study of the authors [1] from Turkey, which compares their country with Europe and also with the whole world (with the individual continents). Singh [2] compares the river dams and reservoirs with regard to the costs necessary for the operation of the hydroelectric power plants. Sachdev [3] presents the flow-through hydropower plants, i.e., the hydropower plants without dams or without water reservoirs, as one of the most cost-effective and environmentally friendly power supply technologies, which is suitable for rural electrification in less developed countries. He provides general guidance on economic design and practical implementation of the main components necessary for small hydropower plants and their interaction.
The amount of usable energy of the water flow depends on the gradient, i.e., on the relative elevation of two different water levels and on the amount of flowing water (on water flow). For the utilization of water flow energy, it is usually necessary to artificially create a height difference between the water levels, which is achieved by the so-called heaving of water using a floodgate or dam. However, in addition to improving conditions for ship sailing, the dam also generates a problem on how to pass the height difference of the dammed water flow for ship sailing. Therefore, the ship locks are necessary parts of every dam that is built on a waterway. One of the most important waterworks in Slovakia is the Gabčíkovo Waterworks. The subject of the performed research described in this article is the ship lock installed in the Gabčíkovo Waterworks, namely its filling and draining system.
Probably the most serious problem that has to be solved in the ship lock is the dynamics of the incoming and draining water. The water dynamic influences the method of ship anchoring and protection of equipment, which is located in the ship lock [4,5,6]. Many authors are applying the results obtained by water flow simulation [7]. The authors in [8,9] present their simulations performed on possibly the most famous system of ship locks—the Panama Canal, namely on its new three stages. Menéndez [10] even optimizes the construction of the filling–draining system in the case of these three stages. Similar research works dealing with the analysis of water flow in the ship lock are [11], where the compositional water flows of the gravity flow are investigated using simulation of water vortexes. Jánosi, I.M. et al. [12] investigated the role of turbulence in releasing a finite fluid volume from the ship lock into a rectangular water channel. Horváth, K. et al. [13] are solving this by means of the MPC application and keeping the water level height in the ship lock in order to ensure the ship is sailing inside it. Many waterworks are often no longer adequate in terms of their capacity, and it was decided to expand them. Such a case and the related problems are discussed, for instance, by O’Mahoney, T. [14] and Verelst, K. et al. [15]. In the works of the authors [16], the simulation of liquid flow in the ship lock is used to present different scenarios in flood protection for rivers with vegetation, in the utilization of a hydroelectric power plant for a ship lock, and in the usage of the renewable energies [17], as well as in the simulation of saltwater intrusion into a long channel [18]. Authors such as [19] investigate risks and optimize deviations of the water level in the filling and draining system of the ship lock. On the other side, the authors in the article [20] consider the possibility of installing a turbine for the production of electricity in the draining channels of the ship locks in order to utilize the energy of this water flow, but at the same time, they describe shortcomings of such technical solution.
The issue, which is the main subject of this article, is most approached in their research work [21,22], which investigates the check gates in the ship locks using numerical tools. They describe the hydraulic arrangement and the numerical models that are used to evaluate the performance of the check gate. The check gate is a special regulation segment applied in the ship lock. Gapeev, A. [23] evaluates the quality of the filling system in ship lock from under the segmental guillotine gate.
However, in no research work we did not find either a description or calculation of motional resistances of the check gates. We also did not find any investigation concerning influence of these resistances on the control mechanism of the check gate during the filling or draining of the ship lock. Simply put, during dimensioning drives of these mechanisms, the same drives are applied as were previously used in some similar cases, or they are over-dimensioned, with the fact that deficiencies are discovered during testing of the given device. Of course, this is too late. We recorded this problem while measuring the new constructional modification of the check gate installed in the ship lock at the Gabčíkovo Waterworks. As a result of an accident event that arose on one of the check gates, such a situation occurred that the newly installed check gate, after its repair, already during the operational tests using the original drive (linear hydraulic motor), could not reach the end positions in the ship lock at the highest water level. Using the assistance of the divers, the input to the corridor with the tested check gate was closed to install our measuring watertight boxes. After re-installation of the measuring sensors, again with the assistance of divers, the input to the check gate was opened, and all the functional movements of the check gate, which may occur during normal operation, were tested. Consequently, after this measurement, the input to the corridor with the tested check gate was closed again in order for the service team to remove the sealing from the walls of the working chamber, in which the check gate is moving. After flooding the corridor, the same measurement modes and in the same order as in the previous case were performed at the check gate. After this measurement, the input to the corridor was closed once more, and the chamber was drained, allowing us to remove the SD cards containing the measured record of load from the measuring boxes. All actions of damming and releasing the input to the corridor with the check gate were realized by means of divers, and each dive, also with the preparation of it, lasted two or more hours.
2. Characteristics of Gabčíkovo Waterworks and Its Ship Locks
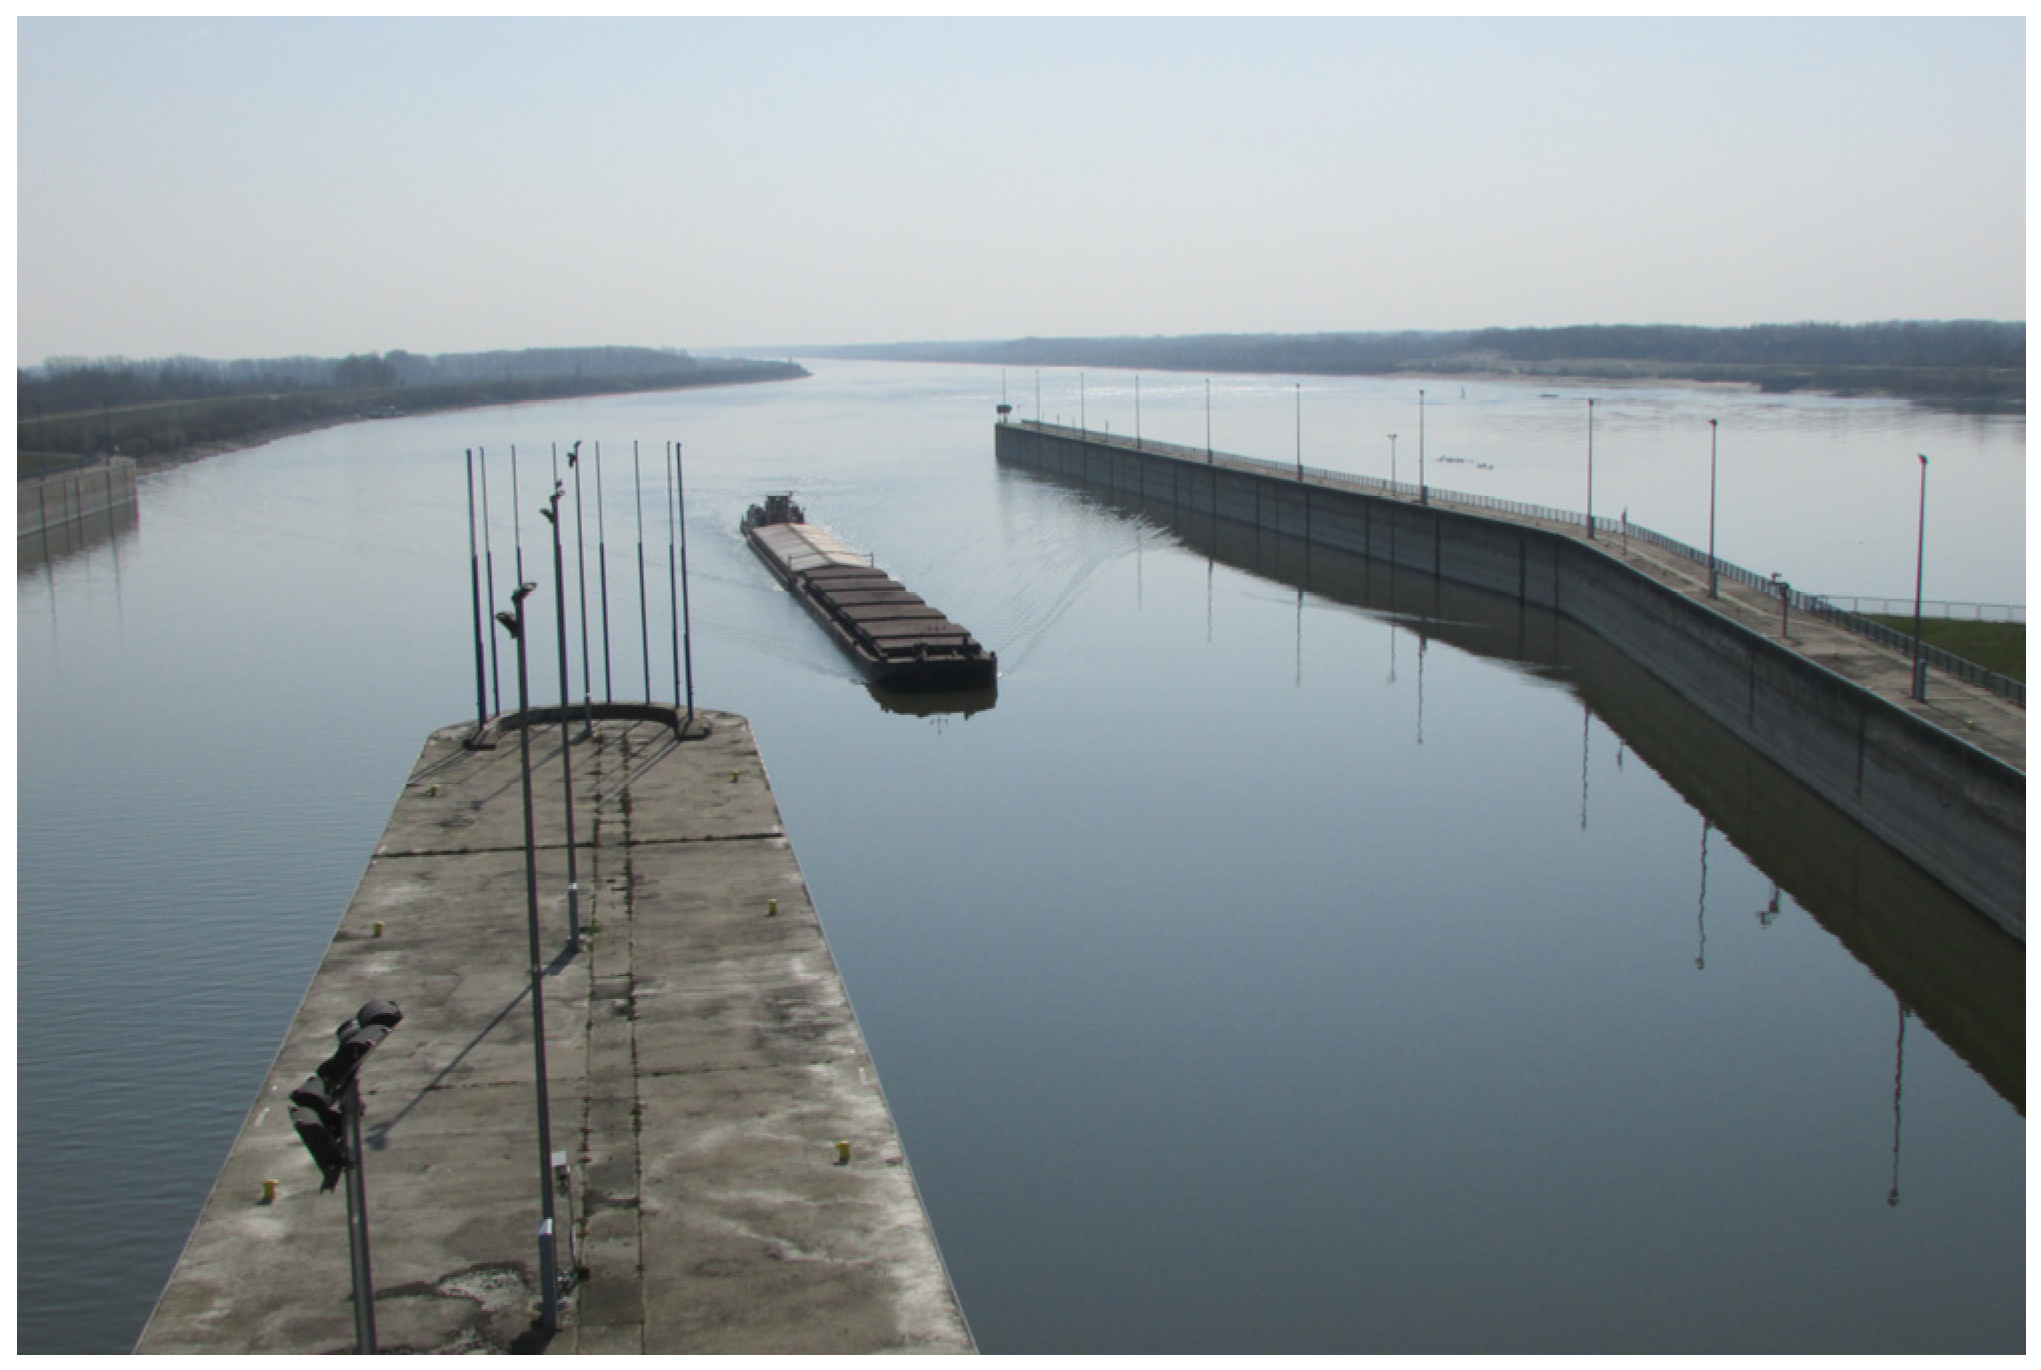
The hydroelectric power plant equipped with two ship locks was built in the Gabčíkovo area. The Gabčíkovo Waterworks was built in order to utilize the created difference in water levels for the production of electricity, to overcome the difference in levels in the ship locks, and to drain possible flood waters. The multi-purpose Gabčíkovo Waterworks (Figure 1) has been in operation since October 1992. The eight installed hydro-aggregates produce a total power output of 720 MW. Two ship locks are installed, operating like an elevator, and they look like large bathtubs. Both ship locks are 32 m high, and the maximum level difference, at which they are still able to perform their function safely, is 21.6 m. Their length is 275 m, and their width is 34 m. Each of them can contain 299,200 m3 of water.
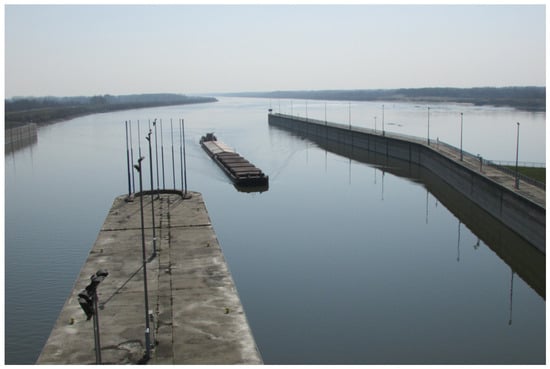
Figure 1.
The Gabčíkovo Waterworks.
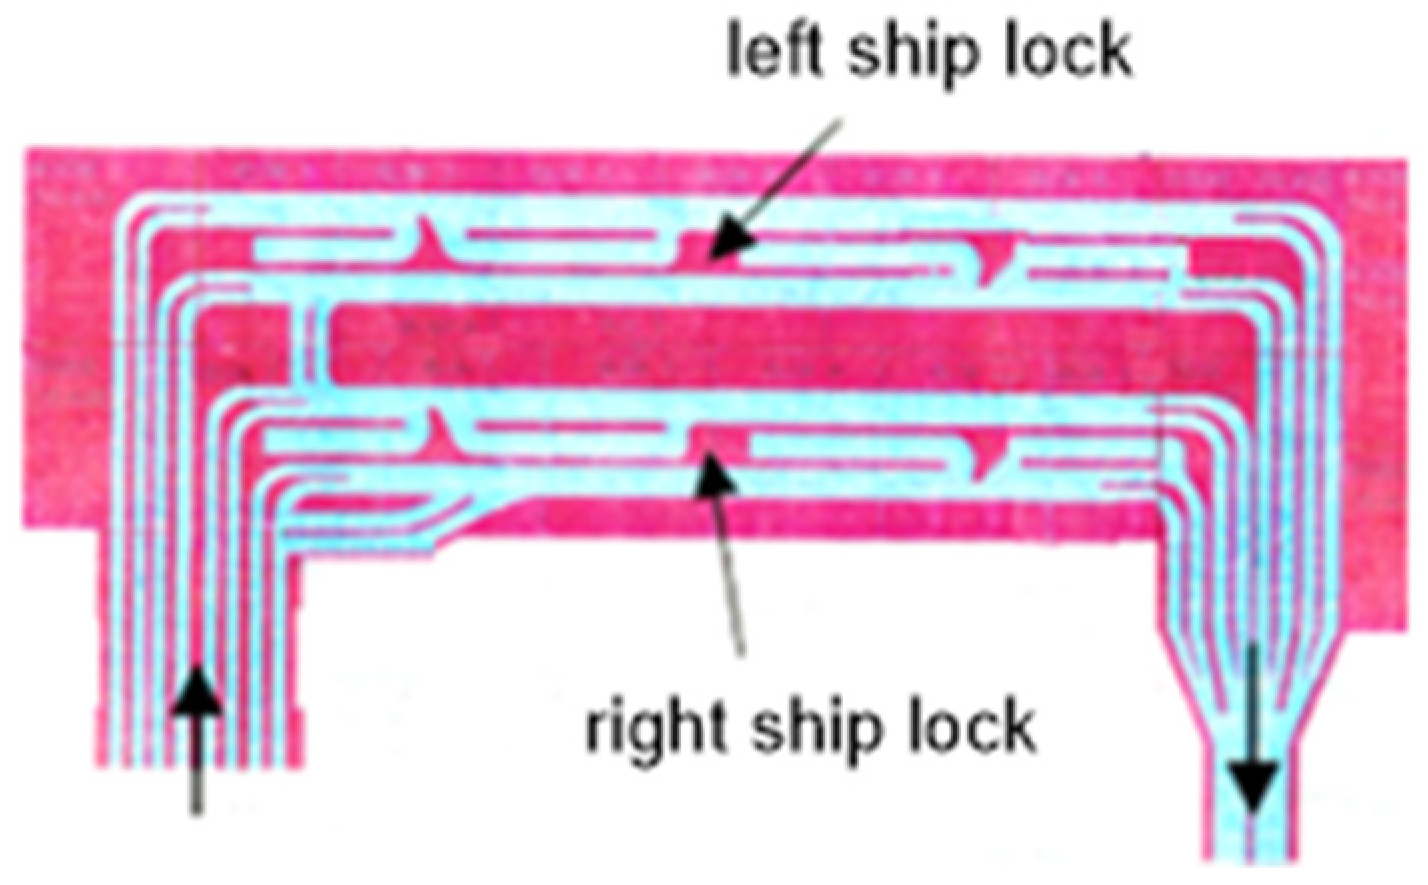
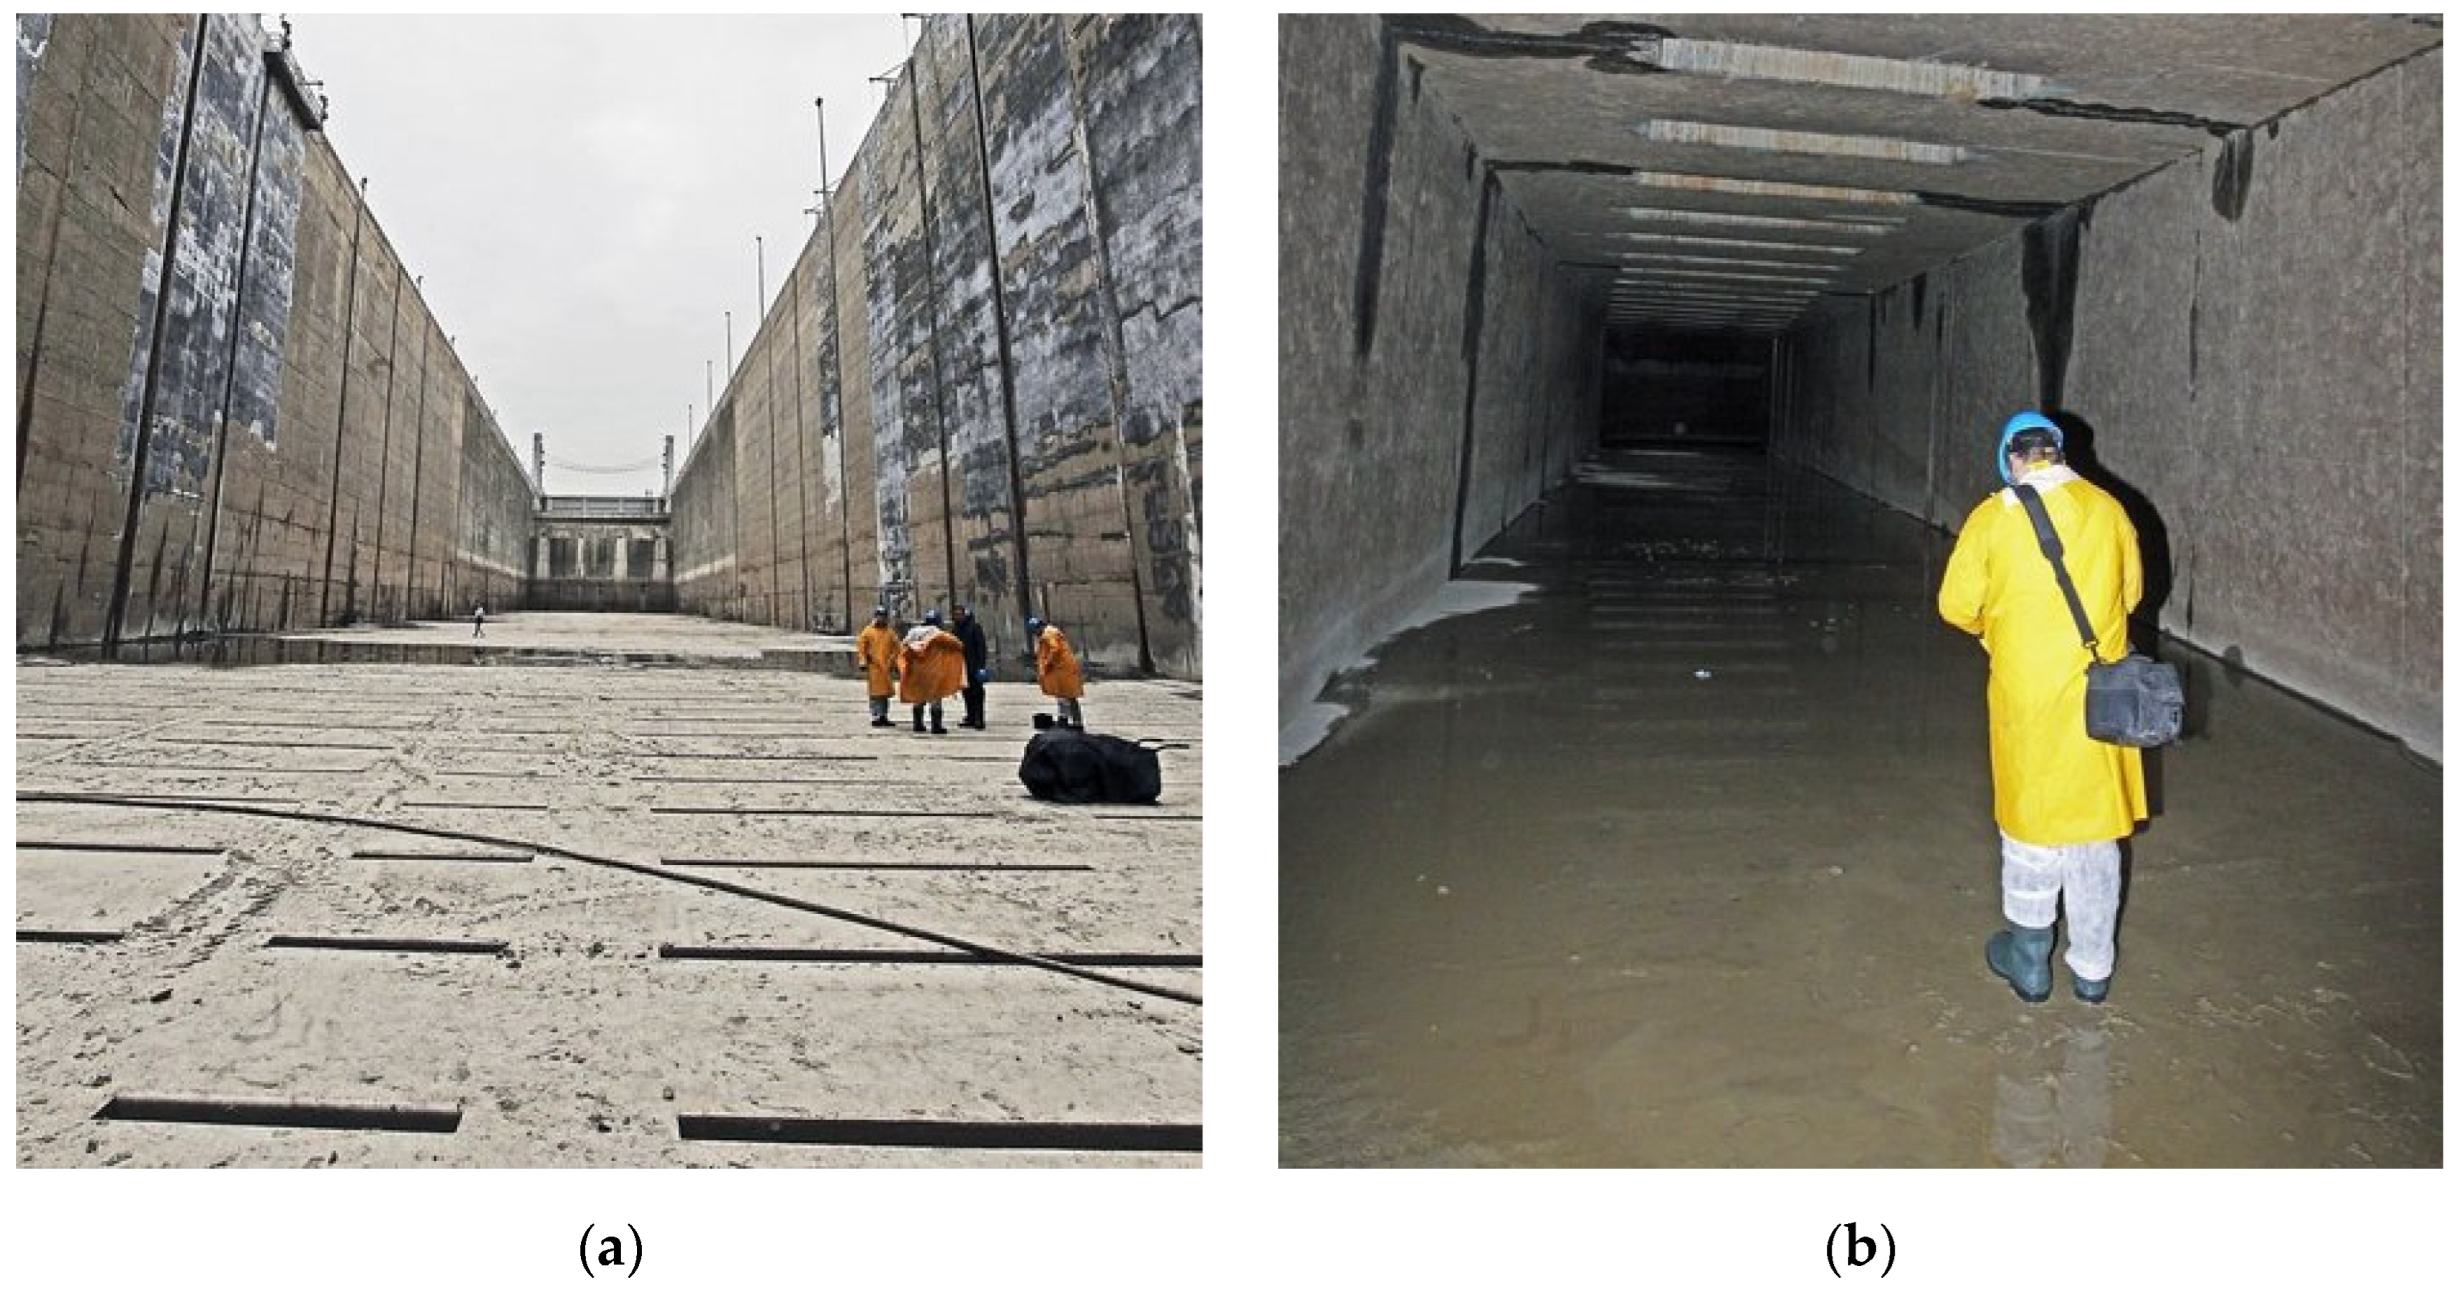
The ship enters the ship lock, and next, the huge gate is closed. The ship lock is filled with water up to the height of about an 8-floor building. On the return way, the water is drained, and the ship is sinking down. Emptying of the ship lock takes from 15 to 19 min. The entire filling and draining system, located at the bottom of the ship lock (Figure 2 and Figure 3), is arranged to minimize frictional losses and to prevent the creation of dangerous water vortexes during the ship lock operation. Inside the corridor system (Figure 3b), the flowing water reaches a speed of up to 12 m/s.
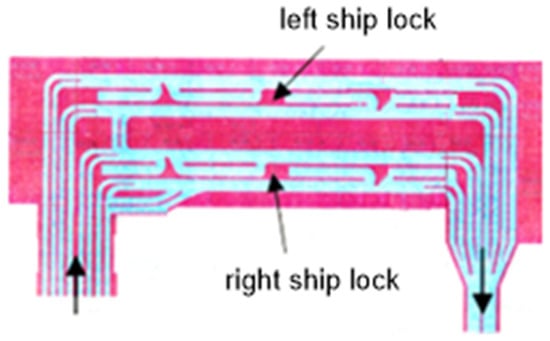
Figure 2.
A system of corridors installed at the input and output of the ship lock.
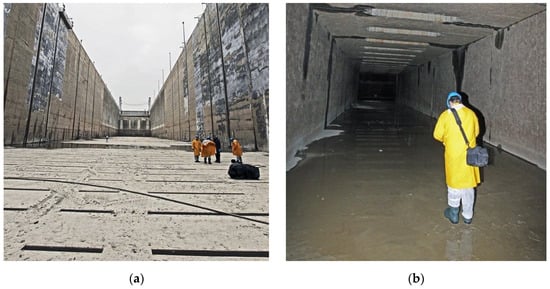
Figure 3.
Bottom of ship lock: (a) Bottom of ship lock; (b) One corridor from the system of corridors situated under the grid on the bottom.
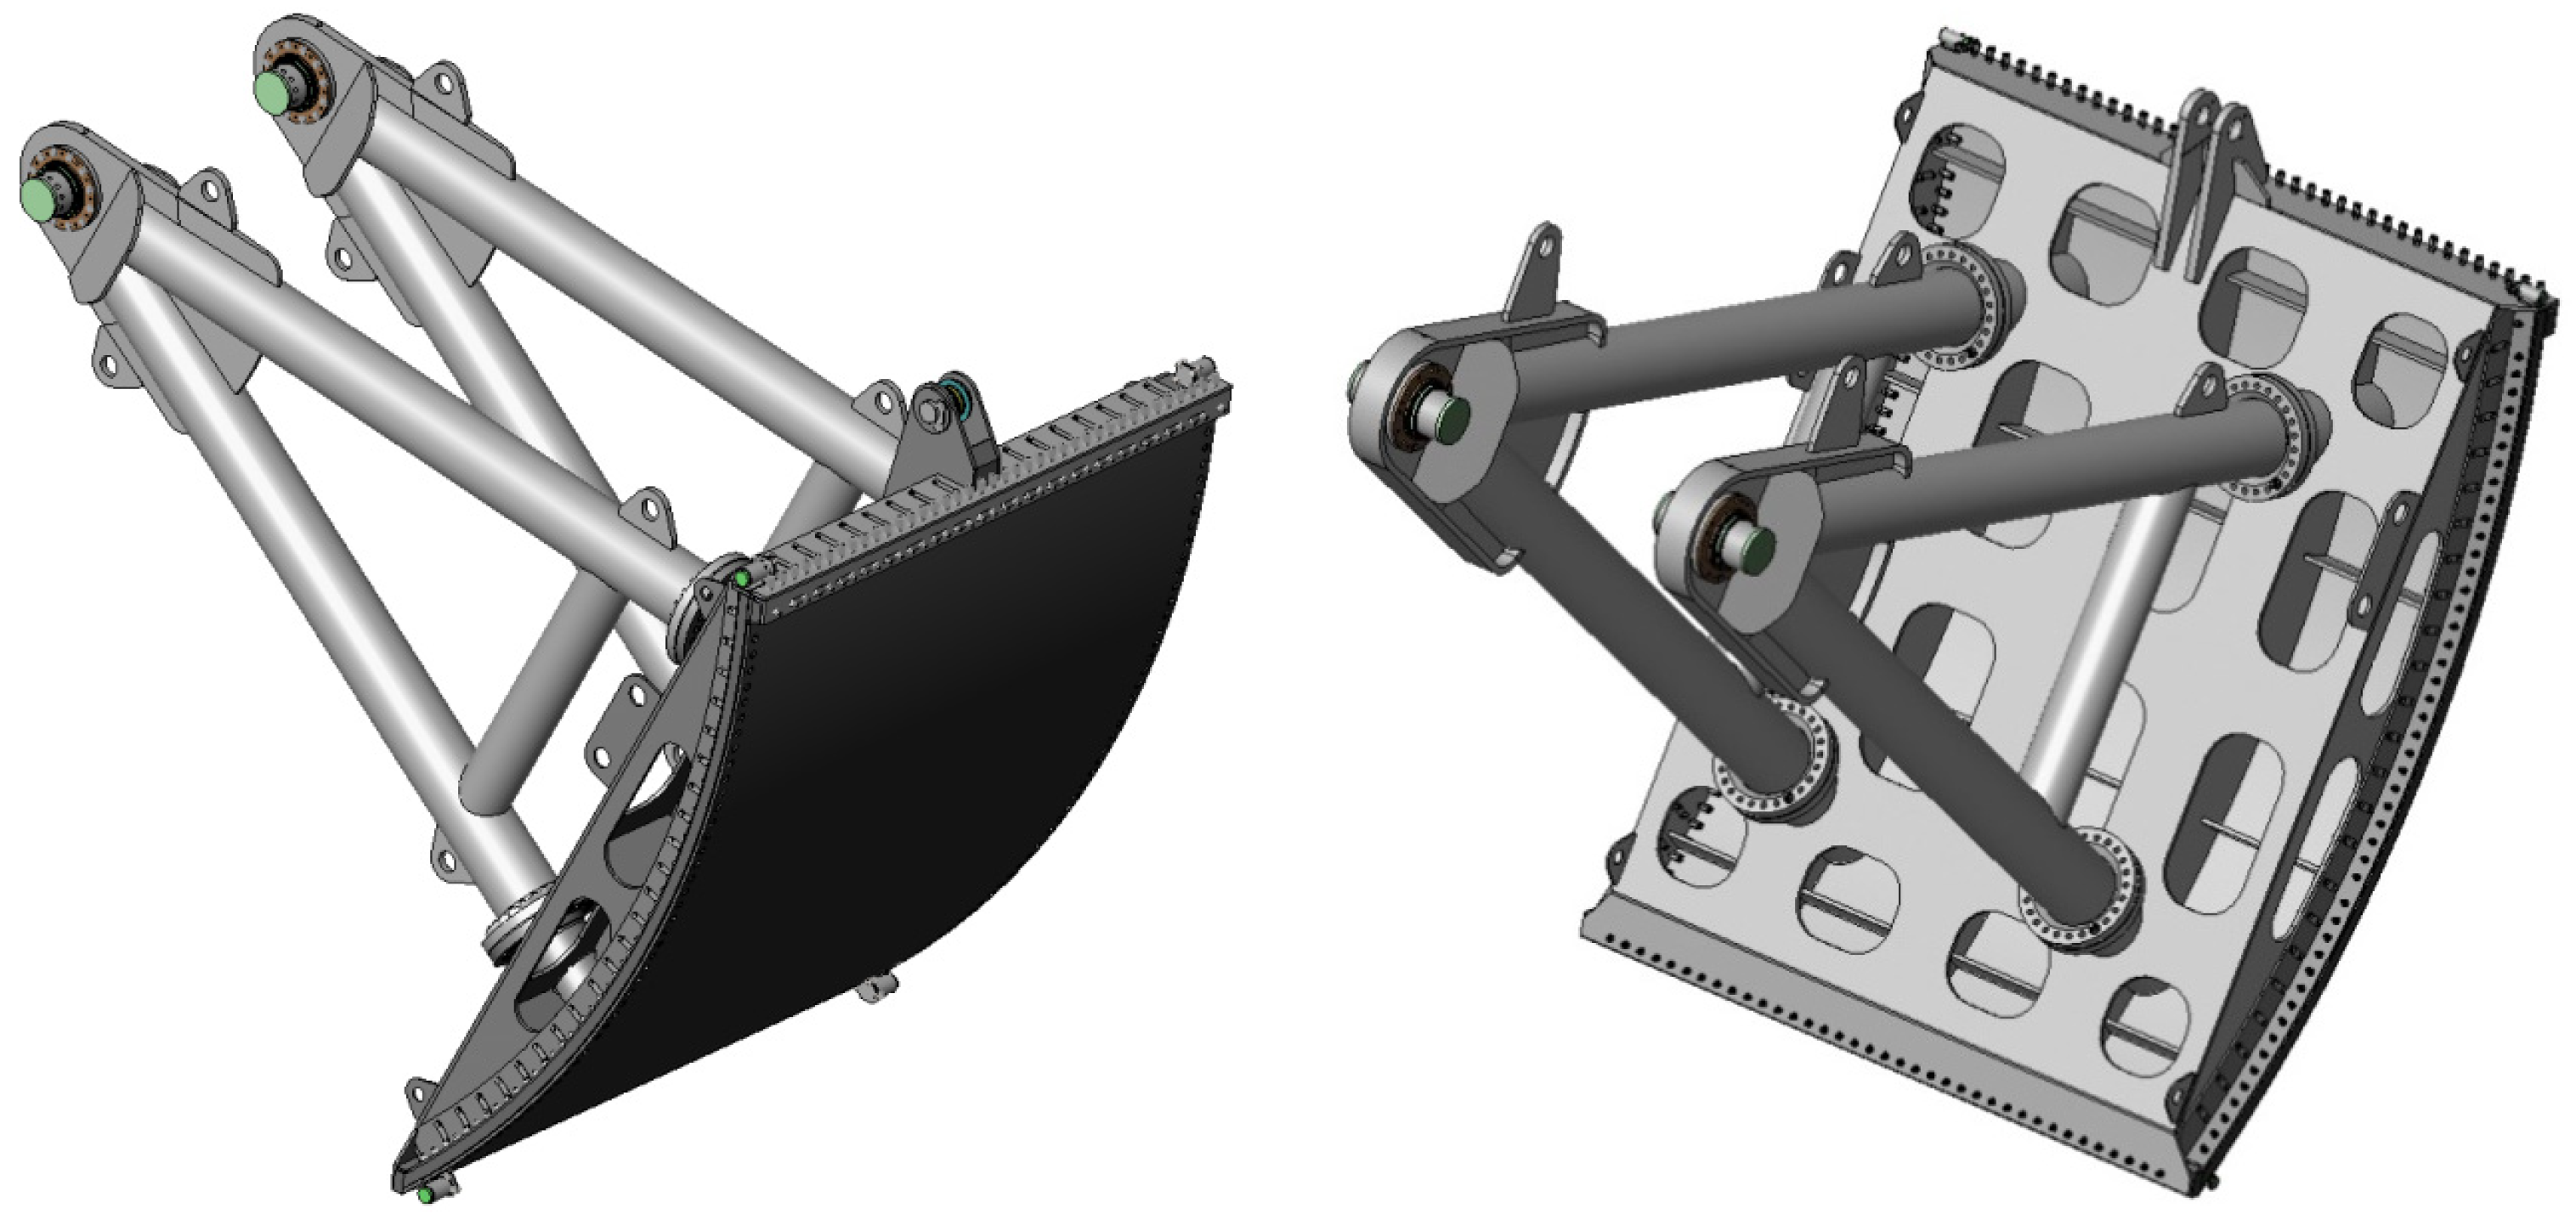
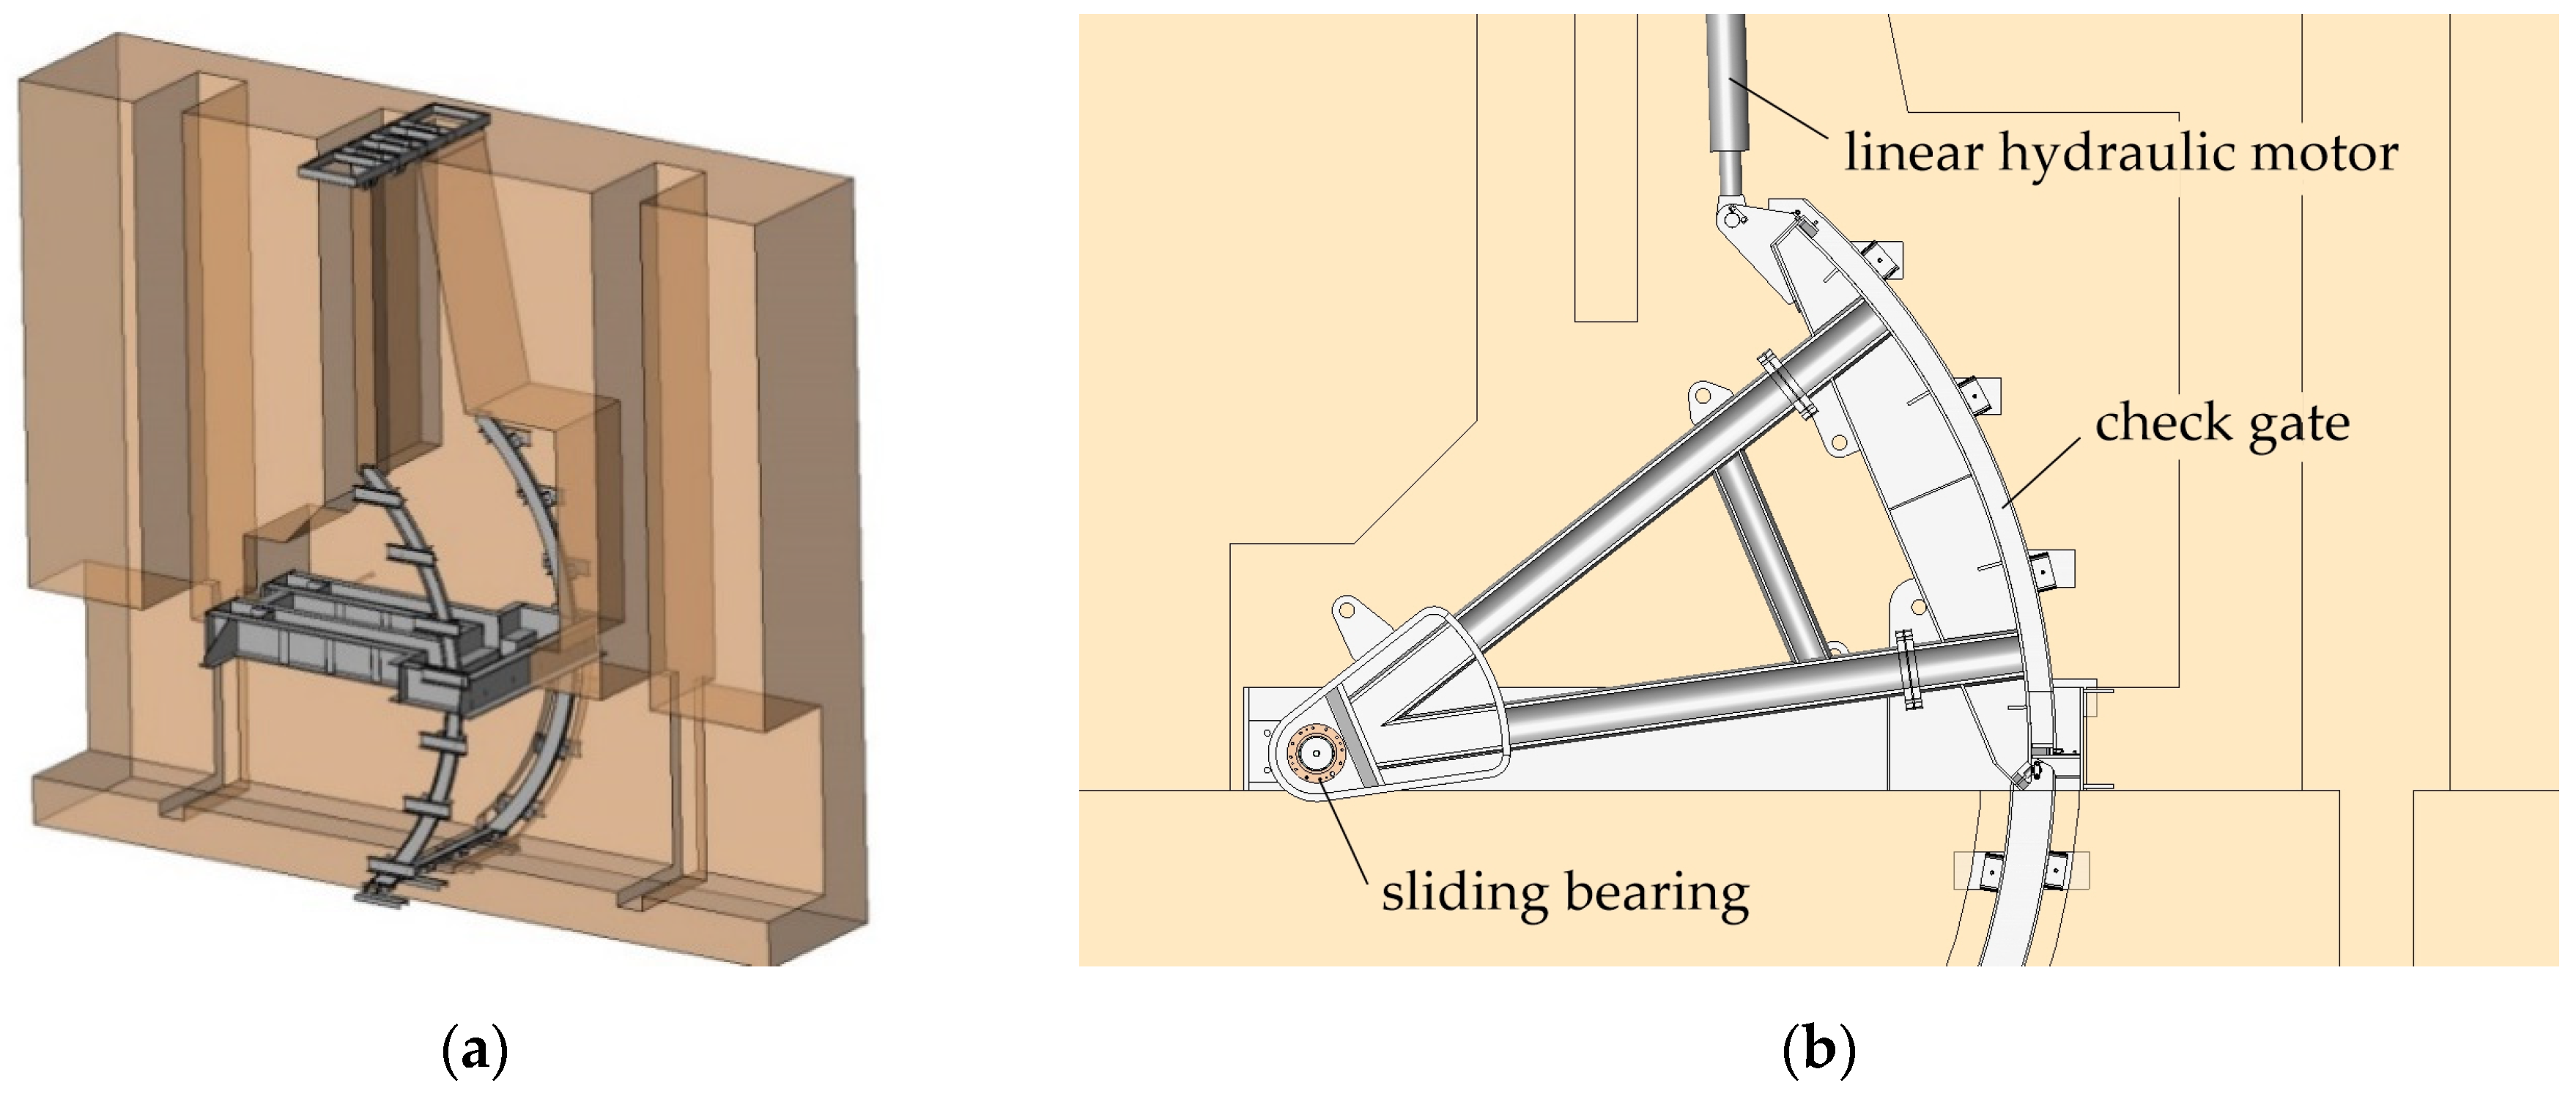
Each ship lock is equipped with four input channels and four output channels, in which the water flow is regulated by inserting the special segment. This regulating segment is called the check gate (Figure 4 and Figure 5). During the operation of the ship lock, one of the check gates installed on the output side of the ship lock was damaged. The output of the ship lock was temporarily closed, and the next function of the ship lock was performed in a provisional operational mode (water from the ship lock was discharged only through three outlets) until a new check gate was manufactured. Constructional improvements have already been applied to the design proposal of the newly manufactured and installed check gate. These improvements were based on experiences obtained during the operation of the existing check gates, and they mainly concerned the elimination of leaks or reduction in leakages to an acceptable value (12 L/s). However, a specific problem occurred after starting the new check gate. The originally installed linear hydraulic motor, which was determined to shift the check gate, was not able to pull it from the limited bottom position.
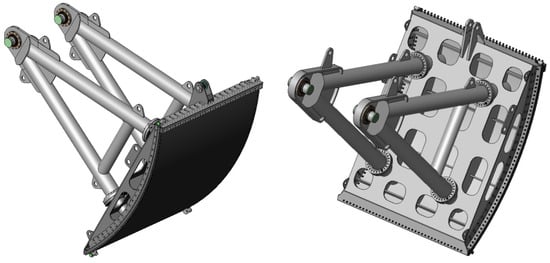
Figure 4.
New construction solution for the check gate in the drain shaft.
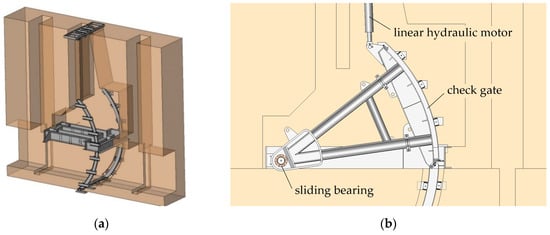
Figure 5.
The check gate segment: (a) Placement of the check gate segment; (b) Cross-section of the working chamber.
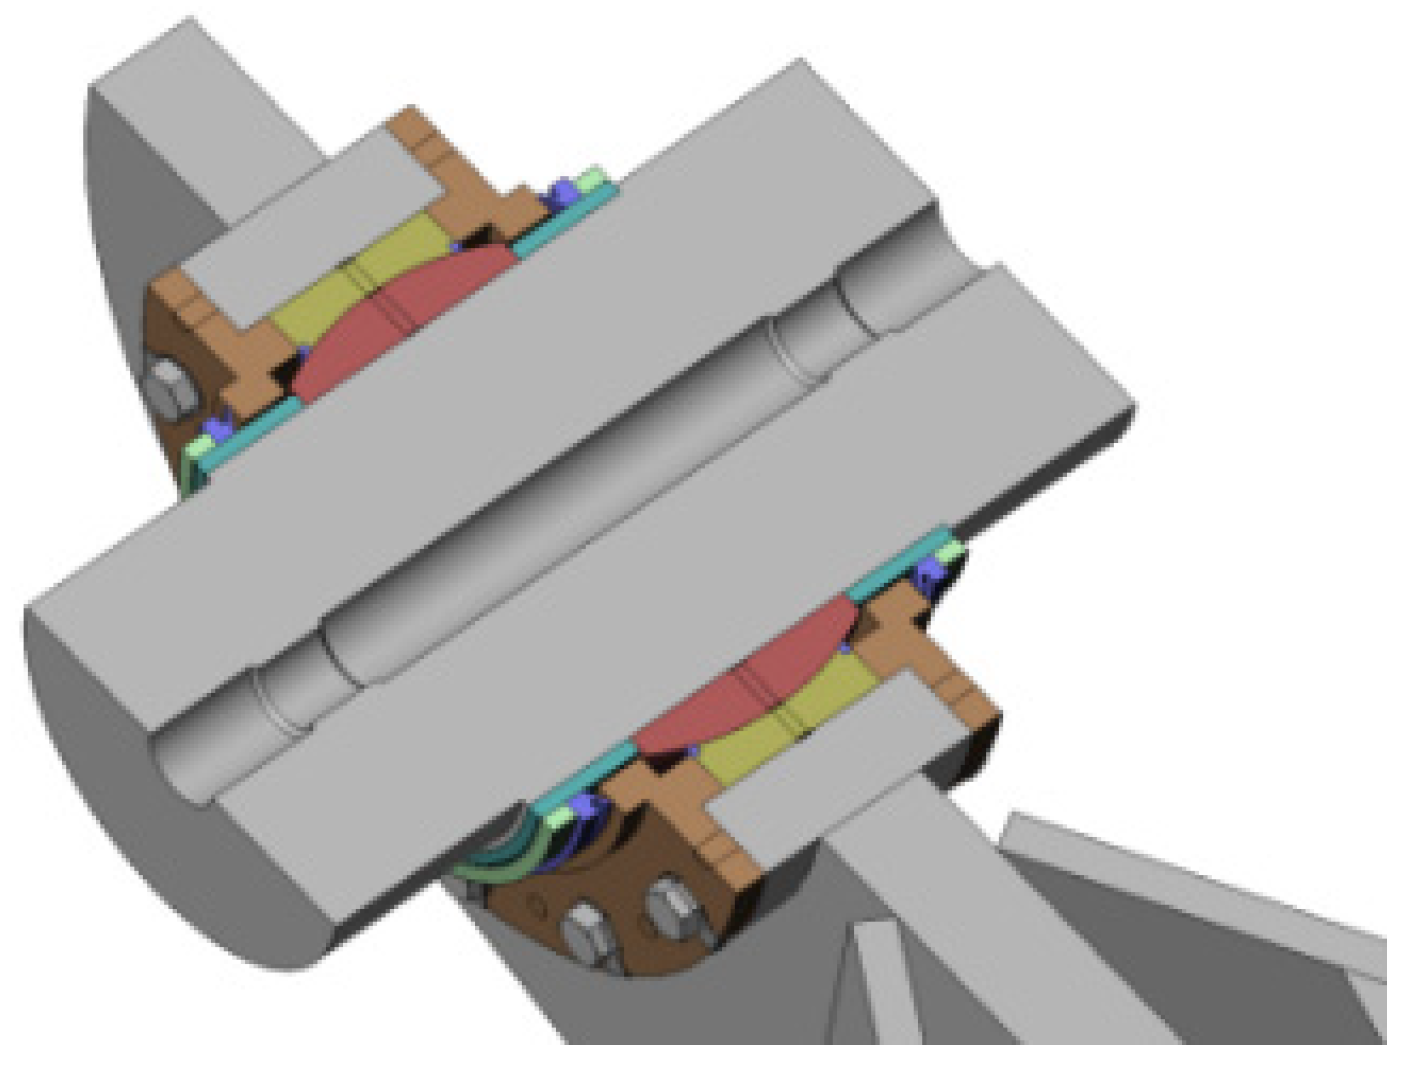
The check gate consists of a welded segment body and two actuating arms. The body of the check gate is a weldment, which is created by a covering metal sheet rounded into a cylindrical shape with an outer radius of 5800 mm and a width, including the seal, of 4000 mm. The shape of the supporting structure is similar to a closed profile. Large oval holes were created in the upper part of the segment. The cover metal sheet is made from stainless steel with an initial thickness of 30 mm, after processing 25 mm. The pipes and flanges determined for connecting the actuating arms are installed in the side parts of the segment. The metal sheets with a thickness of 25 mm are mainly used here. The actuating arms are welded from the 406 × 25 mm tubes, equipped with connecting flanges at the ends for connection to the segment. The placement of the check gate segment and cross-section of the working chamber are shown in Figure 5. Inside the bearing body is installed the stainless steel self-lubricating spherical sliding bearing (Figure 6). Figure 5a (on the left) illustrates the basic frame of the check gate construction. This frame is fixed inside the working chamber. A small frame is situated in the upper part of the frame, to which a linear hydraulic motor is attached. This hydraulic cylinder enables the pushing out and retraction of the check gate. On the sides of the frame, there are installed fixtures to which the check gate sealing is attached. Figure 5b (on the right) offers a view of the check gate in the pushed-out (open) position.
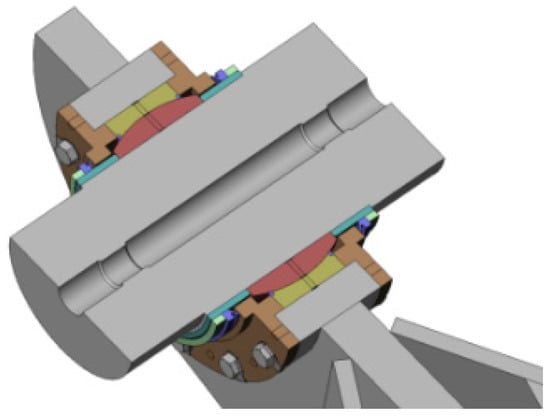
Figure 6.
Self-lubricating spherical sliding bearing.
3. Placement of Sensors and Application of Measuring Boxes
According to the available information, several experiments were performed in the past on older segment constructions using accelerometers. Mapping of the stress distribution on the segment surface was performed using only a simulation model. It was a great challenge for us to measure tensional stress increments on the segment by means of the strain gauge sensors during the real operation of the ship lock. The most difficult task was the transfer of the measured signal from the strain gauge sensor to the measuring apparatus. It was not possible to use cables because the whole segment was moving during operation, the speed of the flowing water was considerable, and there would be a risk of cable damage. The application of wireless data transmission was also impossible because of the amount of concrete used all around and the thickness of the concrete walls, which created almost perfect shielding of the measured signal. After considering several possibilities [24,25,26], we decided to apply the so-called black boxes that were placed on the glued and insulated strain gauge. The inside of the box was equipped with an electric source to power the measuring and recording equipment. The authors also offer interesting solutions and approaches to measurements using strain gauges [27,28,29,30].
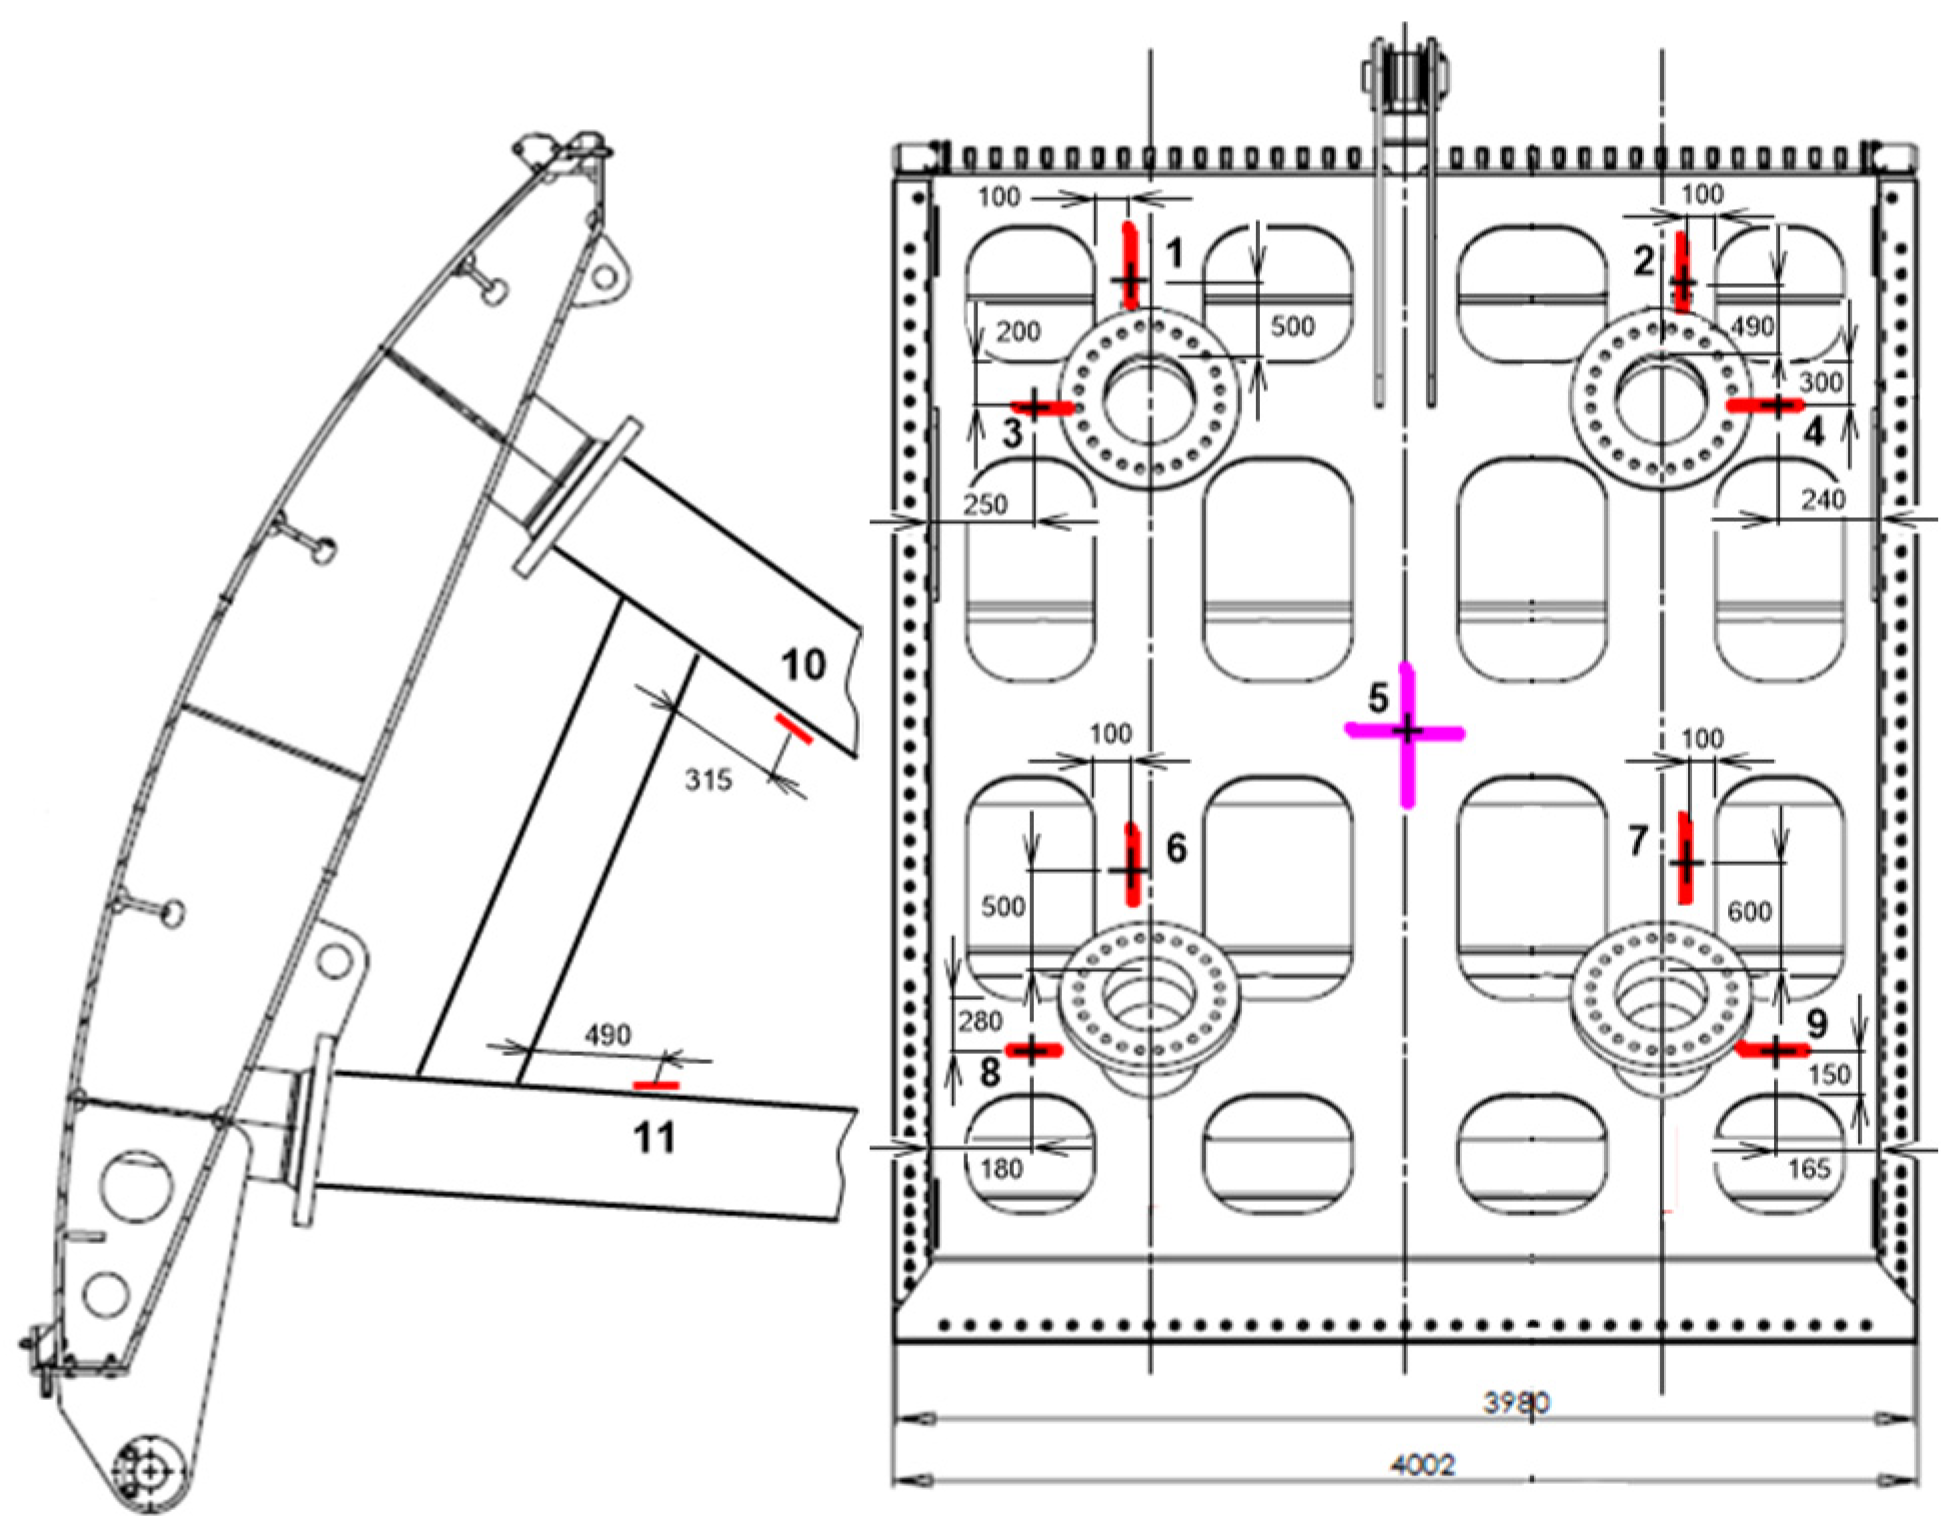
The strain gauge sensors were applied to the check gate segment, as shown in Figure 7. Originally, a different placement of the sensors was planned. Except for sensor No. 5, the application places of the other sensors from No. 1 to No. 9 had to be shifted from the center (according to the axis of symmetry between the holes in the segment) because the black box construction was proposed for an even surface. The pre-selected application places of the black boxes showed considerable unevenness. There were welded reinforcing ribs on one side of the plate, and on the other side of the plate were situated fixtures determined for attaching sensors with other constructional solutions. Therefore, the black box could not be sufficiently sealed against pressurized water in a prepared manner on such a surface. We were looking for such places that would be located as close as possible to the proposed ones, but the places with sufficient planeness, which is necessary for sealing the black boxes and at the same time ensuring that the measured data would not be affected by the welds or by reinforcing ribs situated on the welded construction. Compared to the original design, sensors No. 6 and 7 are placed above the flange because it was not possible to reach the indicated places with the applied technical equipment when the segment was in the top pulled position. On the other hand, when the segment was in the bottom position at the time of measurement, the chamber was flooded with about 2 m of water. Sensors No.10 and 11 were placed in such a way that the fixing cables of the measuring boxes did not have to go around the obstacles.
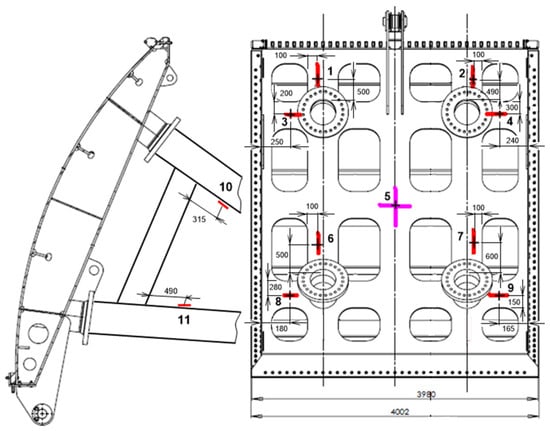
Figure 7.
Placement positions of strain gauge sensors (the numbers in figure represent the individual strain gauge sensors, the colors mean directions of the measured stresses).
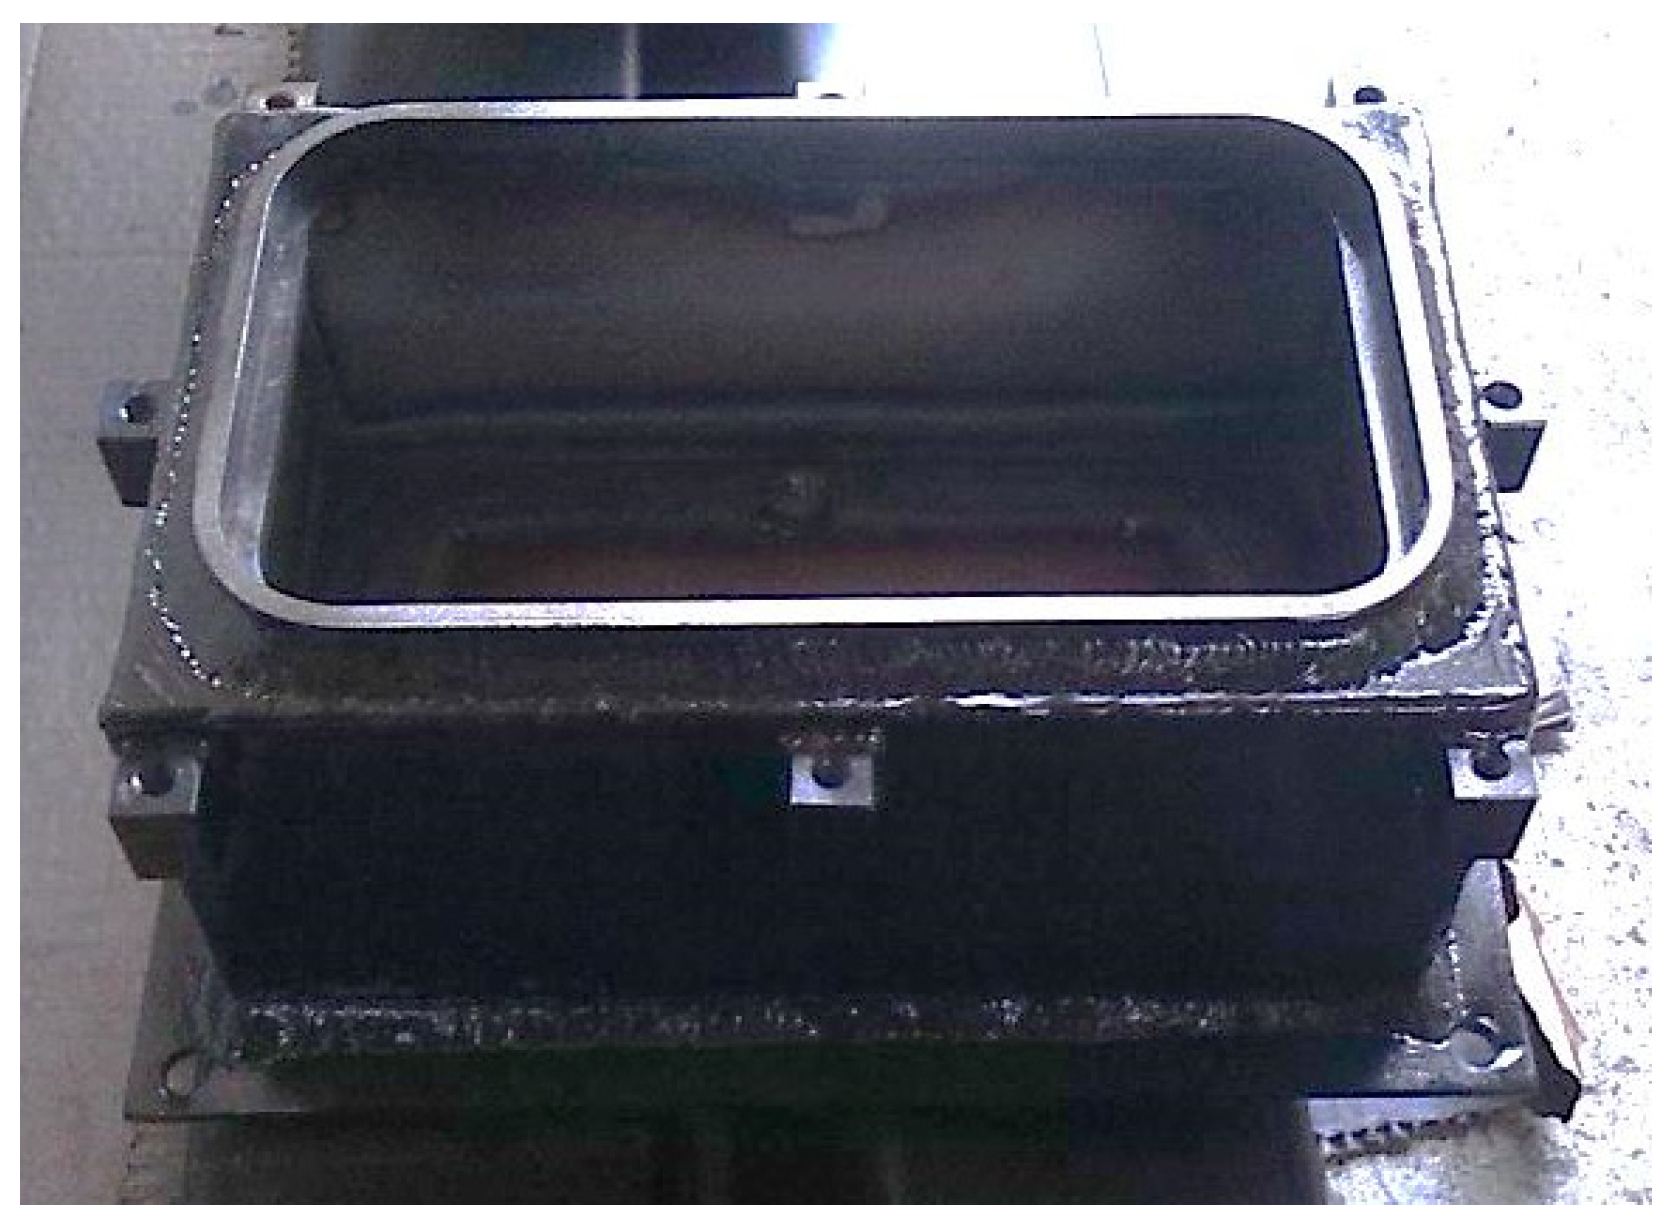
During the standard operation, the measured segment is flooded with water and is exposed to significant pressure caused by the flowing water. This fact required a technical proposal for such a measuring device that is able to work in these extreme conditions and, at the same time, must meet waterproof conditions to prevent damage to the measuring electronics. For this purpose, a special waterproof box (Figure 8) was designed, which was firmly fixed to the check gate segment. This special box ensures the protection of both the strain gauge sensors and the power supply battery, together with the measuring electronics.
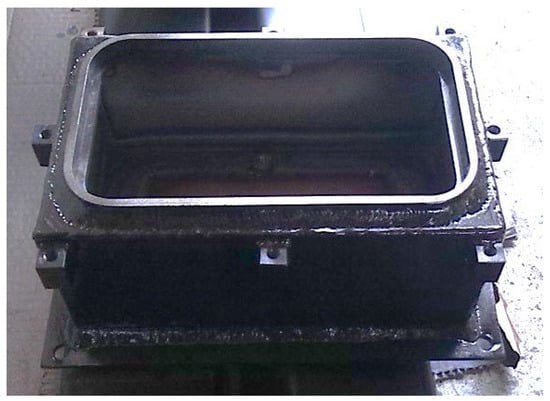
Figure 8.
Waterproof box.
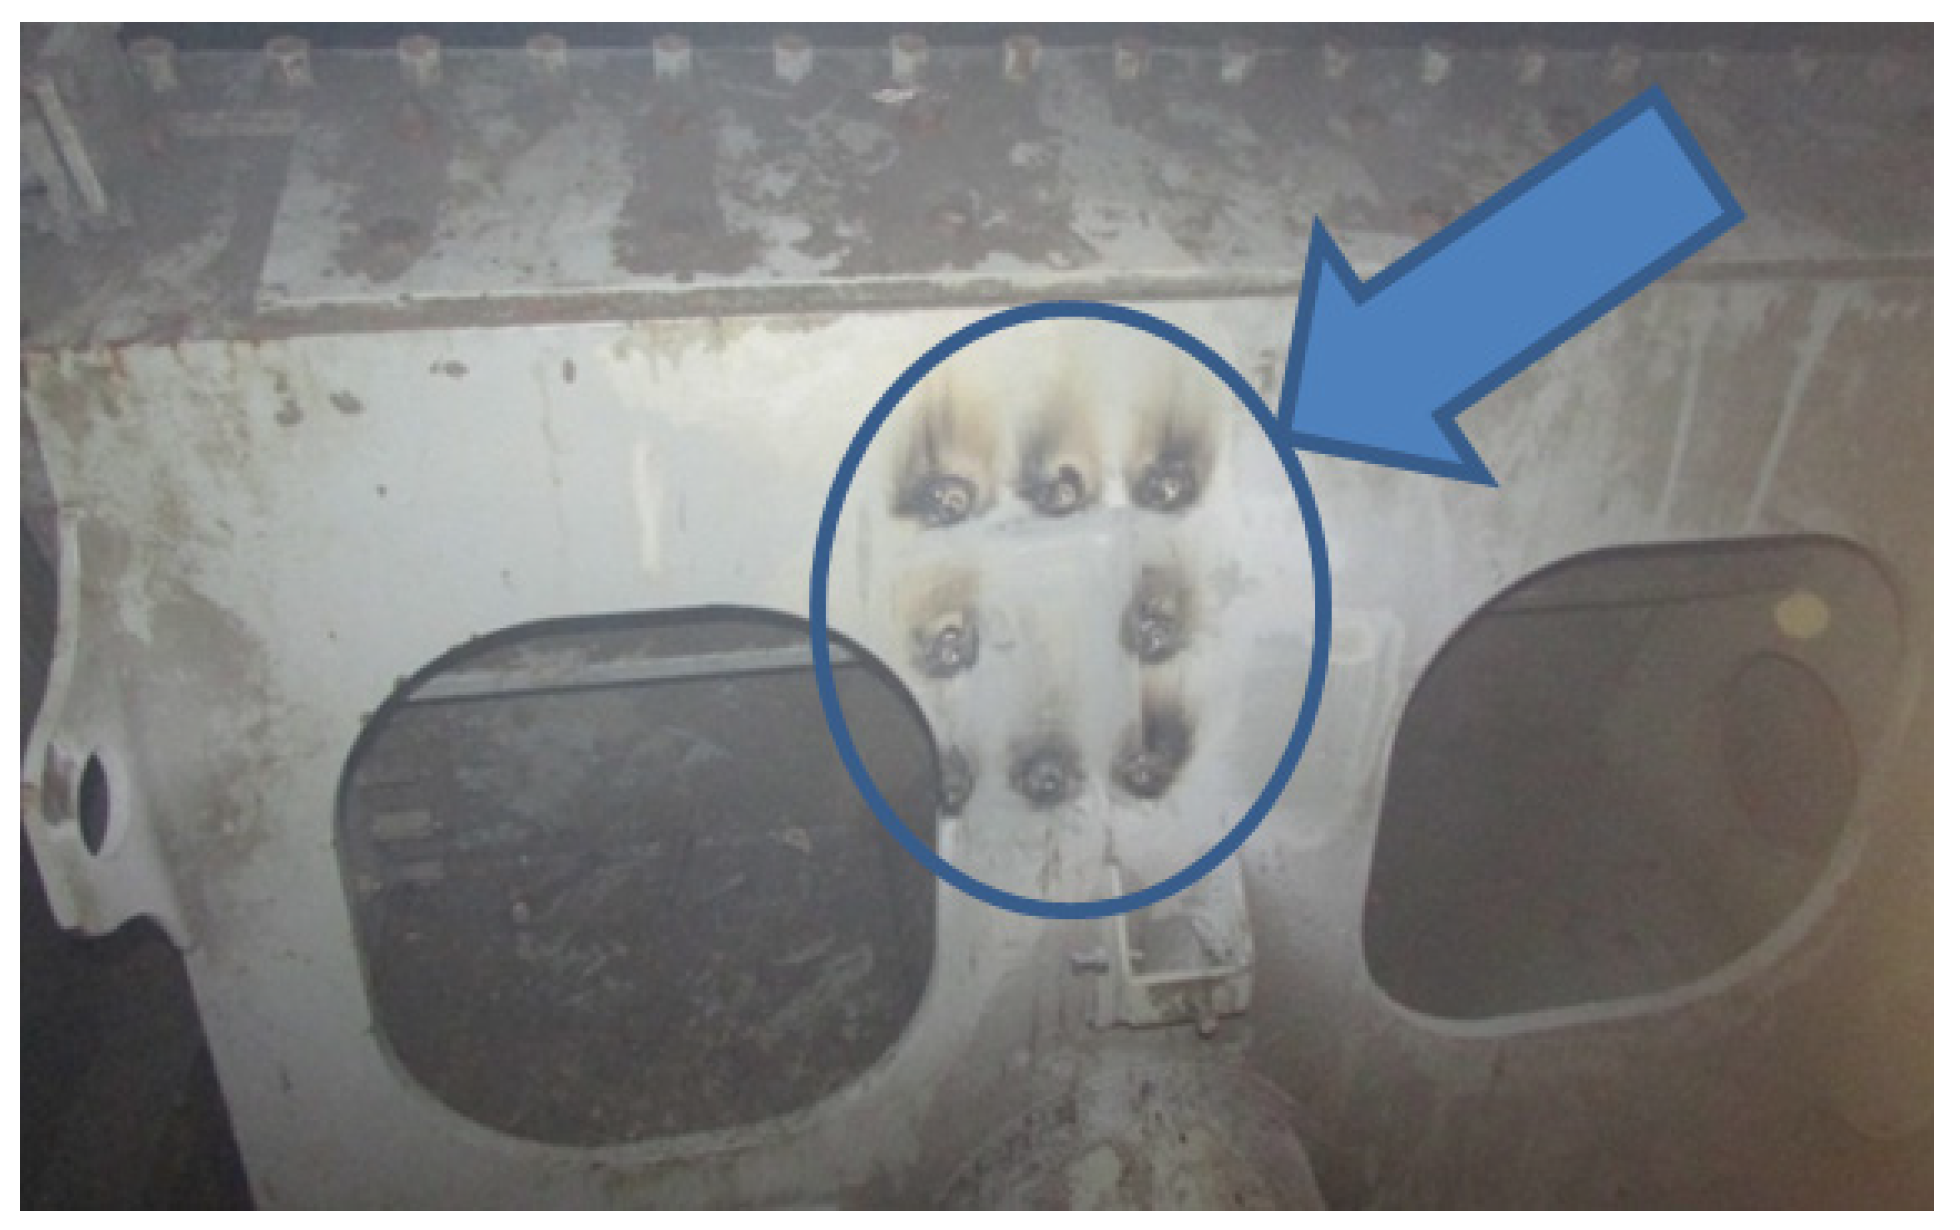
The procedure for the application of the strain gauges began with the determination and marking of the measuring point positions. Consequently, the segment was pre-prepared for fixation of the waterproof boxes by welding eight fixing points (Figure 9) necessary for each measuring point.
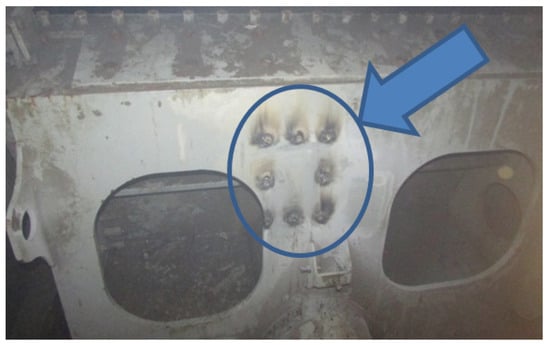
Figure 9.
Fixing points for boxes (the blue arrow means position of eight fixing points).
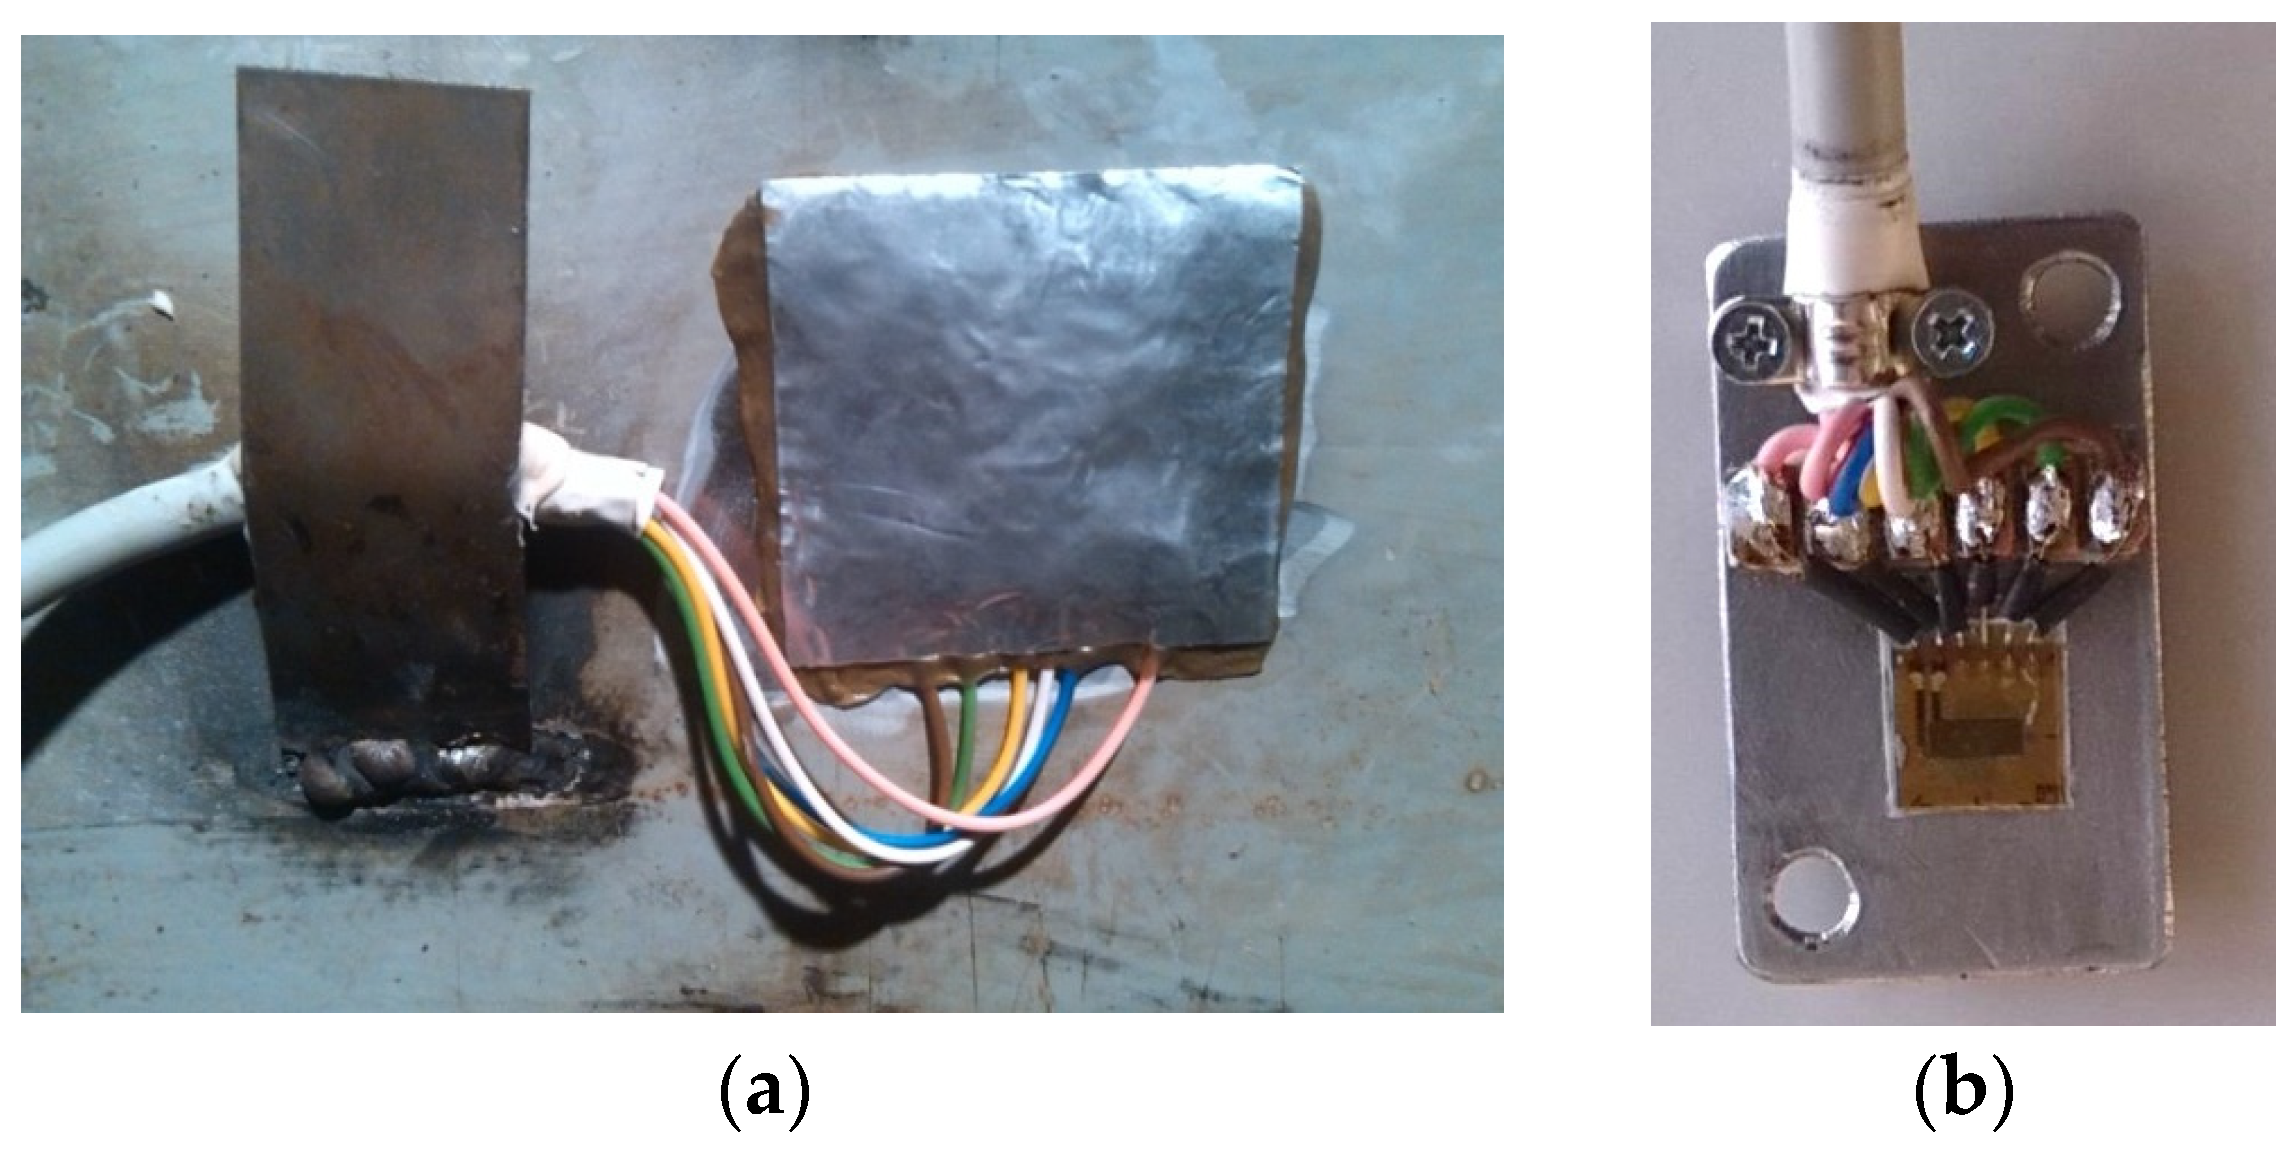
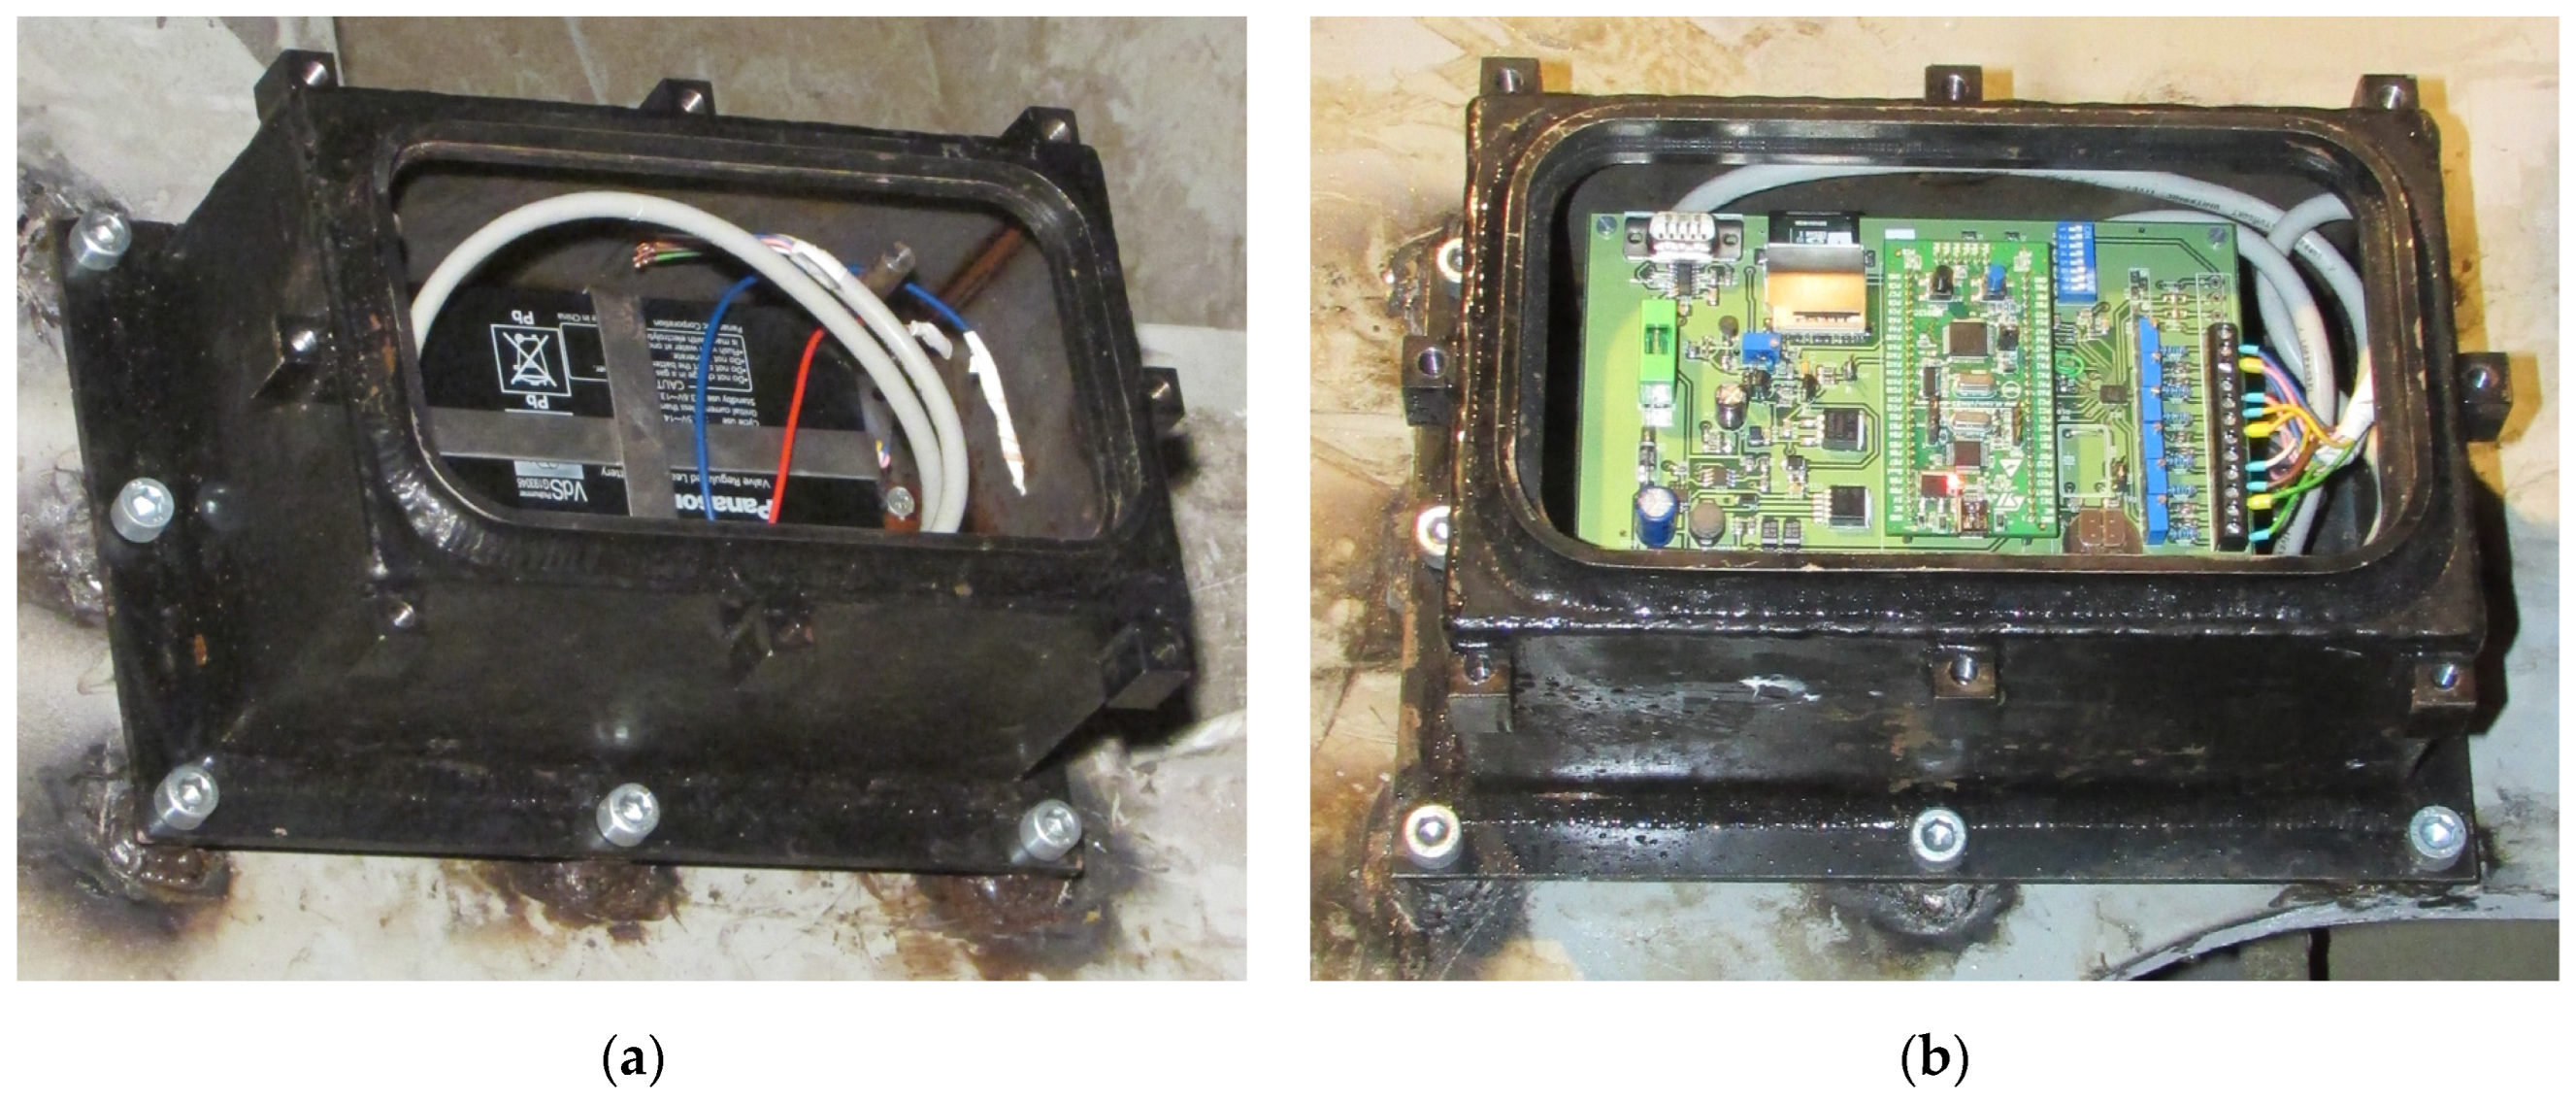
The temperature compensation was realized by means of a compensation strain gauge, which was installed inside the waterproof box and connected to the measuring strain gauge placed on the segment surface (Figure 10). After the installation and connection of the strain gauge sensors, the waterproof box, together with the power supply battery, was screwed to the segment (Figure 11).
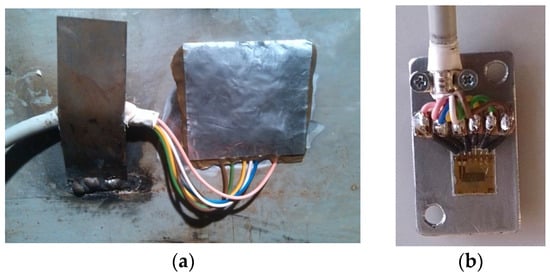
Figure 10.
Strain gauge sensor: (a) With insulating film ABM 75; (b) Temperature compensation of sensor.
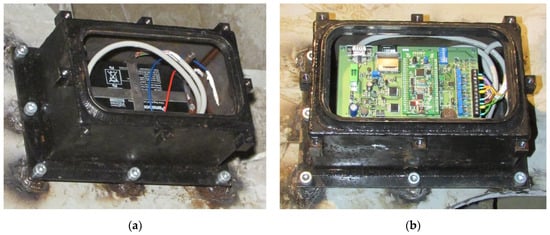
Figure 11.
Installed box with battery: (a) Without measuring electronics; (b) With connected measuring electronics.
The applied measuring electronics is a special device intended for the collection of data obtained from the strain gauges during measurement, for data holding, and for data storage on an SD card or an MMC card with a possibility of subsequent data export into the corresponding PC. These electronics were made especially for the one-shot measurement.
4. Data Accumulation and Processing System Structure
For this purpose, a special device equipped with a microchip was developed—i.e., the so-called black box, which permanently recorded the measured signals. The proposed measuring chain recorded measured values of the selected parameters in an online operational regime. In our case, the measured parameters were the mechanical stress values. The given device consisted of two parts. One part was the measuring unit, together with the data collection unit. The second part was the visualization unit. The measuring unit and the data collection unit were placed inside the black box. The black box had to be resistant to mechanical shocks because it was applied to a moving device. Since the black box was operated at a great depth underwater, it also had to be waterproof. However, the most difficult problem was to solve the power supply of the measuring circuits because each battery has a limited capacity, and in the case of low temperatures, the endurance of the battery is reduced. The battery dimensions also determined the size of the black box. To process the measured data, it was necessary to remove the SD card with the recorded data from each black box. Removing the SD cards required the assistance of divers in order for the ship lock to be drained, and subsequently, the divers removed SD cards from the black boxes for further processing of the obtained measured data.
4.1. Measurement Chain and Its Organisation
We proposed and applied a highly automated measuring chain, which transforms the analogous output obtained from the sensor (strain gauge sensor), after its amplification by the measuring amplifier, into a digital output and stores it in the memory. Only a minimal operator intervention is required in this case. It is possible to manually set up the sampling frequency to correct the amplitude accuracy (if some of the sensors are working in a non-linear area or exceed the frequency range) as well as to correct the noise distortions of signal caused by other electrical equipment [31].
In our case, we monitored the course of a mechanical quantity, which was measured electrically (using the strain gauge sensors). This measuring method transforms a change in mechanical stress (change in mechanical deformation) into a change in electrical resistance. The strain gauge sensors were mutually interconnected into the Wheatstone bridge, which is one of the most precise evaluation methods. The strain gauge bridge operated using the constant current to eliminate the linearity error, limit temperature dependence, and increase sensitivity.
4.2. Signal Sampling
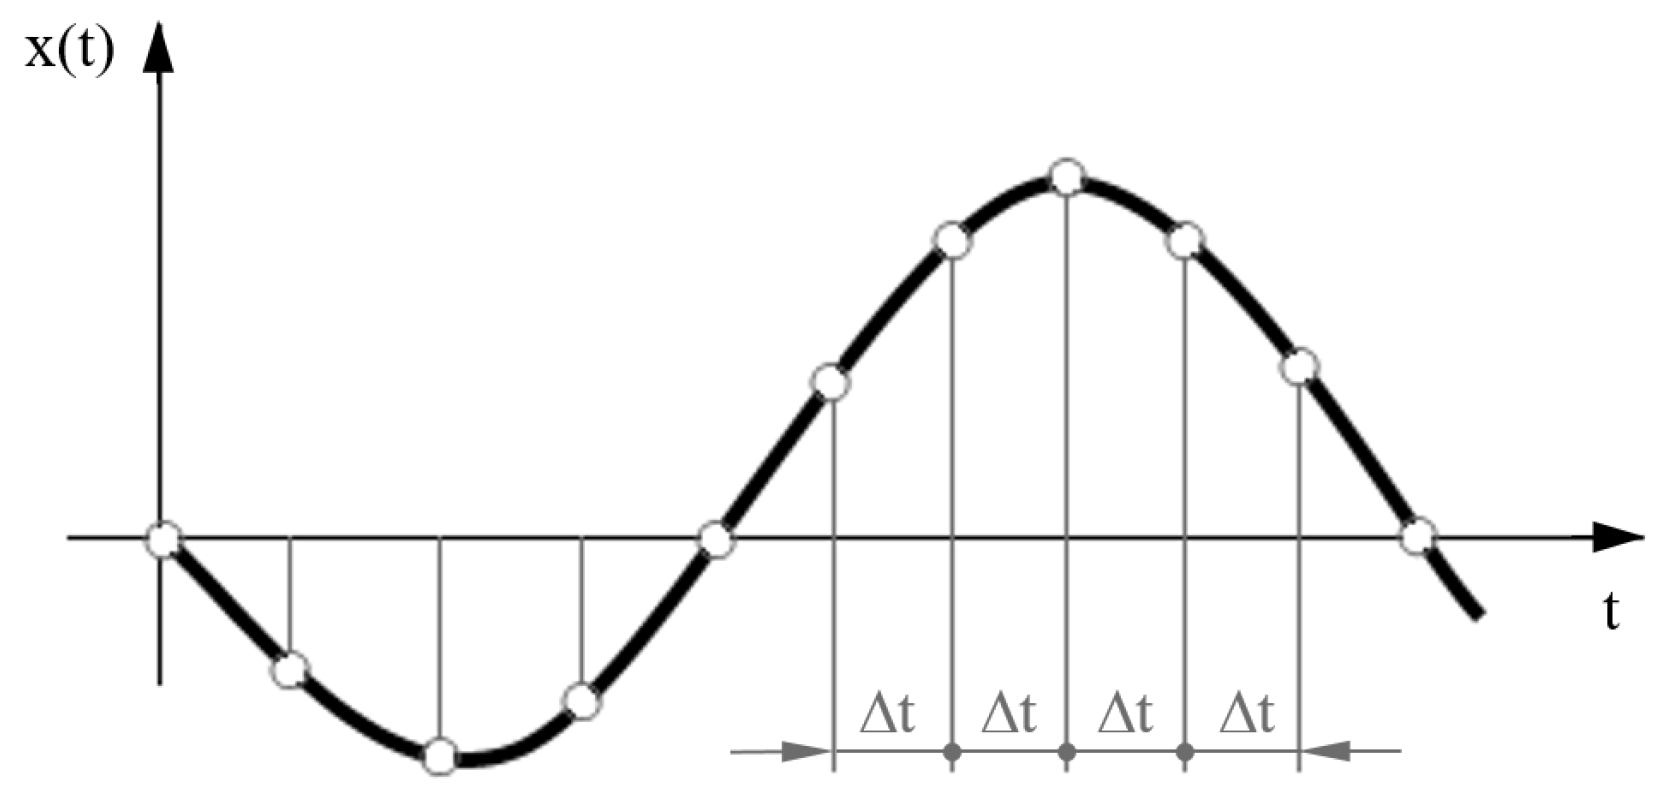
Signal sampling was programmed by recording the signal in the equidistant time intervals ∆t (Figure 12). If the maximum (the highest) frequency of the analyzed signal is known in advance, the sampling frequency can be determined according to the Shannon–Kotelnik criterion ∆t = 1/2 fmax. If it is required to obtain the characteristics of a random process, it is suitable to choose higher values of the sampling frequencies. Namely, in our case, the applied sampling frequency value was fs = (8 to 10) fmax.
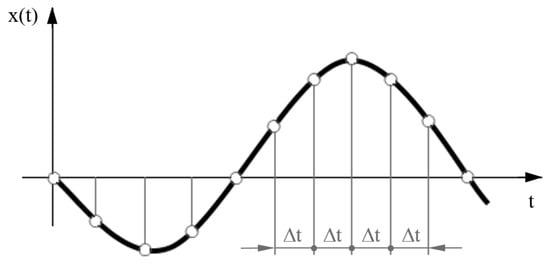
Figure 12.
Signal sampling.
4.3. System Structure
The electrical signal generated by the strain gauge sensor (by changing the sensor resistance) is processed in accordance with the sequence, which is presented in Figure 13.

Figure 13.
Basic device functions during signal processing.
Modification of the recorded signal consists of several steps. At first, the signal level is adjusted because only certain signal frequencies are important for further processing, and these frequencies are filtered out from the signal. The circuit impedances are also modified. The sampled signal represents input to the converter, where the amplitude values are transformed into binary numbers [32].
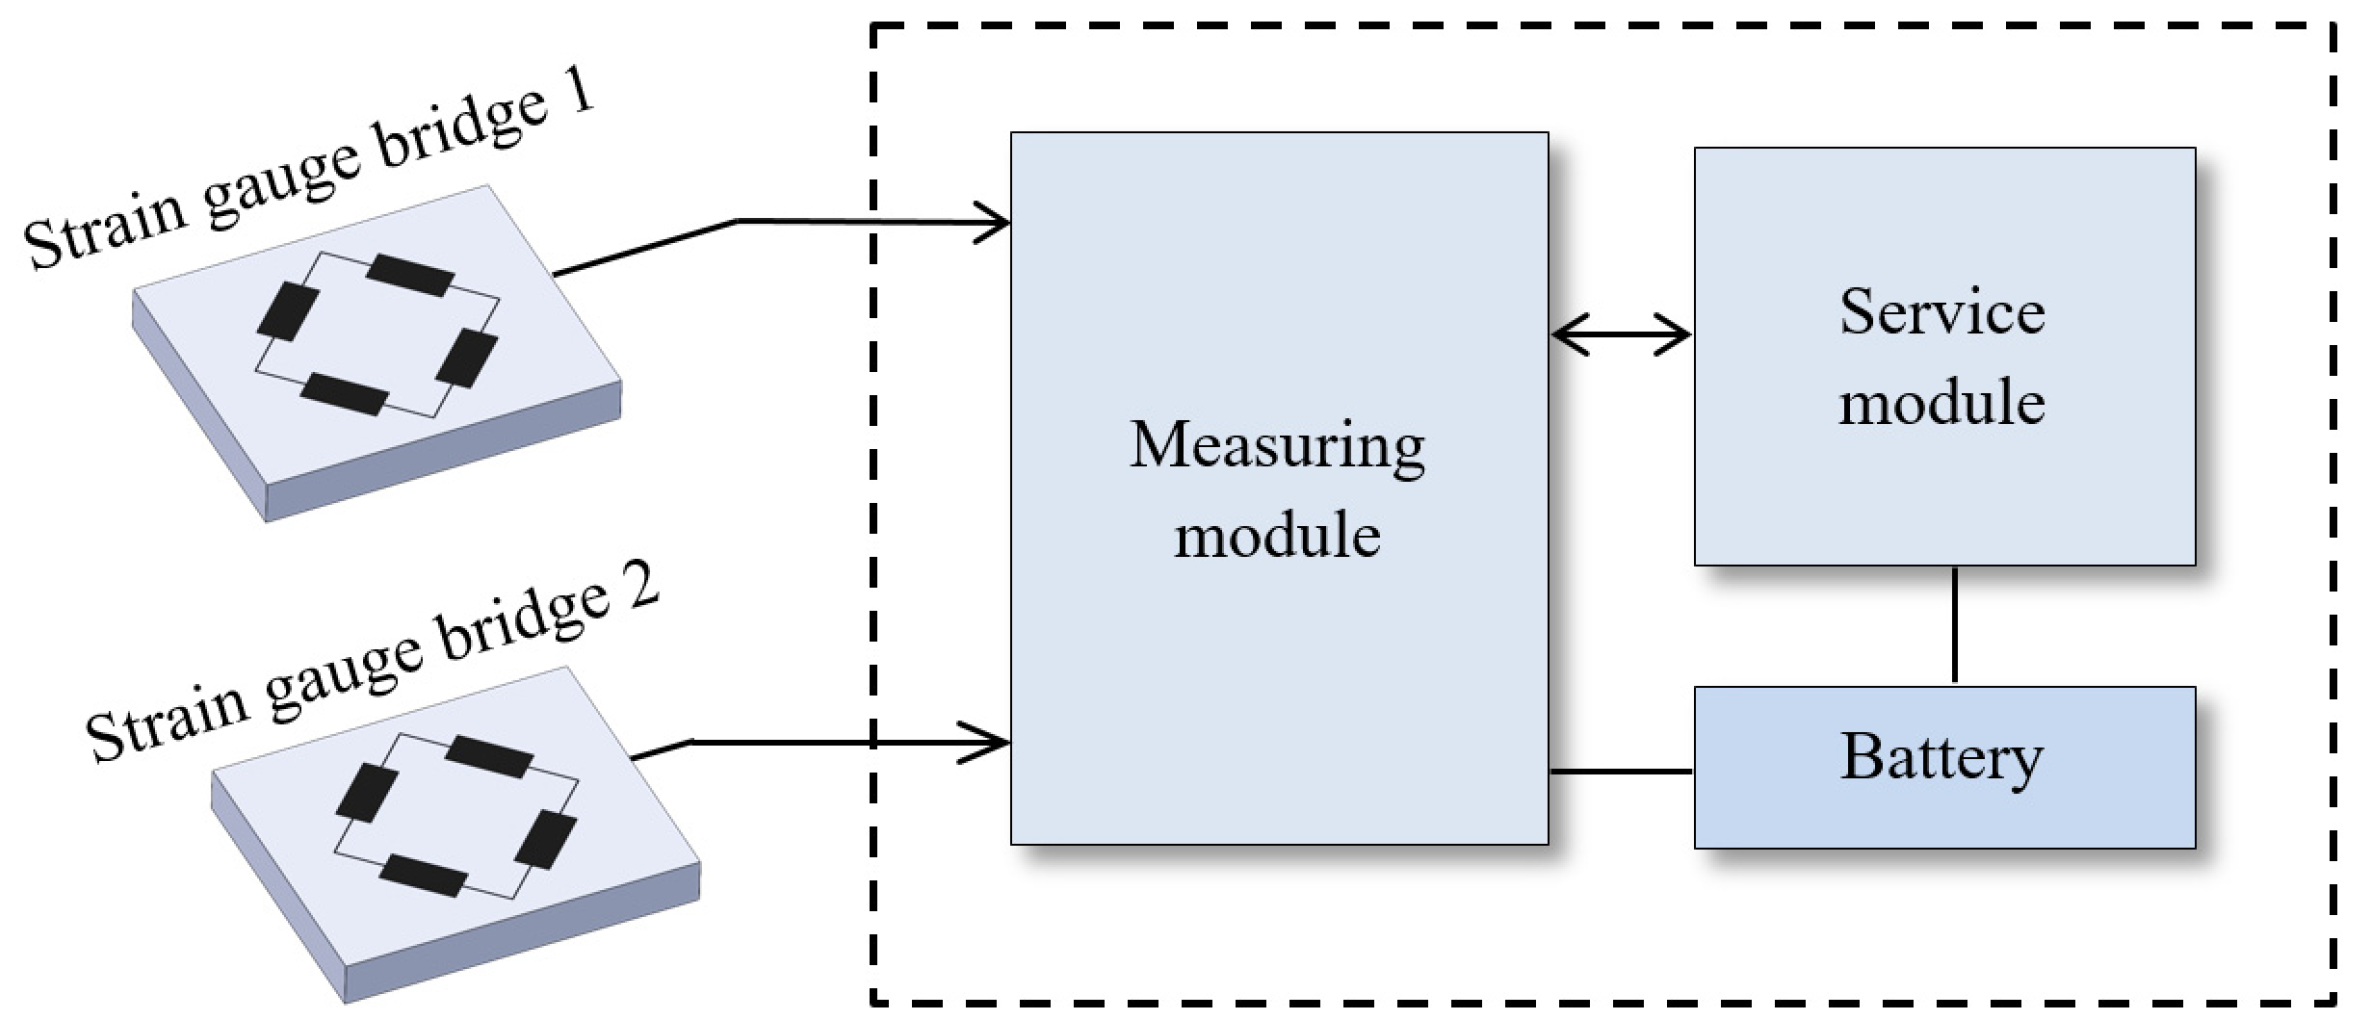
The collection unit and its block diagram are illustrated in Figure 14. This unit, as a whole, consists of three basic modules—the measuring module, the service module, and the power supply module [33].
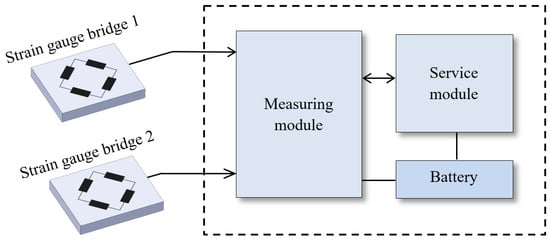
Figure 14.
Accumulating unit.
The core of the measuring module is the control microcomputer serving the whole measuring part, and the service module is connected to the measuring module via a serial interface. The voltage of the power supply battery ensures the required levels of supply voltages for the measuring module and service module. The necessary levels of supply voltages are created by combinations of the linear and impulse stabilizers, taking into consideration the necessary stability of the supply voltage and also a possible interference.
4.4. Software
The main task of the software equipment determined for the operation of the control microcomputer is to ensure the functioning of the whole process necessary for sampling the measured signal and storing the data in the computer memory. The given software also ensures communication between the service module and the interface determined for connecting to a personal computer [34,35,36]. The parameters are set up using a simple keyboard and an LCD display.
5. Strain Gauge Measurement of the Segment
Within testing of the sensors, the unloaded segment was manipulated to the maximum upper position and also to the minimum lower position during the so-called “dry measurements”, which means without filled water. The data obtained from this measurement were used to determine the pressure values in the hydraulic cylinder during empty handling, i.e., on condition when the segment is loaded only by its own weight. Two main measurement modes were defined for the realization of the measuring process. These modes were repeated three times. The first measuring mode simulated real operational conditions, and the second measuring mode simulated analogous conditions, however, at a reduced opening speed of the check gate. The real operational conditions included draining the ship lock until such difference in water levels, which is used during the operational mode and at the opening speed of the check gate set up according to the operational rules. The whole measurement was carried out for two days. On the first measuring day, the measurements were performed on the check gate with the installed check gate sealing. During the second measuring day, the measurements were realized without the check gate sealing but using the same measuring regimes. Disassembly of the sealing required cooperation with divers.
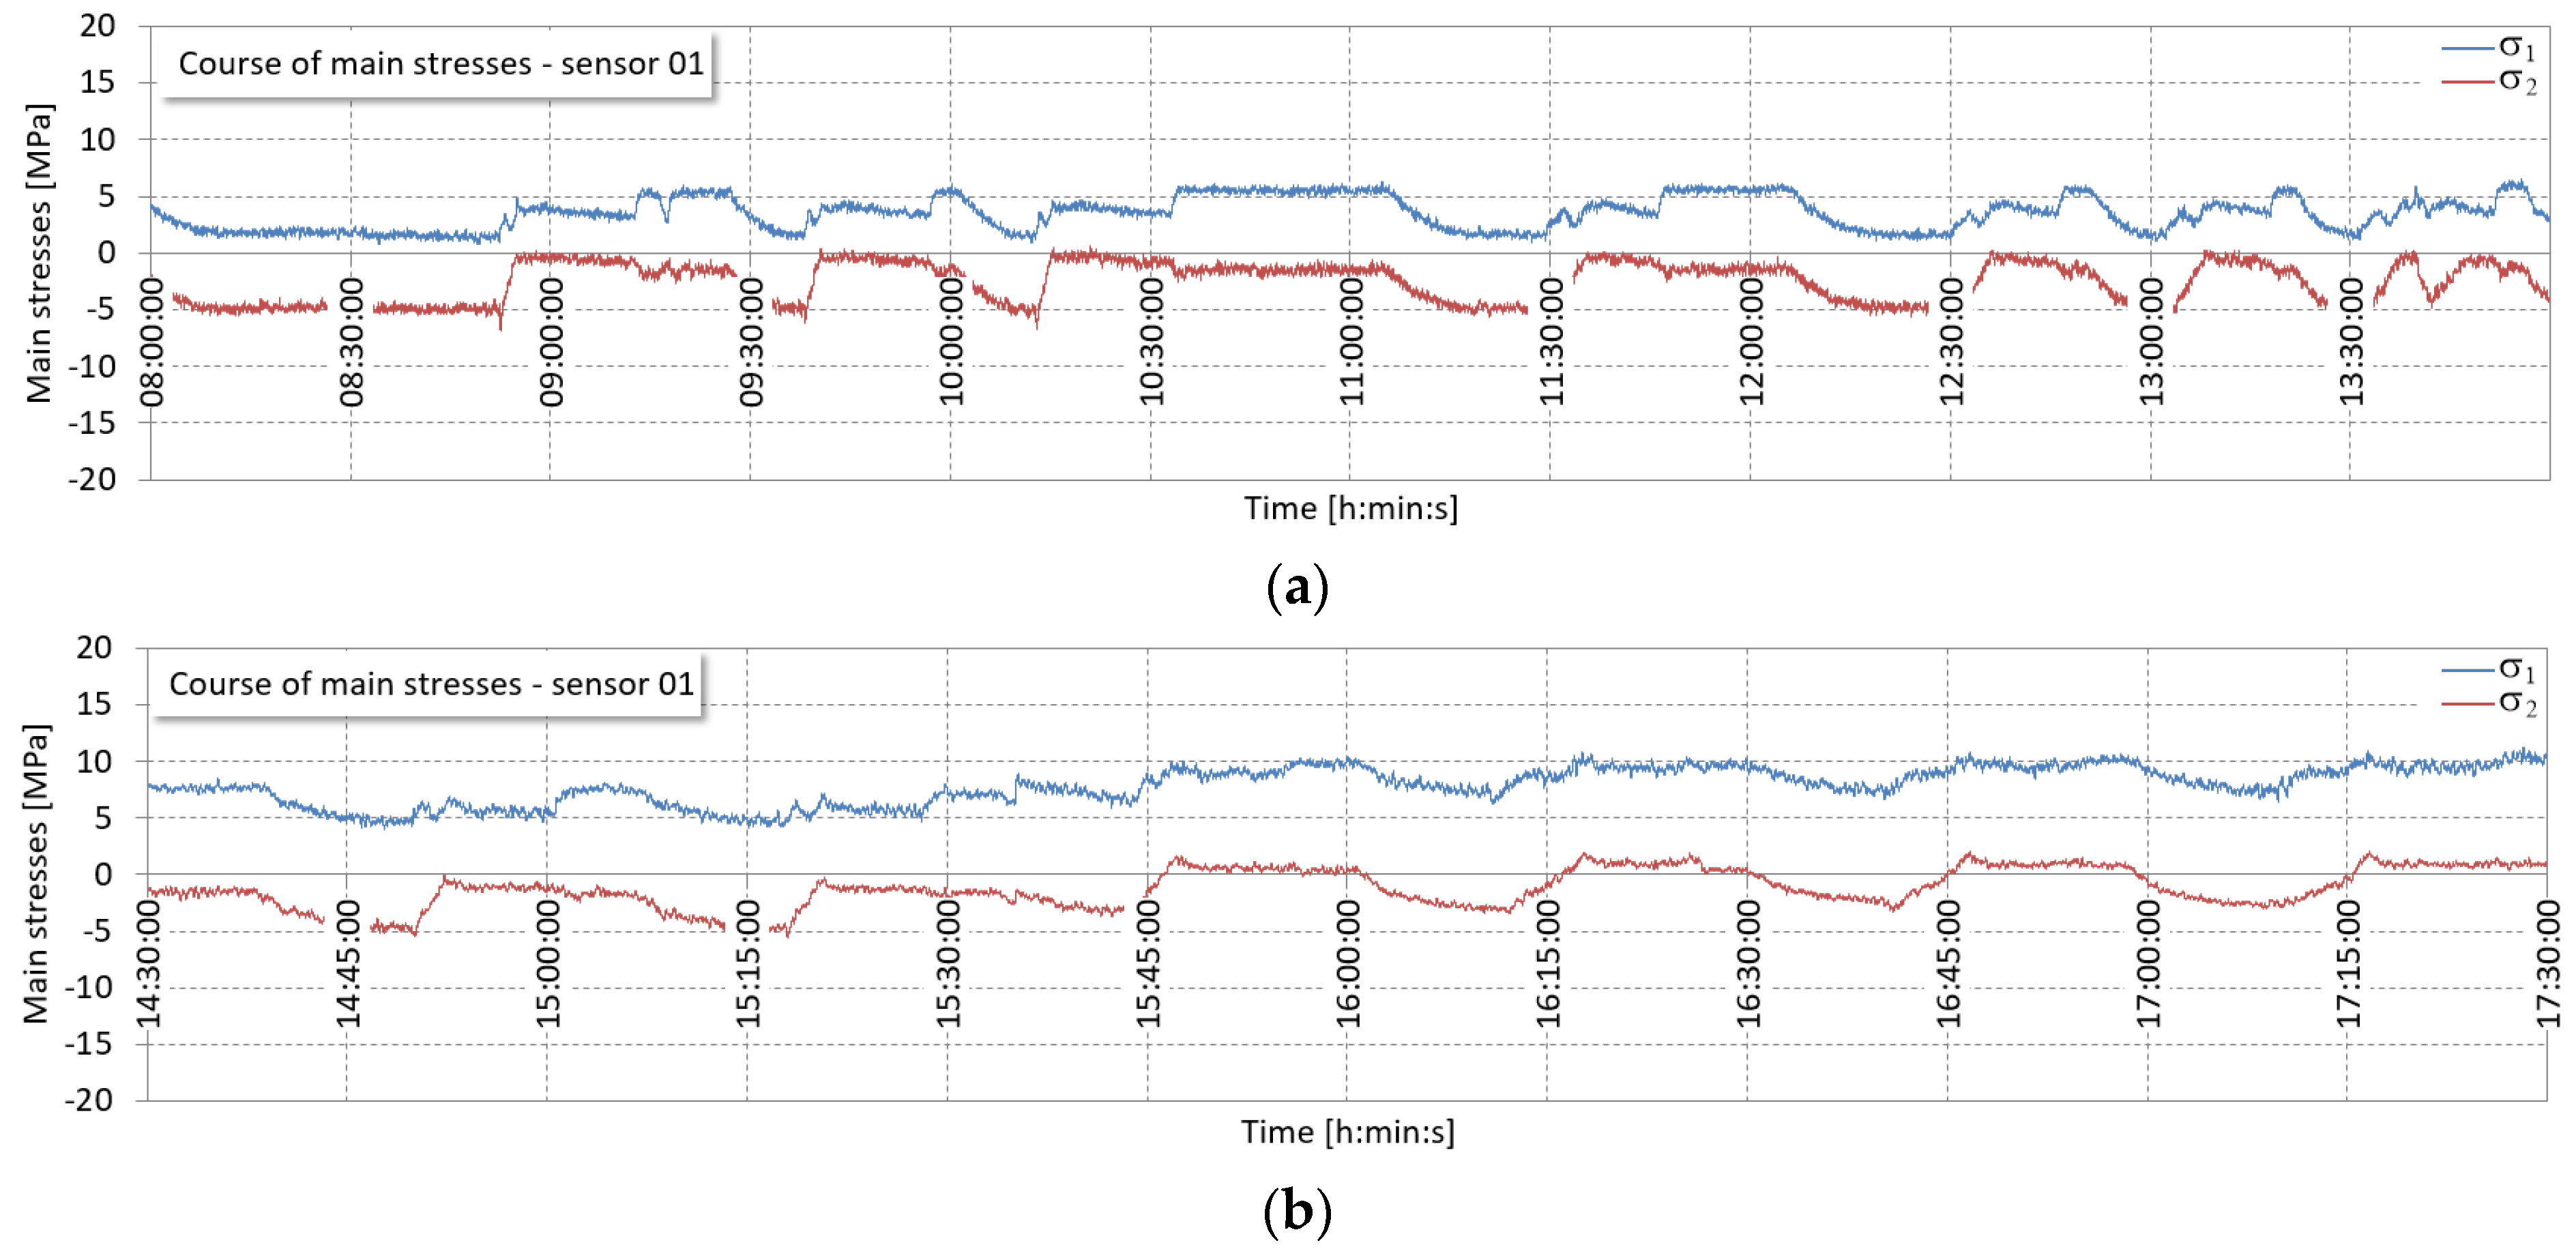
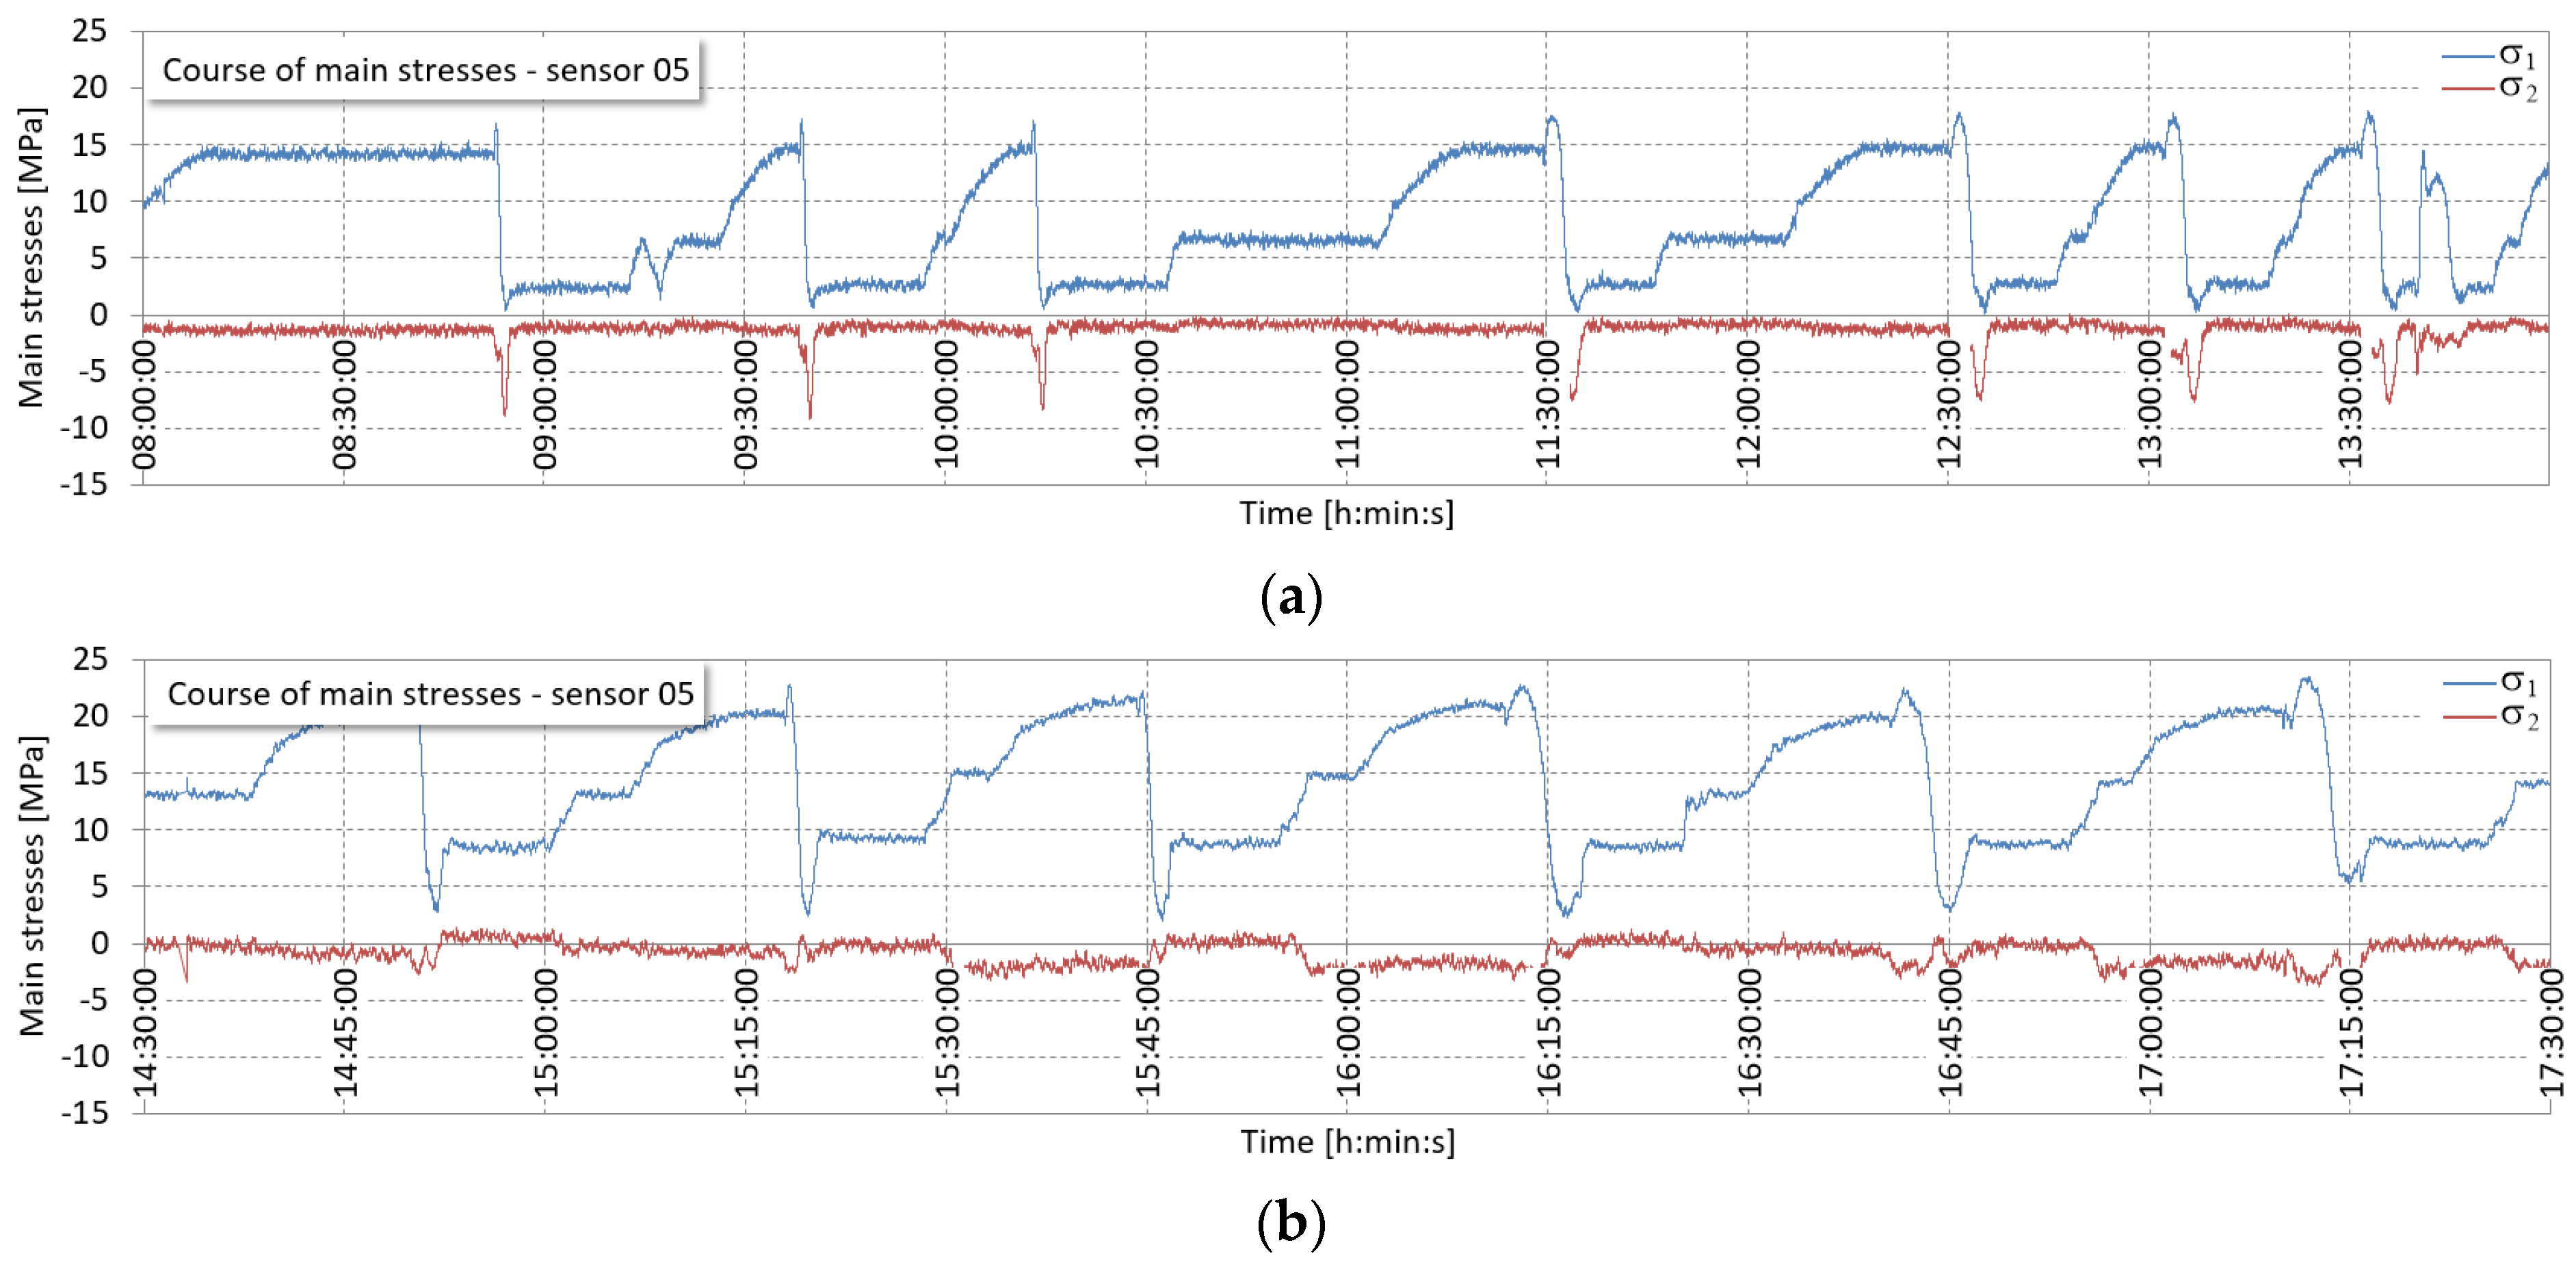
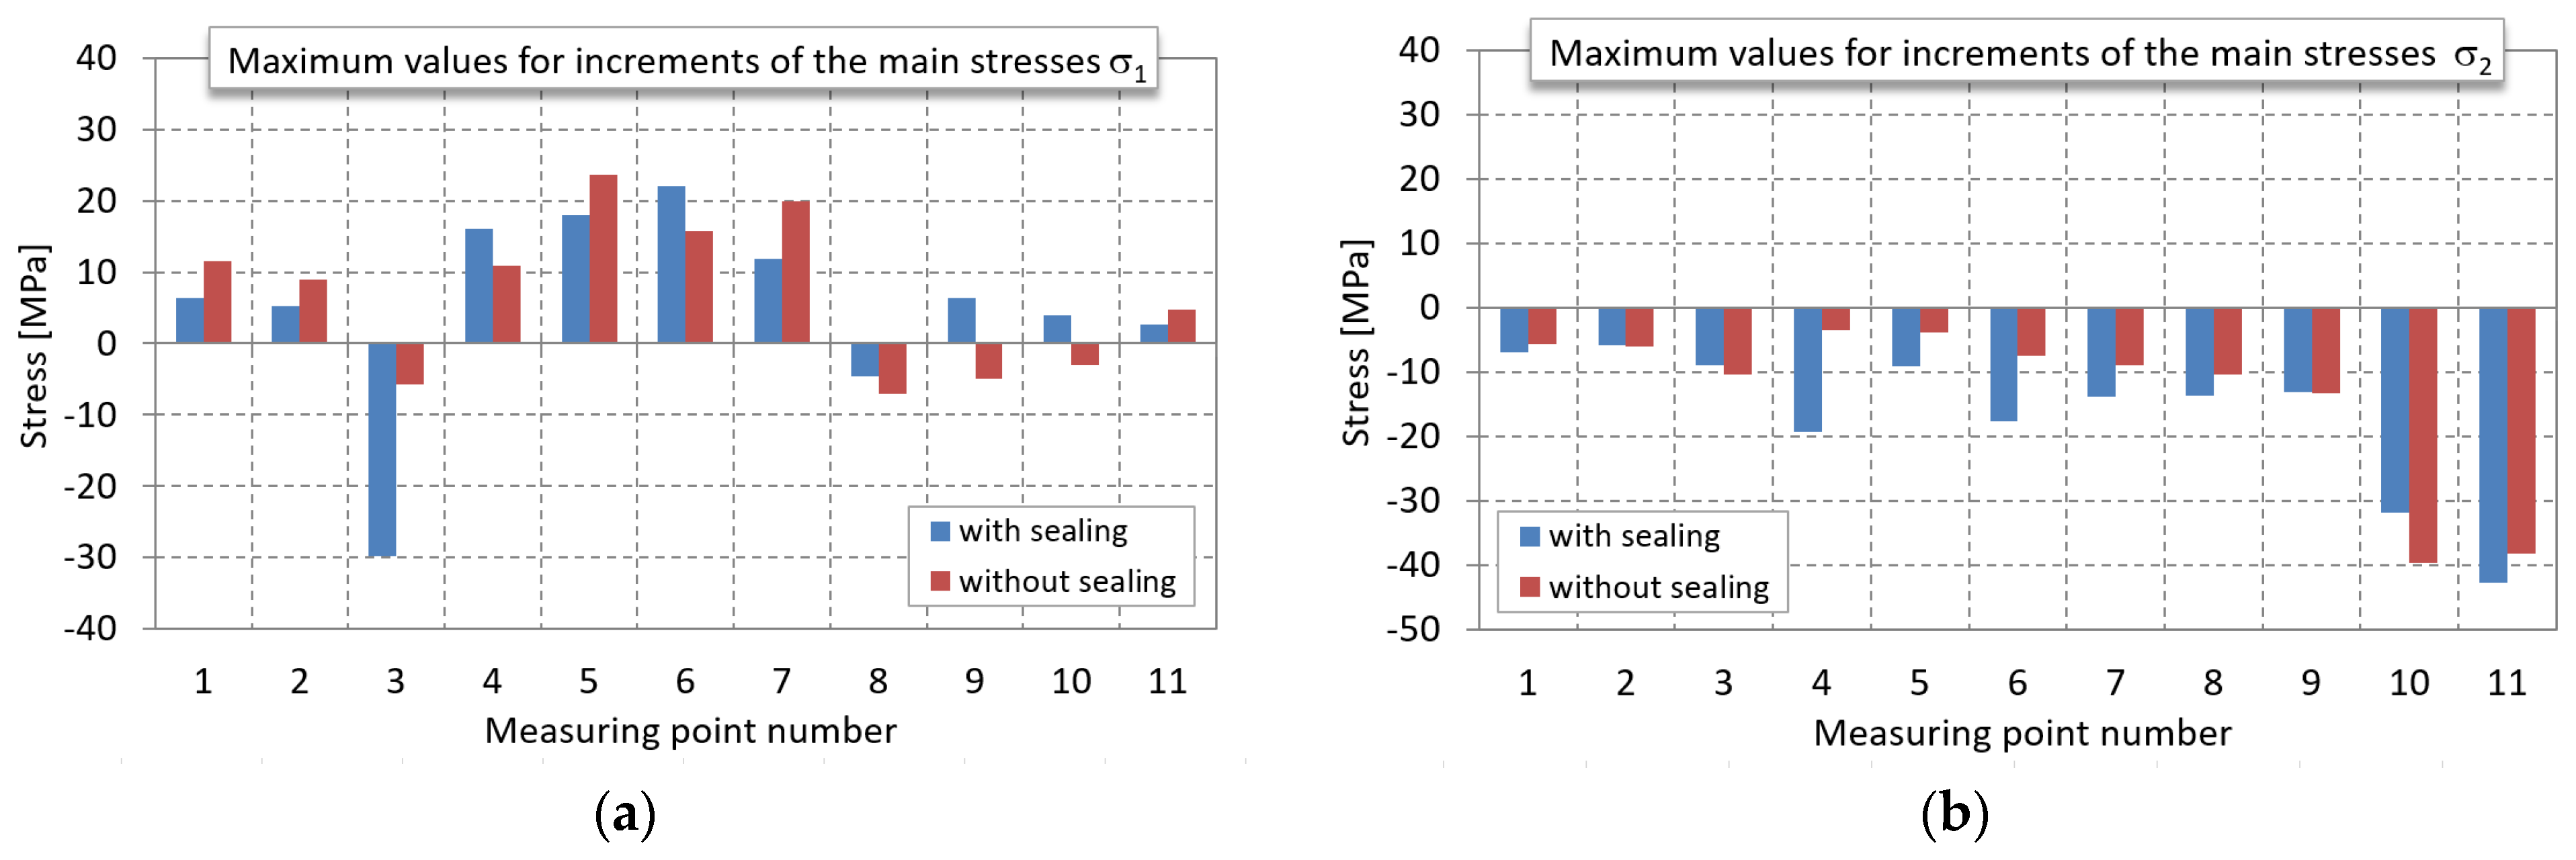
Figure 15, Figure 16 and Figure 17 illustrate the stress values obtained from the selected measured locations (measuring locations No. 1, 5, and 11) during the measurements performed with and without sealing. Figure 18 summarizes maximum values for increments of the main stresses at measuring with and without sealing in all 11 measurement locations.
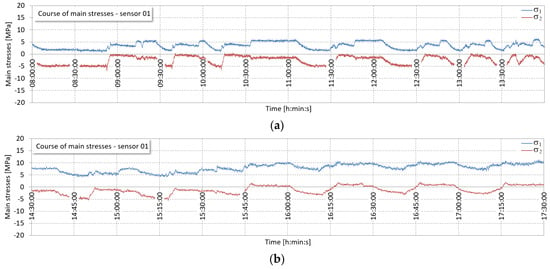
Figure 15.
The course of increments of the main stresses at measurement: (a) With sealing; (b) Without sealing in the measuring point No. 1.
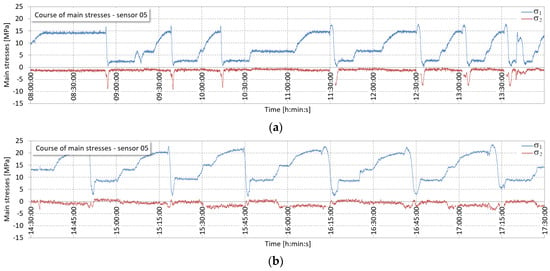
Figure 16.
The course of increments of the main stresses at measurement: (a) With sealing; (b) Without sealing in the measuring point No. 5.


Figure 17.
The course of increments of the main stresses at measurement: (a) With sealing; (b) Without sealing in the measuring point No. 11.
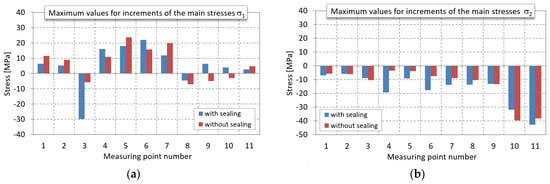
Figure 18.
Maximum values for increments of the main stresses at measurement: (a) With sealing; (b) Without sealing in all 11 measuring locations.
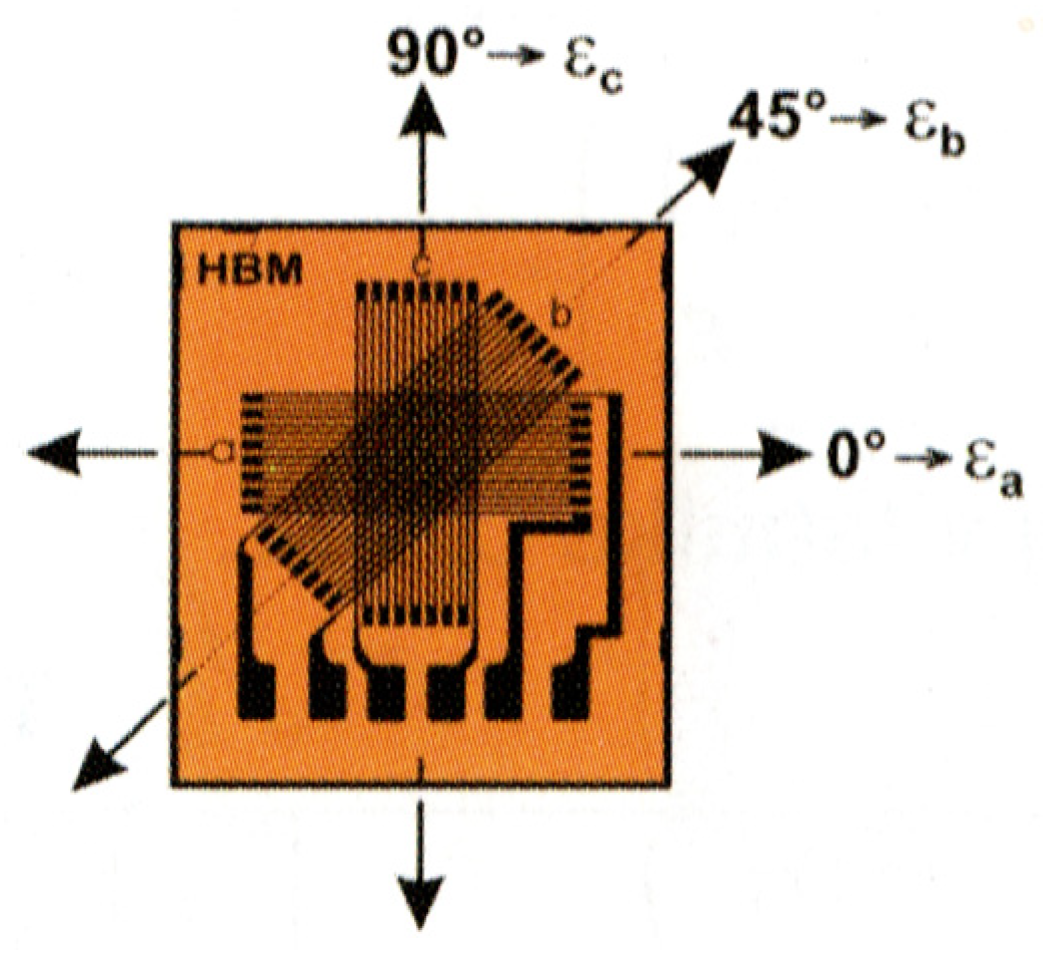
After recording the measured data and after their processing, the values of the main normal stresses were determined using the strain gauge rosette 0°/45°/90°, based on relative prolongations of the strain gauge sensors installed in the rosette. The main normal stress values were determined according to the relative prolongation of the strain gauge sensors in the strain gauge rosette using Equation (1). In this equation, the input values are relative prolongations ɛa, ɛb, ɛc in three directions: a, b, and c—always in one given rosette—as shown in Figure 19.
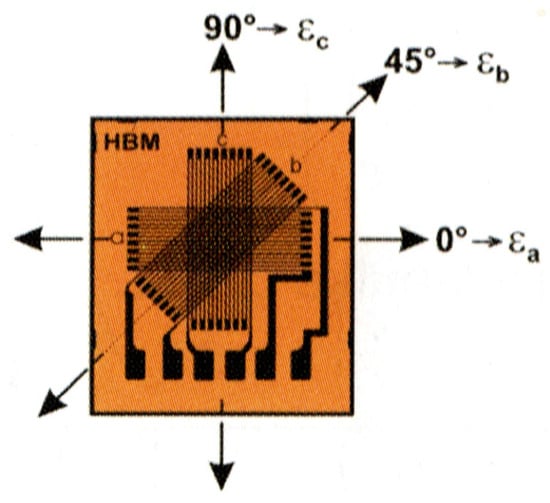
Figure 19.
Orientation of deformations ɛa, ɛb, ɛc with regard to angle directions 0°, 45°, 90°.
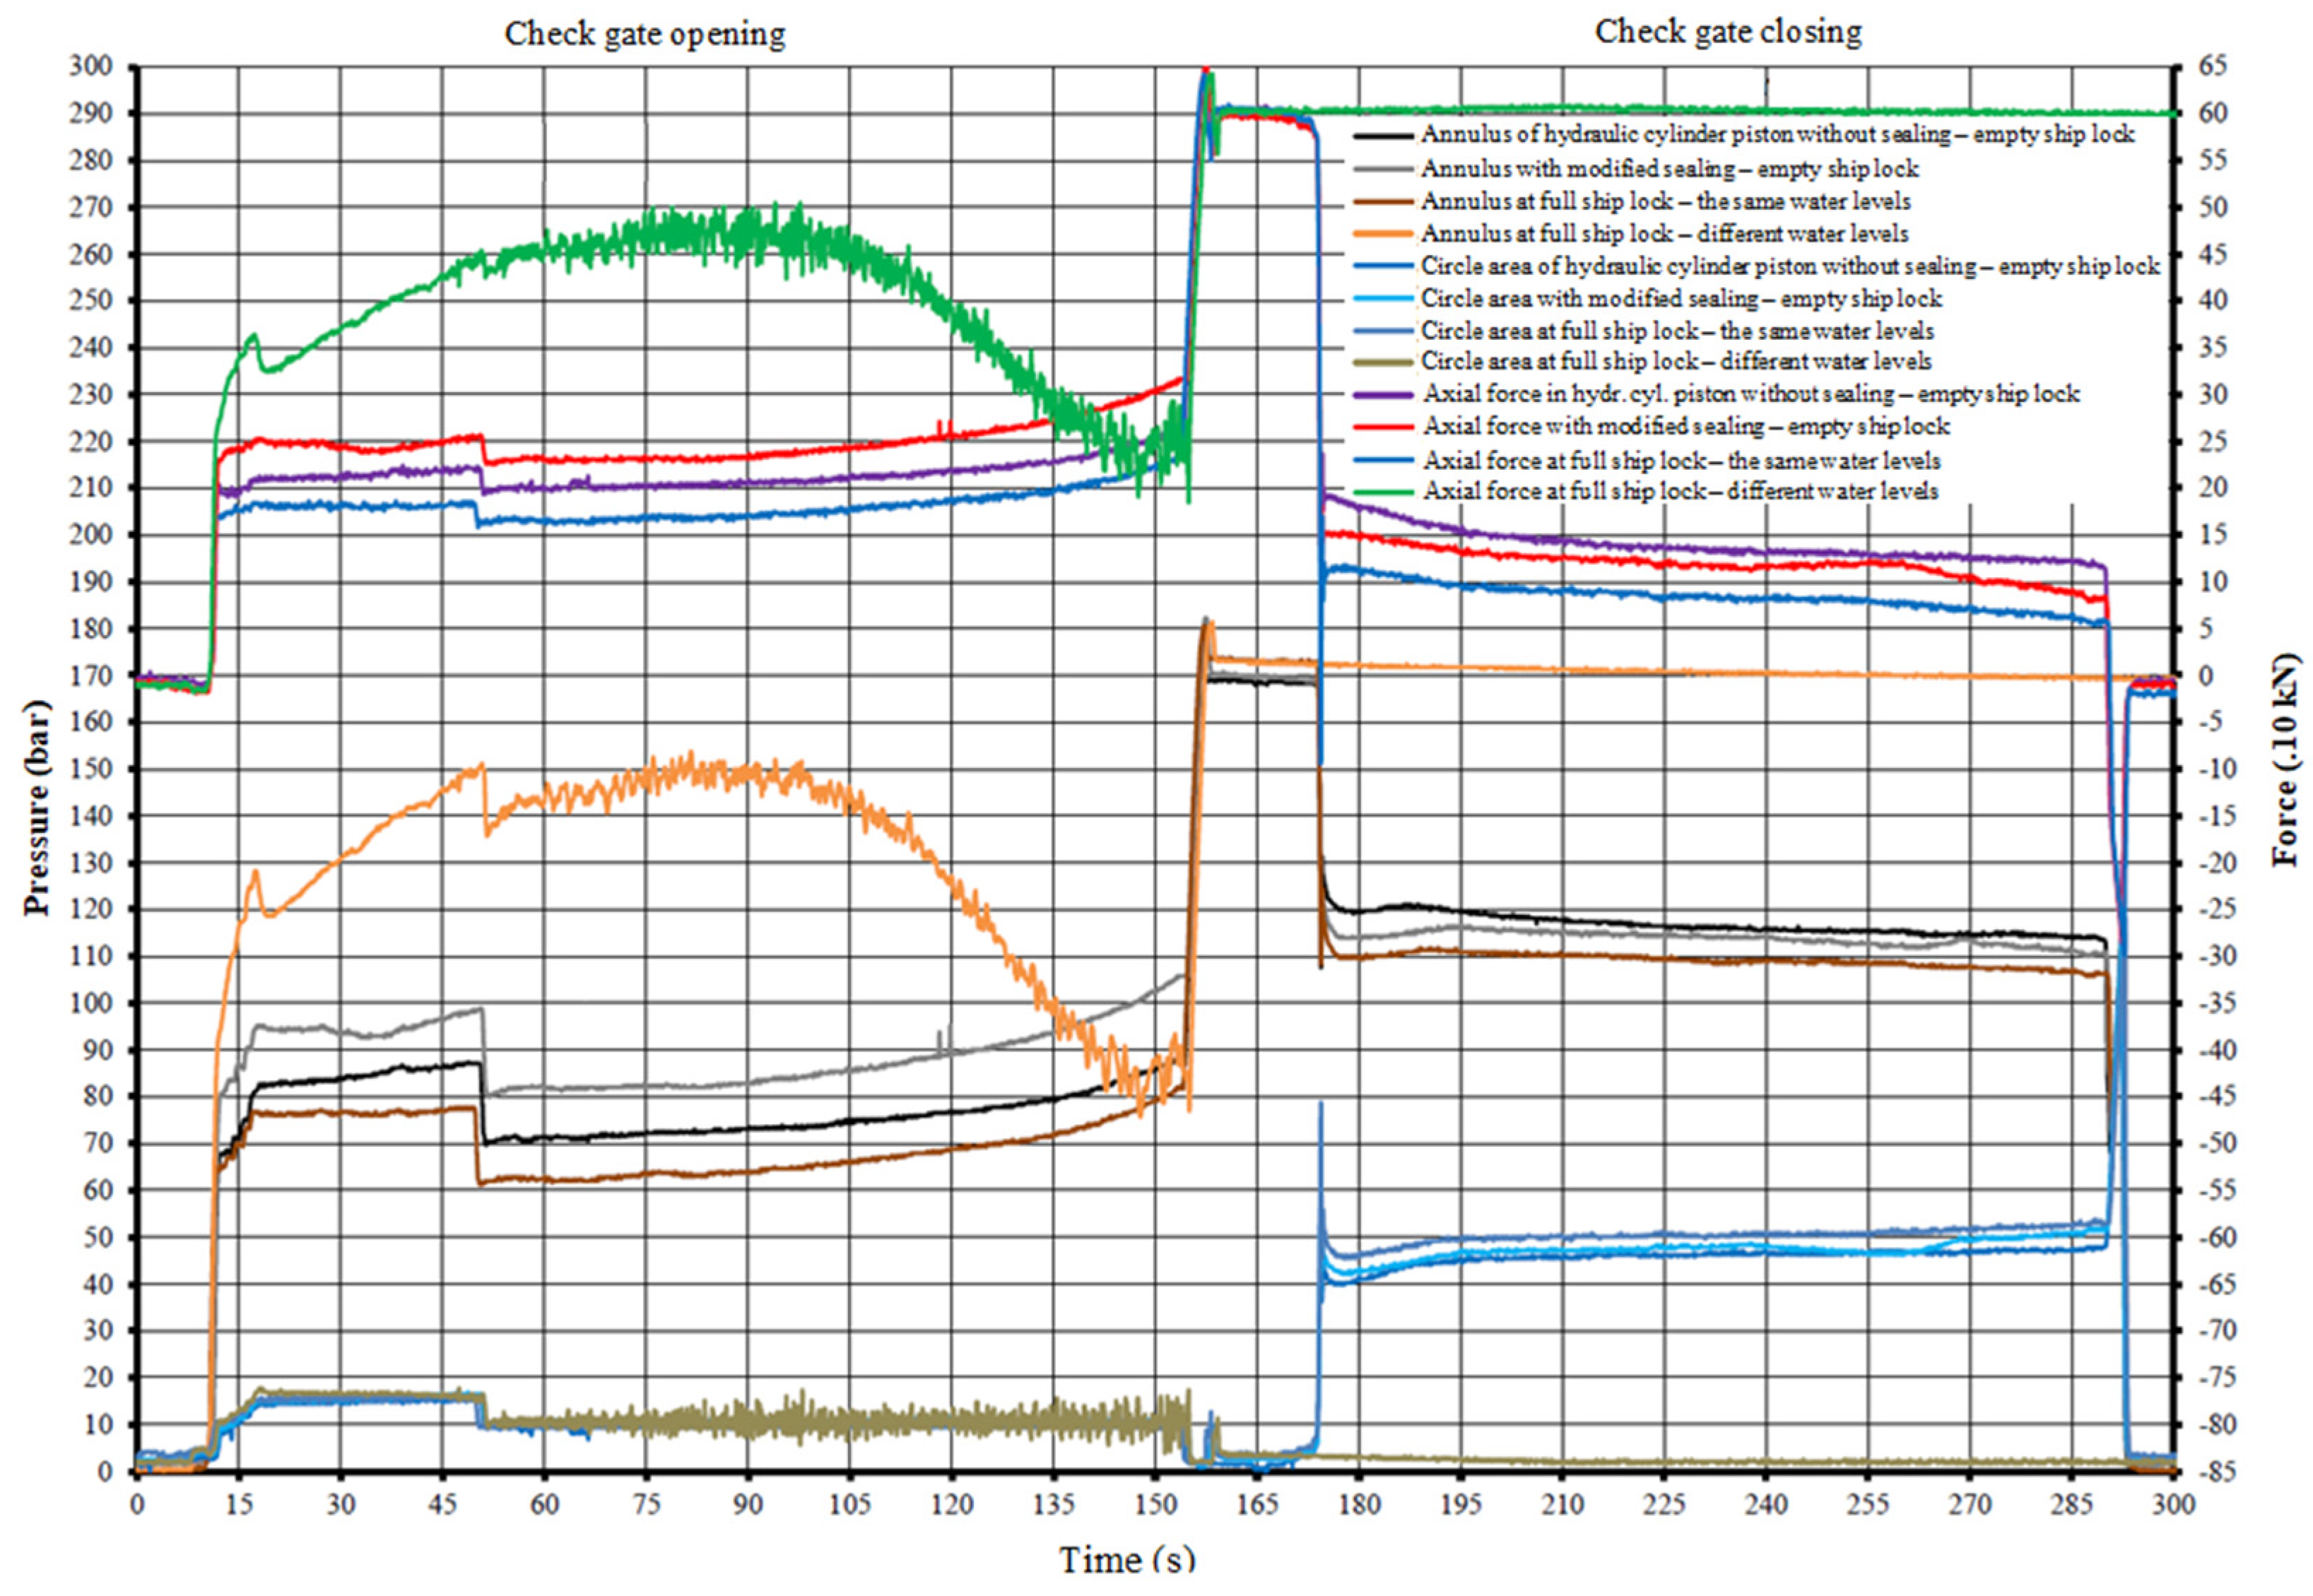
Figure 20 illustrates the course of pressures in the hydraulic cylinder at individual measuring modes.
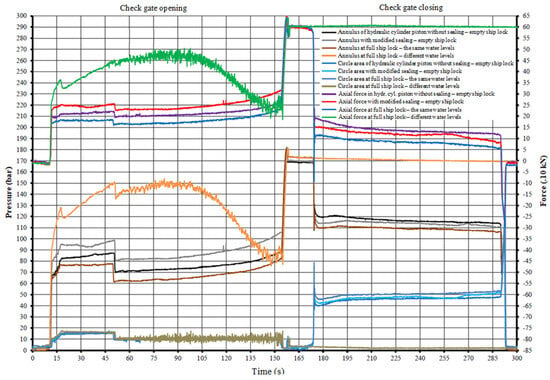
Figure 20.
Course of pressures in the hydraulic cylinder at individual measuring modes.
6. Discussion
Interesting facts emerged from the obtained values of the stress increments measured in the individual measuring points as well as from the courses of pressure in the hydraulic cylinder, which is moving the check gate, namely in the case of both measured modes. For detailed comparisons of the results, the courses of stress increments were recorded at the location of sensor No. 5 with regard to its position in the middle of the segment. In this position, there is an assumption of minimal influence from reinforcements, arms, and side loads. After dismounting the sealing, the maximum value of pressure in the hydraulic cylinder decreased by 16.6 bar, but the value of the main stress increased by 5.1 MPa, which confirms an assumption that a part of the load is transferred by the sealing to the concrete frame. This fact causes, with a high probability, increased wear in the sealing during manipulation with the check gate.
The constructional solution of the side sealing, which is installed on the given check gate, provides continuous flexible support for this damming body. This fact is confirmed by the measured values of the pressures in the hydraulic cylinder, where the increase in pressure during the same working cycle of the check gate opening, in the case of the filled and drained ship lock, is about 57%. In these cases, the main stress values did not change significantly, which proves that the hydraulic cylinder has to overcome significantly greater frictional resistances when the check gate is loaded with water pressure.
7. Conclusions
We can briefly summarize the results of the measurements into the following findings:
- -
- Installation applications of the strain gauge sensors were limited due to spatial, technological, and construction possibilities, which made it impossible to situate the sensors in places of maximum loading;
- -
- There were proposed certain constructional modifications on the check gate with regard to better access when applying measuring sensors (in our case, the strain gauges) as close as possible to the places with the highest loading;
- -
- The measuring equipment, specially developed for this measurement, was kept by the operator of the given waterworks for the next long-term monitoring of the newly installed check gate operation;
- -
- However, the courses of stress increments obtained from the measured points correspond to the values of the results obtained from the performed FEM analysis, but these are not the real maximum stress values acting in the check gate segment construction;
- -
- The measurements demonstrated the reliability of the proposed measuring procedure. At the same time, by analyzing the measured values of the stress increments in the individual measuring points, it was found that the measured welded construction of the check gate is suitable for the given operational conditions;
- -
- It was necessary to transform the measured values into the originally proposed measuring points, as mentioned above. The maximum stress values did not exceed the yield strength value of the base constructional material in no measuring point.
- -
- Due to doubts about the cause of accidental damage to the original check gate, it was decided that the new construction of the check gate will be made from material with higher resistance to notch influence at low temperatures compared to the originally applied material.
- -
- After analysis of the measurements performed on the new check gate construction, it is possible to summarize that the new constructional arrangement of the check gate, together with the system of seals, is an innovative solution that can be inspirational for producers of such devices.
Author Contributions
Conceptualization, R.G. and P.K.; methodology, J.K.; software, M.M.; validation, J.K., M.M. and M.S.; formal analysis, M.K.; investigation, M.S.; resources, M.F.; data curation, M.M.; writing—original draft preparation, J.K.; writing—review and editing, M.K.; visualization, M.M.; supervision, R.G.; project administration, P.K.; funding acquisition, M.F. All authors have read and agreed to the published version of the manuscript.
Funding
This work was supported by Grant Project KEGA 044TUKE-4/2024.
Data Availability Statement
The raw data supporting the conclusions of this article will be made available by the authors upon request.
Acknowledgments
We would like to express our many thanks to the employees of the Gabčíkovo Waterworks for their cooperation and willingness during the preparation and realization of the performed experimental measurements.
Conflicts of Interest
The authors declare no conflicts of interest.
References
- Dursun, B.; Gokcol, C. The role of hydroelectric power and contribution of small hydropower plants for sustainable development in Turkey. Renew. Energy 2011, 36, 1227–1235. [Google Scholar] [CrossRef]
- Singh, V.K.; Singal, S.K. Operation of hydro power plants—A review. Renew. Sustain. Energy Rev. 2017, 69, 610–619. [Google Scholar] [CrossRef]
- Sachdev, H.S.; Akella, A.K.; Kumar, N. Analysis and evaluation of small hydropower plants: A bibliographical survey. Renew. Sustain. Energy Rev. 2015, 51, 1013–1022. [Google Scholar] [CrossRef]
- Ven, V.D.; Loon, V. The interaction of a lock’s filling jet and the ship in the lock chamber, using scale model measurements. In Proceedings of the 7th IAHR International Symposium on Hydraulic Structures, Aachen, Germany, 15–18 May 2018; ISHS: Leuven, Belgium, 2018; pp. 402–410, ISBN 978-0-692-13277-7. [Google Scholar] [CrossRef]
- Van Der Hout, A.; Schotman, A.; Hoff, T.; Van Der Veen, J.W.; Quax, A. Innovative Mooring in Locks Using Shoretension: Density and Mooring Force Measurements in the North Lock Ijmuiden. In Proceedings of PIANC Smart Rivers 2022; Li, Y., Hu, Y., Rigo, P., Lefler, F.E., Zhao, G., Eds.; PIANC 2022; Lecture Notes in Civil Engineering; Springer: Singapore, 2023; Volume 264. [Google Scholar] [CrossRef]
- Wu, L.; Xiang, Z.; Shu, D.; Liu, M.; Yang, J.; Li, M. Dynamic Inversion Model of the Mooring Force on a Floating Bollard of a Sea Lock. J. Mar. Sci. Eng. 2023, 11, 1374. [Google Scholar] [CrossRef]
- Wan, Z.; Li, Y.; Wang, X.; An, J.; Cheng, L.; Liao, Y. Effect of ship-lock-induced surges on navigation safety in a branched lower approach channel system. J. Hydroinformatics 2022, 24, 481–496. [Google Scholar] [CrossRef]
- Gobbetti, L.E.C. Design of the filling and emptying system of the new Panama Canal Locks. J. Appl. Water Eng. Res. 2013, 1, 28–38. [Google Scholar] [CrossRef]
- Badano, N.D.; Menéndez, Á.N. Numerical modeling of Reynolds scale effects for filling/emptying system of Panama Canal Locks. Water Sci. Eng. 2021, 14, 237–245. [Google Scholar] [CrossRef]
- Menéndez, A.N.; Lecertua, E.A.; Badano, N.D. Optimización del diseño del sistema dellenado/vaciado del Tercer Juego de Esclusas del Canal de Panamá. RIBAGUA Rev. Iberoam. Agua 2014, 1, 4–13. [Google Scholar]
- Ooi, S.; Constantinescu, G.; Weber, L. Numerical simulations of lock-exchange compositional gravity current. J. Fluid Mech. 2009, 635, 361–388. [Google Scholar] [CrossRef]
- Jánosi, I.M.; Jan, D.; Szabó, K.G.; Tél, T. Turbulent drag reduction in dam-break flows. Exp. Fluids 2004, 37, 219–229. [Google Scholar] [CrossRef]
- Horváth, K.; Petreczky, M.; Rajaoarisoa, L.; Duviella, E.; Chuquet, K. MPC control of water level in a navigation canal—The Cuinchy-Fontinettes case study. In Proceedings of the European Control Conference (ECC), Strasbourg, France, 24–27 June 2014; IEEE: Piscataway, NJ, USA, 2014; pp. 1337–1342. [Google Scholar] [CrossRef]
- O’Mahoney, T.; Heinsbroek, A.; de Loor, A.; Kortlever, W.; Verelst, K. Numerical simulations of a longitudinal filling system for the New Lock at Terneuzen. In Proceedings of the 34th PIANC World Congress, Panama City, Panama, 7–12 May 2018. [Google Scholar]
- Verelst, K.; Vercruysse, J.; De Mulder, T. Hydraulic design of a filling emptying system for the new Royers lock in the port of Antwerp (Belgium). In Proceedings of the 36th IAHR World Congress: Deltas of the Future and What Happened Upstream, Delft, The Netherlands, 28 June–3 July 2015; pp. 4563–4574. [Google Scholar]
- Lama, G.F.C.; Giovannini, M.R.M.; Alessandro Errico, A.; Mirzaei, S.; Padulano, R.; Chirico, G.B.; Preti, F. Hydraulic Efficiency of Green-Blue Flood Control Scenarios for Vegetated Rivers: 1D and 2D Unsteady Simulations. Water 2021, 13, 2620. [Google Scholar] [CrossRef]
- Furtado, G.C.A.; Mesquita, A.L.A.; Morabito, A.; Hendrick, P.; Hunt, J.D. Using hydropower waterway locks for energy storage and renewable energies integration. Appl. Energy 2020, 275, 115361. [Google Scholar] [CrossRef]
- Yang, Q.; Zhai, J.; Jiang, Z. Numerical simulation of saltwater intrusion in a lock with long canal adopting coupled box model and three-dimensional model. In Proceedings of the 36th IAHR World Congress: Deltas of the Future and What Happened Upstream, Delft, The Netherlands, 28 June–3 July 2015; pp. 181–190. [Google Scholar]
- Liu, J.; Hu, Y.; Li, Z.; Xue, S. Risk Analysis and Optimization of Water Surface Deviation from Shafts in the Filling–Emptying System of a Mega-Scale Hydro-Floating Ship Lift. Water 2021, 13, 1377. [Google Scholar] [CrossRef]
- Zhang, J.; Leontidis, V.; Dazin, A.; Tounzi, A.; Delarue, P.; Caignaert, G.; Piriou, F.; Libaux, A. Canal lock variable speed hydropower turbine design and control. IET Renew. Power Gener. 2018, 12, 1698–1707. [Google Scholar] [CrossRef]
- Daniel, R.; Paulus, T. Lock gates and other closures in hydraulic projects. In Butterworth-Heinemann, 1st ed.; Elsevier: Amsterdam, The Netherlands, 2018. [Google Scholar] [CrossRef]
- Thorenz, C.; Strybny, J. On the numerical modelling of filling-emptying system for locks. In Proceedings of the 10th International Conference on Hydroinformatics: HIC; Understanding Changing Climate and Environment and Finding Solutions, Hamburg, Germany, 14–18 July 2012; Hinkelmann, R., Ed.; TuTech. Innovation: Hamburg, Germany, 2012. [Google Scholar]
- Gapeev, A.; Morgunov, K.; Karacheva, M. Quality Assessment of the System of Filling a Shipping Lock Chamber from under the Segmental Guillotine Gate. In Proceedings of the International Scientific Conference Energy Management of Municipal Facilities and Sustainable Energy Technologies EMMFT 2019; Murgul, V., Pukhkal, V., Eds.; EMMFT 2019; Advances in Intelligent Systems and Computing; Springer: Cham, Switzerland, 2020; Volume 1258. [Google Scholar] [CrossRef]
- Yucel, M.; Yucel, M. The measurement of strain of a prototype pulley system using a Brillouin optical time domain analysis. Microw. Opt. Technol. Lett. 2022, 64, 190–198. [Google Scholar] [CrossRef]
- Hrabovsky, L.; Cepica, D.; Frydrysek, K. Detection of mechanical stress in the steel structure of a bridge crane. Theor. Appl. Mech. Lett. 2021, 11, 100299. [Google Scholar] [CrossRef]
- Aytaç Onur, Y.; Gelen, H. Design and deflection evaluation of a portal crane subjected to traction load. Mater. Test. 2020, 62, 1131–1137. [Google Scholar] [CrossRef]
- Anand, L.D.V.; Hepsiba, D.; Palaniappan, S.; Sumathy, B.; Vijayakumar, P.; Rani, S.S. Automatic strain sensing measurement on steel beam using strain gauge. Mater. Today Proc. 2021, 45 Pt 2, 2578–2580, ISSN 2214-7853. [Google Scholar] [CrossRef]
- Gorbushin, A.R.; Bolshakova, A.A. Unsteady axial force measurement by the strain gauge balance. Measurement 2020, 152, 107381, ISSN 0263-2241. [Google Scholar] [CrossRef]
- Wang, Y.J.; Chi, P.K.; Lin, Y.H.; Lu, T.F.; Sue, C.Y. A six-axis force and torque sensor consisting of compliant mechanisms and full-bridge strain gauges. Measurement 2024, 226, 114151, ISSN 0263-2241. [Google Scholar] [CrossRef]
- Cui, H.; Du, H.; Zhao, F.; Hong, M. Damage identification in a plate structure based on a cross-direction strain measurement method. Measurement 2020, 158, 107714, ISSN 0263-2241. [Google Scholar] [CrossRef]
- Sinay, J.; Bigoš, P.; Bugár, T. Experimental Methods and Machine Testing; Alfa: Bratislava, Slovakia, 1989; 232p, ISBN 082-737-89. [Google Scholar]
- Kulka, J.; Mantič, M.; Faltinová, E.; Kopas, M. Autonomous online system for evaluating steel structure durability. Diagnostyka 2016, 17, 15–20, ISSN 1641-6414. [Google Scholar]
- Sága, M.; Vaško, M.; Pecháč, P. Chosen Numerical Algorithms for Interval Finite Element Analysis. Procedia Eng. 2014, 96, 400–409, ISSN 1877–7058. [Google Scholar] [CrossRef][Green Version]
- Lindgren, G.; Rychlik, I. Rain Flow Cycle Distributions for Fatigue Life Prediction under Gaussian Load Processes. Fatigue Fract. Eng. Mater. Struct. 1987, 10, 251–260. [Google Scholar] [CrossRef]
- Rychlik, I.; Gupta, S. Rain-flow fatigue damage for transformed Gaussian loads. Int. J. Fatigue 2007, 29, 406–420. [Google Scholar] [CrossRef]
- Tovo, R. Damage-based evaluation of probability density distribution for rain-flow ranges from random processes. Int. J. Fatigue 2000, 22, 425–429. [Google Scholar] [CrossRef]
Disclaimer/Publisher’s Note: The statements, opinions and data contained in all publications are solely those of the individual author(s) and contributor(s) and not of MDPI and/or the editor(s). MDPI and/or the editor(s) disclaim responsibility for any injury to people or property resulting from any ideas, methods, instructions or products referred to in the content. |
© 2024 by the authors. Licensee MDPI, Basel, Switzerland. This article is an open access article distributed under the terms and conditions of the Creative Commons Attribution (CC BY) license (https://creativecommons.org/licenses/by/4.0/).

