Abstract
This project aims to develop a recommendation system to mitigate looping issues in HDD slider testing using the Amber testing machine (Machine A). Components simulating the HDD often fail and require repair before re-testing. However, post-repair, there is a 34% probability that the component (referred to as Product A) will experience looping, characterized by repeated failures with error code A. This recurring issue significantly hampers testing efficiency by reducing the number of successful slider tests. To address this challenge, we propose a dual-approach recommendation system that provides technicians with actionable insights to minimize the occurrence of looping. For previously analyzed components, a collaborative filtering technique utilizing implicit ratings is employed to generate recommendations. For new components, for which prior data are unavailable, a cosine similarity approach is applied to suggest optimal actions. An automatic training system is implemented to retrain the model as new data become available, ensuring that the recommendation system remains robust and effective over time. The proposed system is expected to offer precise guidance to technicians, thereby improving the overall efficiency of the testing process by reducing the frequency of looping issues. This work represents a significant advancement in enhancing operational reliability and productivity in HDD slider testing.
1. Background and Problem Statement
A hard disk drive (HDD) [1,2,3,4] is a storage device used to store digital data in a computer. The two crucial components of an HDD are the media disk and the slider. The slider is responsible for reading from and writing data to the media disk. To ensure the quality of the slider, the slider dynamic electrical test (SDET) process is conducted using the Amber testing machine in conjunction with an HDD simulator component (referred to as the component).
In the event of a component failure during testing, the component will be ejected from the Amber testing machine with an error code and sent for repair. After the repair, the component will be returned to the Amber testing machine for re-testing. However, the repaired component may encounter a looping problem, characterized by being ejected with the same error within six hours of operation. This issue indicates that the component repeatedly fails with the same error even after being repaired, presenting a significant challenge to maintaining the efficiency and reliability of the testing process.
An HDD [5,6,7,8,9] is a fundamental storage device used in computers to store various types of digital data, including images, documents, videos, and more. The HDD [10,11,12,13,14] consists of several critical components, among which the media disk and the head (commonly referred to as the “Slider”) are paramount. The media disk serves as the physical medium in which digital data are stored, while the slider is responsible for reading and writing data to and from the media disk. Ensuring the quality and reliability of the slider is crucial for the overall performance and longevity of the HDD.
To maintain high standards of quality, the slider undergoes a rigorous testing process known as the slider dynamic electrical test (SDET). This process is essential for identifying and eliminating defective sliders before they proceed to the next stage of the assembly process. The SDET is conducted using a specialized machine, referred to as the Amber testing machine, which operates in conjunction with a simulated HDD device known as the blade. The blade simulates the working environment of the HDD [15,16,17,18,19,20], allowing for accurate testing of the slider’s performance under real-world conditions.
Despite the critical importance of the SDET process, challenges have arisen, particularly in the handling of components that fail during testing. When a blade encounters an issue during testing, it is ejected from the Amber testing machine with an associated error code and sent to a repair station. At the repair station, technicians attempt to rectify the identified issue and then return the blade to the Amber testing machine for re-testing. However, a recurring problem has been observed, in which some blades are repeatedly ejected with the same error code, even after undergoing repairs. This phenomenon, known as “Blade Looping,” presents a significant challenge to the efficiency and reliability of the slider testing process.
From April 2021 to February 2023, the issue of blade looping was recorded in 34% of all cases involving the product A blades shown in Figure 1, with error code A being particularly problematic, accounting for 3.3% of all blade looping occurrences. This recurring issue not only disrupts the testing process but also reduces the overall testing throughput, resulting in fewer sliders being tested than originally anticipated. On average, only 540 out of an expected 4000 sliders were tested due to the impact of blade looping, representing a significant shortfall in testing capacity.
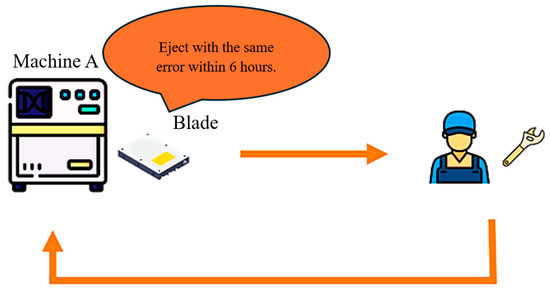
Figure 1.
Schematic of the looping blade issue.
In investigating the causes of blade looping to address the issue of blade looping, several hypotheses have been proposed regarding its underlying causes. The first hypothesis concerns the limited repair time available to technicians. Given the complexity of the blade repair process, which involves multiple intricate procedures, technicians may struggle to complete repairs effectively within the allocated time. The second hypothesis focuses on the complexity of the repair steps themselves, suggesting that the numerous procedures required during the repair process may be contributing to the recurrence of the same error code. Finally, the third hypothesis highlights the varying levels of experience among technicians, with less experienced technicians potentially lacking the necessary knowledge to prioritize critical areas during the repair process.
Considering these challenges, this study aims to develop a recommendation system designed to enhance the repair process and reduce the incidence of blade looping. The proposed recommendation system will provide technicians with actionable guidance tailored to address the specific issues associated with error code A in Product A blades. By leveraging insights from historical data and incorporating machine learning techniques, the system will help technicians perform repairs more accurately and efficiently, ultimately improving the overall quality and reliability of the slider testing process.
The remainder of this paper is organized as follows: Section 2 provides a theoretical framework and a review of related works, including definitions of recommendation systems, an overview of artificial neural networks, and a discussion of relevant evaluation methods. Section 3 outlines the methodology employed in the development of the recommendation system, detailing the data collection process, the model selection, and the implementation strategy. Section 4 presents the experimental results, including an analysis of the system’s performance and its impact on reducing blade looping occurrences. Finally, Section 5 concludes this paper by summarizing the key findings and offering suggestions for future research.
2. Theory and Related Works
2.1. System Description
A recommendation system is a subset of machine learning [21,22], defined as a decision-making tool for users navigating complex information environments. It assists in enhancing the social process of utilizing others’ recommendations to make choices when users lack personal knowledge or experience with the alternatives. Recommendation systems can be categorized into three types as in Figure 2.
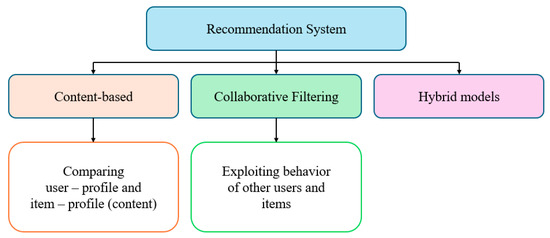
Figure 2.
System description types.
2.1.1. Content-Based Filtering
This method recommends items that are similar to the user’s known preferences.
2.1.2. Collaborative Filtering
This method recommends items based on the preferences of similar users. It is further classified into two types:
- User-based collaborative filtering: recommendations are made based on the preferences of users who are similar to the target user.
- Item-based collaborative filtering: recommendations are made based on items that are similar to those the target user has previously liked.
2.1.3. Hybrid
This approach combines content-based and collaborative filtering techniques to improve the accuracy and effectiveness of the recommendation system.
2.2. Cosine Similarity
Cosine similarity [23,24] is a metric used to measure the similarity between two non-zero vectors bound by a constrained range between 0 and 1. The similarity measurement is derived from the cosine of the angle between vector A and vector B. If the angle between the two vectors is 90 degrees, the cosine similarity value is 0, indicating that the vectors are orthogonal or perpendicular to each other. As the value approaches 1, the angle becomes smaller, indicating that the vectors are more similar. The equation for cosine similarity is as follows:
2.3. Rating Score
The rating score [25] is a critical component in recommendation systems and collaborative filtering techniques, as it reflects the user’s preference for any given item. Rating scores can be classified into two types.
2.3.1. Explicit Rating
An explicit rating is obtained directly from the user through methods such as voting or satisfaction questionnaires. The main drawback of this approach is that it requires effort from users, who may not always be willing or able to provide sufficient information [26].
2.3.2. Implicit Rating
In real-world data, users often do not provide ratings directly. Instead, implicit ratings [27] can be inferred from users’ interactions with the system. This type of rating deduces user preferences from their behavior, such as purchase history, time spent on certain web pages, or button clicks, among other activities.
2.4. Assessment
Before delivering the recommendation system, we need to ensure that its performance is satisfactory, therefore, evaluation metrics are used to measure the performance of the system. The following metrics were used to evaluate the performance.
2.4.1. Mean Absolute Error (MAE)
The MAE [28] measures the average of the absolute deviations between the predicted ratings and the actual ratings. It is calculated as shown in Equation (2).
where
- MAE is the mean absolute error.
- N is the total number of observations.
- pri is the predicted value for the i-th observation.
- ari is the actual (true) value for the i-th observation.
2.4.2. Mean Square Error (MSE)
The MSE [29] is used to give more importance to cases with larger deviations from the actual rating. It is used instead of MAE and is calculated as shown in Equation (3).
where
- MSE is the mean squared error.
- N is the total number of observations.
- pri is the predicted value for the i-th observation.
- ari is the actual (true) value for the i-th observation.
2.4.3. Root Mean Square Error (RMSE)
The RMSE [30] is a variant of MSE. The RMSE is calculated as shown in Equation (4).
where
- MRSE is the root mean squared error.
- N is the total number of observations.
- pri is the predicted value for the i-th observation.
- ari is the actual (true) value for the i-th observation.
2.4.4. Precision
The precision is the fraction of relevant items recommended compared to the total number of items in the recommendation list, as shown in Equation (5).
This formula emphasizes that precision is the ratio of relevant items (those that are truly relevant to the user) to the total number of items in the recommendation list. The goal of a high precision value is to ensure that most of the recommended items are actually useful or relevant to the user.
2.4.5. Recall
The recall is defined as the fraction of relevant items, as identified by the user, that is included in the recommended list, as shown in Equation (6).
This formula shows that the recall is the ratio of the number of relevant items recommended by the system to the total number of relevant items available. Recall measures the system’s ability to identify all relevant items within the dataset. A higher recall indicates that the system is effective at finding most of the relevant items, but it does not consider whether non-relevant items were also recommended.
In summary, the equation calculates the average of the absolute differences between the predicted ratings and the actual ratings.
2.5. Artificial Neural Network
An artificial neural network (ANN) [31,32,33,34,35] is a computational model inspired by the principles of biological neurons. An ANN is defined as a network constructed using computer programming (mathematical functions) that emulates the behavior of a neuron. It receives inputs, performs calculations or makes decisions, and provides outputs, as illustrated in Figure 3.
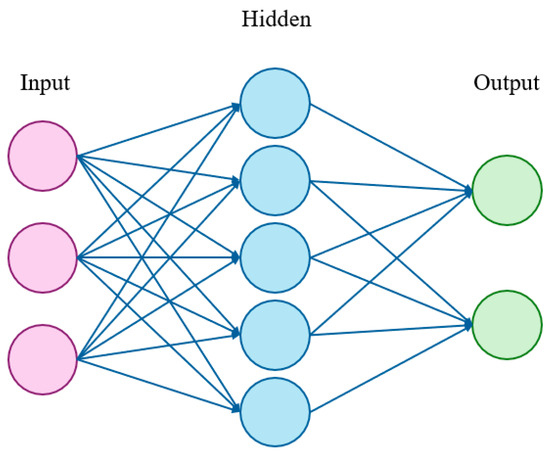
Figure 3.
Artificial neural network.
2.6. Autoencoder
An autoencoder [36] is a type of neural network that can learn to reconstruct images, text, and other data from compressed versions of themselves. Autoencoders are highly useful in the field of unsupervised machine learning, particularly for tasks involving data compression and dimensionality reduction. They consist of three main components as listed below.
2.6.1. Encoder
The encoder compresses the input data into a lower-dimensional representation. This compressed representation is often a distorted version of the original input but retains the most salient features.
2.6.2. Code
The code layer, also known as the bottleneck layer, holds the compressed representation of the input data. It serves as the intermediary that the decoder will use to reconstruct the original data.
2.6.3. Decoder
The decoder reconstructs the original data from the compressed representation in the code layer. This reconstruction is typically lossy, meaning that some information from the original input may be lost during the process.
- First, the code or bottleneck size is the most critical hyperparameter. It determines the degree of data compression, directly influencing the model’s ability to capture essential features while minimizing reconstruction error.
- Second, the number of layers plays a crucial role. Increasing the depth of the autoencoder enhances its capacity to model complex data patterns; however, deeper models may also lead to higher computational costs and longer training times.
- Third, the number of nodes in each layer typically decreases as the data progresses through the layers of the autoencoder. This gradual reduction in the number of nodes reflects the shrinking size of the input data across layers, aiming to compress and encode the information effectively.
Autoencoders are instrumental in various applications, such as anomaly detection, denoising, and feature learning, due to their ability to learn efficient data representations without supervision.
The autoencoder has a construction following Figure 4.
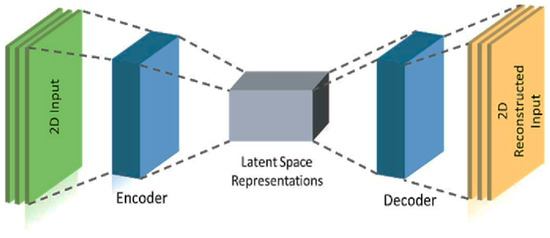
Figure 4.
Autoencoder construction.
2.7. Literature Review
2.7.1. Deep Learning
Presently, recommendation systems are increasingly being developed using deep learning [37,38,39,40] techniques due to their superior performance. The purpose of utilizing deep neural networks for YouTube recommendations is to leverage deep learning’s ability to handle noisy and sparse data. Deep learning methods have been shown to outperform the previous matrix-based approaches used by YouTube.
Moreover, an innovative deep learning architecture has been developed to enhance the quality of predictions and recommendations. This architecture improves the system by incorporating prediction errors and reliability, leading to more accurate and reliable recommendations.
One notable example of using deep learning in recommendation systems is the implementation of a deep autoencoder for building a recommender system. In this case, a three-month Netflix dataset was used to develop the system. This approach demonstrated the effectiveness of deep learning in handling large-scale data and providing high-quality recommendations.
Furthermore, deep learning can be combined with other methods to further improve performance, as suggested by recent research and developments in the field. This hybrid approach can capitalize on the strengths of multiple techniques, leading to more robust and efficient recommendation systems.
2.7.2. Implicit Ratings in Recommendation
In cases in which explicit ratings [41,42] are not available in the dataset, implicit ratings can be utilized instead. The purpose of calculating implicit ratings is to generate a rating score that can be used to create a recommendation system. These implicit ratings are derived from user behavior and data history rather than from direct user feedback.
To calculate an implicit rating, a specific function is applied to the historical data. This function analyzes patterns such as the frequency of interactions, duration of engagement, or other relevant metrics that indicate user preferences. By translating these patterns into rating scores, the recommendation system can effectively predict and suggest items that align with user interests, even in the absence of explicit ratings.
2.7.3. Evaluation
There are various evaluation metrics used to assess the performance of recommendation systems. These include mean absolute error (MAE), mean squared error (MSE), root mean squared error (RMSE), precision, recall, and discounted cumulative gain (DCG). Each metric is suitable for different types of data and evaluation purposes.
For instance, MAE is often used to evaluate the accuracy of predictions by measuring the average magnitude of the errors between predicted and actual values. MSE and RMSE provide a measure of the squared errors and their square root, respectively, offering insights into the variance of the errors. Precision and recall are commonly used in classification tasks to evaluate the relevancy and completeness of the recommendations. DCG is useful for assessing the quality of rankings provided by the recommendation system.
In the context of this evaluation, MAE was used as the evaluation metric with the MovieLens 1M and MovieLens latest small datasets. MAE was chosen due to its simplicity and effectiveness in measuring the average prediction error, providing a clear indication of the system’s accuracy.
2.7.4. Application
Recommendation systems have various applications across different industries. For example, in the offline retail industry, a recommendation system can be used to suggest products to customers. This is particularly useful for products that sell quickly, as retailers aim to encourage customers to purchase a wide variety of products. The data for these recommendations can be stored and processed on high-capacity hard disk drives, ensuring that the system can handle large volumes of transaction data efficiently.
Another innovative approach involves investigating the use of sentiment scores for skincare product recommendations rather than relying on traditional ratings. By analyzing customer sentiments expressed in reviews and feedback stored on HDDs, the recommendation system can provide more personalized and relevant suggestions.
Additionally, user-based collaborative filtering systems have been applied in the gaming industry, specifically for deck recommendations in the game Clash Royale. This system helps players make better decisions about their decks by analyzing the preferences and successes of similar players, with the data being securely stored on reliable HDDs to manage the extensive player interaction data.
3. Research and Methodology
To develop a recommendation system using the collaborative filtering method, the following methodological steps, as illustrated in Figure 5, should be followed.
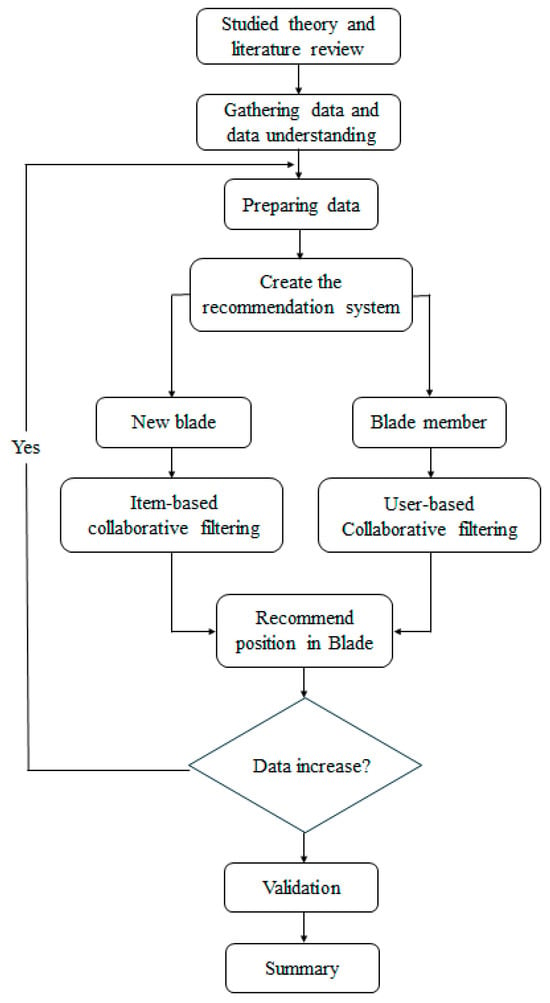
Figure 5.
Operation workflow.
3.1. Data Collection
3.1.1. Repair Data
This dataset was obtained through failure analysis (FA), focusing on positions that consistently experience failures. The dataset includes the component serial numbers, specific positions within the components, and the corresponding actions taken for each component. The data span from 23 January to 1 June 2023 and comprise 326 samples used to train machine learning models. The frequency of each action is illustrated in Figure 6.
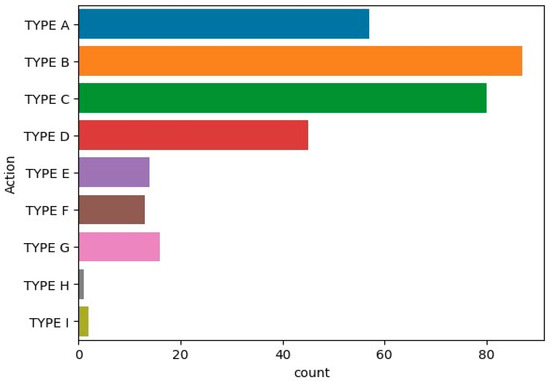
Figure 6.
Count of each action.
3.1.2. Blade Testing Data
After the components are repaired, they must undergo testing in the electrical test (ET) process. If the components pass the ET, they are sent to run in the Amber testing machine. This indicates that the system can effectively recommend the appropriate positions to technicians. This dataset includes the component serial numbers and their ET statuses.
3.1.3. Blade Runtime Data
To monitor component operation, we can evaluate the looping issue status using runtime data. Based on these data, we established criteria indicating that, if the operation time is less than 6 h and the components fail with the same error, these components are classified as having a looping issue.
3.2. Data Preprocessing
Before creating the recommendation system, we need to prepare the data. They are prepared by following the subsequently listed steps.
3.2.1. Cleaning Data
To utilize the action data effectively, it is necessary to address any missing or incomplete entries. Specifically, rows without a component serial number should be discarded. Additionally, any typographical errors must be corrected. Subsequently, we need to identify and manage data entries that lack an action or contain incorrect action information.
3.2.2. Data Transformation
The recommendation system employing a collaborative filtering technique typically relies on a rating score provided directly by the user. However, in the absence of explicit rating data, this project substitutes the rating score with an implicit rating. The implicit rating is derived from historical data or past actions associated with each blade. The operation steps are outlined as follows:
First, using the historical data presented in Table 1, the total number of actions for each blade is counted and summarized in Table 2.

Table 1.
Example of historical data.

Table 2.
Example of counting the total number of actions for each component.
To calculate the implicit rating, the rating score is interpreted on a scale ranging from 0 to 10. In this context, a score of 0 indicates that the component has a minimal likelihood of undergoing a specific repair, whereas a score of 10 signifies that the component has the highest probability of undertaking the action. The function to determine the implicit rating is defined as follows:
where
- u = the user or component.
- i = the item or action.
After the calculation, the number of ratings will start from 0 and reach a maximum of 10, as outlined in Table 3.

Table 3.
An example of the implicit rating score is provided.
3.3. Recommendation System
This project developed a recommendation system for two scenarios: component members (components that have previously undergone FA) and new components (components that have never undergone FA), following the workflow in Figure 7.
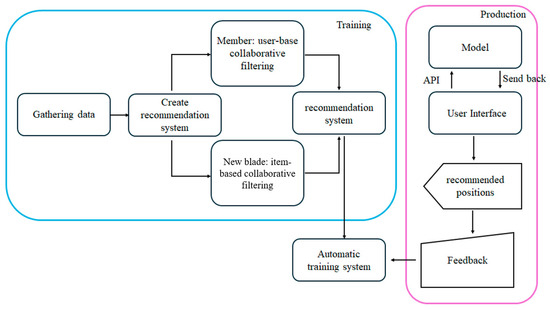
Figure 7.
Recommendation system workflow.
3.3.1. Recommendation System for Blade Members
In creating the system for blade members using a collaborative filtering technique, the following procedures were implemented:
Data Splitting: The preprocessed data were divided into two sets: one for training and one for testing. Specifically, 80% of the data were allocated for training, while the remaining 20% were reserved for testing.
Applying User-Based Collaborative Filtering: To develop the recommendation system for blade members, this project proposed utilizing an artificial neural network (ANN) with an autoencoder method. According to existing research, using an ANN for collaborative filtering provides superior performance than using traditional collaborative filtering techniques. The mean squared error and mean absolute error were employed as loss functions, with the root mean squared error being calculated to evaluate the system’s performance.
Autoencoder Models: This project developed nine models with varying bottleneck sizes and epochs for comparison, as outlined in Table 4.

Table 4.
Experimental training with different parameters.
3.3.2. Recommendation System for New Blade
For new components, the project employed item-based filtering and cosine similarity. Due to the absence of historical data for new components, the top action—identified as the action with the highest likelihood of occurrence and popularity trend—was selected. Cosine similarity was then calculated, and the similarity scores were sorted to identify the actions most similar to the top action.
3.4. Automatic Training System
Given the current amount of data available at this stage of the project and to enhance the model’s performance over time, an automatic training system is necessary. This system will monitor data increments and, upon detecting an increase, trigger the retraining of the recommendation system.
3.5. Simulation Situation
In this project, a web application was developed to serve as the user interface (UI) for the system. Users are required to input the component serial number and select the error code in the UI. Upon clicking the send button, the system will display the recommendations. The UI is depicted in Figure 8.
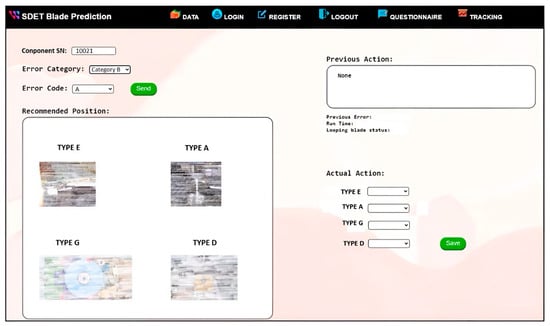
Figure 8.
User interface for the recommendation system.
In the application of the recommendation system within the production line, merely presenting the recommendations is inadequate. It is necessary to incorporate additional features to inform users of the precise actions required and the destination of the blades. Furthermore, the recommendations need to be dynamically adjusted if the same blade is ejected with an identical error. This phase of the implementation is supported by an operational flowchart, as depicted in Figure 9. Given the inherent variability of the production line environment, it is crucial to simulate various scenarios, as specified in Table 5, to ensure comprehensive system testing. Successfully covering all designed scenarios in the simulation will provide confidence that the system will function correctly under actual production conditions.
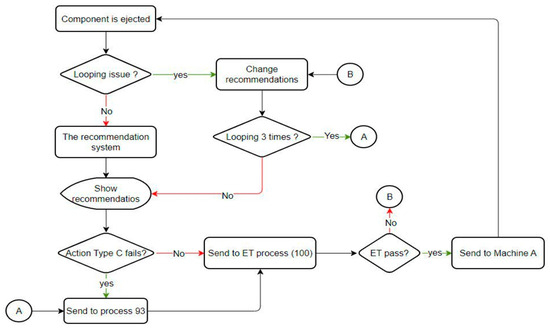
Figure 9.
Flowchart for applying the recommendation system.

Table 5.
Simulation situation.
Due to the inability of the production line to control certain situations and outcomes, merely displaying the recommendations is insufficient. Therefore, it was necessary to incorporate additional operational features as illustrated in Figure 9. We also developed a simulation environment to test all the scenarios we designed. These scenarios included (1) a normal situation, (2) a looping issue entering the system, (3) a particular action failure, and (4) an ET test failure.
3.6. Verification
Based on the flowchart of the repair process, the repaired component will undergo testing in the ET process before being sent back to the Amber testing machine, as depicted in Figure 10. Consequently, we designed the validation plan by referencing this workflow.
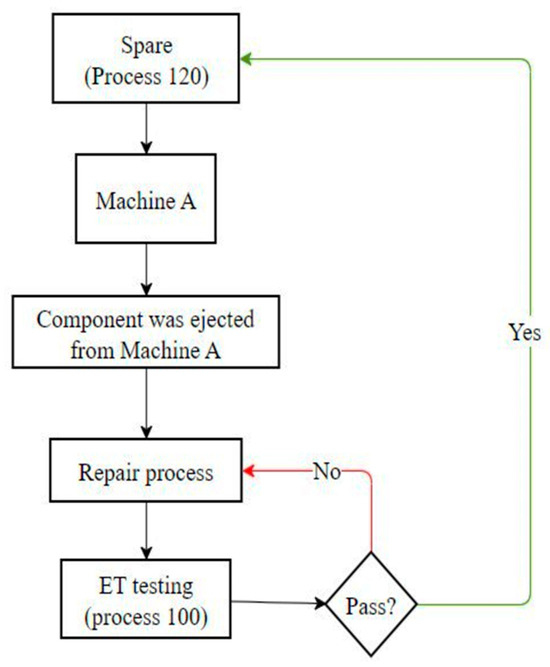
Figure 10.
Flowchart of repairing process.
This project necessitates system validation through testing with real data. The validation plan was designed in two phases. The first phase was to validate the operation of the recommender system, which can be accomplished through the ET process. After repair, if the component passes the ET process, the system can recommend appropriate actions. The second phase was to validate the solution for the looping issue. After the ET process, if the repaired component can operate in the Amber testing machine for more than 6 h or fails with a different error, it can be concluded that the component does not have a looping issue. The schematic for the validation plan is shown in Figure 11.
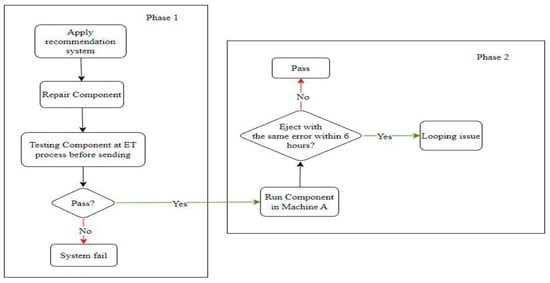
Figure 11.
Schematic of validation plan.
4. Result
The results for each part of this project are discussed here.
4.1. Recommendation System for Component Members
This project created nine models (From Table 4) for different parameters, and the results are shown in Table 6. We obtained the best model at bottleneck = 20 and number of epochs = 300; it provided MAE = 0.8434, MSE = 3.3293, and RMSE = 1.8246. Additionally, the results are shown in Appendix A (Figure A1, Figure A2 and Figure A3).

Table 6.
Result of autoencoder with different parameters.
4.2. Recommendation System for a New Component
We set the top action, TYPE B, as a reference and calculated the cosine similarity scores for other actions. We found that TYPE C had the highest similarity score, followed by TYPE D and TYPE A, respectively.
4.3. Automatic System
To improve the model’s performance, we included an automatic training facility that activates whenever new data are received. As the data volume increases, performance is expected to improve. Using only the first-period data to train the autoencoder resulted in a mean absolute error (MAE) of 0.9301. After appending second-period data, the MAE decreased to 0.8434. This reduction in MAE indicates that an increase in the data volume leads to better performance.
4.4. Applying the Recommendation System
From simulated scenarios, we conducted experiments and observed that the system operated correctly and provided comprehensive recommendations across all situations. These findings are summarized in Table 7.

Table 7.
Results of simulation situations.
4.5. Validation
The recommendation system selected 102 components to be rerun in the Amber testing machine, while 104 components remained fixed. We discovered that 13 components failed during the ET process for unrecoverable reasons. Additionally, out of the 21 components experiencing the looping issue, only 5 were fixed using the recommendation system again. Two components did not experience the looping problem, whereas three components did.
It can be concluded that product component A experienced the looping problem with error code A occurring at a rate of 20.59%. This is a reduction of 13.41% when compared to the original problem statement, which reported a looping rate of 34%. The technicians followed specific recommendations and actions regarding the five components in which the looping problem persisted.
In Table 8, it is shown that component 8864 performed no action the second time around but did not experience the looping problem. Component 9512 performed a different action the second time around and also did not experience the looping problem. Finally, component 7477 was repaired three times consecutively but still experienced the looping problem each time despite being checked in all positions.

Table 8.
Results of looping issues repaired using the recommendation system.
5. Conclusions
The objective of this project was to develop a recommendation system aimed at reducing the incidence of looping issues, defined as a component failing with the same fault within 6 h, by addressing two scenarios: existing component members and new components. For existing components in the FA list, a user-based collaborative filtering approach with implicit ratings was employed, while new components were managed using an item-based collaborative filtering technique with cosine similarity scores. Through the implementation of user-based filtering across nine models with varying parameters, the optimal model was identified after overcoming 20 bottlenecks and completing 300 epochs, yielding a mean absolute error of 0.8434 and a root mean square error of 1.8246. The system provided an action list recommendation for new components, including options such as TYPE A, TYPE B, TYPE C, and TYPE D. Upon deployment in a manufacturing line, the system reduced the looping rate of component Product A with fault code A from 34% to 20.59%, a reduction of 13.41%. However, among the components that continued to face looping issues after repair, two did not loop after a second repair, while three continued to loop despite thorough examination in all positions. These findings suggest that, while the system effectively reduces looping issues, further investigation is necessary to identify the root cause, potentially involving the interaction between the existing system and the Amber testing machine. Future research should focus on applying supervised machine learning techniques with expanded data collection and root cause analysis to ascertain the direct origin of component failures.
Suggestion
This project is focused on developing a recommendation system, rather than a predictive model. Consequently, the recommended actions may not always be accurate or comprehensive. Additionally, the dataset used to train the recommendation system is relatively small, which limits the system’s effectiveness. To enhance efficiency, it is necessary to collect more data. As the dataset grows, the system’s performance is expected to improve. Furthermore, incorporating additional error codes into the system would better support the operations of technicians.
Regarding the looping blade issue, it is crucial to identify the exact root cause. Understanding the specific problem allows for the exploration of various alternative solutions. The recommended actions should ideally be derived from predictions based on supervised machine learning. By identifying signals that clearly indicate potential failures at specific positions, the system could provide technicians with precise locations for repair. However, it is essential to have a thorough understanding of the data or to collect data directly related to the blades, preferably through automated sensors rather than through manual input.
Author Contributions
Conceptualization, R.U. and S.N.; methodology, R.U. and N.D.; validation, R.U., S.N., and N.D.; formal analysis, R.U.; data curation, R.U.; writing—original draft preparation, R.U. and N.D.; writing—review and editing, R.U. and N.D.; visualization, R.U.; supervision, R.U. and U.L.; project administration, R.U., J.S., and U.L. All authors have read and agreed to the published version of the manuscript.
Funding
This research was funded by Suranaree University of Technology, Thailand, under the Student Fundamental Research program, Grant number IRD-thesis-1.
Data Availability Statement
All works are included in the article and can be directly requested from the corresponding author.
Acknowledgments
The authors would like to thank the Program Management Unit for Human Resources and Institutional Development, Research, and Innovation (PMU-B) and Western Digital Storage Technologies (Thailand) Ltd. for their financial support. Special thanks also go to Suranaree University of Technology for their support.
Conflicts of Interest
The authors declare no conflict of interest.
Appendix A
Based on the above analysis, we can compare the results of the models using MAE and RMSE, as illustrated in Figure A1 and Figure A2, respectively. Since the optimal model is identified at a bottleneck size of 20, we can further evaluate its performance by plotting the MAE and MSE for both the training and validation datasets, as depicted in Figure A3 and Figure A4, respectively.
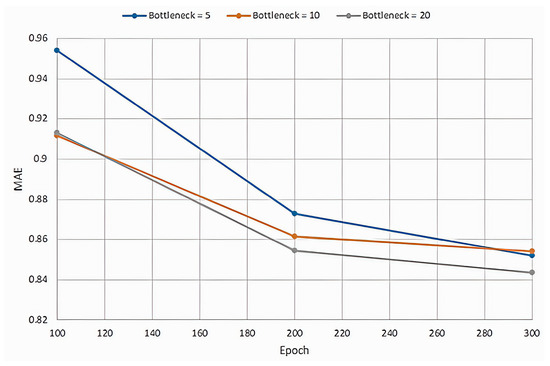
Figure A1.
Mean absolute error for different bottlenecks.
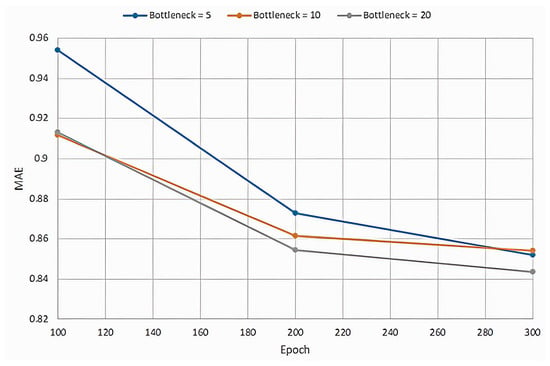
Figure A2.
Root mean square error for different bottlenecks.
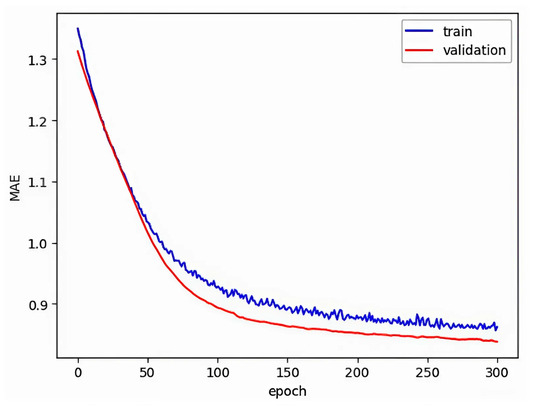
Figure A3.
Mean absolute error for the size of training and test validation data in bottleneck 20.
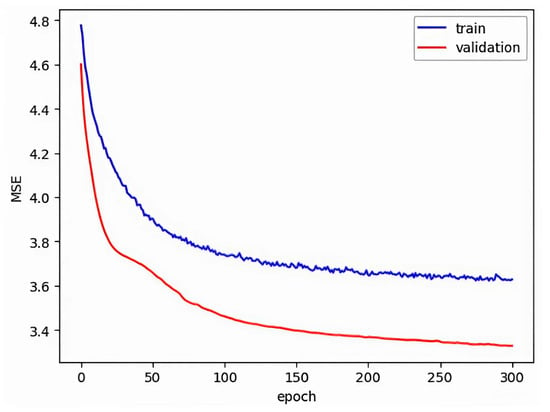
Figure A4.
Mean square error for the size of training and test validation data in bottleneck 20.
References
- Walzberg, J.; Zhao, F.; Frost, K.; Carpenter, A.; Heath, G.A. Exploring Social Dynamics of Hard-Disk Drives Circularity with an Agent-Based Approach. In Proceedings of the 2021 IEEE Conference on Technologies for Sustainability (SusTech), Irvine, CA, USA, 22–24 April 2021; pp. 1–6. [Google Scholar] [CrossRef]
- Bubpatha, W.; Thongsri, J. A simulation of swage process for hard disk drive factory based on explicit dynamics analysis. In Proceedings of the 2022 37th International Technical Conference on Circuits/Systems, Computers and Communications (ITC-CSCC), Phuket, Thailand, 5–8 July 2022; pp. 864–867. [Google Scholar] [CrossRef]
- Züfle, M.; Erhard, F.; Kounev, S. Machine Learning Model Update Strategies for Hard Disk Drive Failure Prediction. In Proceedings of the 2021 20th IEEE International Conference on Machine Learning and Applications (ICMLA), Pasadena, CA, USA, 13–16 December 2021; pp. 1379–1386. [Google Scholar] [CrossRef]
- Kirdponpattara, S.; Sooraksa, P.; Boonjing, V. Building a Rule-Based Expert System to Enhance the Hard Disk Drive Manufacturing Processes. IEEE Access 2024, 12, 29558–29570. [Google Scholar] [CrossRef]
- Lo, G.J.; Mate, C.M.; Dai, Q. Finite Element Simulation of the Mechanical and Thermal Behaviors of a Disk Drive Head Contacting a Disk Asperity. Tribol. Lett. 2016, 64, 6. [Google Scholar] [CrossRef]
- Chuanwei, Z.; Ovcharenko, A.; Min, Y.; Knutson, N.; Talke, F.E. Investigations of thermal asperity sensors in thermal flying-height control sliders. IEEE Trans. Magn. 2014, 50, 3303104. [Google Scholar] [CrossRef]
- Rajauria, S.; Canchi, S.V.; Schreck, E.; Marchon, B. Nanoscale wear and kinetic friction between atomically smooth surfaces sliding at high speeds. Appl. Phys. Lett. 2015, 106, 081604. [Google Scholar] [CrossRef]
- Marchon, B.; Pitchford, T.; Hsia, Y.-T.; Gangopadhyay, S. The head-disk interface roadmap to an areal density of Tbit/in2. Adv. Tribol. 2013, 2013, 521086. [Google Scholar] [CrossRef]
- Seo, Y.W.; Ovcharenko, A.; Talke, F.E. Simulation of Hydrocarbon Oil Contamination at the Head–Disk Interface Using Molecular Dynamics. Tribol. Lett. 2016, 61, 28. [Google Scholar] [CrossRef]
- Zhang, F.; Wang, Y.; Hu, Y.; Zhang, M.; Li, B. Investigation of electrostatically tunable adhesion and instability of flying head slider. Friction 2024, 12, 462–473. [Google Scholar] [CrossRef]
- Yang, A.; Wang, Y.; Zi, Y.; Liang, X. Quantitative identification of slider nanoscale wear based on the head-disk interface dynamics. Tribol. Int. 2017, 116, 95–104. [Google Scholar] [CrossRef]
- Liu, Y. Advance piezo-actuator technologies for hard disk drive applications. Microsyst. Technol. 2023, 29, 1117–1127. [Google Scholar] [CrossRef]
- Srivastava, A.; Lamberts, B.; Venkatesh, K.; Rai, R.; Li, N.; Knigge, B. Head–disk interface (HDI) degradation risk reduction in hard disk drive (HDD) during thermal asperity (TA) track follow mapping and seeking. Microsyst. Technol. 2021, 27, 2493–2498. [Google Scholar] [CrossRef]
- Wallash, A.; Zhu, H.; Chen, D. A Dynamic Scratch Test to Study Read/Write Head Degradation Due to Head-Disk Interactions. IEEE Trans. Magn. 2008, 44, 3629–3632. [Google Scholar] [CrossRef]
- Chakraborty, M.; Caverly, R.J. Disturbance modeling and prediction of closed-loop micro-actuator stroke usage in dual-stage hard disk drives. ASME Lett. Dyn. Syst. Control. 2022, 2, 041003. [Google Scholar] [CrossRef]
- Li, H.; Chen, G.; Shi, B. Nonlinear air-bearing slider modeling and optimizing for hard disk drives with ultra-low flying heights. In Proceedings of the 2010 2nd International Conference on Computer Engineering and Technology, Chengdu, China, 16–18 April 2010; Volume 2, pp. 191–195. [Google Scholar] [CrossRef]
- Kubotera, H.; Bogy, D.B. Dynamic Numerical Simulation of Lubricant Behavior at the Head Disk Interface. In Proceedings of the Asia-Pacific Magnetic Recording Conference 2006, Singapore, 29 November–1 December 2006; pp. 1–2. [Google Scholar] [CrossRef]
- Wei, H.; Ao, H.; Jiang, H. Numerical simulation of the dynamic characteristics of the ultra-thin gas flow at the head/disk interface of hard disk drives. In Proceedings of the 2010 the 2nd International Conference on Computer and Automation Engineering (ICCAE), Singapore, 26–28 February 2010; pp. 259–262. [Google Scholar] [CrossRef]
- Ao, H.; Wei, H.; Jiang, H. Effect of the external shock on the dynamic characteristics of dual sliders at operational state for small form factor hard disk drives. In Proceedings of the 2010 3rd International Symposium on Systems and Control in Aeronautics and Astronautics, Harbin, China, 8–10 June 2010; pp. 1233–1236. [Google Scholar] [CrossRef]
- Boettcher, U.; Li, H.; de Callafon, R.A.; Talke, F.E. Dynamic Flying Height Adjustment in Hard Disk Drives through Feedforward Control. IEEE Trans. Magn. 2011, 47, 1823–1829. [Google Scholar] [CrossRef]
- Simongyi, M.; Chongstitvatana, P. Abnormality Detection in Hard Disk Drive Assembly Process Using Support Vector Machine. In Proceedings of the 2018 15th International Conference on Electrical Engineering/Electronics, Computer, Telecommunications and Information Technology (ECTI-CON), Chiang Rai, Thailand, 18–21 July 2018; pp. 612–615. [Google Scholar] [CrossRef]
- Sridee, A.; Chongstitvatana, P. Machine Learning Techniques to Detect Failure in Hard Disk Drive Test Process. In Proceedings of the 2022 6th International Conference on Information Technology (InCIT), Nonthaburi, Thailand, 10–11 November 2022; pp. 152–156. [Google Scholar] [CrossRef]
- Wagh, R.; Anand, D. Application of citation network analysis for improved similarity index estimation of legal case documents: A study. In Proceedings of the 2017 IEEE International Conference on Current Trends in Advanced Computing (ICCTAC), Bangalore, India, 2–3 March 2017; pp. 1–5. [Google Scholar] [CrossRef]
- Mulugoju, A.; Noorullah, R.M.; Mohammed, M. Social Network-based Data Clustering with Sampling-based Multiview-Points Cosine-based Similarity Metrics of Hybrid Topic Models. In Proceedings of the 2023 Second International Conference on Augmented Intelligence and Sustainable Systems (ICAISS), Trichy, India, 23–25 August 2023; pp. 1374–1380. [Google Scholar] [CrossRef]
- Allahbakhsh, M.; Rafat, R.L.; Rafat, F.L. A Prediction-Based Approach for Computing Robust Rating Scores. In Proceedings of the 2019 9th International Conference on Computer and Knowledge Engineering (ICCKE), Mashhad, Iran, 24–25 October 2019; pp. 116–121. [Google Scholar] [CrossRef]
- Nurfadillah, R.; Darari, F.; Prasojo, R.E.; Amalia, Y. Benchmarking Explicit Rating Prediction Algorithms for Cosmetic Products. In Proceedings of the 2020 3rd International Seminar on Research of Information Technology and Intelligent Systems (ISRITI), Yogyakarta, Indonesia, 10 December 2020; pp. 457–462. [Google Scholar] [CrossRef]
- Zhang, W.; Li, X.; Li, J.; Yang, Y.; Yoshida, T. A Two-Stage Rating Prediction Approach Based on Matrix Clustering on Implicit Information. IEEE Trans. Comput. Soc. Syst. 2020, 7, 517–535. [Google Scholar] [CrossRef]
- Qi, J.; Du, J.; Siniscalchi, S.M.; Ma, X.; Lee, C.-H. On Mean Absolute Error for Deep Neural Network Based Vector-to-Vector Regression. IEEE Signal Process. Lett. 2020, 27, 1485–1489. [Google Scholar] [CrossRef]
- Chai, T.; Draxler, R.R. Root mean square error (RMSE) or mean absolute error (MAE)?—Arguments against avoiding RMSE in the literature. Geosci. Model Dev. 2014, 7, 1247–1250. [Google Scholar] [CrossRef]
- Rajesh, K.; Saravanan, M.S. Prediction of Customer Spending Score for the Shopping Mall using Gaussian Mixture Model comparing with Linear Spline Regression Algorithm to reduce Root Mean Square Error. In Proceedings of the 2022 6th International Conference on Intelligent Computing and Control Systems (ICICCS), Madurai, India, 25–27 May 2022; pp. 335–341. [Google Scholar] [CrossRef]
- Wu, Y.; Feng, J. Development and Application of Artificial Neural Network. Wirel. Pers. Commun. 2018, 102, 1645–1656. [Google Scholar] [CrossRef]
- Zou, J.; Han, Y.; So, S.S. Overview of Artificial Neural Networks. In Artificial Neural Networks. Methods in Molecular Biology™; Livingstone, D.J., Ed.; Humana Press: Totowa, NJ, USA, 2008; Volume 458. [Google Scholar] [CrossRef]
- Zhang, Z. Artificial Neural Network. In Multivariate Time Series Analysis in Climate and Environmental Research; Springer: Cham, Switzerland, 2018. [Google Scholar] [CrossRef]
- Asadollahfardi, G. Artificial Neural Network. In Water Quality Management; Springer Briefs in Water Science and Technology; Springer: Berlin/Heidelberg, Germany, 2015. [Google Scholar] [CrossRef]
- Wang, S.C. Artificial Neural Network. In Interdisciplinary Computing in Java Programming; The Springer International Series in Engineering and Computer Science; Springer: Boston, MA, USA, 2003; Volume 743. [Google Scholar] [CrossRef]
- Zhai, J.; Zhang, S.; Chen, J.; He, Q. Autoencoder and Its Various Variants. In Proceedings of the 2018 IEEE International Conference on Systems, Man, and Cybernetics (SMC), Miyazaki, Japan, 7–10 October 2018; pp. 415–419. [Google Scholar] [CrossRef]
- LeCun, Y.; Bengio, Y.; Hinton, G. Deep learning. Nature 2015, 521, 436–444. [Google Scholar] [CrossRef] [PubMed]
- Goularas, D.; Kamis, S. Evaluation of Deep Learning Techniques in Sentiment Analysis from Twitter Data. In Proceedings of the 2019 International Conference on Deep Learning and Machine Learning in Emerging Applications (Deep-ML), Istanbul, Turkey, 26–28 August 2019; pp. 12–17. [Google Scholar] [CrossRef]
- Gao, Y.; Zhao, B.; Qian, M. On the Compare of Evaluation of Deep Learning in Education. In Proceedings of the 2019 IEEE International Conference on Computer Science and Educational Informatization (CSEI), Kunming, China, 16–19 August 2019; pp. 205–208. [Google Scholar] [CrossRef]
- Guan, Z.; Wang, X.; Xin, W.; Wang, J.; Zhang, L. A Survey on Deep Learning-Based Source Code Defect Analysis. In Proceedings of the 2020 5th International Conference on Computer and Communication Systems (ICCCS), Shanghai, China, 15–18 May 2020; pp. 167–171. [Google Scholar] [CrossRef]
- Mandal, S.; Maiti, A. Explicit Feedbacks Meet with Implicit Feedbacks: A Combined Approach for Recommendation System. In Complex Networks and Their Applications VII; COMPLEX NETWORKS 2018. Studies in Computational Intelligence; Aiello, L., Cherifi, C., Cherifi, H., Lambiotte, R., Lió, P., Rocha, L., Eds.; Springer: Cham, Switzerland, 2019; Volume 813. [Google Scholar] [CrossRef]
- Li, Y.; Liu, J.; Ren, J.; Chang, Y. A Novel Implicit Trust Recommendation Approach for Rating Prediction. IEEE Access 2020, 8, 98305–98315. [Google Scholar] [CrossRef]
Disclaimer/Publisher’s Note: The statements, opinions and data contained in all publications are solely those of the individual author(s) and contributor(s) and not of MDPI and/or the editor(s). MDPI and/or the editor(s) disclaim responsibility for any injury to people or property resulting from any ideas, methods, instructions or products referred to in the content. |
© 2024 by the authors. Licensee MDPI, Basel, Switzerland. This article is an open access article distributed under the terms and conditions of the Creative Commons Attribution (CC BY) license (https://creativecommons.org/licenses/by/4.0/).