Article

Enhanced Non-Destructive Testing of Small Wind Turbine Blades Using Infrared Thermography

by
Majid Memari
1,*,
Mohammad Shekaramiz
2,
Mohammad A. S. Masoum
2 and
Abdennour C. Seibi
3
1
Computer Science Department, Utah Valley University, Orem, UT 84058, USA
2
Machine Learning and Drone Laboratory, Electrical and Computer Engineering Department, Utah Valley University, Orem, UT 84058, USA
3
Mechanical and Civil Engineering Department, Utah Valley University, Orem, UT 84058, USA
*
Author to whom correspondence should be addressed.
Machines 2025, 13(2), 108; https://doi.org/10.3390/machines13020108
Submission received: 31 October 2024 / Revised: 17 January 2025 / Accepted: 22 January 2025 / Published: 29 January 2025

Abstract

:
This study presents a foundational step in a broader initiative aimed at leveraging thermal imaging technology to enhance wind turbine maintenance, particularly focusing on the challenges of detecting defects and object localization in small wind turbine blades. Serving as a preliminary experiment, this research project tested methodologies and technologies on a smaller scale before advancing to more complex applications involving large, operational wind turbines using drone-mounted cameras. Utilizing thermal cameras suitable for both handheld and drone use, alongside advanced image processing applications, we navigated the significant challenge of acquiring high-quality thermal images to detect small defects. This required a concentrated analysis of a select subset of data and a methodological shift towards object detection and localization using the You Only Look Once (YOLO) model versions 8 and 9. This effort not only paves the way for applying these techniques to larger-scale turbines but also contributes to the ongoing development of an integrated maintenance strategy in the wind energy sector. Highlighting the critical impact of environmental conditions on thermal imaging, our research underscores the importance of continued exploration in this field, especially in enhancing object localization techniques for the future drone-based maintenance of operational wind turbine blades (WTBs).

1. Introduction

The shift toward renewable energy sources is essential for mitigating global carbon emissions, with wind energy playing a crucial role in this transition. Wind turbines, a fundamental component of this shift, require meticulous maintenance to maintain efficiency and reliability. This underscores the vital importance of continuous innovation in maintenance and inspection practices. Wind turbine blades (WTBs) are particularly susceptible to various damages that can drastically affect their performance. Among the technologies used in maintenance, thermal imaging stands out for its ability to detect subsurface defects that are otherwise invisible, enhancing the effectiveness of maintenance protocols. Our comprehensive review [1] delves into the latest advancements and explores the transformative potential of these technologies in detecting defects in WTBs. Recent advancements in thermal imaging have increasingly facilitated the inspection of WTBs, highlighting its potential as a non-invasive diagnostic tool. Despite these technological strides, several critical shortcomings persist in the application of thermal imaging within the context of wind turbine maintenance. The primary limitation lies in the generic nature of the datasets used in most studies. While thermal imaging has been proven to detect subsurface defects such as delaminations, voids, and moisture ingress effectively, the datasets typically employed do not adequately reflect the specific and varied nature of defects that WTBs exhibit [2]. These datasets often lack the resolution or specific environmental conditions under which real-world turbine blades operate, limiting the practical applicability of the findings [3]. Furthermore, existing research often does not address the full spectrum of defect types that can affect WTBs. For example, while thermal imaging is effective at identifying larger thermal anomalies, smaller yet critical defects might not be detected due to the limitations in sensor resolution or the methodologies employed [4]. This gap is crucial because small defects can evolve into significant damage if not identified and addressed early. Moreover, the integration of Unmanned Aerial Vehicles (UAVs) with thermal imaging technologies, although innovative, faces challenges related to the stability and precision of the UAV platforms. The accuracy of thermal imaging is highly dependent on the stability of the camera during flight, which can be affected by wind and other environmental factors. This introduces variability in the data quality, which can compromise the defect detection process [5]. In terms of data processing, most existing approaches utilize conventional image processing techniques that may not adequately handle the complexities of thermal data, which require advanced algorithms to be interpreted effectively. The need for more sophisticated machine learning models that can learn from and adapt to the unique patterns of thermal images is evident but underexplored in the current literature [6]. To address these deficiencies, there is a need for research that develops high-fidelity, high-resolution thermal datasets that are reflective of the actual operating conditions of wind turbines. Additionally, enhancing UAV stability and employing advanced machine learning techniques for data analysis are critical in overcoming the current limitations of thermal imaging applications in this field.

1.1. Inferared Thermography (IRT) Non-Destructive Testing (NDT)

Wind turbine blade infrared thermography (IRT) non-destructive testing (NDT) is an advanced diagnostic technique used to detect defects and assess the integrity of wind turbine blades. This method involves using infrared cameras to capture thermal images of the blades, which reveal temperature variations that indicate the presence of internal flaws such as delaminations, cracks, or moisture ingress. IRT NDT is valued for its ability to provide rapid, accurate, and comprehensive inspections without causing damage to the blades. As a result, it enhances the reliability and efficiency of wind turbines by ensuring the early detection and remediation of potential issues, thereby extending the lifespan of the blades and optimizing energy production.
Galleguillos et al. [7] discussed a novel NDT technique using IRT combined with UAVs for inspecting WTBs. The study validated the feasibility of using passive IRT, which leverages natural thermal effects rather than external heat sources, to identify common defects such as delaminations, cracks, and impact damage in wind blades. The authors conducted both ground-based tests with artificially introduced defects and flight tests using a unmanned aerial systems equipped with an IR camera. The results demonstrated the method’s effectiveness in detecting significant defects rapidly and safely, suggesting that this approach could significantly reduce the time and risk associated with traditional blade inspection methods.
Doroshtnasir et al. [8] introduced an NDT method for inspecting WTBs using IRT. This method is particularly useful for offshore turbines where accessibility is limited. The authors described a novel procedure that involves creating difference thermograms to minimize misinterpretations caused by environmental reflections, identifying signals unrelated to structural or dynamic features, and comparing these signals to processed photographs to rule out false positives from surface effects. The study confirmed that the approach can effectively detect subsurface defects from a distance, offering a significant advancement over traditional IRT methods which often only consider a subset of these steps. This technique not only increases the reliability of inspections but also enhances the ability to conduct them under operational conditions, thereby improving maintenance efficiency and safety in wind energy operations.
Traphan et al. [9] explored the application of IRT for identifying surface defects in WTBs while in operation. This non-invasive method provides a promising alternative to traditional inspections, which often require turbine downtime and physical access to blades. The study compared IRT data with stereoscopic particle image velocimetry to validate the method’s efficacy. It further investigated the aerodynamic effects of detected surface defects using both experimental setups and computational fluid dynamics simulations. Results indicated that IRT could effectively visualize surface anomalies by detecting thermal patterns associated with defective areas, thereby enabling the early detection of potential damages that could lead to significant maintenance issues if left unaddressed.
Chen et al. [10] introduced an innovative method called AQUADA for the automated detection and quantification of structural damages in WTBs using thermography and computer vision. The study highlighted the application of this technology to reduce the Levelized Cost of Energy (LCOE) by simplifying and economizing the inspection process. By automating damage detection and integrating analysis with image acquisition, AQUADA minimizes human error and operational downtime. The method was tested on WTBs under laboratory conditions to validate its effectiveness. Results showed that AQUADA could potentially cut inspection costs by half and reduce the LCOE by 1–2%, proving its efficacy in identifying both superficial and subsurface blade damages without interfering with turbine operation.
Xu et al. [11] introduced an innovative approach to defect depth recognition using Gated Recurrent Unit (GRU) networks in conjunction with active IRT. This method leverages Principal Component Analysis (PCA) to process raw thermal sequences, reducing dimensionality and correlation before training the GRU model. The methodology was validated through experiments on polymethyl methacrylate specimens with flat-bottom hole defects. The results demonstrated that the PCA-enhanced GRU model achieved superior accuracy in recognizing defect depths compared to traditional approaches, showing its potential for enhancing non-destructive testing by efficiently processing thermal data and accurately determining defect characteristics.
Wang et al. [12] discussed an advanced method for detecting thermal defects in a substation equipment using a Convolutional Neural Network (CNN) integrated with a Support Vector Machine (SVM). The method enhances image processing by using improved pre-processing techniques to isolate the region of interest (RoI) and refine the thermal image data. Temperature values were segmented and categorized into 11 distinct labels, forming the T-IR11 dataset, which was essential for training the CNN model. The approach was evaluated using precision, recall, and F1 score metrics, demonstrating a high accuracy of 99.50%. This method significantly automates and improves the efficiency and accuracy of thermal defect detection in substation equipment, which is crucial for maintaining the reliability and stability of power systems.
Jiang et al. [13] evaluated the use of You Only Look Once (YOLO) [14] models for object detection in UAV-based thermal infrared images and videos. The study emphasized overcoming challenges like low resolution, complex backgrounds, and a lack of labeled datasets in UAV thermal infrared imagery by adapting YOLO models for thermal infrared application. These models were tested on ground-based and UAV datasets, demonstrating high effectiveness in various scenarios, including day and night operations. The results were promising, with a mean average precision (mAP) of 88.69% for detecting specific objects like cars and people, and the models achieved up to 50 frames per second in the processing speed. This research underlined the YOLO models’ adaptability to thermal infrared data, enhancing UAV capabilities for real-time surveillance and monitoring applications.
Wang et al. [15] investigated the effectiveness of using passive IRT for detecting various types of damage in small WTBs under natural outdoor conditions. This method optimized the light conditions required for effective detection by analyzing the interaction between light intensity and the surface temperatures of damaged blades. The experimental findings indicated that the optimal detection of different damage types—such as foreign body attachment, surface wear, and cracks—occurred at specific light intensities, with light around 1000 W/m2 being most effective. Additionally, the study utilized numerical simulations to further validate the experimental results and establish a thermodynamic coupling model, demonstrating a linear relationship between light intensity and the thermal responses of the blade, such as temperature, stress, and strain, thereby enhancing the practical application of this technology in field conditions.
Yu et al. [16] introduced an innovative method for stitching infrared images of WTBs using data from UAVs and a U-Net-based neural network. This method was designed to overcome challenges associated with the weak texture and low contrast of infrared images. By employing U-Net for semantic segmentation to isolate the blades from complex backgrounds, the method calculated necessary geometric transformations to align and stitch the images accurately. This process enhanced the quality of the stitched images, as evidenced by comparative analysis against traditional stitching algorithms. The approach not only ensures accurate blade orientation and alignment but also significantly improves the detection and quantification of defects, contributing to more effective maintenance strategies for wind turbines.
Chen et al. [17] introduced AQUADA Plus, a novel method leveraging thermography and computer vision to detect damage in large-scale composite structures under cyclic loads. The method automates the detection, localization, and evaluation of damage through thermal image analysis, addressing challenges posed by complex thermal backgrounds and environmental conditions. A significant aspect of this study was the integration of drone-based thermography, demonstrating the method’s application in real-world settings without stopping wind turbine operations. The approach not only enhances damage detectability and accuracy but also promises considerable reductions in inspection times and costs. The potential of this method to revolutionize structural health monitoring in wind turbines and similar large structures is underscored by its successful application in both laboratory settings and field tests.
Oliveira et al. [18] proposed a comprehensive framework for detecting faults in large-scale photovoltaic plants using aerial IRT combined with orthomosaicking techniques. Orthomosaicking, often referred to simply as mosaicking, is a process used in image processing and remote sensing; it involves stitching together multiple overlapping images into a single, seamless composite image, known as an orthomosaic. Utilizing the Mask R-CNN algorithm for instance segmentation, the study addressed the challenges of analyzing extensive photovoltaic arrays by automating fault detection and localization. This framework effectively reduces the time and potential errors associated with manual inspections through its integration of deep learning and image processing technologies. Initial tests demonstrated high accuracy in detecting and pinpointing hotspots and other defects, offering significant improvements in operational efficiency for maintenance operations in photovoltaic plants.
Attallah et al. [19] presented an advanced method for diagnosing inter-turn faults in induction generators used in offshore wind turbines. This method uses multiple CNNs in combination with IRT and a sophisticated feature selection mechanism to improve fault detection efficiency and accuracy. The approach leverages the strengths of different CNN architectures by merging their features, followed by a selective reduction in these features to enhance diagnostic effectiveness. It eliminates the need for contact-based measurement, making it ideal for the challenging offshore environment. The proposed method not only increases the accuracy of fault diagnosis in wind turbine generators but also significantly reduces the computational load and diagnosis time. This was demonstrated through a detailed comparison to traditional and other deep learning methods, highlighting its superiority in accuracy and efficiency.
Haidong et al. [20] detailed an innovative fault diagnosis method for rotating machinery that operates under varying speed conditions. This approach introduced a new Generative Adversarial Network (GAN) [21], called the Dual-Threshold Attention-Guided GAN (DTAGAN), which is tailored to generate high-quality infrared thermal images for fault diagnosis. The proposed DTAGAN addresses several challenges typical of traditional GANs such as gradient vanishing and poor feature extraction. By combining Wasserstein distance and gradient penalty within the loss function and incorporating an attention mechanism to highlight significant global features from thermal images, DTAGAN significantly enhances the quality and efficiency of image generation. The study demonstrated that DTAGAN outperformed existing methods in diagnosing faults in rotor-bearing systems through comparative experiments, particularly under conditions of limited data and speed variations.
Tanda et al. [22] investigated the efficacy of using UAVs and manned aircraft equipped with IRT for monitoring solar photovoltaic (PV) systems. It provided a detailed comparison of these two remote sensing platforms in detecting thermal anomalies in solar panels, which are indicative of faults. Both methods demonstrated high accuracy in identifying defects, with UAVs offering detailed imaging at lower operational costs and manned aircraft covering larger areas more quickly, thus potentially reducing overall inspection time for large-scale installations. The economic analysis highlighted that while UAVs are generally more cost-effective for smaller or medium-sized PV plants, aircraft can be more economically viable for larger installations exceeding 40 MW due to their quicker survey capabilities and the ability to cover extensive areas in a single day.
Petersen et al. [23] detailed a study on the use of Mid-Infrared Optical Coherence Tomography (MIR OCT) for inspecting leading edge coatings of WTBs. The study addressed the critical issue of erosion, which affects the aerodynamic efficiency and longevity of turbine blades. Through detailed experiments, the authors demonstrated that MIR OCT could effectively identify subsurface defects such as bubbles and cracks that were not detectable by other non-destructive methods like ultrasonic testing. This technology allowed for a deeper inspection of the protective coatings applied to turbine blades, offering a significant improvement over traditional methods by providing detailed, high-resolution images of internal structural defects without damaging the blades. The research suggests that implementing MIR OCT in the manufacturing process could enhance the quality control of turbine blade coatings, potentially reducing maintenance costs and downtime due to blade erosion.
Zhao et al. [24] explored advancements in active IRT technology for identifying defects in the renewable energy and electronics sectors. It provided a detailed examination of different active IRT methods like pulsed, lock-in, vibration-induced, and eddy current thermography, highlighting their applications and effectiveness in pinpointing defects in various materials and components. Specifically, the article discusses the integration of IRT with deep learning to enhance defect detection in photovoltaic systems and electronic components, noting significant improvements in both accuracy and efficiency. It addresses the practical challenges and benefits of these technologies, such as non-contact and large-area imaging capabilities, and suggests future research directions to further optimize defect detection and system monitoring.
Wang et al. [25] focused on enhancing defect detection in WTBs through advanced image segmentation techniques using UAV-carried infrared imaging. The study introduced a novel segmentation method that incorporates both global and local image information to address the common challenges of image inhomogeneity in infrared images, which often impedes accurate segmentation. This method significantly improves segmentation accuracy and speed by utilizing a detail map for the edge stopping function and applying a variable threshold based on local statistics as the initial contour for the level-set method. The approach was demonstrated to be more efficient than traditional methods, achieving high segmentation accuracy while also correcting for bias in the image, thus ensuring precise defect localization in wind turbine maintenance applications.
Li et al. [26] presented a comprehensive study on utilizing solar radiation as a passive excitation source for WTB IRT NDT. By leveraging natural solar conditions, the research explored the detectability of subsurface defects like delaminations in turbine blades, employing numerical simulations and experimental validations. The findings suggested that the time of day significantly affected the thermal visibility of defects due to the solar angle and intensity, providing critical insights into the optimal conditions for conducting thermal inspections. This method represents a cost-effective alternative to active heating techniques, potentially enhancing routine maintenance strategies for wind turbines.
Zhou [27], who published in IEEE Transactions on Instrumentation and Measurement, explored a novel defect detection method for wind turbines using combined RGB and IRT. The study introduced a Regression Crop data-processing method and an adaptive feature fusion module that integrates RGB and IR data, significantly enhancing the detection accuracy and precision of actual defects in WTBs. The approach employs advanced deep learning techniques and was tested using a dataset of wind turbine images, showing an increase in detection precision to 99%. This method addresses the challenges of distinguishing between actual defects and false positives like dust or debris on the blades, presenting a substantial improvement over traditional methods.
Zheng et al. [28], who published in the IEEE Sensors Journal, introduced a novel method for detecting temperature anomalies in blower components using infrared video analysis. This method utilizes advanced segmentation algorithms and a hierarchical multiscene anomaly detection strategy to improve the accuracy and robustness of temperature anomaly detection. Key techniques include improved point rendering for better image segmentation, K-means++ clustering for initial data classification, and k-nearest neighbor analysis for finer anomaly detection. The approach is enhanced with dynamic time warping to handle different data lengths and sliding window techniques to estimate anomaly durations, offering significant improvements in industrial monitoring applications.
Jia et al. [29] proposed an advanced method, AQUADA-Seg, for segmenting WTBs using fused optical and thermal video data. This technique utilizes both modalities to provide comprehensive information about the blades, enhancing the segmentation process especially in complex background conditions that typically hinder accurate segmentation. By incorporating both modalities, the method significantly outperforms traditional single-modal approaches, achieving near real-time processing capabilities and high accuracy, thus facilitating more efficient and timely inspections of wind turbines while in operation.
Sheiati [30] described a novel deep learning method for segmenting fatigue damage in WTBs using passive IRT. This method efficiently segments the blade from complex dynamic backgrounds in thermal images, ensuring accurate damage detection under operational conditions. The proposed approach utilizes a two-step process, starting with an innovative background segmentation using pre-trained deep learning models, followed by damage segmentation that isolates and analyzes fatigue damage. This technique significantly improves the accuracy and efficiency of thermal imaging analysis for structural health monitoring in wind turbines, achieving impressive recall and precision rates in both background and damage segmentation tasks.
While some valuable thermal imaging datasets exist for WTB inspection, such as those presented by Duan et al. [31] and Aminzadeh et al. [32], there remains a need for more comprehensive, high-quality datasets that specifically address the challenges of small-scale wind turbines and early-stage defect detection. Our work complements existing datasets by focusing on minute defects and their thermal signatures in small-scale turbines, contributing to the development of more precise, automated defect detection systems capable of early-stage damage identification, which is crucial for proactive maintenance.

1.2. Object Detection and Localization

Object detection and localization have been significantly improved by the advent of CNNs, making it possible to identify and locate objects within images with high precision. The demand for real-time object detection has grown with applications in autonomous driving and surveillance. Methods like CNNs have evolved to meet real-time requirements by reducing computational overhead and increasing processing speed. The YOLO (You Only Look Once) series has significantly influenced the domain of object detection, integrating rapid processing speeds with the precision required for real-time applications. This evolution began in 2016 with YOLOv1, developed by Joseph Redmon et al. [14], and has since seen several iterations, each building on the last in terms of detection accuracy, processing speed, and adaptability across various objects and scenarios. The successive versions have continually addressed specific challenges in object detection, leading to advancements in feature extraction, bounding box predictions, class predictions, and overall algorithmic and architectural enhancements.
YOLOv1, introduced by Redmon et al. in 2016 [14], revolutionized object detection by treating it as a single regression problem, directly converting image pixels to bounding box coordinates and class probabilities. This approach eliminated the need for separate region proposal generation, significantly boosting processing speed and enabling real-time performance.
YOLOv2, or YOLO9000, introduced by Redmon et al. in 2017 [33], enhanced the original YOLOv1 by integrating batch normalization, utilizing high-resolution classifiers from the start of training, and adopting a new convolutional architecture. These improvements not only retained the high speed of the original but also increased the accuracy of the detections.
YOLOv3, detailed by Redmon et al. in 2018 [34], advanced its predecessors by incorporating multi-scale predictions and leveraging a deeper feature extractor network, known as Darknet-53 [34]. This version improved detection capabilities across various object sizes, further balancing speed and accuracy enhancements.
YOLOv4, developed by Bochkovskiy et al. in 2020 [35], incorporated additional features such as Weighted-Residual-Connections (WRC) [36], Cross-Stage-Partial connections (CSP) [37], and Cross Mini-Batch Normalization (CmBN) [38]. These features significantly improved the model’s robustness and generalization over different datasets and conditions, making it more effective in diverse scenarios.
YOLOv5, Developed and released by Ultralytics in 2020 [39], a technology company known for its contributions to machine learning and computer vision. Ultralytics’ release of YOLOv5 represents an unofficial continuation of the YOLO project, which they have enhanced with proprietary modifications and improvements. This version introduces adaptive anchor box calculations, employs a new compound scaling method [40], and extensively uses data augmentations. YOLOv5’s architecture is designed to be flexible, offering various model sizes that balance computational demands with detection performance, making it highly adaptable for different applications. The release by Ultralytics has been widely adopted in the community due to its performance improvements and ease of use, setting a new benchmark for real-time object detection systems.
YOLOv6, presented by Li et al. in 2023 [41], aimed at refining the architecture and training methods of YOLO, focusing on optimizing the network structure to enhance performance in real-time applications. It features advanced training techniques and structural optimizations that further improve the speed-accuracy trade-off.
YOLOv7, developed by Peng et al. in 2023 [42], introduces improvements in feature extraction and fusion techniques, which significantly enhance detection precision, particularly in complex and challenging environments [43].
In this study, we focus on the latest and most advanced versions of the YOLO architecture, YOLOv8 and YOLOv9, which offer significant improvements in detection accuracy and computational efficiency specifically relevant to our application.
YOLOv8 [42] emphasizes improving detection across various object sizes, especially small objects. It employs a novel network structure and methods to maintain contextual feature information, which boosts detection accuracy.
YOLOv9 was proposed by Wang et al. in Feb 2024 [44] and implemented by Ultralytics in April 2024 [45], innovated with architectural features such as Programmable Gradient Information (PGI) and a Generalized Efficient Layer Aggregation Network (GELAN), aiming to preserve semantic information more effectively and improve computational efficiency.
In Table 1, we present a summary and comparison of different YOLO object detection model iterations, highlighting their main features, advantages, and limitations. The table demonstrates that the latest models, YOLOv8 and YOLOv9, significantly enhance detection accuracy, processing speed, and performance in complex environments. These improvements make them especially well suited for real-time applications like defect detection in wind turbine blades. Therefore, we employed these latest YOLO models in our research, leveraging their superior performance to achieve more accurate and efficient defect localization in thermal images. The use of YOLOv8 and YOLOv9 in our study underscores our commitment to utilizing cutting-edge technology to enhance wind turbine maintenance processes. Section 3 provides an in-depth look at the implementation, training (with our dataset), optimization, analysis, and comparison of these two models.

1.3. Contributions

Addressing these gaps, our research makes several critical contributions to the field. The creation of a new thermal dataset: we developed a bespoke thermal dataset that captures a wide range of small, critical defects specific to WTBs, greatly enhancing defect detectability and analysis accuracy. Advancement in defect localization: our work extended beyond simple defect identification to sophisticated localization, utilizing state-of-the-art object detection models for more detailed and actionable insights. Drone-compatible camera testing: initially testing our thermal camera in a handheld setup, we ensured its capability to produce high-quality images, a prerequisite for the future deployment on drones for comprehensive blade inspections. Comparative analysis of advanced object detection models: we provide an analytical comparison of the latest YOLO models, assessing their strengths and adaptability to the nuanced requirements of thermal imaging for wind turbine inspection.
The novelty of this research lies in its targeted approach to dataset creation and the application of advanced deep learning techniques tailored for wind turbine maintenance. This approach not only fills a significant void in current maintenance practices but also sets a benchmark for future technological advancements in the sector. The importance of this work is underscored by its potential to significantly reduce maintenance costs, enhance turbine safety and longevity, and support the broader adoption of wind energy globally.

1.4. Research Roadmap

Building on the foundational work presented in this paper, future research is expected to progress through several distinct phases to further develop and apply the techniques introduced. The first phase may involve expanding the dataset to include thermal images from large, operational wind turbines under various environmental conditions, allowing for more comprehensive training and testing of object detection models. The second phase could focus on integrating these models with drone-mounted thermal cameras, enabling automated, real-time defect detection in operational environments. Finally, the third phase should involve rigorous field testing to validate the effectiveness and reliability of the proposed system in real-world applications. These phases are anticipated to lead to the development of an advanced, scalable maintenance strategy applicable across the renewable energy sector.

2. Methodology

This study outlines our methodical approach, which used advanced thermal imaging cameras and analytical models to inspect wind turbines. We detail the deployment of the FLIR FLIR (Forward Looking InfraRed) Vue TZ20 camera, capable of capturing high-resolution images to detect defects in turbine blades. Our methodology aimed to bridge theoretical research and practical application, providing a framework for robust and adaptable inspections. This introduction sets the stage for a deeper discussion of the specific equipment and procedures used in our research.

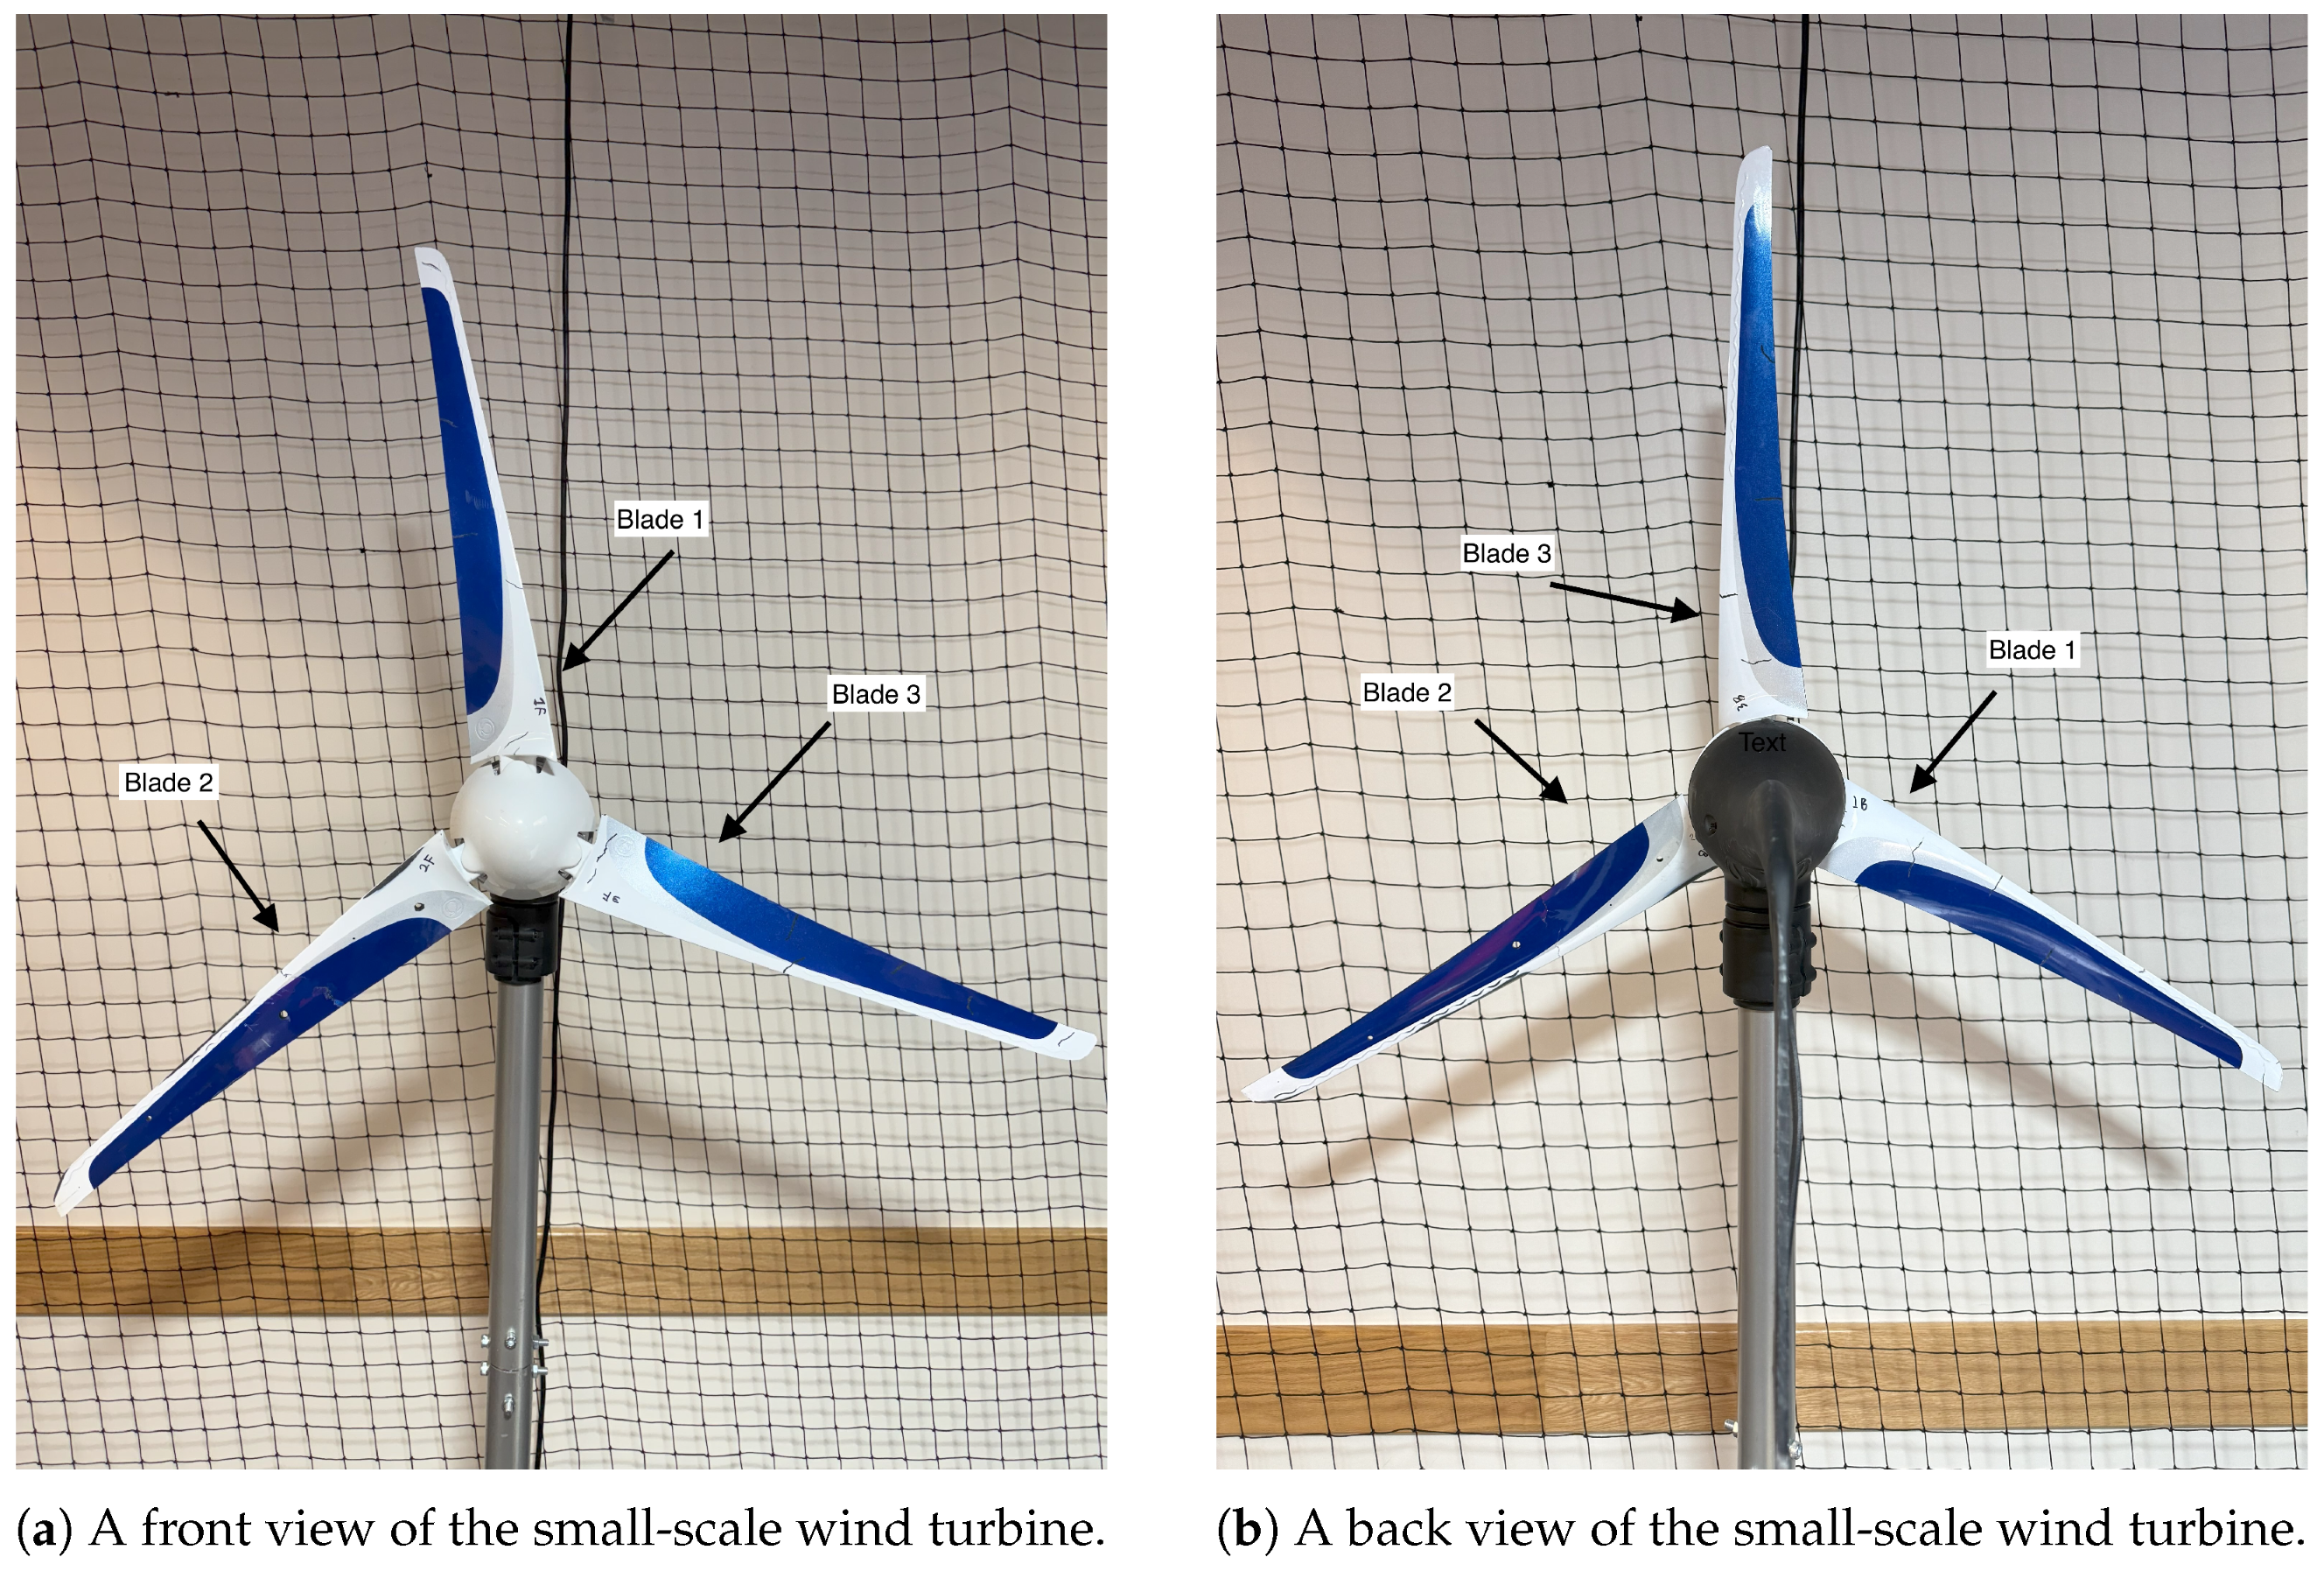
2.1. The Studied Wind Turbine Specification

For our experiments, we used the Primus Air Max, a small-scale wind turbine frequently employed in maritime settings. This turbine is capable of generating approximately 30 kWh per month under average wind speeds of 5.5 m / s . It features a swept area of 1.07 m 2 , a rotor diameter of 1.17 m , and a weight of 5.9 kg . The construction of the turbine includes a cast aluminum body with corrosion-resistant paint and three carbon fiber blades. In addition, it is equipped with a microprocessor-based control system, a brushless alternator, and electronic torque control, designed to withstand wind speeds of up to 40.2 m / s .
To simulate typical operational damage, intentional defects, such as cracks, holes, and erosions, were artificially created on the blades. These defects mimicked the real-world damage observed in wind turbine blades (WTBs), enhancing the relevance of our study for practical applications.
Figure 1 shows the Primus Air Max turbine, highlighting the overall configuration and the positioning of its three carbon fiber blades, including visible defects.
Figure 2a–c display different perspectives of the front blades. These images are particularly valuable for examining the blade profiles and their surface condition, highlighting the artificially created defects for detailed assessment. Similarly, Figure 2d–f show the back sides of the blades. These images help in assessing the wear and the specific artificially induced damage that could affect the performance of the turbine over time.
These detailed views of each blade are crucial for assessing the structural integrity and surface conditions of the blades, with particular focus on the artificially induced damages to simulate real-world scenarios.

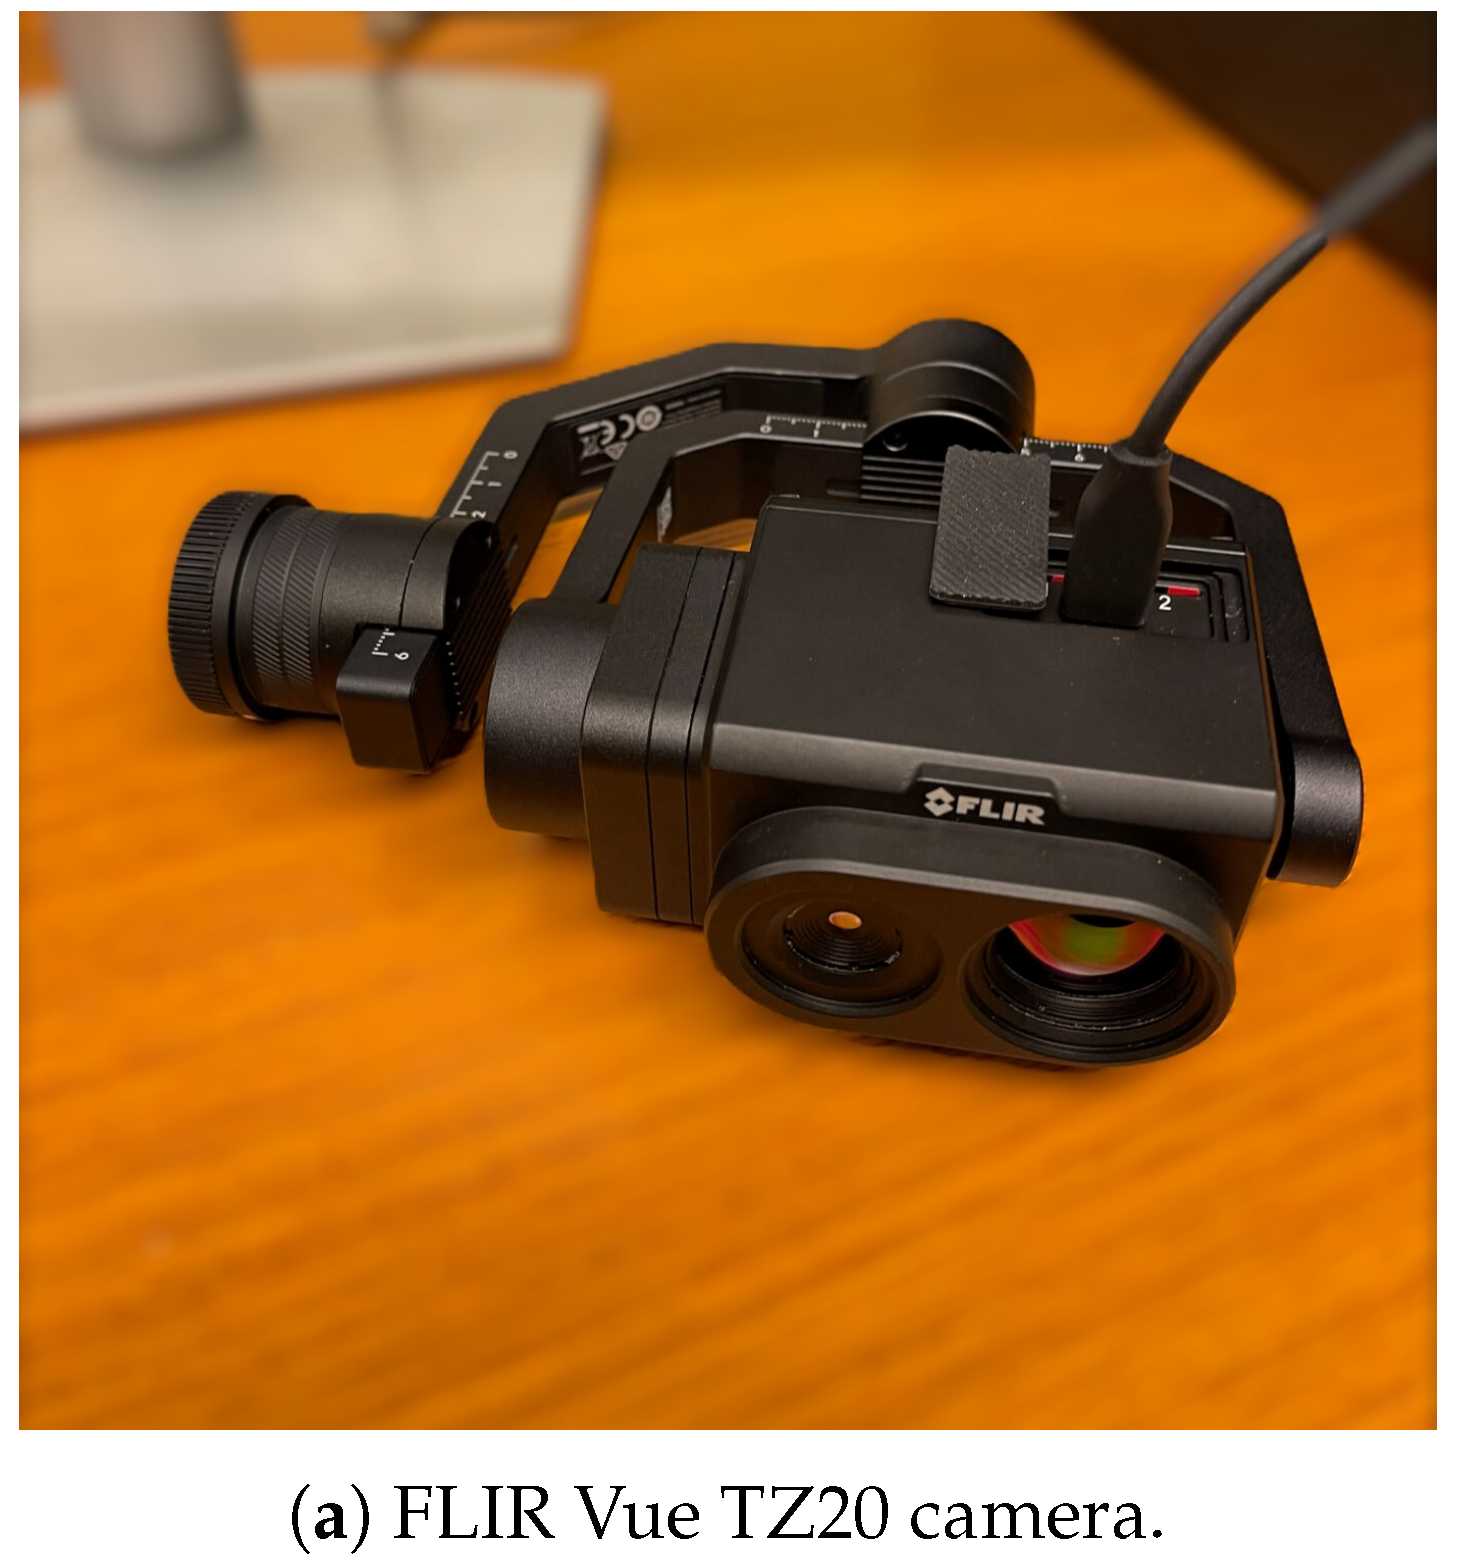
2.2. Camera Deployment and Imaging Setup

This research utilized the FLIR Vue TZ20 camera, shown in Figure 3 specifically engineered for drone operations. The camera features a spectral range of 7.5–13.5 μ m and thermal sensitivity (NETD) < 50 mK at f/1.0. It features a dual thermal camera system with a 20× digital thermal zoom, allowing for both wide and focused field-of-view options. This versatility is crucial for capturing detailed thermal data across various inspection scenarios, from public safety to industrial inspection. The camera operated in conjunction with FLIR Boson GUI 3.0 on a Windows platform, designed to enhance the development and deployment of thermal imaging solutions. The suite offers a user-friendly interface for the efficient management and processing of thermal images. The camera was connected to the drone using the gimbal depicted in Figure 3b, which ensured stable mounting and precise control during flight. The interface and connection setup are illustrated in Figure 3c. For further technical details, the FLIR website provides extensive information on the Vue TZ20-R’s specifications and integration capabilities with DJI Matrice M200 v2- and M300-series drones via the Skyport V2.0 gimbal. The deployment of this camera in our project focused on capturing high-quality thermal images that revealed minute defects in the WTBs, a task compounded by the complexities of outdoor environmental conditions.
Limitations and Biases: Despite the advanced capabilities of the FLIR Vue TZ20 camera, several limitations and potential biases were identified during its deployment. The precision of defect detection was highly dependent on environmental conditions, such as temperature fluctuations and varying sunlight levels, which could introduce biases in the thermal data captured. Furthermore, the current setup’s dependence on manual camera operation may have impacted the repeatability and consistency of the results. This underscores the necessity for drone integration in future phases to enhance data capture accuracy and reliability.
Practical Implementation of Drone Deployment: Future practical approaches to drone deployment are expected to involve addressing several technical challenges such as ensuring the stability of the drone platform during flight, particularly in adverse weather conditions. Additionally, the integration of a thermal camera with the drone’s navigation and control systems will require careful calibration to maintain image quality while in motion. Future drone deployments should focus on automating the inspection process, minimizing manual intervention, and allowing for real-time analysis of wind turbine blade conditions.
Temperature and Sunlight Effects: Temperature and direct sunlight significantly affect the quality of defect detection in thermal imaging. Our study, conducted during midday at noon in Utah, benefited from intense sunlight, which significantly improved the clarity of the thermal images. The high ambient temperature and direct sunlight increased the visibility of defects. The increased thermal contrast between defective and non-defective areas made defects more visible and detection more accurate. These findings indicate that conducting inspections under similar environmental conditions can enhance thermal camera performance. However, the effectiveness of this approach may vary under different weather conditions, requiring careful consideration in scheduling and executing inspections.

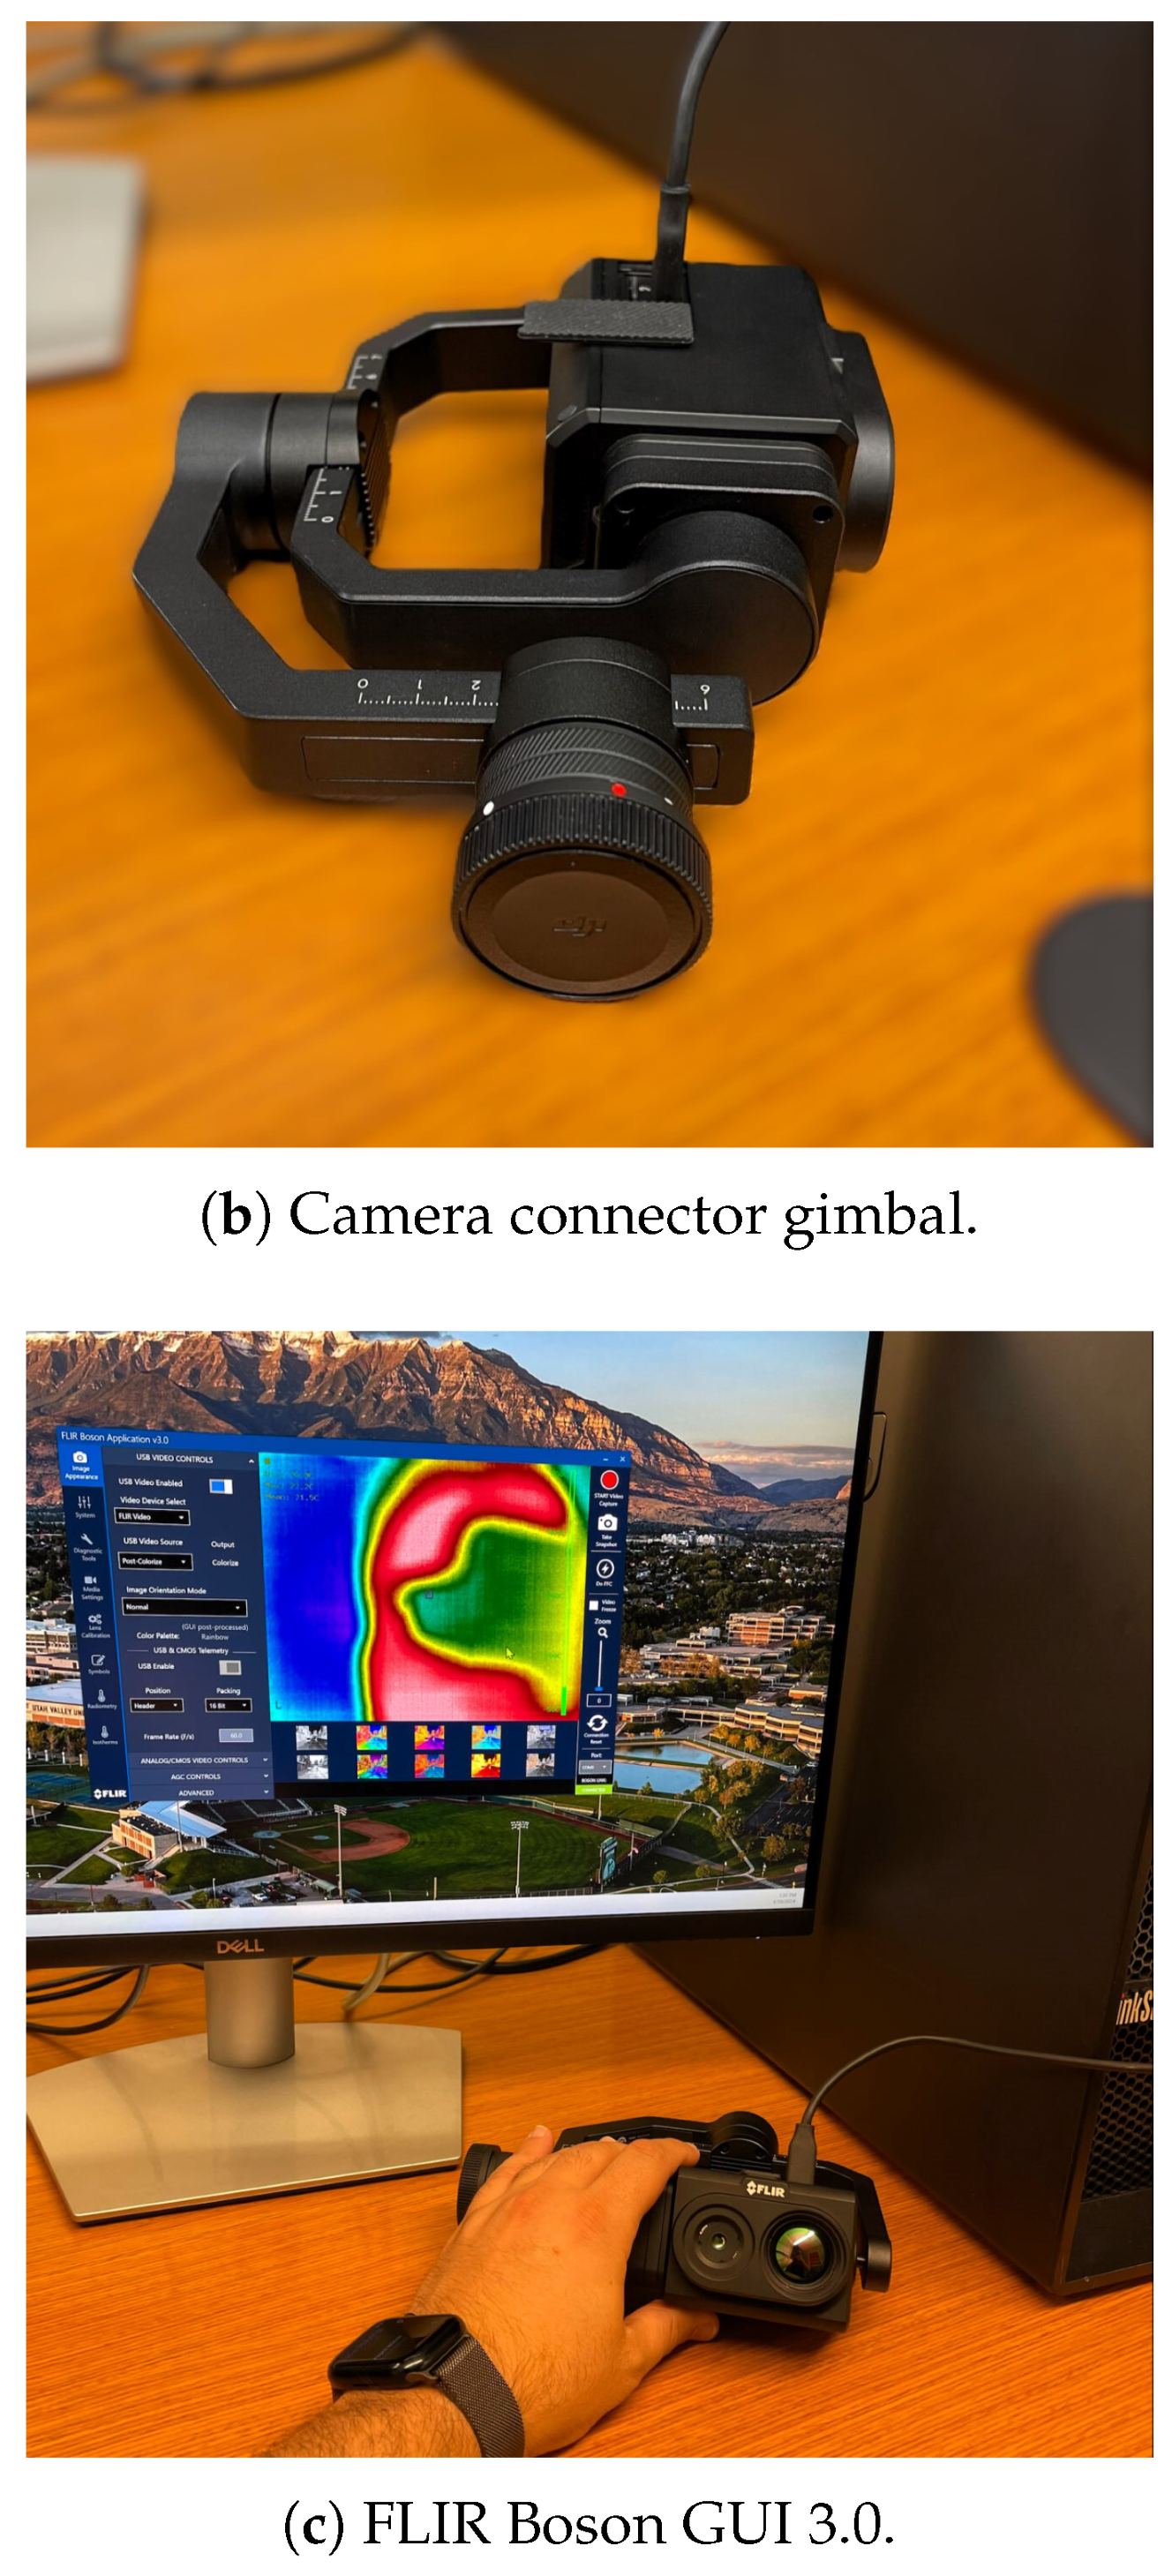
2.3. Dataset Creation Setup

Creating the dataset for WTB inspection presented numerous challenges, particularly in capturing thermal images that accurately reflected small defects. The imaging setup involved connecting the FLIR Vue TZ20 camera to a laptop, a necessary configuration that, while restrictive, was vital for initial data capture phases. Our experiments spanned both laboratory and field settings to emulate the operational environment of wind turbines as closely as possible. However, drone deployment in the future could potentially mitigate some of the current limitations by offering more flexible and comprehensive data capture capabilities.
Dataset Construction and Differentiation: The specialized dataset constructed in this study differs from existing datasets by focusing specifically on small-scale wind turbines and capturing high-resolution thermal images that emphasize minute defects. Unlike other datasets, which may use generic or low-resolution images, our dataset was tailored to reflect the specific conditions and defect types encountered in wind turbine blades. This focus on high fidelity and relevance to real-world conditions enhances the applicability of our models to operational wind turbines.
Operational Feasibility: The method developed in this study can be implemented with operational wind turbines without the need for the turbines to be stopped. This capability makes it suitable for online monitoring, where the inspection can be conducted periodically without interrupting the turbine’s operation. However, the effectiveness of the inspection during operation may be influenced by the turbine’s rotational speed and the resulting motion blur, which must be accounted for in future model training and calibration.

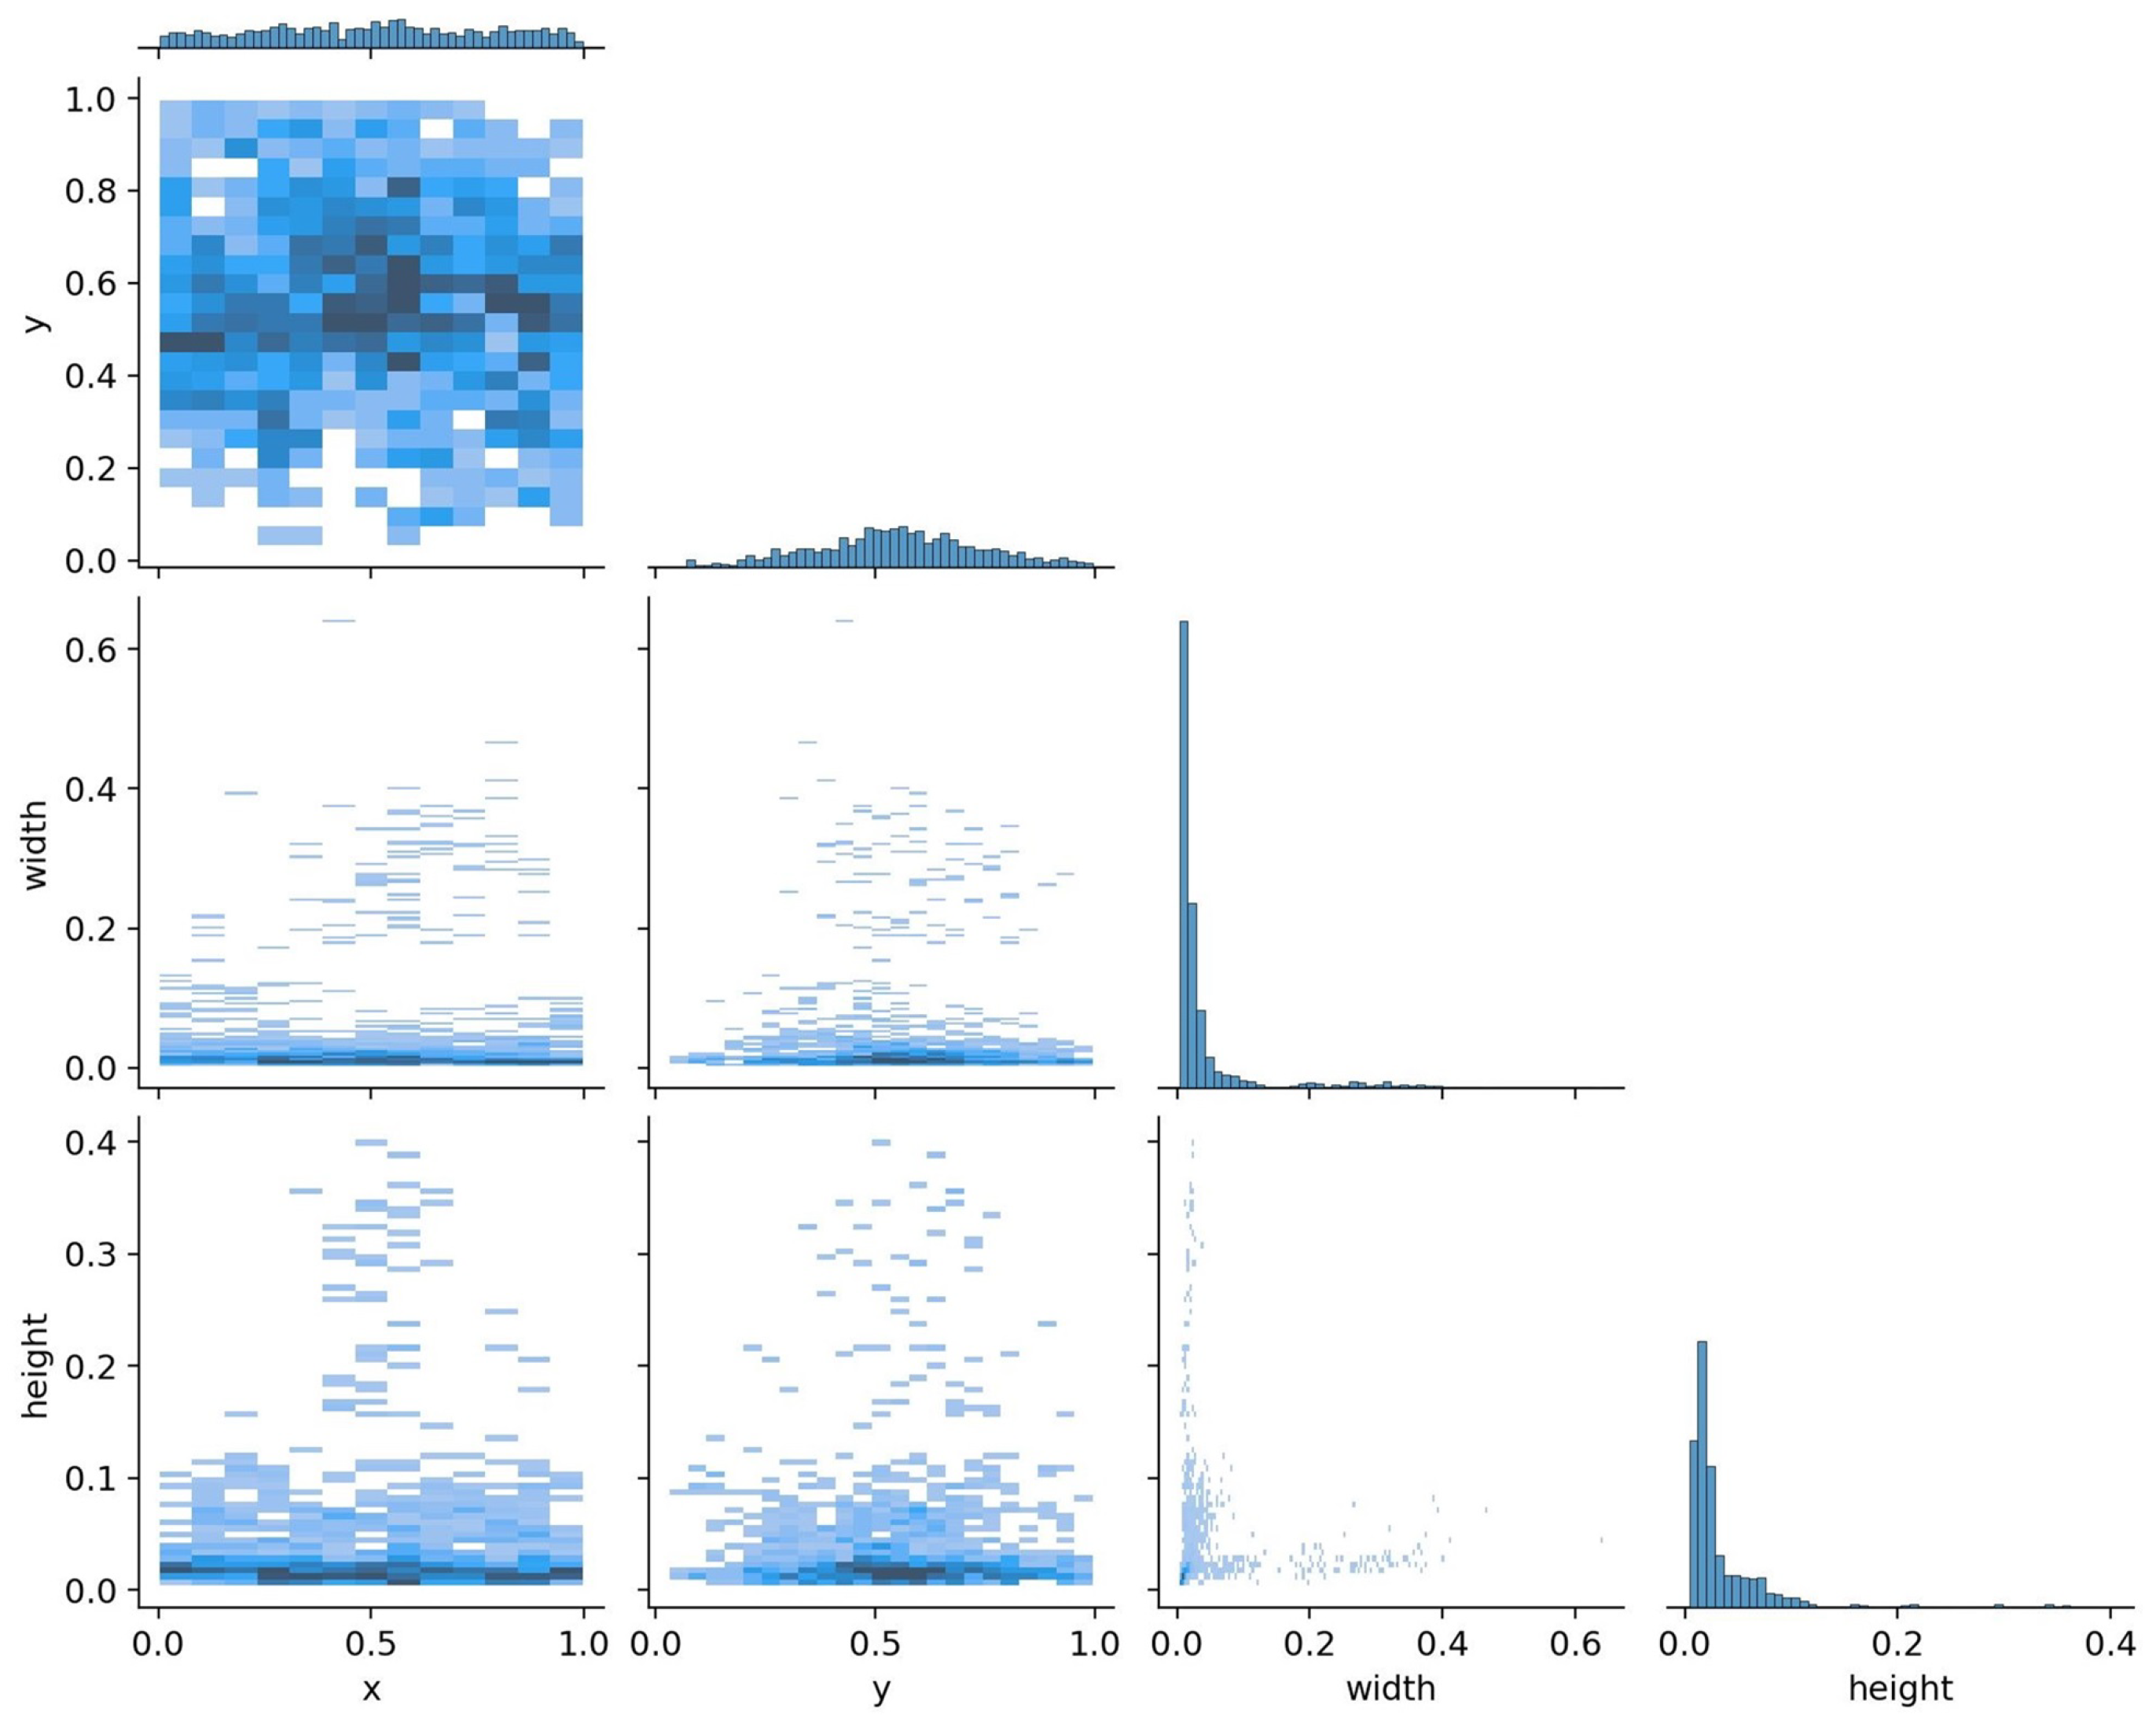
2.4. Dataset Structure
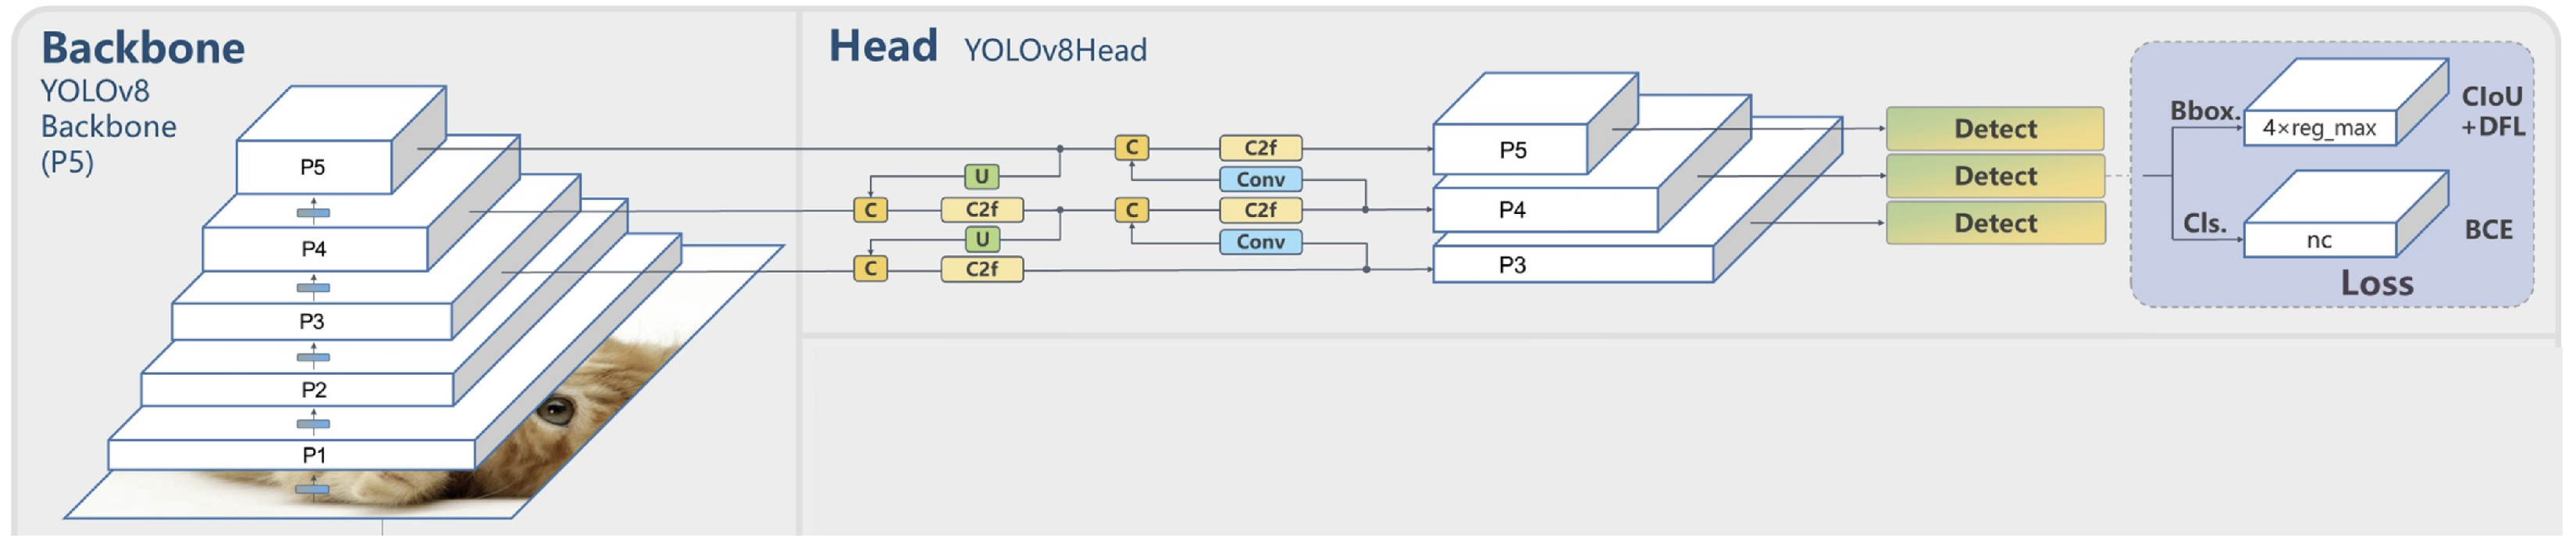
The dataset was structured into directories based on the component condition and the imaging technique used. It included an Indoor Directory with 1200 thermal images, equally divided between faulty and healthy conditions, and an Outdoor Directory that mirrored the Indoor Directory with another 1200 images, also equally divided between faulty and healthy conditions. Additionally, the dataset featured 6 high-resolution RGB images, offering extra visual context for the inspections, with an equal number of faulty and healthy images.
The comparative analysis between laboratory and field images underscored the superior accuracy of data captured under outdoor conditions, closely aligning with our operational objectives. This led to a strategic focus on enhancing the dataset with images that accurately represent the diverse and challenging conditions faced by wind turbines.
The annotated thermal images depicted below serve as a visual representation of the defects encountered. These images underscore the model’s ability to recognize and demarcate defects across diverse conditions and blade positions.
Figure 4 demonstrates the defects, including cracks, holes, and erosion, annotated in the thermal images of the WTBs. These annotations are essential for training machine learning models to detect and classify types of damage in similar real-world scenarios.

2.5. Models

In this section, we delve into the latest advancements within the YOLO series: YOLOv8 [42] and YOLOv9 [44]. These versions represent the zenith of the series’s development, introducing novel features and optimizations that redefine benchmarks for performance and efficiency in the realm of real-time object detection.
The decision to include both YOLOv8 and YOLOv9 in our analysis served multiple important purposes. First, while YOLOv9 is the newer version, YOLOv8 has been extensively validated in various industrial applications and serves as a robust baseline for performance comparison. Second, the inclusion of both models allowed us to quantitatively assess the specific improvements that YOLOv9’s architectural innovations (such as PGI and GELAN) bring to defect detection in thermal images. Third, from a practical implementation perspective, YOLOv8’s established stability and broader hardware compatibility make it a valuable alternative in scenarios where the additional computational requirements of YOLOv9 may not be justified by the marginal performance gains. This comparative approach provides valuable insights for practitioners in choosing the most appropriate model for their specific wind turbine maintenance needs.
YOLOv8 marks a significant leap forward in real-time object detection. The architecture of YOLOv8, shown in Figure 5, introduces several enhancements that bolster detection accuracy and operational efficiency. Notably, YOLOv8 excels in processing environments with complex object spatial configurations and varied aspect ratios. It achieves this through a sophisticated architecture that amalgamates the Feature Pyramid Network (FPN) and the Path Aggregation Network (PAN), facilitating the extraction of comprehensive, multi-scale feature representations.
A pivotal innovation in YOLOv8 is its strategic employment of transfer learning, which substantially augments its detection capabilities in specific real-world settings. This model initially undergoes training on a wide-ranging dataset and is then finely tuned on datasets that closely reflect targeted application environments. This approach ensures an exemplary balance between processing velocity and detection precision, essential for scenarios necessitating swift decision-making.
The YOLOv8 loss function, L ( θ ) , is a combination of several components, the box loss L box , the classification loss L cls , and the distribution focal loss L dfl , each normalized by the number of positive examples, N pos . And, it includes a regularization term with the weight decay ϕ :
L ( θ ) = λ box N pos L box ( θ ) + λ cls N pos L cls ( θ ) + λ dfl N pos L dfl ( θ ) + ϕ θ 2 2
Specifically, the box loss component is defined as
L box = x , y 1 c x , y ( 1 q x , y ) + || b x , y b ^ x , y || 2 ρ 2 + α x , y ν x , y
where we have the following:
  • b x , y and b ^ x , y represent the predicted and ground truth bounding box coordinates at the position ( x , y ) , respectively.
  • q x , y is the intersection over union (IoU) between the predicted and ground truth boxes.
  • α x , y is a dynamic weighting factor that adjusts the contribution of each spatial location.
  • ν x , y is a modulation factor that helps balance the learning of different sized objects.
  • ρ is a normalization parameter for the coordinate differences.
  • 1 c x , y is an indicator function that equals 1 when a defect is present at the position ( x , y ) .
YOLOv9 introduces a paradigmatic shift with its Programmable Gradient Information (PGI), shown in Figure 6, and the Generalized Efficient Layer Aggregation Network (GELAN), shown in Figure 7, targeting the pervasive challenge of information loss in deep neural networks. The PGI mechanism employs an auxiliary branch that preserves gradient information during backpropagation, ensuring that important features for defect detection are not lost during training. This is particularly crucial for thermal images where subtle temperature variations can indicate defects. The GELAN architecture optimizes the network’s computational efficiency while maintaining detection accuracy, making it suitable for real-time defect detection applications.
For YOLOv9, which employs the Programmable Gradient Information (PGI) approach, the exact mathematical formulation of the loss function is conceptually represented as
L PGI = Function ( L main , L aux , Gradients from PGI )
Here, L main and L aux represent losses from the main and auxiliary branches of the network, respectively. The loss dynamically integrates gradients managed by the PGI system to optimize the learning process, ensuring a minimal loss of information and maximizing the reliability of the gradient updates.

3. Results and Analysis

Following the detailed exposition of the methodology, which outlined the technical setup, camera deployment, and specifics of the wind turbine used in this study, we now transition into the Results and Analysis Section. This portion of the paper evaluates the effectiveness of the deployed technologies and methods in detecting and analyzing defects in WTBs.

3.1. Parameter Tuning and Optimization

While we utilized the established YOLO architecture as our foundation, our implementation involved significant customization and optimization for the specific challenges of wind turbine blade defect detection. Our approach included the following:
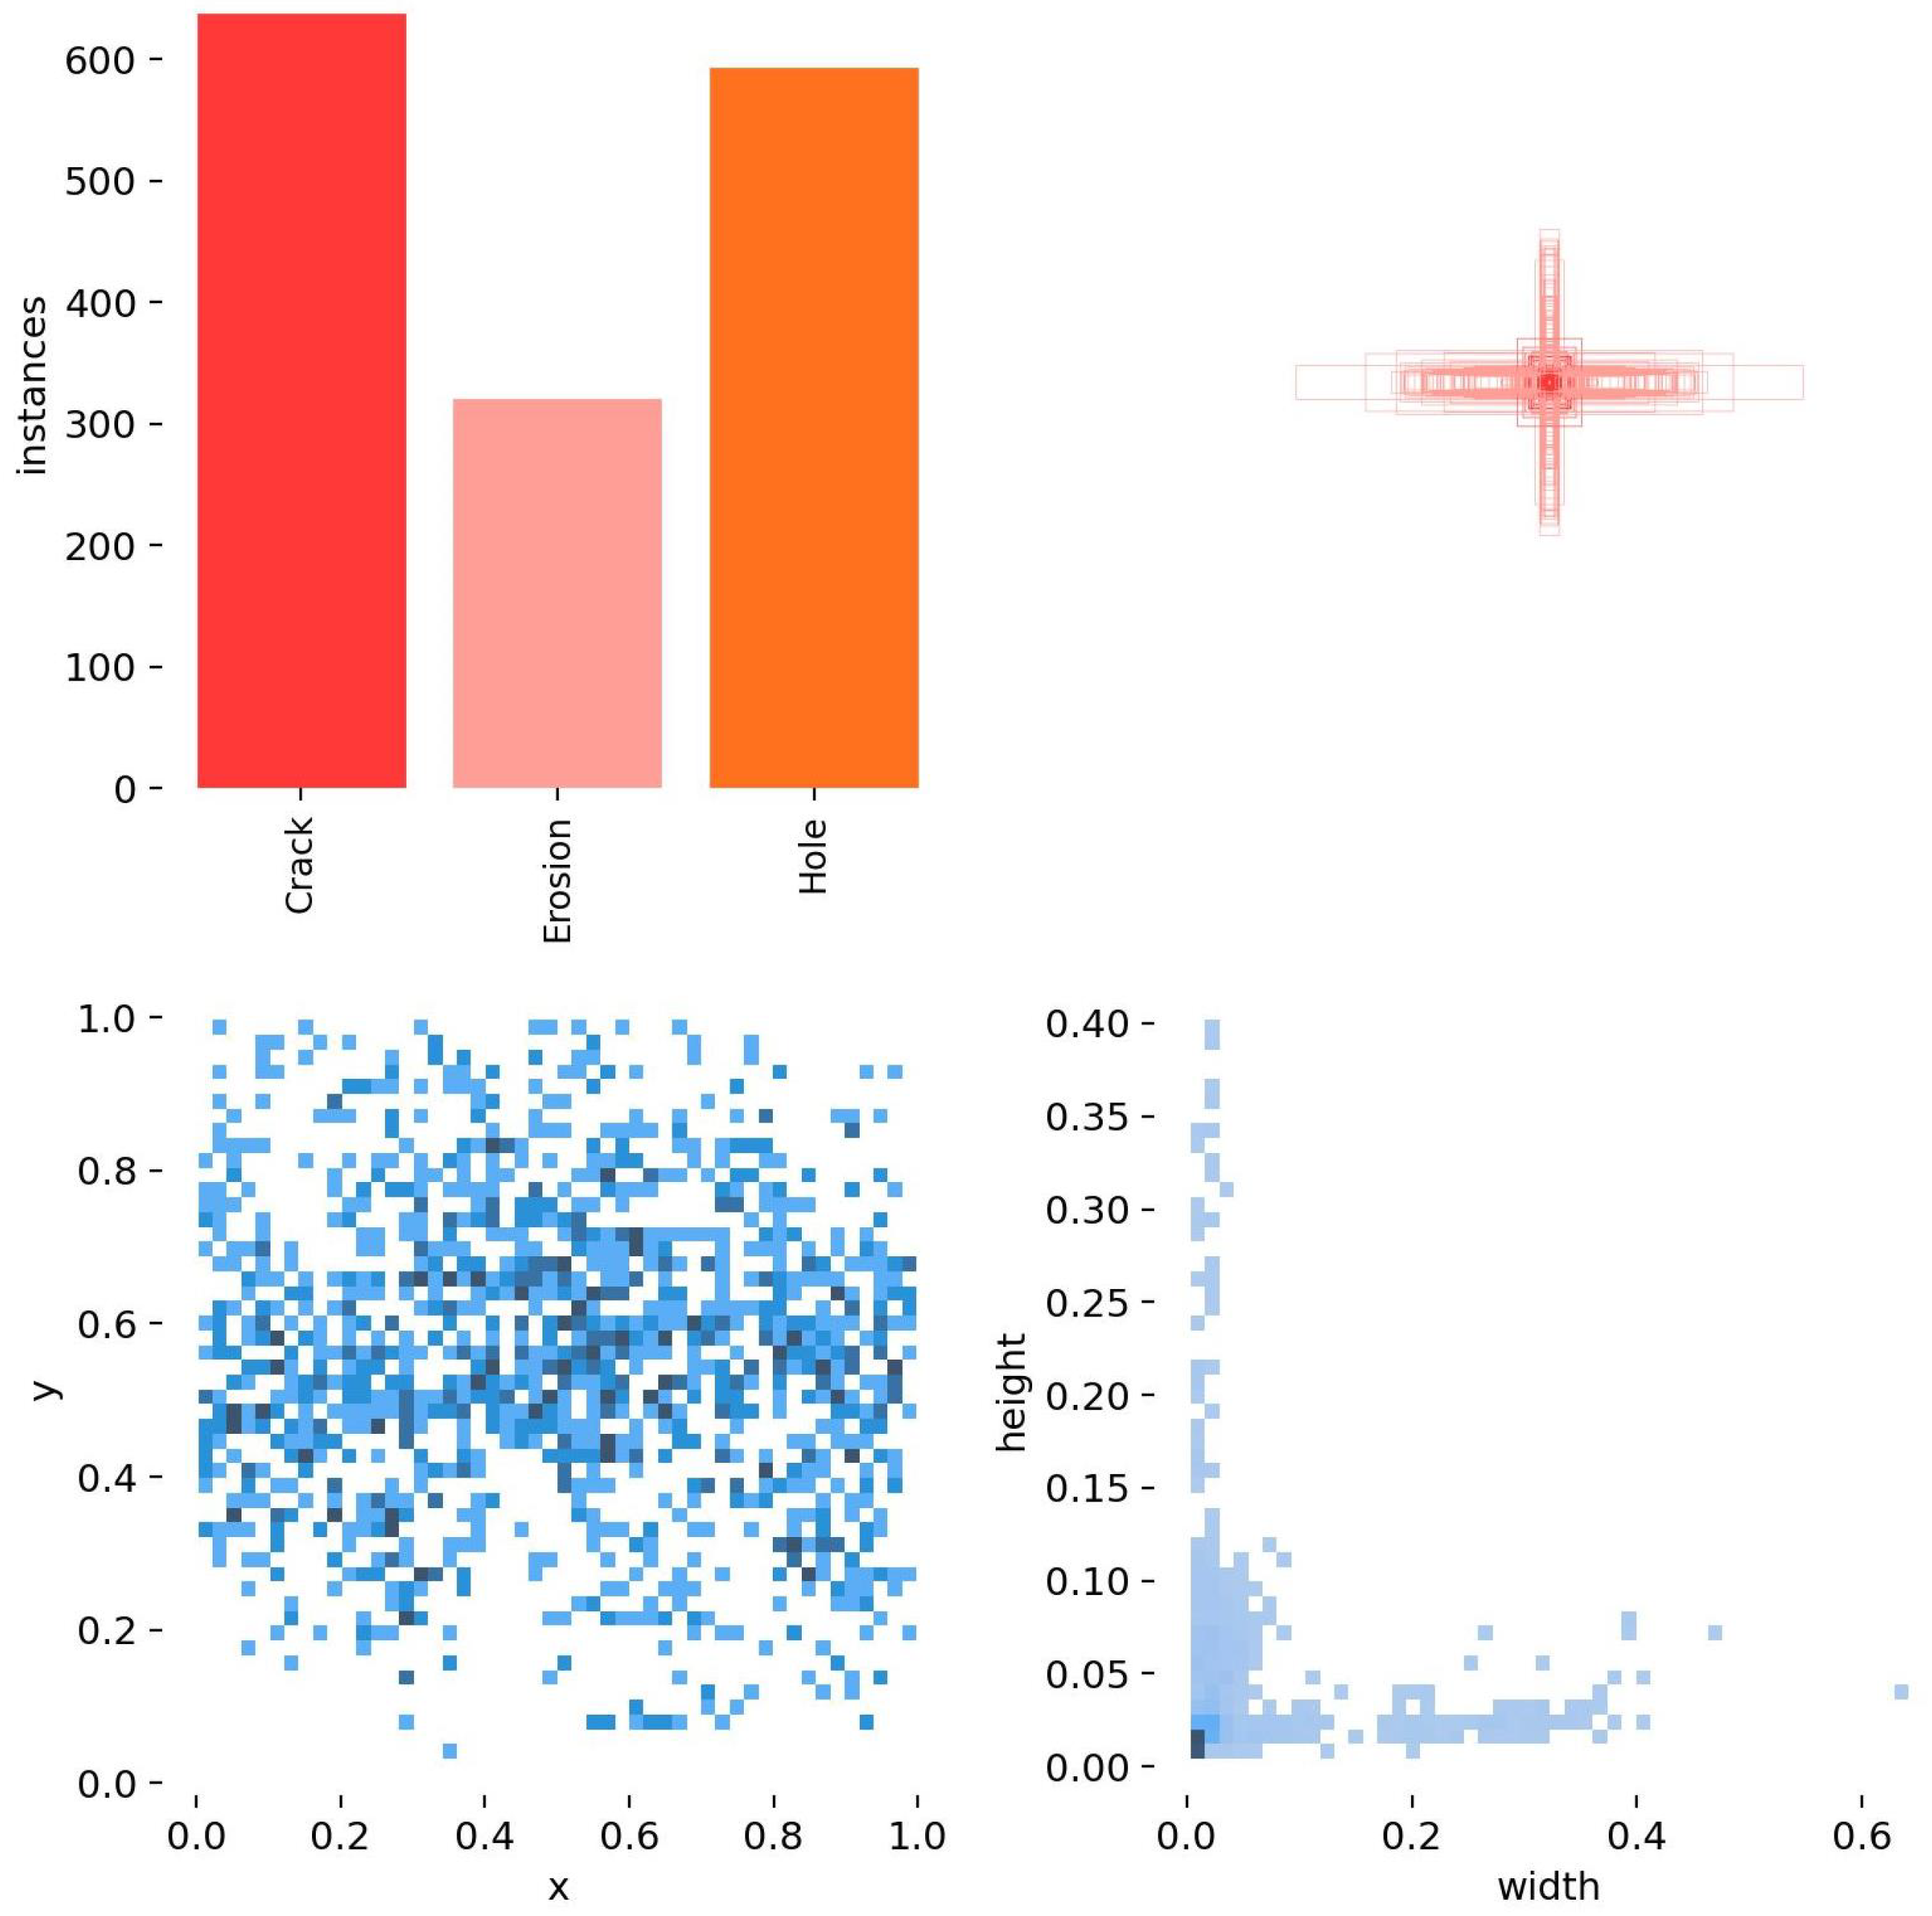
  • Custom Dataset Preparation and Annotation: We developed a specialized dataset comprising thermal images of wind turbine blade defects, meticulously annotated to capture various defect types and severities. This dataset ensured that the model was trained on relevant and high-quality data specific to the application domain.
  • Extensive Hyperparameter Optimization: Leveraging Bayesian optimization techniques, we systematically explored the hyperparameter space to identify the optimal configurations that enhanced model performance for our specific application. This included tuning parameters such as learning rates, batch sizes, and momentum coefficients.
  • Modified Loss Function Weights: The loss functions were adjusted to prioritize accurate localization of defects, ensuring that the model emphasized critical areas during training. By assigning higher weights to certain loss components, the model became more sensitive to the nuances of defect detection.
  • Specialized Data Augmentation Strategies: We implemented data augmentation methods tailored to the characteristics of thermal images, such as thermal noise addition, brightness variations, and geometric transformations. These strategies improved the model’s robustness and ability to generalize across different thermal imaging conditions.
  • Fine-Tuned Confidence Thresholds: Confidence thresholds were meticulously calibrated to balance precision and recall, optimizing the model’s defect detection accuracy in real-world scenarios. This calibration helped in reducing false positives and enhancing the reliability of detections.
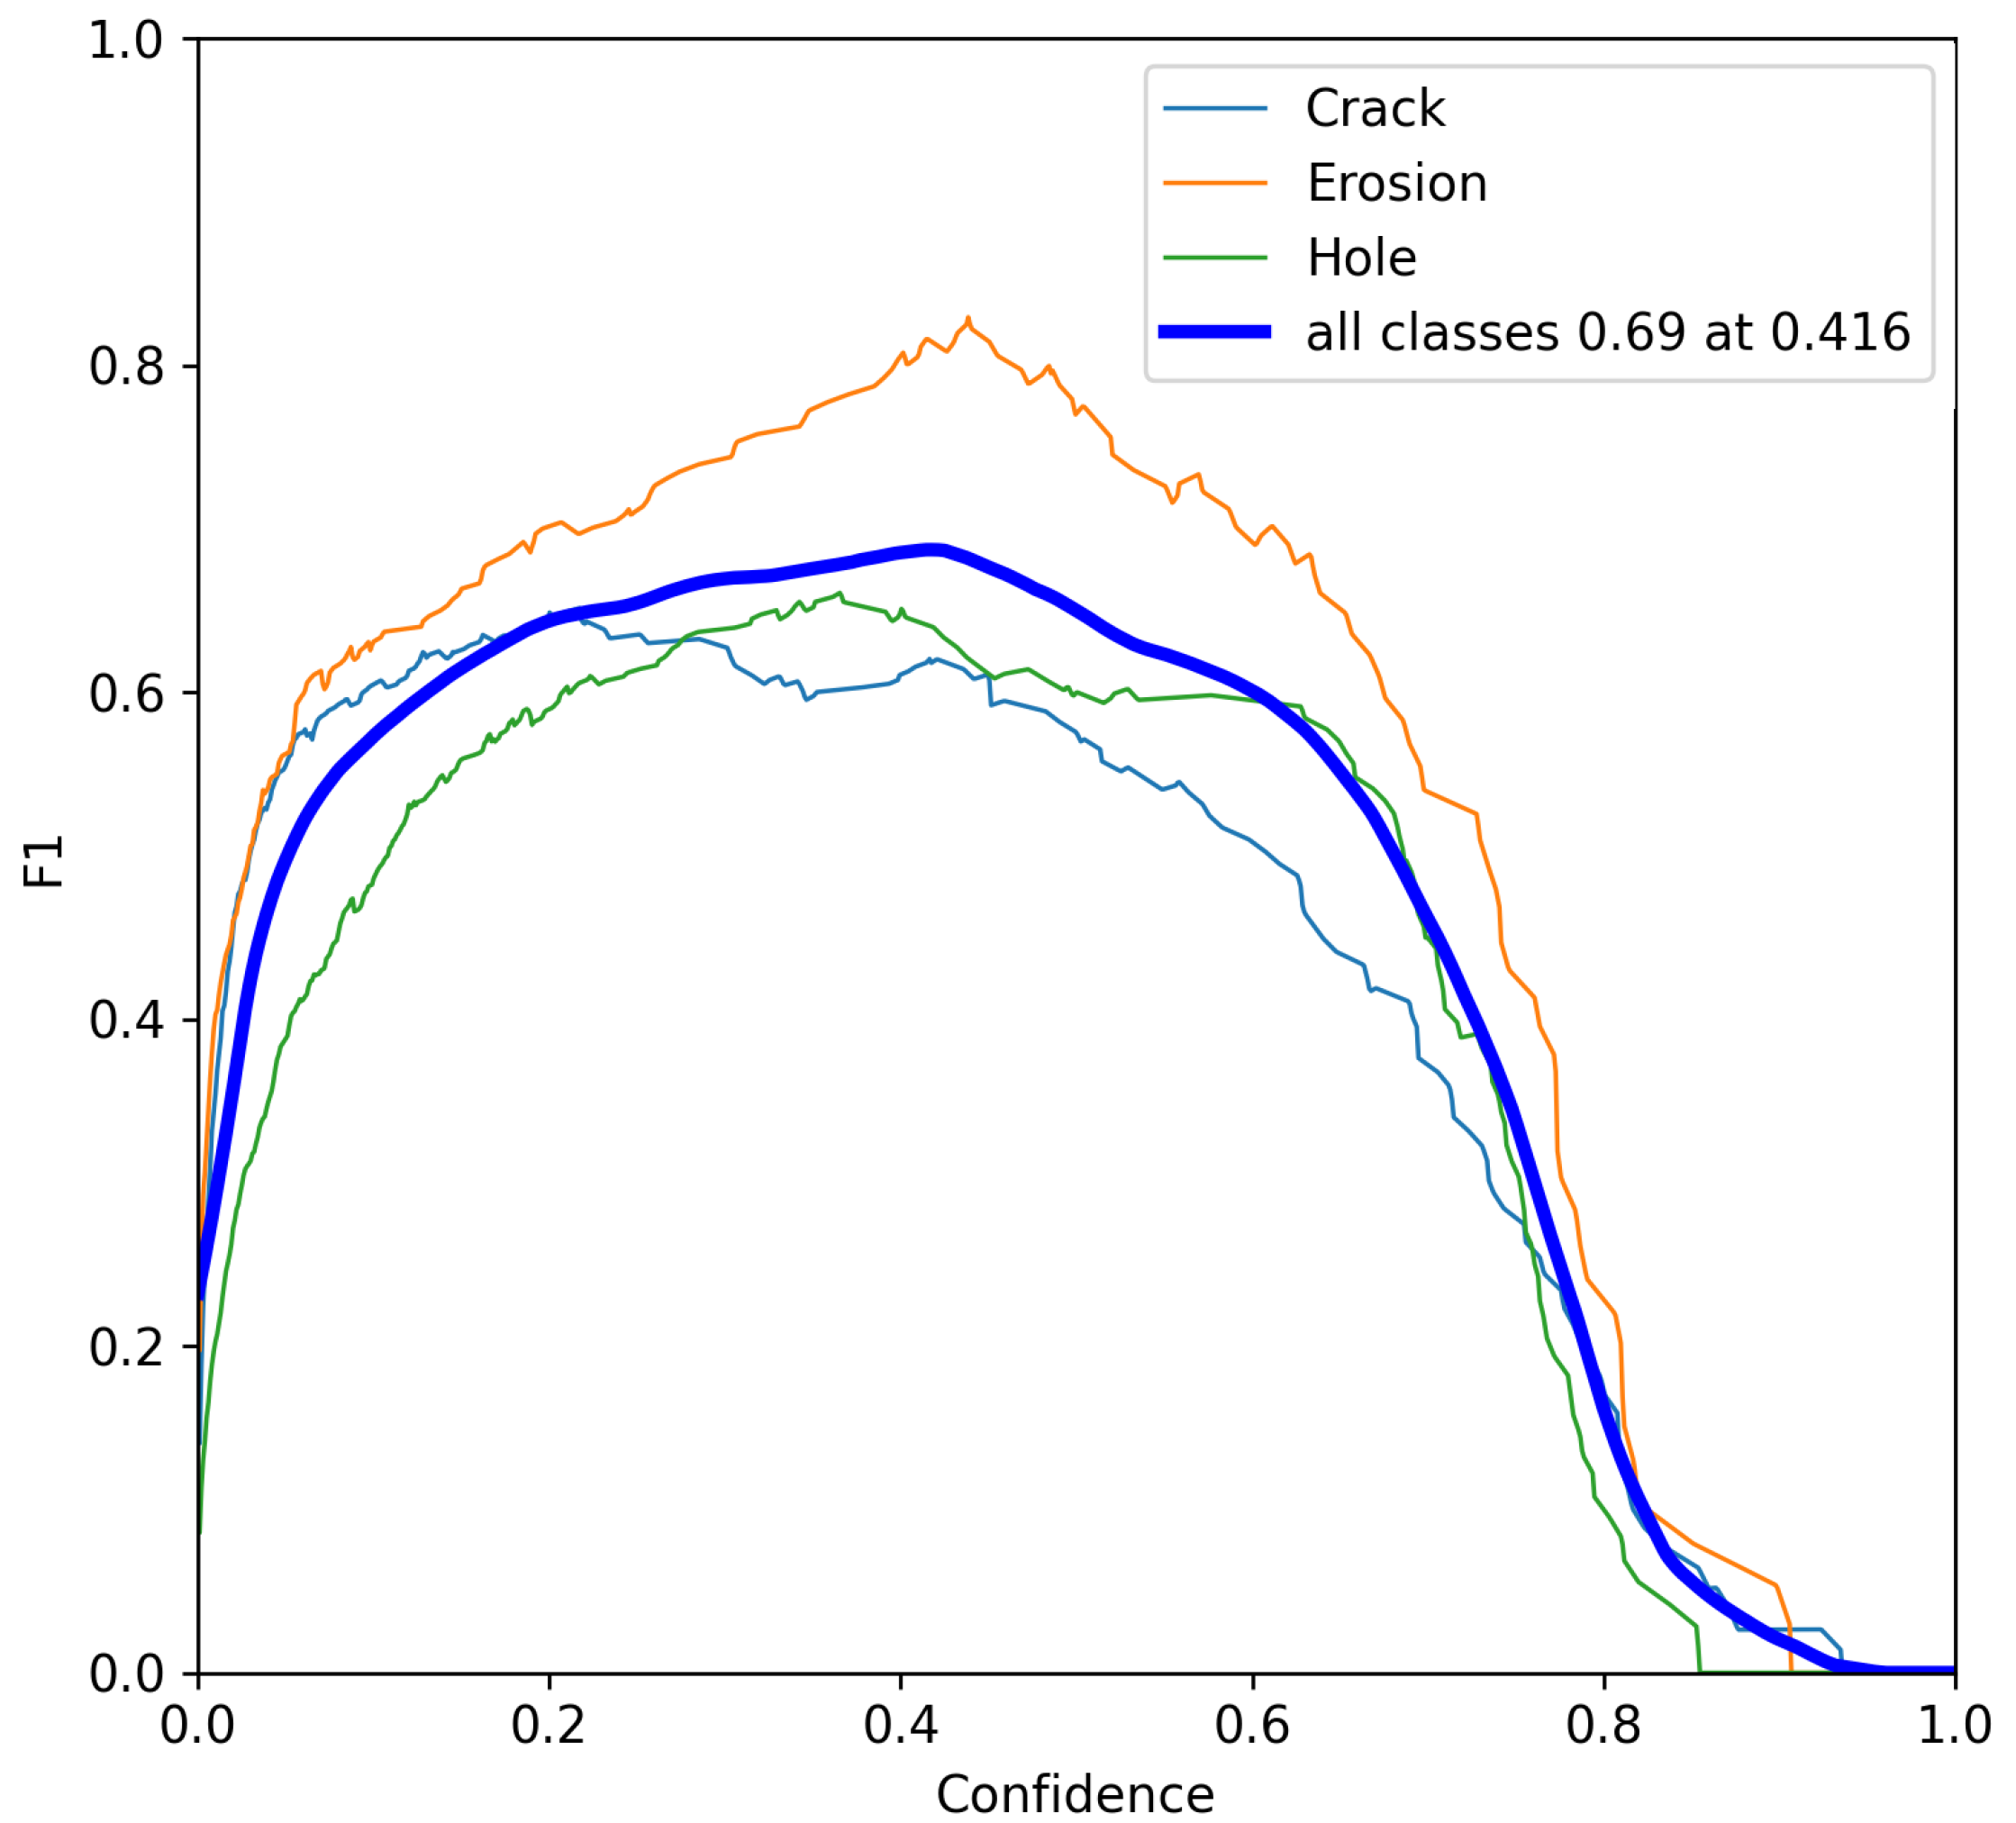
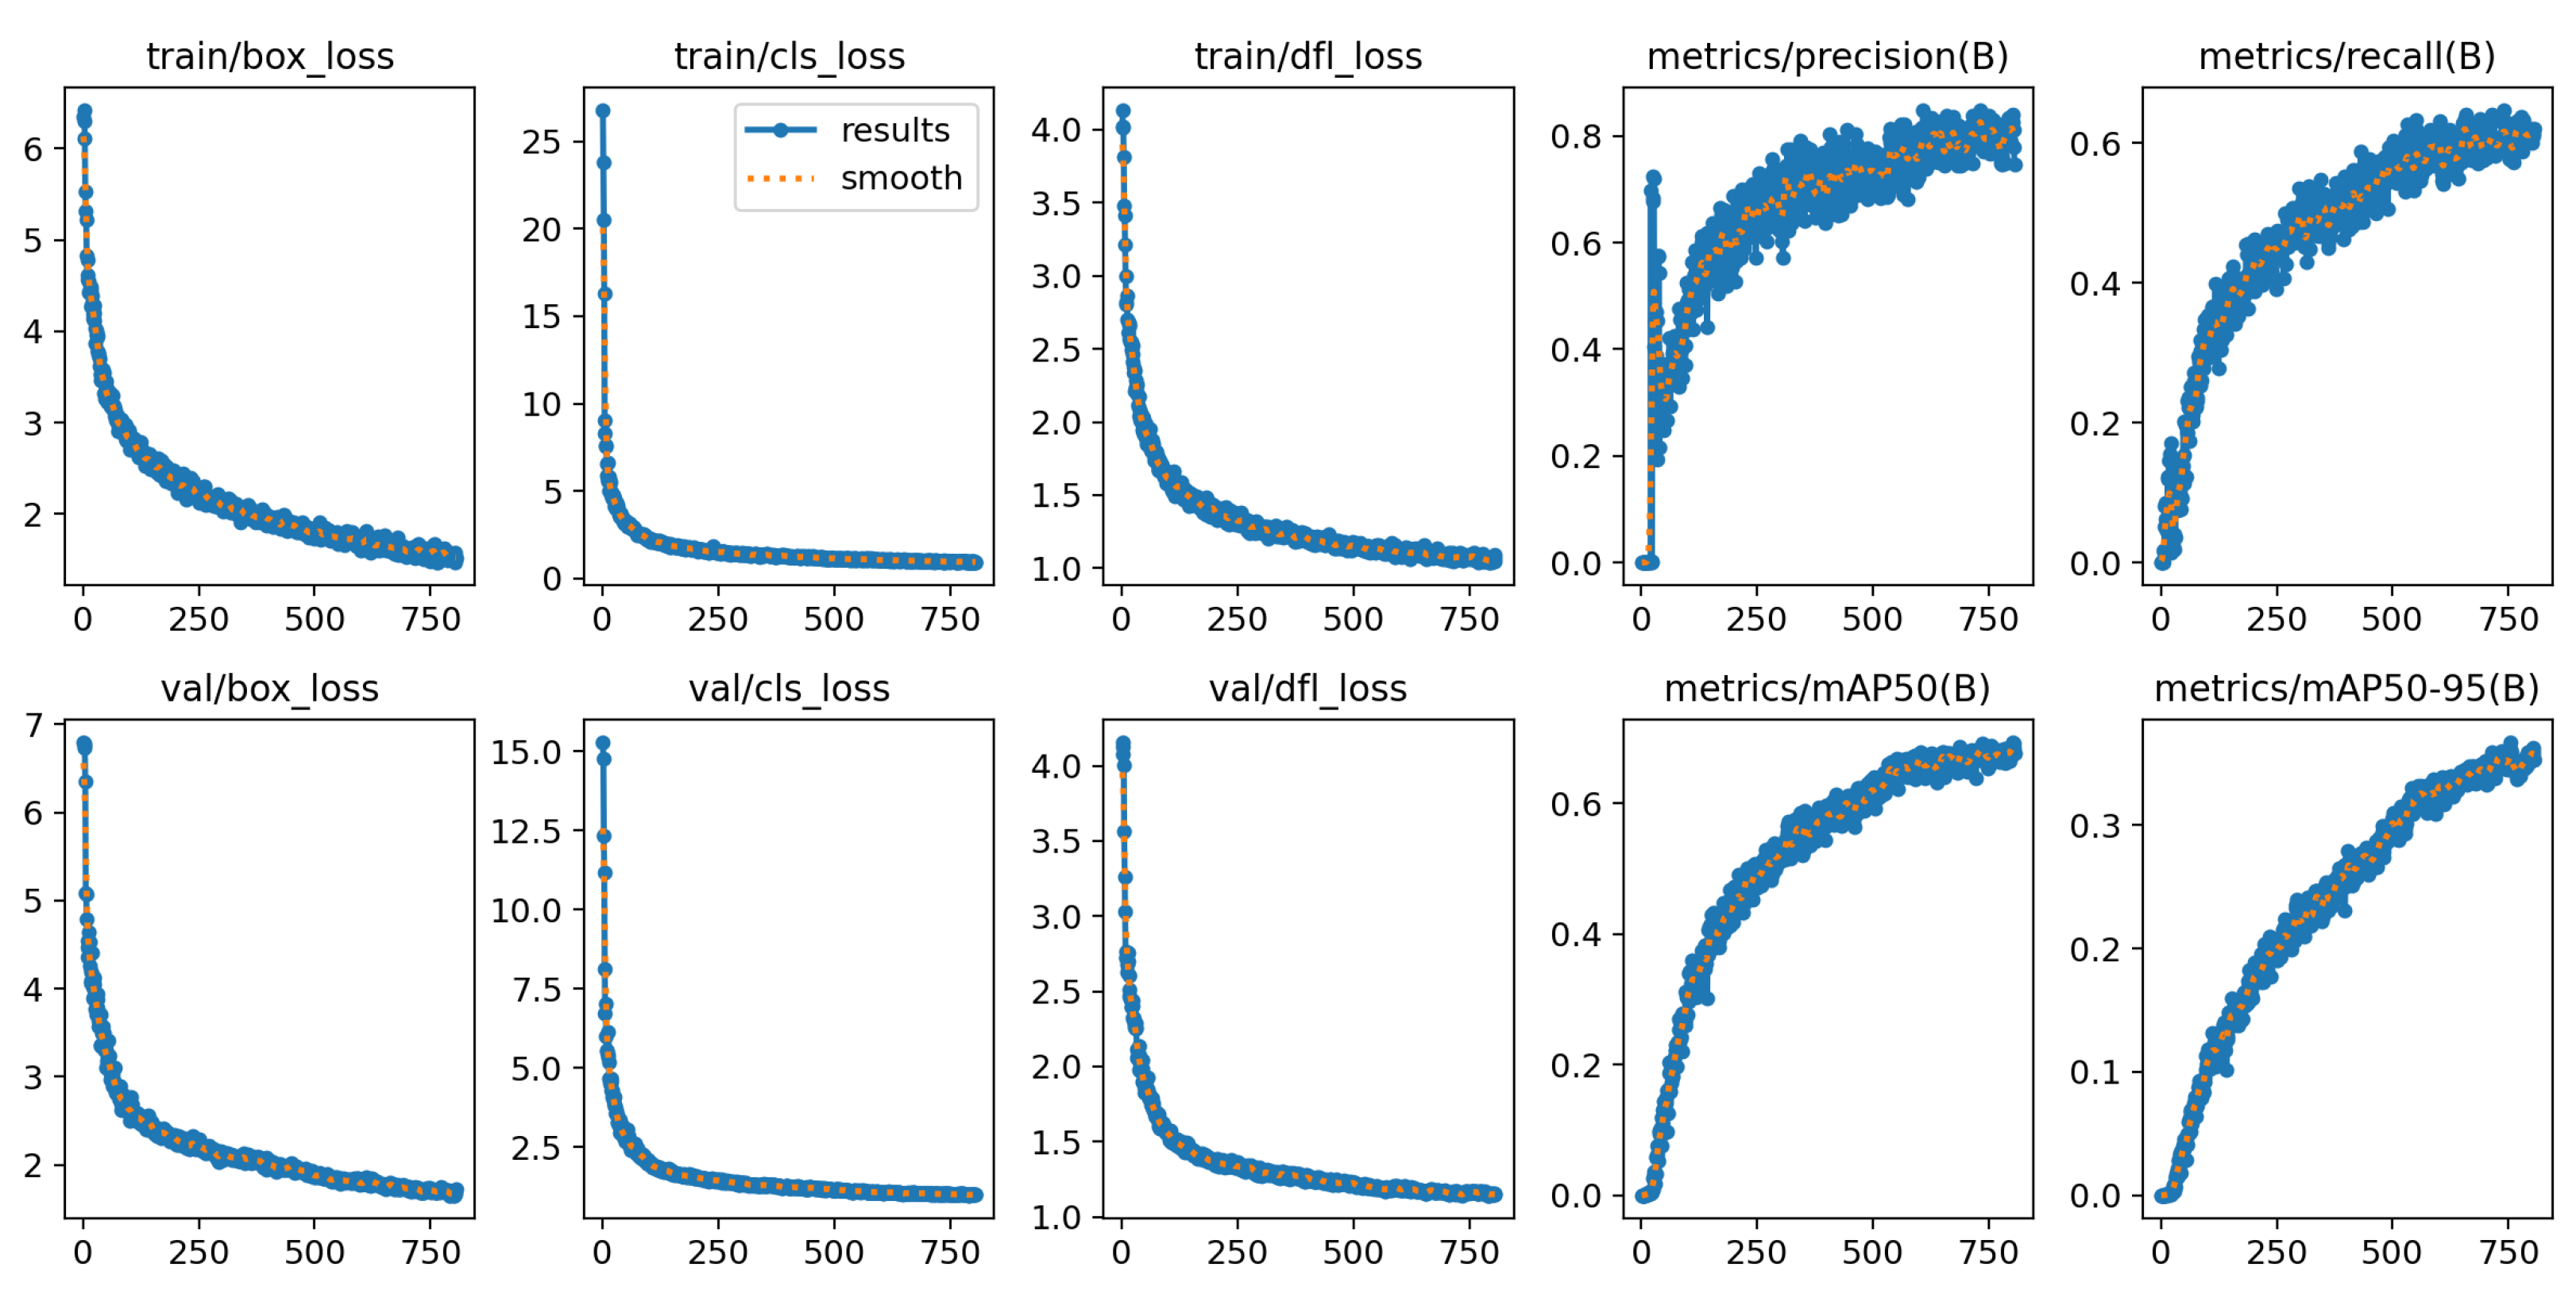
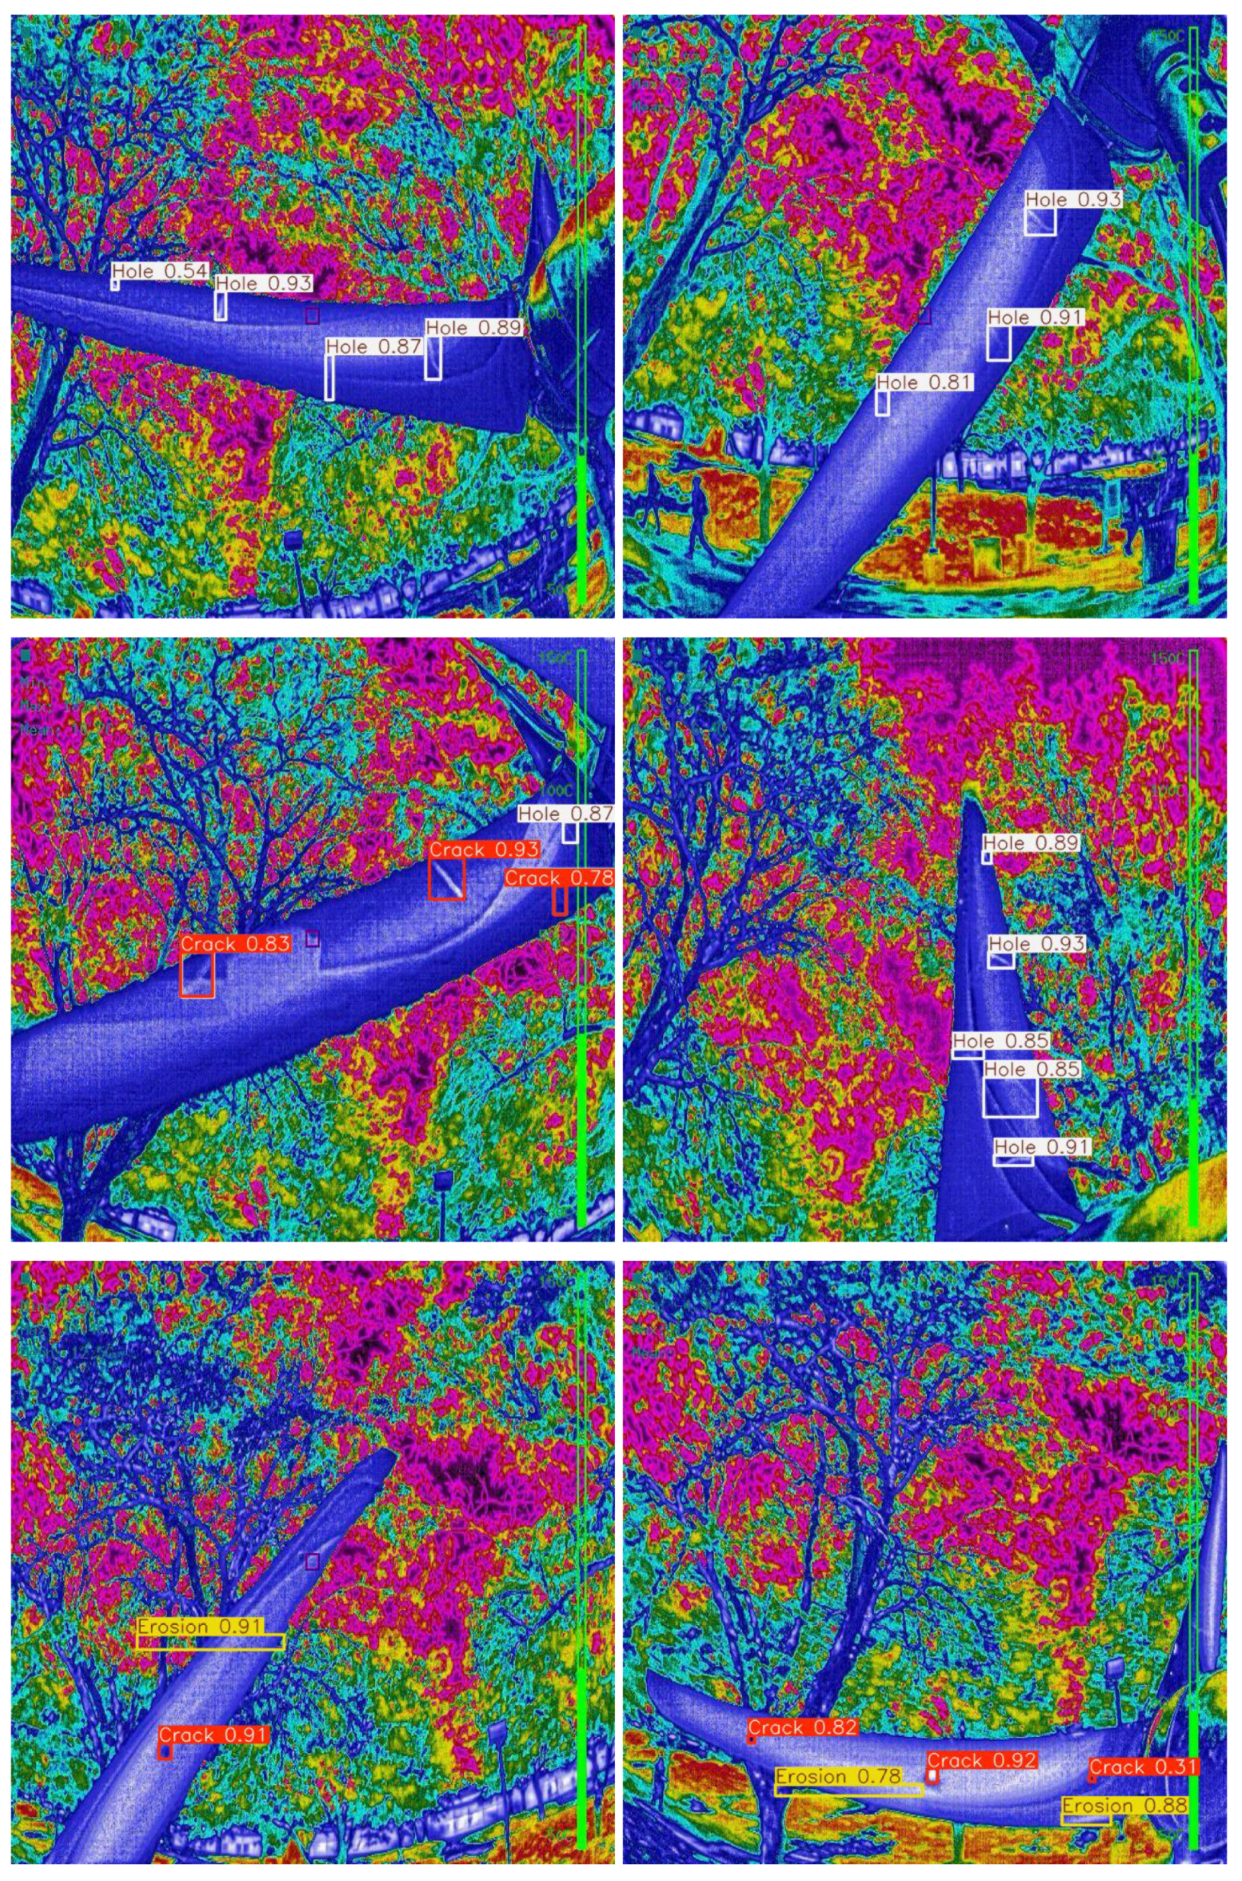
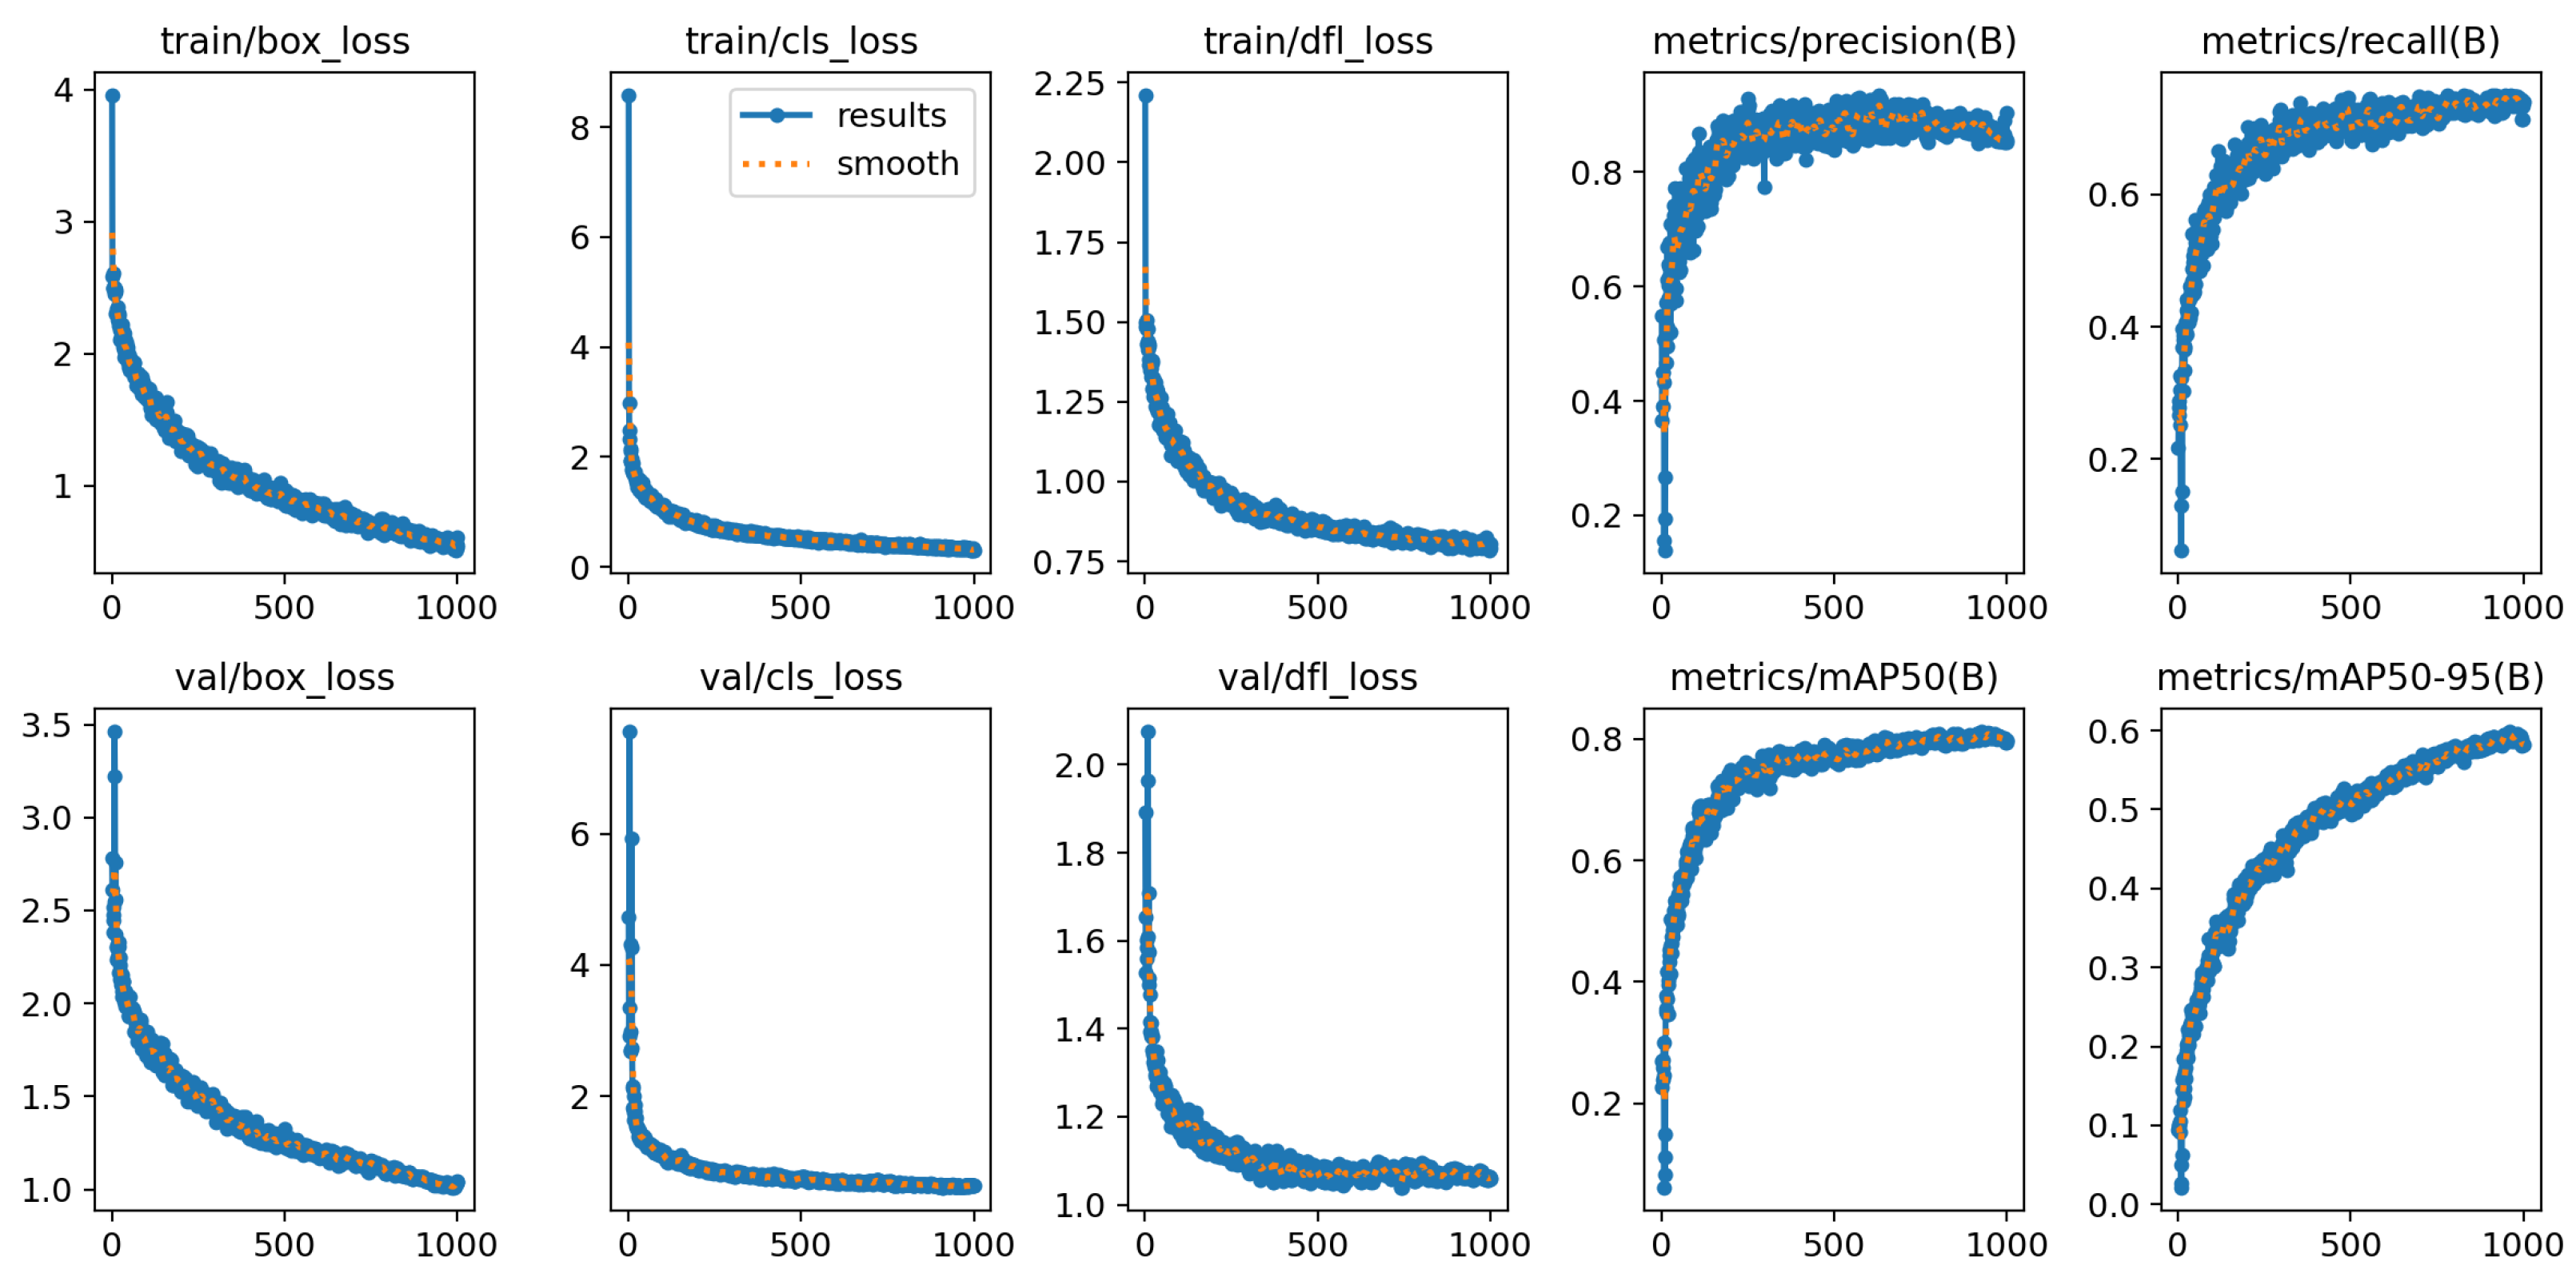
These customizations transformed the base YOLO architecture into a specialized tool for wind turbine maintenance, moving beyond default configurations to address the unique challenges of thermal defect detection. By tailoring the models to our specific needs, we enhanced their potential effectiveness and reliability for real-world applications.
Both YOLOv8 and YOLOv9 feature significant architectural enhancements that demanded comprehensive parameter tuning for optimal performance. Both models use a batch size of 64 and are trained for 100 epochs. The initial learning rate is set to 0.001 and is applied with the Adam optimizer, which is typically configured with a momentum of 0.9. Regularization techniques include a dropout rate of 0.5 and a weight decay of 0.0005 to prevent overfitting. Both models utilize transfer learning, as they are pretrained on the COCO (Common Objects in Context) dataset [46]. Bayesian optimization is employed, starting from these default values, to determine the optimal model configurations. For YOLOv8, specific parameter tuning and optimization include configuring the loss function. YOLOv8 utilizes standard cross-entropy for classification and smooth L1 for bounding box prediction, effectively training the detection model. YOLOv9, on the other hand, focuses on optimizing gradient information programming to ensure maximum information flow through the gradient. The default settings mirror those of YOLOv8. Additionally, YOLOv9 incorporates CSP-ELAN blocks with a default depth of three layers and filter sizes starting from 256, balancing efficiency and performance. Customized loss functions are developed to leverage the unique features of PGI and GELAN within YOLOv9. The parameter tuning and optimization for both YOLOv8 and YOLOv9 are critical, iterative processes that are heavily data-driven. These processes involve extensive experimentation and validation on benchmark datasets, ensuring that the models not only meet but exceed current standards in object detection while being practical for real-world high-speed and accurate detection tasks.

3.2. YOLOv8 Results

This section presents the experimental results obtained by applying YOLOv8 to defect detection in thermal images of WTBs, where the model was tasked with identifying three classes of defects: holes, erosion, and cracks.
The confusion matrix for normalized data, as seen in Figure 8, indicates the model’s performance in terms of relative predictions per class. The matrix shows moderate to high diagonal values, suggesting an acceptable level of accuracy in predictions, with the highest normalized value for erosion detection (0.85). However, some confusion is noticeable between the classes, particularly between holes and background, where a normalized value of 0.39 is observed.
The model’s performance across different defect types revealed a particularly strong capability in detecting erosion, achieving an impressive detection rate of 85%. This high accuracy was likely due to the distinct thermal signature of erosion defects, which allowed them to be more easily identified. In contrast, the model faced greater challenges when distinguishing holes from the background, with a lower detection rate of 57% for holes and a notable confusion rate of 39% with the background. This difficulty may have stemmed from the similarity in thermal profiles between the holes and certain background elements, leading to misclassification. Cracks, although detected with a 58% accuracy, also exhibited some confusion with the background, indicated by a 20% misclassification rate. These findings suggest that while the model excels in identifying defects with clear thermal distinctions, it requires further refinement to enhance its accuracy in detecting defects with subtler thermal characteristics.
To evaluate the statistical significance of these results, we conducted a detailed analysis of the confidence intervals for each class’s detection rate. The high accuracy observed in erosion detection, accompanied by a confidence interval indicating minimal variance, demonstrates that the model’s performance in this category is statistically robust. However, the broader confidence intervals found for holes and cracks suggest that the reliability of the results in these categories may be lower, potentially due to the limited dataset size or the inherent complexity of detecting these types of defects. These insights underscore the necessity for additional model training and dataset expansion to bolster the reliability and statistical significance of the detection rates across all defect types.
The Precision-Recall curve, illustrated in Figure 9, were employed to evaluate the model’s precision and recall against various confidence thresholds. Erosion defects were detected with a high precision of 0.866, while the model achieved a precision of 0.592 for cracks and 0.608 for holes. The average precision across all classes at an intersection over union (IoU) of 0.5 was 0.689, indicating a balanced detection capability across all defect types.
The F1–confidence curve, shown in Figure 10, plots the harmonic mean of precision and recall for all the three classes against different confidence levels. The curve peaks at an F1 score of 0.69 at a confidence threshold of 0.416, suggesting an optimal balance between precision and recall at this threshold for all classes.
The loss and performance metrics, as visualized in Figure 11, indicate a steady decline in both training and validation loss over time, suggesting that the model learned effectively without overfitting. The precision and recall metrics gradually increase, with the model’s mean average precision (mAP) for the box predictions reaching a peak, demonstrating the efficacy of YOLOv8 in localizing the defects.
Figure 12 and Figure 13 provide comprehensive insights into the distribution of dataset labels and the quality of bounding box annotations. These visual aids are instrumental in analyzing the spatial distribution of defect types, their frequency, and the precision of bounding box placements, which are crucial for the YOLOv8 model’s training effectiveness and its ability to generalize across varied defect presentations in WTBs.
Figure 12 provides insights into the relationships between different bounding box attributes used in the YOLOv8 model. The x- and y-axes represent the coordinates (x, y) and dimensions (width, height) of the bounding boxes used to annotate defects in the dataset. Each cell in the matrix shows the relationship between the corresponding bounding box attributes. The color intensity indicates the density of occurrences, with darker colors representing higher densities. This visualization helps in understanding the distribution and correlation of bounding box attributes, which is important for improving the model’s detection and localization capabilities.
Figure 13 provides insights into the distribution of defect labels and the dimensions of the bounding boxes used to annotate defects in the dataset for the YOLOv8 model.
The top left bar chart shows the frequency of different defect types (cracks, erosion, holes) on the x-axis, with the number of instances of each defect type on the y-axis. This chart indicates that cracks were the most common defect type, followed by holes and erosion.
The bottom left scatter plot illustrates the spatial distribution of defects on the wind turbine blade (WTB) surface, with x- and y-coordinates representing the position on the WTB surface. This plot shows where defects were commonly located on the WTB.
The bottom right scatter plot displays the relationship between bounding box width and height, with width on the x-axis and height on the y-axis. This plot illustrates the range of defect sizes and highlights the variability in defect dimensions that the model needed to handle.
The top right part of the figure depicts the anchor boxes used by the YOLOv8 model. These anchor boxes are preset dimensions applied during model training to efficiently identify objects of varying shapes and sizes. This visualization emphasizes the model’s capacity to adjust to diverse defect dimensions, which is critical for accurate localization and classification in practical applications.
Additionally, Figure 14 presents examples of defect detection results using YOLOv8. The figure shows the model’s ability to localize and classify defects accurately in the images of WTBs, highlighting specific instances of holes, erosion, and cracks.
YOLOv9’s normalized confusion matrix is depicted in Figure 15, showing each class’s predictive accuracy. A high degree of precision can be observed in the matrix, particularly for the erosion class, similarly to the YOLOv8 model. However, the distribution of misclassifications will be a point of comparison to assess YOLOv9’s improvement over its predecessor.
In conclusion, YOLOv8 was proven to be effective for defect detection in thermal images of WTBs, exhibiting promising results across various performance metrics. The analysis underscores the need for continued refinement in model training, especially to reduce confusion between classes and improve the detection of cracks and background instances. The results advocate the potential of YOLOv8 in the domain of wind turbine maintenance and the larger context of renewable energy sustainability.

3.3. YOLOv9 Results

Continuing the advancements in defect detection, YOLOv9 was evaluated under the same experimental conditions as YOLOv8. The model was tasked with identifying three classes of defects—holes, erosion, and cracks—in thermal images of WTBs.
The YOLOv9 model exhibited significant improvements in detecting cracks, with a detection accuracy of 75%, compared to YOLOv8’s 58%. This enhancement suggests that YOLOv9 was more adept at distinguishing crack defects, likely due to advanced feature extraction techniques. Erosion detection remained consistently high, with an accuracy of 85%, similar to that of YOLOv8, indicating that both models were equally proficient in identifying this defect type. However, while the detection of holes improved to 65%, there remained considerable confusion with the background, as evidenced by a 48% misclassification rate. This ongoing challenge emphasizes the necessity for further model refinement to better distinguish between holes and background elements. Additionally, the background class continued to show confusion with both crack and hole detections, suggesting that additional data or targeted training enhancements could significantly benefit model performance.
The statistical significance of the YOLOv9 results is supported by narrower confidence intervals for crack and erosion detection, indicating that these results are more reliable and consistent compared to those obtained with YOLOv8. The marked improvement in crack detection accuracy is particularly notable, as it reflects the model’s enhanced capability in identifying defects that previously presented challenges. However, the wider confidence interval observed for hole detection, despite the accuracy improvement, points to variability that may require further training data or model adjustments to achieve more stable performance. These findings highlight the ongoing need for refinement in detecting defects that share similar thermal characteristics with background noise.
Precision and recall are essential metrics for evaluating model performance. Figure 16 illustrates YOLOv9’s precision and recall across different confidence thresholds. These metrics will be compared with YOLOv8’s performance, highlighting areas of improvement or potential regression.
The F1–confidence curve for YOLOv9 is illustrated in Figure 17, demonstrating the harmonic mean of precision and recall at various confidence levels. This curve will be compared to YOLOv8’s to evaluate if the newer model achieved a better balance between precision and recall.
YOLOv9’s training and validation loss over time, along with precision and recall metrics, are depicted in Figure 18. These metrics indicate the model’s learning efficiency and can be used to compare the convergence and reliability of defect localization against the previous model iteration.
Understanding the learning process of YOLOv9 involves analyzing the distribution of dataset labels and the quality of bounding box annotations, as depicted in Figure 19 and Figure 20. These visualizations provide insights into any enhancements that YOLOv9 may offer in terms of defect detection and localization, particularly in comparison to its predecessor, YOLOv8.
Figure 19 presents a correlogram that explores the inter-relationships between different types of defects identified in the dataset. This visualization helps to understand co-occurrence and potential dependencies among various defect categories, crucial for refining the model’s training strategies and achieving robust defect detection. The x- and y-axes represent the bounding box attributes (x, y, width, height). The color intensity indicates the density of occurrences, with darker colors representing higher densities. This visualization aids in identifying complex patterns in defect occurrences, crucial for enhancing detection algorithms and training methodologies.
Figure 20 displays the distribution of labels within the dataset and the dimensions of the bounding boxes used. This figure is key to assessing the precision with which the model identified and classified defects, showcasing improvements in how the model handled various defect sizes and their placements on the WTBs. The top left bar chart shows the frequency of different defect types (cracks, erosion, holes) on the x-axis, with the number of instances on the y-axis, indicating that cracks were the most common defect type, followed by holes and erosion. The bottom left scatter plot shows the spatial distribution of defects with x- and y-coordinates representing the position on the WTB surface. The bottom right scatter plot displays the relationship between the bounding box width and height, with width on the x-axis and height on the y-axis, illustrating the range of defect sizes. The top right part of the figure depicts the anchor boxes used by the YOLOv9 model, which are preset dimensions optimized to match the common sizes and aspect ratios of defects. This visualization emphasizes the model’s advancements in capturing defect sizes and accurately localizing them on turbine blades, thereby showcasing the improvements over YOLOv8 in handling defect dimensions and distribution.
Furthermore, Figure 21 presents examples of defect detection using YOLOv9. This figure showcases the model’s capability to accurately localize and classify defects in thermal images of WTBs, with a focus on identifying holes, erosion, and cracks.
These visual aids serve as a basis for a detailed discussion in the Results Section, where the two versions of the YOLO model will be critically analyzed, and conclusions will be drawn about their respective performances in defect detection tasks.

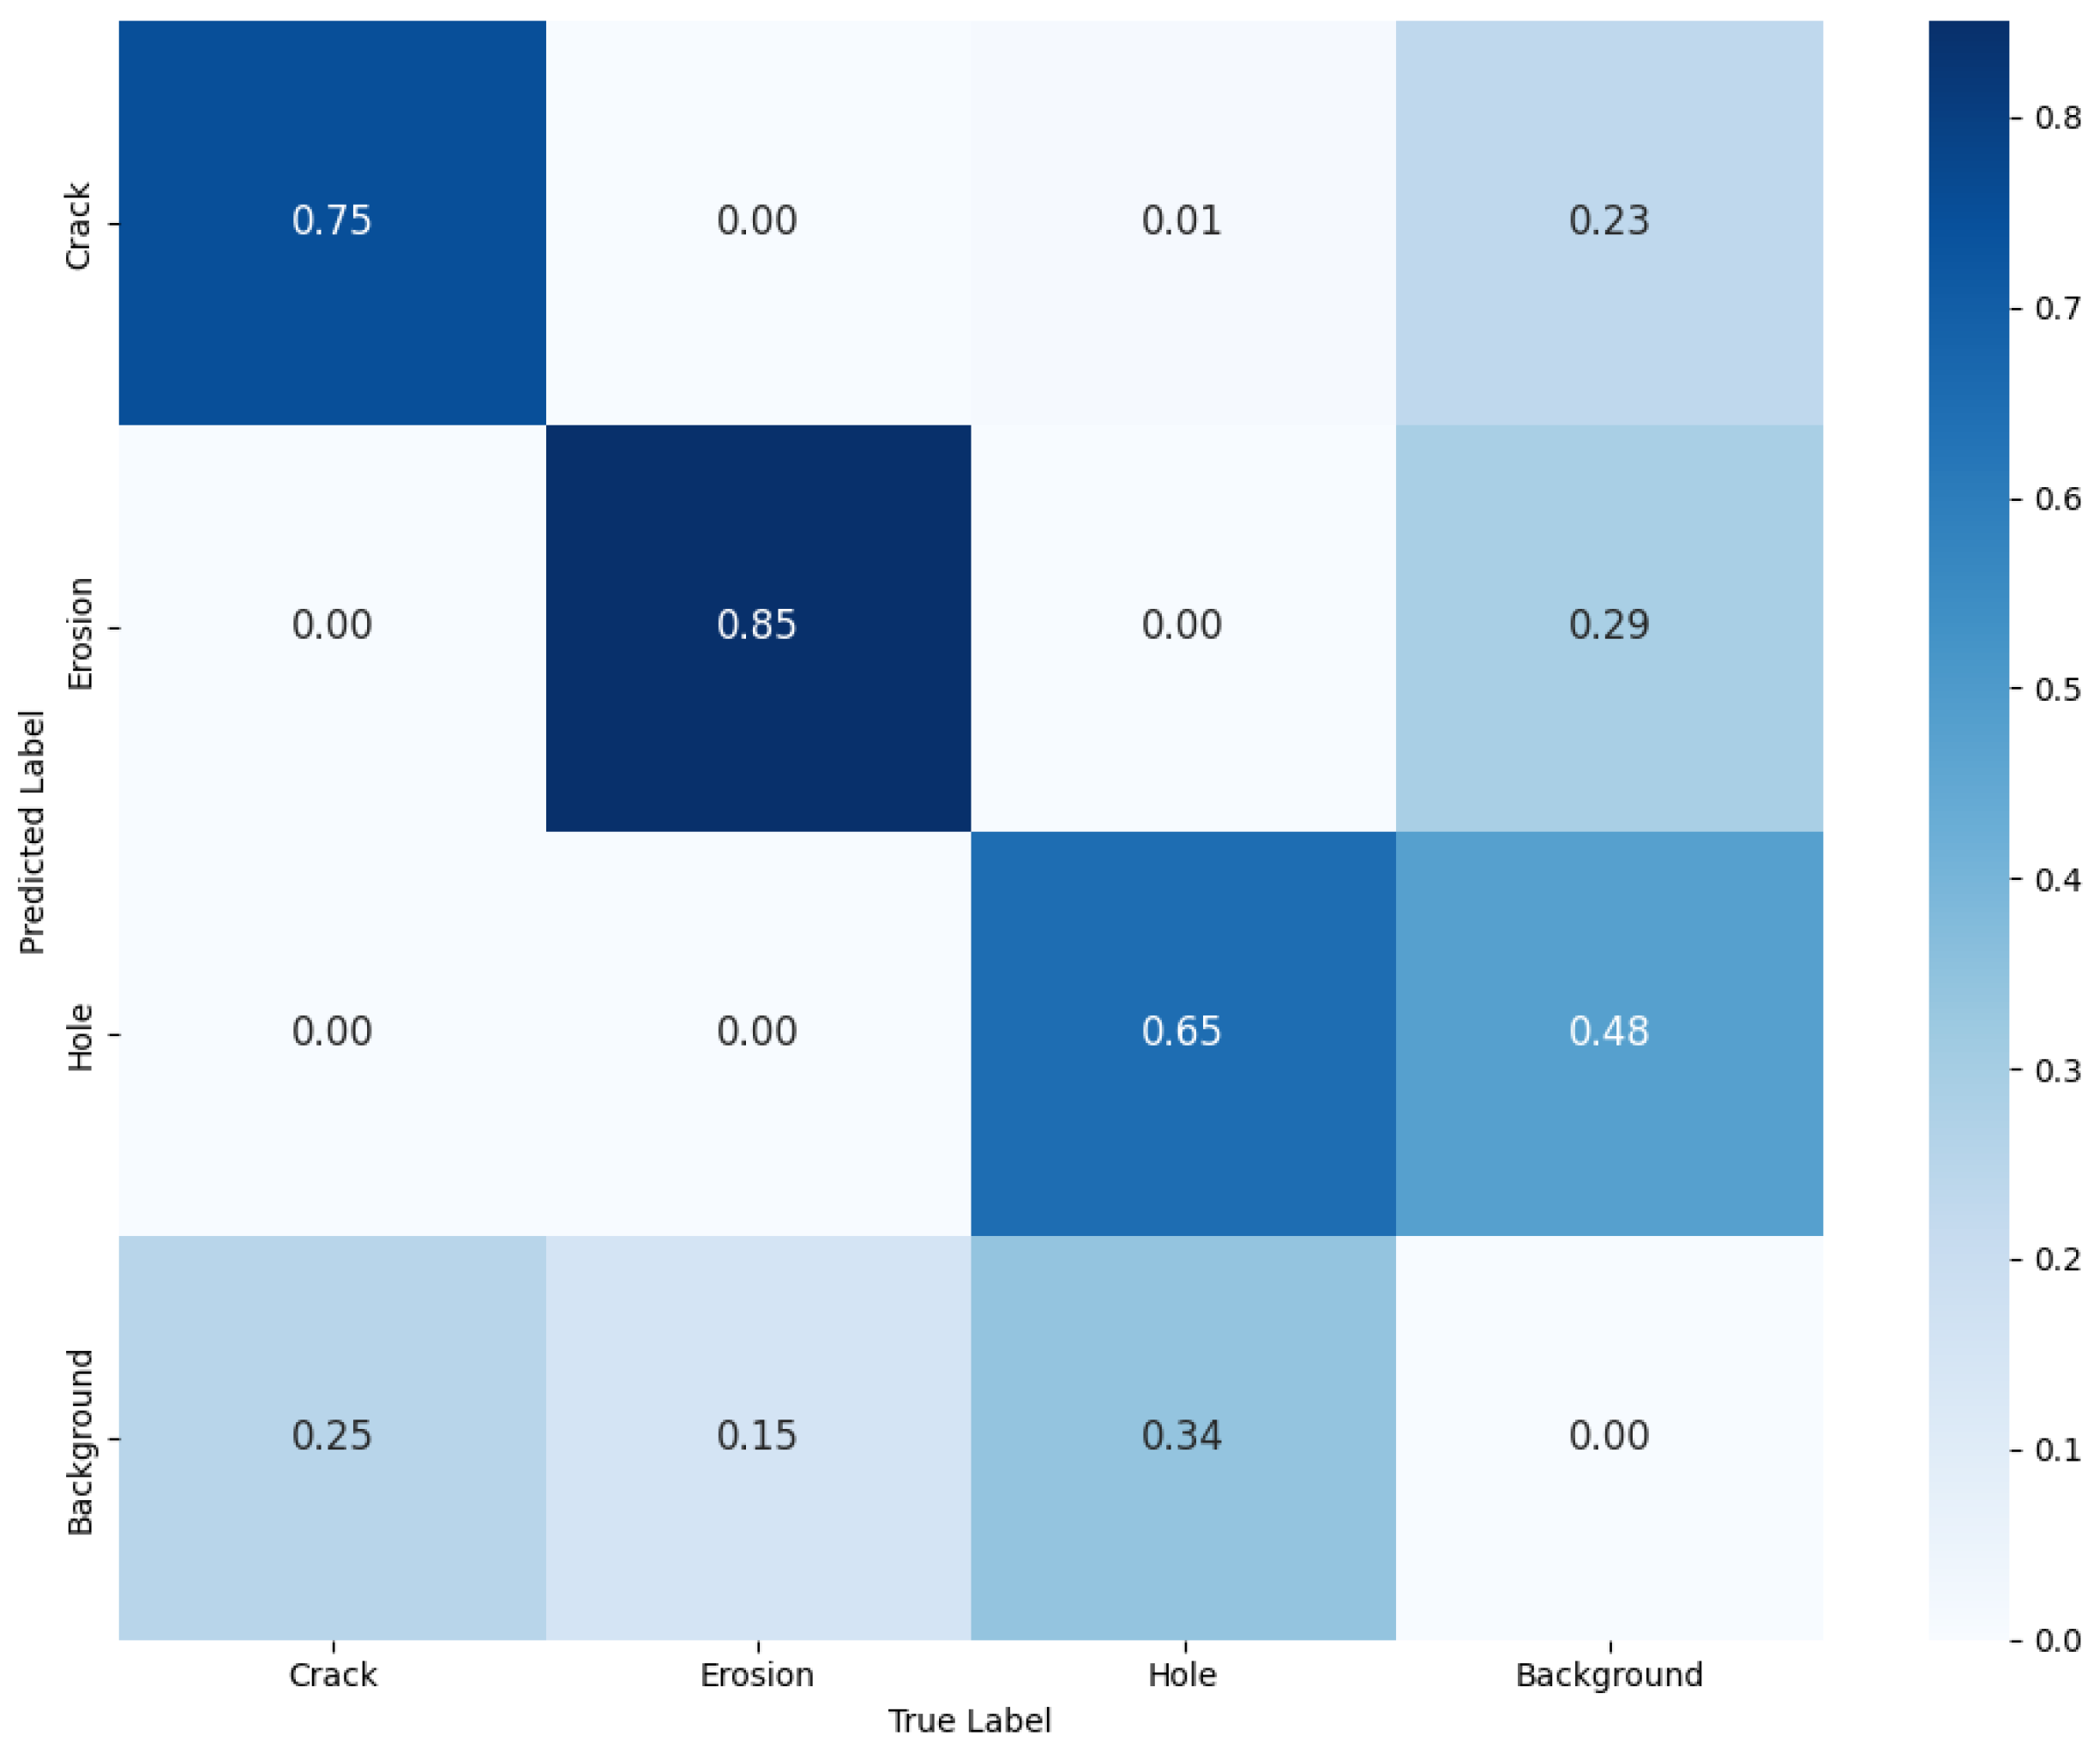
3.4. Comparative Analysis of YOLOv8 and YOLOv9 Performance

A comprehensive analysis was conducted to compare the performances of YOLOv8 and YOLOv9 in the context of detecting defects in the created thermal images of WTBs. Both models were evaluated based on their ability to classify and localize three types of defects: cracks, erosion, and holes.
The normalized confusion matrices for both models provide a clear insight into their classification accuracy. As observed in Figure 8 and Figure 15, YOLOv9 demonstrated a slight improvement in accurately classifying the crack and erosion defects, with a notable reduction in false positives for the background class, which is a significant challenge in object detection.
The precision–recall curves (Figure 9 and Figure 16) show that YOLOv9 improved the precision across all classes, especially at higher recall levels. This indicates a robustness in YOLOv9’s ability to maintain high precision without sacrificing recall, thereby providing a more balanced detection capability.
The F1 score, which combined both precision and recall into a single metric, peaked at a higher confidence threshold for YOLOv9 (Figure 17) compared to YOLOv8 (Figure 10). This suggests that YOLOv9 was more effective in balancing the trade-off between precision and recall, thus providing a better overall performance.
An analysis of the loss and performance metrics revealed that YOLOv9 converged more quickly and with a lower loss compared to YOLOv8 (Figure 11 and Figure 18). This rapid convergence is indicative of YOLOv9’s improved learning efficiency, which can be attributed to the architectural enhancements and optimized training protocols.
When examining the dataset distribution and bounding box annotations (Figure 12 and Figure 19), YOLOv9 shows better generalization across varying sizes and shapes of defects. This indicates an improved capability in learning from the dataset and suggests potential for better performance in diverse real-world scenarios.
In conclusion, YOLOv9 outperformed YOLOv8 in every key performance metric, indicating that the improvements in architecture and training methods have translated into a more robust and accurate object detection model. YOLOv9’s advancements underscore its suitability for real-time applications where precision and reliability are paramount.

4. Conclusions and Future Work

This research contributes to the evolving field of wind turbine maintenance, harnessing advanced image processing and machine learning techniques to enhance the accuracy and efficiency of inspections. By integrating cutting-edge thermal imaging technologies with the latest real-time object detection models YOLOv8 and YOLOv9, we established a robust framework for detecting and localizing defects in wind turbine blades. This approach not only improves the precision of defect assessments but also optimizes maintenance strategies, leading to increased turbine reliability and longevity. The deployment of the FLIR Vue TZ20 camera, chosen for its drone compatibility, underscores our forward-thinking approach. Although drone integration was not completed in the current phase of research, this setup paves the way for future applications involving aerial inspections. Utilizing drones promises to revolutionize wind turbine inspections by providing comprehensive aerial data acquisition, enabling access to difficult-to-reach areas and significantly reducing inspection times and costs. Furthermore, the creation of a specialized thermal image dataset tailored for wind turbine blades represents a pivotal step toward refining the training and effectiveness of machine learning models in real-world scenarios. This dataset enhances our understanding of defect characteristics under various operational conditions, facilitating more accurate predictions and insights.
Specific Recommendations and Broader Implications. Our future research will focus on three key objectives: (1) fully integrating drone technology into our inspection framework, including the development of advanced control systems for stable and precise thermal imaging during flight; (2) expanding and diversifying our thermal image dataset by incorporating data from larger, operational wind turbines under varied environmental conditions to enhance model robustness; and (3) continuously improving the YOLO models to increase their accuracy and reliability in real-world applications. These steps will address the challenges and limitations identified in the current phase, particularly in detecting defects that have similar thermal characteristics to background noise. The successful implementation of these recommendations will advance wind turbine maintenance practices and contribute significantly to the broader renewable energy sector by improving the reliability and efficiency of wind energy systems, thus supporting the global transition towards more sustainable energy sources.
Challenges and Limitations of Drone Integration. While integrating drones into our inspection protocol shows great promise, it also presents several technical and operational challenges that must be addressed in future work. These include ensuring the stability of the drone during flight, particularly in high-wind conditions typical of wind turbine sites, and optimizing the coordination between the drone’s movement and the thermal camera’s data capture to avoid motion blur and other imaging distortions. Additionally, developing autonomous navigation and obstacle avoidance systems will be critical to enable safe and efficient drone operations near wind turbines. Overcoming these challenges will be essential to fully realize the potential of drone-based inspections and achieve the goal of autonomous, real-time wind turbine maintenance.
Through this project, we not only built upon existing knowledge but also laid the groundwork for future innovations in renewable energy maintenance. Our continued efforts will focus on enhancing model accuracy, expanding dataset dimensions, and integrating drone technology to fully realize the autonomous operational management of wind turbines.

Author Contributions

Conceptualization, M.M. and M.S.; Software, M.M.; Validation, M.M. and M.S.; Formal analysis, M.M. and M.S.; Investigation, M.S., M.A.S.M. and A.C.S.; Resources, M.S. and M.A.S.M.; Data curation, M.M. and M.S.; Writing—original draft, M.M.; Writing—review & editing, M.S., M.A.S.M. and A.C.S.; Visualization, M.S.; Supervision, M.S.; Project administration, M.S.; Funding acquisition, M.S., M.A.S.M. and A.C.S. All authors have read and agreed to the published version of the manuscript.

Funding

This work was supported by the Utah System of Higher Edication (grant number: 20210016UT).

Data Availability Statement

The data presented in this study are available on request from the corresponding author.

Acknowledgments

The authors sincerely thank the Office of the Commissioner of Utah System of Higher Education (USHE) for supporting this research under the Deep Technology Talent Initiative Grant 20210016UT. We also extend our gratitude to Mohammad Shekaramiz for his oversight and management of the project prior to his untimely passing in December 2024. Additionally, we acknowledge the ECE undergraduate students Benjamin Collier, Kaden Clements, and Hannah Chappell for collaborating on and annotating the dataset.

Conflicts of Interest

The authors declare no conflicts of interest. The funders had no role in the design of the study; in the collection, analyses, or interpretation of data; in the writing of the manuscript; or in the decision to publish the results.

Abbreviations

AbbreviationDefinition
AIArtificial Intelligence
CNNConvolutional Neural Network
COCOCommon Objects in Context
DTAGANDual-Threshold Attention-Guided GAN
FLIRForward-Looking InfraRed
GANGenerative Adversarial Network
GELANGeneralized Efficient Layer Aggregation Network
GRUGated Recurrent Unit
IRInfrared
IRTInfrared thermography
LCOELevelized Cost of Energy
MIRMid-infrared
NDTNon-destructive testing
OCTOptical Coherence Tomography
PCAPrincipal Component Analysis
PGIProgrammable Gradient Information
PVPhotovoltaic
RoIRegion of interest
SVMSupport Vector Machine
UAVUnmanned Aerial Vehicle
WTBWind turbine blade
YOLOYou Only Look Once

References

  1. Memari, M.; Shakya, P.; Shekaramiz, M.; Seibi, A.C.; Masoum, M.A. Review on the Advancements in Wind Turbine Blade Inspection: Integrating Drone and Deep Learning Technologies for Enhanced Defect Detection. IEEE Access 2024, 12, 33236–33282. [Google Scholar] [CrossRef]
  2. Li, W.; Pan, Z.; Hong, N.; Du, Y. Defect detection of large wind turbine blades based on image stitching and improved Unet network. J. Renew. Sustain. Energy 2022, 15, 013302. [Google Scholar] [CrossRef]
  3. Clero, K.; Nadour, M.; Ed-Diny, S.; Achalhi, M.; Cherkaoui, M.; Ait Abdelali, H.; El Fkihi, S.; Benzakour, I.; Rziki, S.; Tagemouati, H.; et al. A Review of the Use of Thermal Imaging and Computer Vision for Pattern Recognition. Comput. Sci. Inf. Technol. 2023, 13, 121–136. [Google Scholar] [CrossRef]
  4. Yang, R.; He, Y.; Mandelis, A.; Wang, N.; Wu, X.; Huang, S. Induction Infrared Thermography and Thermal-Wave-RADAR Analysis for Imaging Inspection and Diagnosis of Blade Composites. IEEE Trans. Ind. Inform. 2018, 14, 5637–5647. [Google Scholar] [CrossRef]
  5. Smith, J.; Carter, D. Application of UAVs in detecting subsurface defects in wind turbine blades using thermal imaging. Wind Energy 2019, 22, 123–130. [Google Scholar]
  6. Jones, A.; Taylor, M. Deep learning for real-time detection of defects in wind turbine blades via thermal imaging. Renew. Energy 2020, 145, 2291–2301. [Google Scholar]
  7. Galleguillos, C.; Zorrilla, A.; Jimenez, A.; Diaz, L.; Montiano, Á.; Barroso, M.; Viguria, A.; Lasagni, F. Thermographic non-destructive inspection of wind turbine blades using unmanned aerial systems. Plast. Rubber Compos. 2015, 44, 98–103. [Google Scholar] [CrossRef]
  8. Doroshtnasir, M.; Worzewski, T.; Krankenhagen, R.; Rollig, M. On-site inspection of potential defects in wind turbine rotor blades with thermography. Wind Energy 2016, 19, 1407–1422. [Google Scholar] [CrossRef]
  9. Traphan, D.; Herráez, I.; Meinlschmidt, P.; Schlüter, F.; Peinke, J.; Gülker, G. Remote surface damage detection on rotor blades of operating wind turbines by means of infrared thermography. Wind Energy Sci. 2018, 3, 639–650. [Google Scholar] [CrossRef]
  10. Chen, X.; Shihavuddin, A.; Madsen, S.H.; Thomsen, K.; Rasmussen, S.; Branner, K. AQUADA: Automated Quantification of Damages in Composite Wind Turbine Blades for LCOE Reduction. Wind Energy 2021, 24, 535–548. [Google Scholar] [CrossRef]
  11. Xu, L.; Hu, J. A Method of Defect Depth Recognition in Active Infrared Thermography Based on GRU Networks. Appl. Sci. 2021, 11, 6387. [Google Scholar] [CrossRef]
  12. Wang, K.; Zhang, J.; Ni, H.; Ren, F. Thermal Defect Detection for Substation Equipment Based on Infrared Image Using Convolutional Neural Network. Electronics 2021, 10, 1986. [Google Scholar] [CrossRef]
  13. Jiang, C.; Ren, H.; Ye, X.; Zhu, J.; Zeng, H.; Nan, Y.; Sun, M.; Ren, X.; Huo, H. Object Detection from UAV Thermal Infrared Images and Videos Using YOLO Models. Int. J. Appl. Earth Obs. Geoinf. 2022, 112, 102912. [Google Scholar] [CrossRef]
  14. Redmon, J.; Divvala, S.; Girshick, R.; Farhadi, A. You only look once: Unified, real-time object detection. In Proceedings of the IEEE Conference on Computer Vision and Pattern Recognition, Las Vegas, NV, USA, 27–30 June 2016; pp. 779–788. [Google Scholar]
  15. Wang, C.; Gu, Y. Research on infrared nondestructive detection of small wind turbine blades. Results Eng. 2022, 15, 100570. [Google Scholar] [CrossRef]
  16. Yu, J.; He, Y.; Zhang, F.; Sun, G.; Hou, Y.; Liu, H.; Li, J.; Yang, R.; Wang, H. An infrared image stitching method for wind turbine blade using UAV flight data and U-Net. IEEE Sens. J. 2023, 23, 8727–8736. [Google Scholar] [CrossRef]
  17. Chen, X.; Sheiati, S.; Shihavuddin, A. AQUADA PLUS: Automated damage inspection of cyclic-loaded large-scale composite structures using thermal imagery and computer vision. Compos. Struct. 2023, 318, 117085. [Google Scholar] [CrossRef]
  18. de Oliveira, A.K.V.; Bracht, M.K.; Aghaei, M.; Rüther, R. Automatic fault detection of utility-scale photovoltaic solar generators applying aerial infrared thermography and orthomosaicking. Sol. Energy 2023, 252, 272–283. [Google Scholar] [CrossRef]
  19. Attallah, O.; Ibrahim, R.A.; Zakzouk, N.E. CAD system for inter-turn fault diagnosis of offshore wind turbines via multi-CNNs & feature selection. Renew. Energy 2023, 203, 870–880. [Google Scholar]
  20. Shao, H.; Li, W.; Cai, B.; Wan, J.; Xiao, Y.; Yan, S. Dual-threshold attention-guided GAN and limited infrared thermal images for rotating machinery fault diagnosis under speed fluctuation. IEEE Trans. Ind. Inform. 2023, 19, 9933–9942. [Google Scholar] [CrossRef]
  21. Goodfellow, I.; Pouget-Abadie, J.; Mirza, M.; Xu, B.; Warde-Farley, D.; Ozair, S.; Courville, A.; Bengio, Y. Generative adversarial networks. Commun. ACM 2020, 63, 139–144. [Google Scholar] [CrossRef]
  22. Tanda, G.; Migliazzi, M. Infrared thermography monitoring of solar photovoltaic systems: A comparison between UAV and aircraft remote sensing platforms. Therm. Sci. Eng. Prog. 2024, 48, 102379. [Google Scholar] [CrossRef]
  23. Petersen, C.R.; Fæster, S.; Bech, J.I.; Jespersen, K.M.; Israelsen, N.M.; Bang, O. Non-destructive and contactless defect detection inside leading edge coatings for wind turbine blades using mid-infrared optical coherence tomography. Wind Energy 2023, 26, 458–468. [Google Scholar] [CrossRef]
  24. Zhao, X.; Zhao, Y.; Hu, S.; Wang, H.; Zhang, Y.; Ming, W. Progress in Active Infrared Imaging for Defect Detection in the Renewable and Electronic Industries. Sensors 2023, 23, 8780. [Google Scholar] [CrossRef]
  25. Wang, Z.; Jiang, N.; Wen, R.; Sun, B. The Segmentation of Wind Turbine Defect Based on UAV Infrared Image. In Proceedings of the 4th Asian Quantitative InfraRed Thermography Conference, Abu Dhabi, United Arab Emirates, 30 October–3 November 2023. [Google Scholar]
  26. Li, X.; He, Y.; Wang, H.; Sun, G.; Yu, J.; Du, X.; Hu, M.; Wang, Y. Thermal Inspection of Subsurface Defects in Wind Turbine Blade Segments Under the Natural Solar Condition. IEEE Trans. Ind. Electron. 2023, 1, 11488–11497. [Google Scholar] [CrossRef]
  27. Zhou, W.; Wang, Z.; Zhang, M.; Wang, L. Wind Turbine Actual Defects Detection Based on Visible and Infrared Image Fusion. IEEE Trans. Instrum. Meas. 2023, 72, 3509208. [Google Scholar] [CrossRef]
  28. Zheng, S.; Li, L.; Chu, N.; Zhou, C.; Mohammad-Djafari, A. Abnormal temperature detection of blower components based on infrared video images analysis. IEEE Sens. J. 2024, 24, 1919–1928. [Google Scholar] [CrossRef]
  29. Jia, X.; Chen, X. AI-based optical-thermal video data fusion for near real-time blade segmentation in normal wind turbine operation. Eng. Appl. Artif. Intell. 2024, 127, 107325. [Google Scholar] [CrossRef]
  30. Sheiati, S.; Chen, X. Deep learning-based fatigue damage segmentation of wind turbine blades under complex dynamic thermal backgrounds. Struct. Health Monit. 2024, 23, 539–554. [Google Scholar] [CrossRef]
  31. Du, Y.; Zhou, S.; Jing, X.; Peng, Y.; Wu, H.; Kwok, N. Damage detection techniques for wind turbine blades: A review. Mech. Syst. Signal Process. 2020, 141, 106445. [Google Scholar] [CrossRef]
  32. Aminzadeh, A.; Dimitrova, M.; Meiabadi, M.S.; Karganroudi, S.S.; Taheri, H.; Ibrahim, H.; Wen, Y. Non-Contact Inspection Methods for Wind Turbine Blade Maintenance: Techno—Economic Review of Techniques for Integration with Industry 4.0. J. Nondestruct. Eval. 2023, 42, 54. [Google Scholar] [CrossRef]
  33. Redmon, J.; Farhadi, A. YOLO9000: Better, faster, stronger. In Proceedings of the IEEE Conference on Computer Vision and Pattern Recognition, Honolulu, HI, USA, 21–26 July 2017; pp. 7263–7271. [Google Scholar]
  34. Redmon, J.; Farhadi, A. YOLOv3: An incremental improvement. In Computer Vision and Pattern Recognition; Springer: Berlin/Heidelberg, Germany, 2018. [Google Scholar]
  35. Bochkovskiy, A.; Wang, C.Y.; Liao, H.Y.M. YOLOv4: Optimal speed and accuracy of object detection. arXiv 2020, arXiv:2004.10934. [Google Scholar]
  36. Shen, F.; Zeng, G. Weighted residuals for very deep networks. In Proceedings of the 2016 3rd International Conference on Systems and Informatics (ICSAI), Shanghai, China, 19–21 November 2016; pp. 936–941. [Google Scholar]
  37. Wang, C.Y.; Liao, H.Y.M.; Wu, I.H.; Chen, P.Y.; Hsieh, J.W.; Yeh, I.H. CSPNet: A New Backbone that can Enhance Learning Capability of CNN. In Proceedings of the IEEE/CVF Conference on Computer Vision and Pattern Recognition Workshops, Seattle, WA, USA, 14–19 June 2020; pp. 390–391. [Google Scholar]
  38. Yao, Z.; Cao, Y.; Zheng, S.; Huang, G.; Lin, S. Cross-Iteration Batch Normalization. In Proceedings of the 2021 IEEE/CVF Conference on Computer Vision and Pattern Recognition (CVPR), Nashville, TN, USA, 20–25 June 2021; pp. 12326–12335. [Google Scholar]
  39. Ultralytics. YOLOv5: Object Detection at 640 × 640. Online Resource. 2020. Available online: https://github.com/ultralytics/yolov5 (accessed on 20 January 2025).
  40. Tan, M.; Le, Q.V. EfficientNet: Rethinking Model Scaling for Convolutional Neural Networks. In Proceedings of the 36th International Conference on Machine Learning, Long Beach, CA, USA, 10–15 June 2019; pp. 6105–6114. [Google Scholar]
  41. Li, C.; Wang, X.; Zhang, Y.; Chen, H.; Liu, J.; Zhao, T.; Xu, F.; Yang, L.; Sun, Q.; Wu, M. YOLOv6: An Incremental Improvement of YOLOv5 for Object Detection. Online Resource. 2023. Available online: https://github.com/meituan/YOLOv6 (accessed on 1 May 2024).
  42. Reis, D.; Kupec, J.; Hong, J.; Daoudi, A. Real-Time Flying Object Detection with YOLOv8. arXiv 2023, arXiv:2305.09972. [Google Scholar]
  43. Wang, C.-Y.; Bochkovskiy, A.; Liao, H.-Y.M. YOLOv7: Trainable Bag-of-Freebies Sets New State-of-the-Art for Real-Time Object Detectors. In Proceedings of the IEEE/CVF Conference on Computer Vision and Pattern Recognition, Vancouver, BC, Canada, 17–24 June 2023; pp. 7464–7475. [Google Scholar]
  44. Wang, C.Y.; Yeh, I.H.; Liao, H.Y.M. YOLOv9: Learning What You Want to Learn Using Programmable Gradient Information. arXiv 2024, arXiv:2402.13616. [Google Scholar]
  45. Ultralytics. Ultralytics Version 8.2.0. 2024. Available online: https://github.com/ultralytics (accessed on 1 May 2024).
  46. Lin, T.Y.; Maire, M.; Belongie, S.; Bourdev, L.; Girshick, R.; Hays, J.; Perona, P.; Ramanan, D.; Zitnick, C.L.; Dollár, P. Microsoft COCO: Common Objects in Context. arXiv 2014, arXiv:1405.0312. [Google Scholar]
Figure 1. The small-scale wind turbine with intentionally created blade defects. The turbine has three carbon fiber blades (labeled as 1, 2, and 3 clockwise from the top) with the following dimensions: rotor diameter = 1.17 m ; blade length = 0.585 m ; and swept area = 1.07 m 2 .
Machines 13 00108 g001
Figure 2. Complete views of all three blades showing both front and back perspectives. Each blade is shown from both angles to provide comprehensive visualization of defect locations.
Machines 13 00108 g002
Figure 3. (a) FLIR Vue TZ20 camera, (b) camera connector gimbal, and (c) camera connected to FLIR Boson GUI 3.0 application.
Machines 13 00108 g003aMachines 13 00108 g003b
Figure 4. Thermal images of the small-scale wind turbine blades, showing the front and back views of each blade. The images were processed in FLIR Thermal Studio using Digital Detail Enhancement, enabling clearer visualization of the defects and making them more discernible for human interpretation.
Machines 13 00108 g004
Figure 5. Architectural overview of YOLOv8, illustrating its key components and operational flow [42].
Machines 13 00108 g005
Figure 6. Depiction of PGI integration within YOLOv9, showcasing its innovative approach to gradient information programming [44].
Machines 13 00108 g006
Figure 7. The GELAN architecture in YOLOv9, highlighting its adaptability to support various computational blocks [44].
Machines 13 00108 g007
Figure 8. Confusion matrix normalized for YOLOv8.
Machines 13 00108 g008
Figure 9. Precision–recall curve for YOLOv8. Curves are displayed with improved spacing and non-overlapping labels for better readability.
Machines 13 00108 g009
Figure 10. F1–confidence curve for YOLOv8.
Machines 13 00108 g010
Figure 11. Loss and performance metrics for YOLOv8.
Machines 13 00108 g011
Figure 12. This figure illustrates the relationships between different bounding box attributes (x, y, width, height) used in the YOLOv8 model. The x- and y-axes represent these attributes. The color intensity indicates the density of occurrences, with darker colors representing higher densities. This visualization helps in understanding the distribution and correlation of bounding box attributes, which is important for improving the model’s detection and localization capabilities.
Machines 13 00108 g012
Figure 13. This figure showcases the label distribution and bounding box dimensions for YOLOv8. The (top left) bar chart shows the frequency of different defect types (cracks, erosion, holes) on the x-axis and their instances on the y-axis. The (bottom left) scatter plot shows the spatial distribution of defects with x- and y-coordinates representing the position on the WTB surface. The (bottom right) scatter plot shows the relationship between bounding box width and height with the width on the x-axis and height on the y-axis. The (top right) visualization depicts the anchor boxes, which are preset dimensions used during model training to identify objects of varying shapes and sizes. This visualization emphasizes the model’s capacity to adjust to diverse defect dimensions, which is critical for accurate localization and classification in practical applications.
Machines 13 00108 g013
Figure 14. Examples of defect detection using YOLOv8 on thermal images of wind turbine blades (WTBs). The first row corresponds to Blade 1, the second row to Blade 2, and the third row to Blade 3. Detected defects include holes, erosion, and cracks, demonstrating accurate localization and classification.
Machines 13 00108 g014
Figure 15. Normalized confusion matrix for YOLOv9.
Machines 13 00108 g015
Figure 16. Precision–recall curve for YOLOv9. Visualization is enhanced with clear, non-overlapping labels to ensure optimal readability.
Machines 13 00108 g016
Figure 17. F1–confidence curve for YOLOv9.
Machines 13 00108 g017
Figure 18. Loss and performance metrics for YOLOv9.
Machines 13 00108 g018
Figure 19. The label correlogram for YOLOv9, illustrating correlations and interactions between different defect categories. This aids in identifying complex patterns in defect occurrences, crucial for enhancing detection algorithms and training methodologies.
Machines 13 00108 g019
Figure 20. This figure highlights the label distribution and bounding box dimensions for YOLOv9, emphasizing the model’s advancements in capturing defect sizes and accurately localizing them on turbine blades, thereby showcasing the improvements over YOLOv8 in handling defect dimensions and distribution.
Machines 13 00108 g020
Figure 21. Examples of defect detection using YOLOv9 in thermal images of wind turbine blades (WTBs). The first row corresponds to Blade 1, the second row to Blade 2, and the third row to Blade 3. Detected defects include holes, erosion, and cracks, demonstrating accurate localization and classification.
Machines 13 00108 g021
Table 1. Comparison of YOLO model versions.
ModelKey FeaturesAdvantagesLimitations
YOLOv1Single regression problem for object detection [14]Fast processing speed, real-time detectionLower accuracy compared to later versions
YOLOv2Batch normalization, high-resolution classifiers, new convolutional architecture [33]Improved accuracy over YOLOv1, retains high speedStill limited in handling small objects
YOLOv3Multi-scale predictions, deeper feature extractor (Darknet-53) [34]Better detection across various object sizes, improved balance of speed and accuracyIncreased computational complexity
YOLOv4Weighted Residual Connections (WRCs), Cross-Stage Partial (CSP) connections, Cross Mini-Batch Normalization (CmBN) [35]Enhanced robustness and generalization, effective across diverse scenariosLarger model size
YOLOv5Adaptive anchor box calculation, compound scaling, extensive data augmentation [39]Flexible architecture, ease of use, widely adoptedProprietary modifications, unofficial continuation
YOLOv6Optimized network structure for real-time performance [41]Improved speed–accuracy trade-off, efficient for real-time applicationsPrimarily focused on optimizing existing architectures
YOLOv7Improved feature extraction and fusion techniques [43]Higher detection precision, better performance in complex environmentsIncremental improvements over YOLOv6
YOLOv8 *FPN and PAN architectures, transfer learning [42]High accuracy, better handling of small objects, improved contextual feature informationHigher training complexity, requires fine-tuning
YOLOv9 *Programmable Gradient Information (PGI), Generalized Efficient Layer Aggregation Network (GELAN) [44]Advanced gradient handling, optimal balance of accuracy and speed, lightweightNewer model, requires more testing and validation
* Model versions used in this paper for object detection and localization.
Disclaimer/Publisher’s Note: The statements, opinions and data contained in all publications are solely those of the individual author(s) and contributor(s) and not of MDPI and/or the editor(s). MDPI and/or the editor(s) disclaim responsibility for any injury to people or property resulting from any ideas, methods, instructions or products referred to in the content.

