Abstract
There has been a growth of collaborative robots in Industry 5.0 due to the research in automation involving human-centric workplace design. It has had a substantial impact on industrial processes; however, physical exertion in human workers is still an issue, requiring solutions that combine technological innovation with human-centric development. By analysing real-world data, machine learning (ML) models can detect physical fatigue. However, sensor-based data collection is frequently used, which is often expensive and constrained. To overcome this gap, synthetic data generation (SDG) uses methods such as tabular generative adversarial networks (GANs) to produce statistically realistic datasets that improve machine learning model training while providing scalability and cost-effectiveness. This study presents an innovative approach utilising conditional GAN with auxiliary conditioning to generate synthetic datasets with essential features for detecting human physical fatigue in industrial scenarios. This approach allows us to enhance the SDG process by effectively handling the heterogeneous and imbalanced nature of human fatigue data, which includes tabular, categorical, and time-series data points. These generated datasets will be used to train specialised ML models, such as ensemble models, to learn from the original dataset from the extracted feature and then identify signs of physical fatigue. The trained ML model will undergo rigorous testing using authentic, real-world data to evaluate its sensitivity and specificity in recognising how closely generated data match with actual human physical fatigue within industrial settings. This research aims to provide researchers with an innovative method to tackle data-driven ML challenges of data scarcity and further enhance ML technology’s efficiency through training on SD. This study not only provides an approach to create complex realistic datasets but also helps in bridging the gap of Industry 5.0 data challenges for the purpose of innovations and worker well-being by improving detection capabilities.
1. Introduction
Over the decades, researchers have extensively studied fatigue, commonly described as a decline in mental and physical body strength due to factors such as mental stress, physical exertion, circadian rhythm disruption, and illness [1]. However, even with extensive research, no universally accepted definition of fatigue exists, and it varies according to its application and the researcher’s understanding. The main obstacles to a single definition include its multidimensional nature, the interaction of numerous variables (including confounding factors), and the often subjective nature of fatigue [2].
The Industrial Revolution 5.0 (I5.0) has ushered in an era of advanced intelligent agent systems, sensing devices, and automation. Increased automation has led to the widespread adoption of robotic systems and virtual assistance in manufacturing and warehousing operations. This new era emphasises the role of highly skilled individuals who benefit from technological advancements [3]. Consequently, human-in-the-loop technology has evolved, leading to the rapid development of collaborative robots (cobots). Although automation has reached new heights in industries such as aeronautics, medical and pharmaceuticals, and manufacturing, it still involves highly fatiguing tasks [4]. Workplace fatigue is a multifaceted issue that significantly impacts worker productivity. Even though cobots are designed to alleviate human workload and enhance performance, the repetitive physically demanding daily tasks contribute to fatigue. Addressing occupational fatigue is vital to overcome the consequences on health and safety which range from short to long term.
To address human fatigue, ML has emerged as one of the promising approaches by researchers to comprehend physical fatigue’s development in an individual [5,6]. This approach involves leveraging ML algorithms to discover and observe various patterns in fatigue-related data. These patterns are derived from several physiological, behavioural and demographic parameters of an individual.
ML provides the ability for intelligent systems to autonomously handle activities, driving forward the industrial revolution. By leveraging high-performing computing, modern modelling, and simulations, ML has become a crucial tool for managing and analysing vast amounts of data [7]. However, it is crucial to acknowledge that machine learning does not always solve problems or provide the best solutions [8]. Despite artificial intelligence’s golden era, there are still many challenges in the development and application of machine learning technology [9]. As the field continues to progress, overcoming the challenges which are stated below will be vital to fully realise machine learning’s potential and its transformative effects across various industries. ML models substantially depend on the quality of data for training, validating, and testing models as it plays a crucial role in determining the performance and effectiveness of the model [10]. However, obtaining human physical and behavioural data in an occupational setting for machine learning algorithms can have several challenges such as how intrusive are sensors, comfort, human cooperation for the full length of the experiment, etc. The process of data collection and annotation is both time-consuming and expensive [11], leading to several issues. Since ML is significantly dependent on data, some of the primary issues it faces include:
Data Quality: Ensuring high-quality data is a significant challenge for machine learning professionals. Poor-quality data can result in incorrect predictions due to confusion and misinterpretation [12]. Data Limitations: A significant part of the modern AI problem is the lack of sufficient data: either there are too few available datasets or manual labelling is prohibitively expensive [13,14]. Data Privacy and Equality: Many datasets cannot be publicly released due to privacy and fairness concerns. In such cases, generating synthetic data can be very beneficial [8,15].
Addressing these challenges will be critical to unlocking machine learning’s full potential and its transformative impact on various industries. This paper aims to investigate the intricacy of fatigue-related data by considering its multidimensional nature and subjective analysis. By emphasising the importance of synthetic data generation this research seeks to better comprehend fatigue and to develop interventions.
In response, this paper explores the generation of synthetic tabular data and human physical fatigue datasets, addressing inherent challenges. Generally, synthetic data are defined as artificially interpreted information generated by computer algorithms or simulations which replicate real-world data [15]. In many situations, SDG is unavoidable when real-life data are either unobtainable or must be kept private due to privacy risks [16,17,18]. This technology is widely used in several sectors, including healthcare, business, manufacturing, and agriculture, with demand increasing exponentially [14].
It acknowledges the advantages of synthetic data, emphasising cost-efficiency and ethical considerations while recognising challenges such as complexity preservation and the need for discipline-specific knowledge. In this paper, Methodology Section 3 introduces a deep learning conditional generative model for synthetic tabular data generation, which trains the data with the conditions applied, emphasising statistical likeliness and personal data safeguarding. The section also sheds light on the steps involved in preprocessing for compatibility, handling missing values, feature generation, and scaling. Keeping in mind the issues with collecting real-world human physical fatigue data and the benefits of SDG, this research explores the possibilities. Hence, related studies Section 2 examines notable studies conducted for SDG in the medical and finance sectors.
2. Related Studies
The Introduction provides a glimpse into the challenges of human fatigue detection, which relies on wearable sensors and ML to monitor physiological signs. It is important to highlight that ML requires vast, high-quality datasets, which are costly and difficult to obtain [19]. However, it is vital to consider the challenges that come along with it, e.g., privacy concerns, limited data access, etc. Addressing these issues can improve the reliability and effectiveness of fatigue detection. This is the stage at which SDG can be employed to overcome these challenges [20].
Synthetic data generation (SDG) definitions and relevance: SDG is a promising substitute for obtaining popularity. These techniques generate fictional datasets that replicate real-world data statistics [21]. The development of synthetic data holds promise in overcoming constraints linked to the conventional use of real data, providing avenues for the advancement of approaches for detecting physical fatigue in humans. Synthetic data are defined as data artificially generated by employing a model designed to replicate real data based on their distributions, such as shape, variance, and structure, including correlations among attributes [22]. Additionally, before being implemented, SDG techniques must be evaluated for anonymity, similarities (quality of SD representation of real data), effectiveness (practicality of statistical inferences from SD or results from SD-trained ML models), and performance parameters (size, generation time, and computational resources) [23].
Different generative models: Regarding generating synthetic datasets, the generative adversarial network (GAN) model has gained significant popularity among researchers, emerging as an optimistic alternative technique to address the need. GANs are renowned for their capability to produce diverse statistically realistic multimodal and multidimensional datasets [15]. Recent studies, such as Al-Qerem et al. [24], have demonstrated the effectiveness of combining GAN models with the recursive feature elimination (RFE) technique to enhance SDG for multidimensional imbalanced datasets. Furthermore, Saravana Kumar’s investigative approach in 2017 meticulously examined several GAN models to evaluate their performance. Empirical evidence from this comparative analysis highlighted the superior efficacy of the PATECTGAN and CTGAN models [25].
SDG in the healthcare domain: The utilisation of SDG has primarily been undertaken in the context of medical-related data [8,23,26,27]. This preference is driven by the inherently multidimensional, discrete, and multimodal characteristics of medical data, which frequently present significant imbalances as well as privacy preservation concerns. One of the studies aimed at SDG through existing medical datasets for improving the prediction of fluid consumed by patients in ICUs. In this study, four machine learning algorithms were developed and trained using both original and synthetic datasets, leading to enhanced model performance [28]. For example, the study addresses the challenges associated with applying machine learning to medical and cancer research by using the SMOTE algorithm for SDG. SMOTE has limitations as it is not suitable for categorial data and fatigue data are heterogeneous, including categorial data. Our approach attempts to overcome these challenges. Furthermore, authors of another study systematically examined three categories of synthetic data generation techniques. They employ various metrics to evaluate the quality of the datasets generated, which are derived from publicly accessible cancer registry data [29]. The findings indicate that synthetic data can effectively mitigate common obstacles in medical research, thus supporting the broader application of machine learning in this field.
SDG in different occupational data: Addressing these challenges, synthetic data generation has the potential to advance medical research and significantly improve predictive modelling in healthcare. However, minimal research has been focused on generating data related to human physical fatigue. As aforementioned, they are inherently multidimensional and highly subjective. One study conducted by Lacasa et al. [30] explored SDG techniques for treating chronic fatigue through a questionnaire dataset. This research highlighted the potential benefits of using synthetic data in this specific medical context, and it created different questionnaires for subjective analysis. Researchers attempted to apply synthetic data generation within an industrial setting in a more recent study. They aimed to generate synthetic data through RGB image creation for human–object interaction scenarios [31]. Despite these efforts, the limitations of synthetic data generation are evident. Current research predominantly focuses on image generation, neglecting the challenges associated with tabular, structured, and categorical datasets. Although an attempt was made to investigate and predict lower limb kinetics and kinematics during gait, Mundt et al. [32] combined experimentally recorded IMU data from a smaller subject cohort with simulated archived IMU data from a MOCAP database. Although it did not improve joint kinetics predictions, adding the simulated data to the training set decreased the root mean square error in estimating joint kinematics. It demonstrates that the standalone model is incapable of improving ML modelling. In our approach, we are using a diffusing model. In recent years, researchers have tried to adapt an alternative approach with a new principle of generative models, namely diffusion models [33]. They are mainly used for image generation or handling computer-vision-type data points [34]. However, they do have some limitations like computation burden and low speed due to the number of steps involved. This gap illustrates the scarcity of available datasets and the absence of comprehensive multimodal fatigue synthetic/fake datasets for industrial scenarios. Such datasets are crucial for training data-intensive models, including deep learning models.
The lack of research in this area underscores the need for more comprehensive approaches to synthetic data generation that address structured, multimodal, and multidimensional heterogeneous data challenges. Developing effective synthetic datasets for human fatigue can support the creation of robust predictive models, thereby enhancing safety, performance, and overall well-being in various industrial contexts. Expanding the scope of synthetic data generation to include diverse and complex datasets will be essential for advancing the application of machine learning in understanding and mitigating human physical fatigue. This paper presents a comprehensive methodology that utilises deep learning techniques to generate synthetic realistic tabular data, effectively addressing the challenges. The proposed approach leverages advanced deep machine learning algorithms to simulate data to closely mimic the individual characteristics and distributions of real tabular data. By focusing on tabular data, which are often used in various applications across industries, this methodology aims to overcome common obstacles such as data scarcity, imbalance, and privacy concerns. The robust nature of this approach ensures that the generated datasets are not only accurate and reliable but also versatile enough to be applied in diverse scenarios, enhancing the potential for research and development in fields that require premium quality data for training ML models.
3. Methodology
This section is organised into subheadings that detail the methodology employed for generating synthetic data using a deep learning model. It offers clear and precise descriptions of the methodology, the preprocessing procedures, and the evaluation methods, providing an overview of the entire process to be utilised.
3.1. Synthetic Data Generation Framework
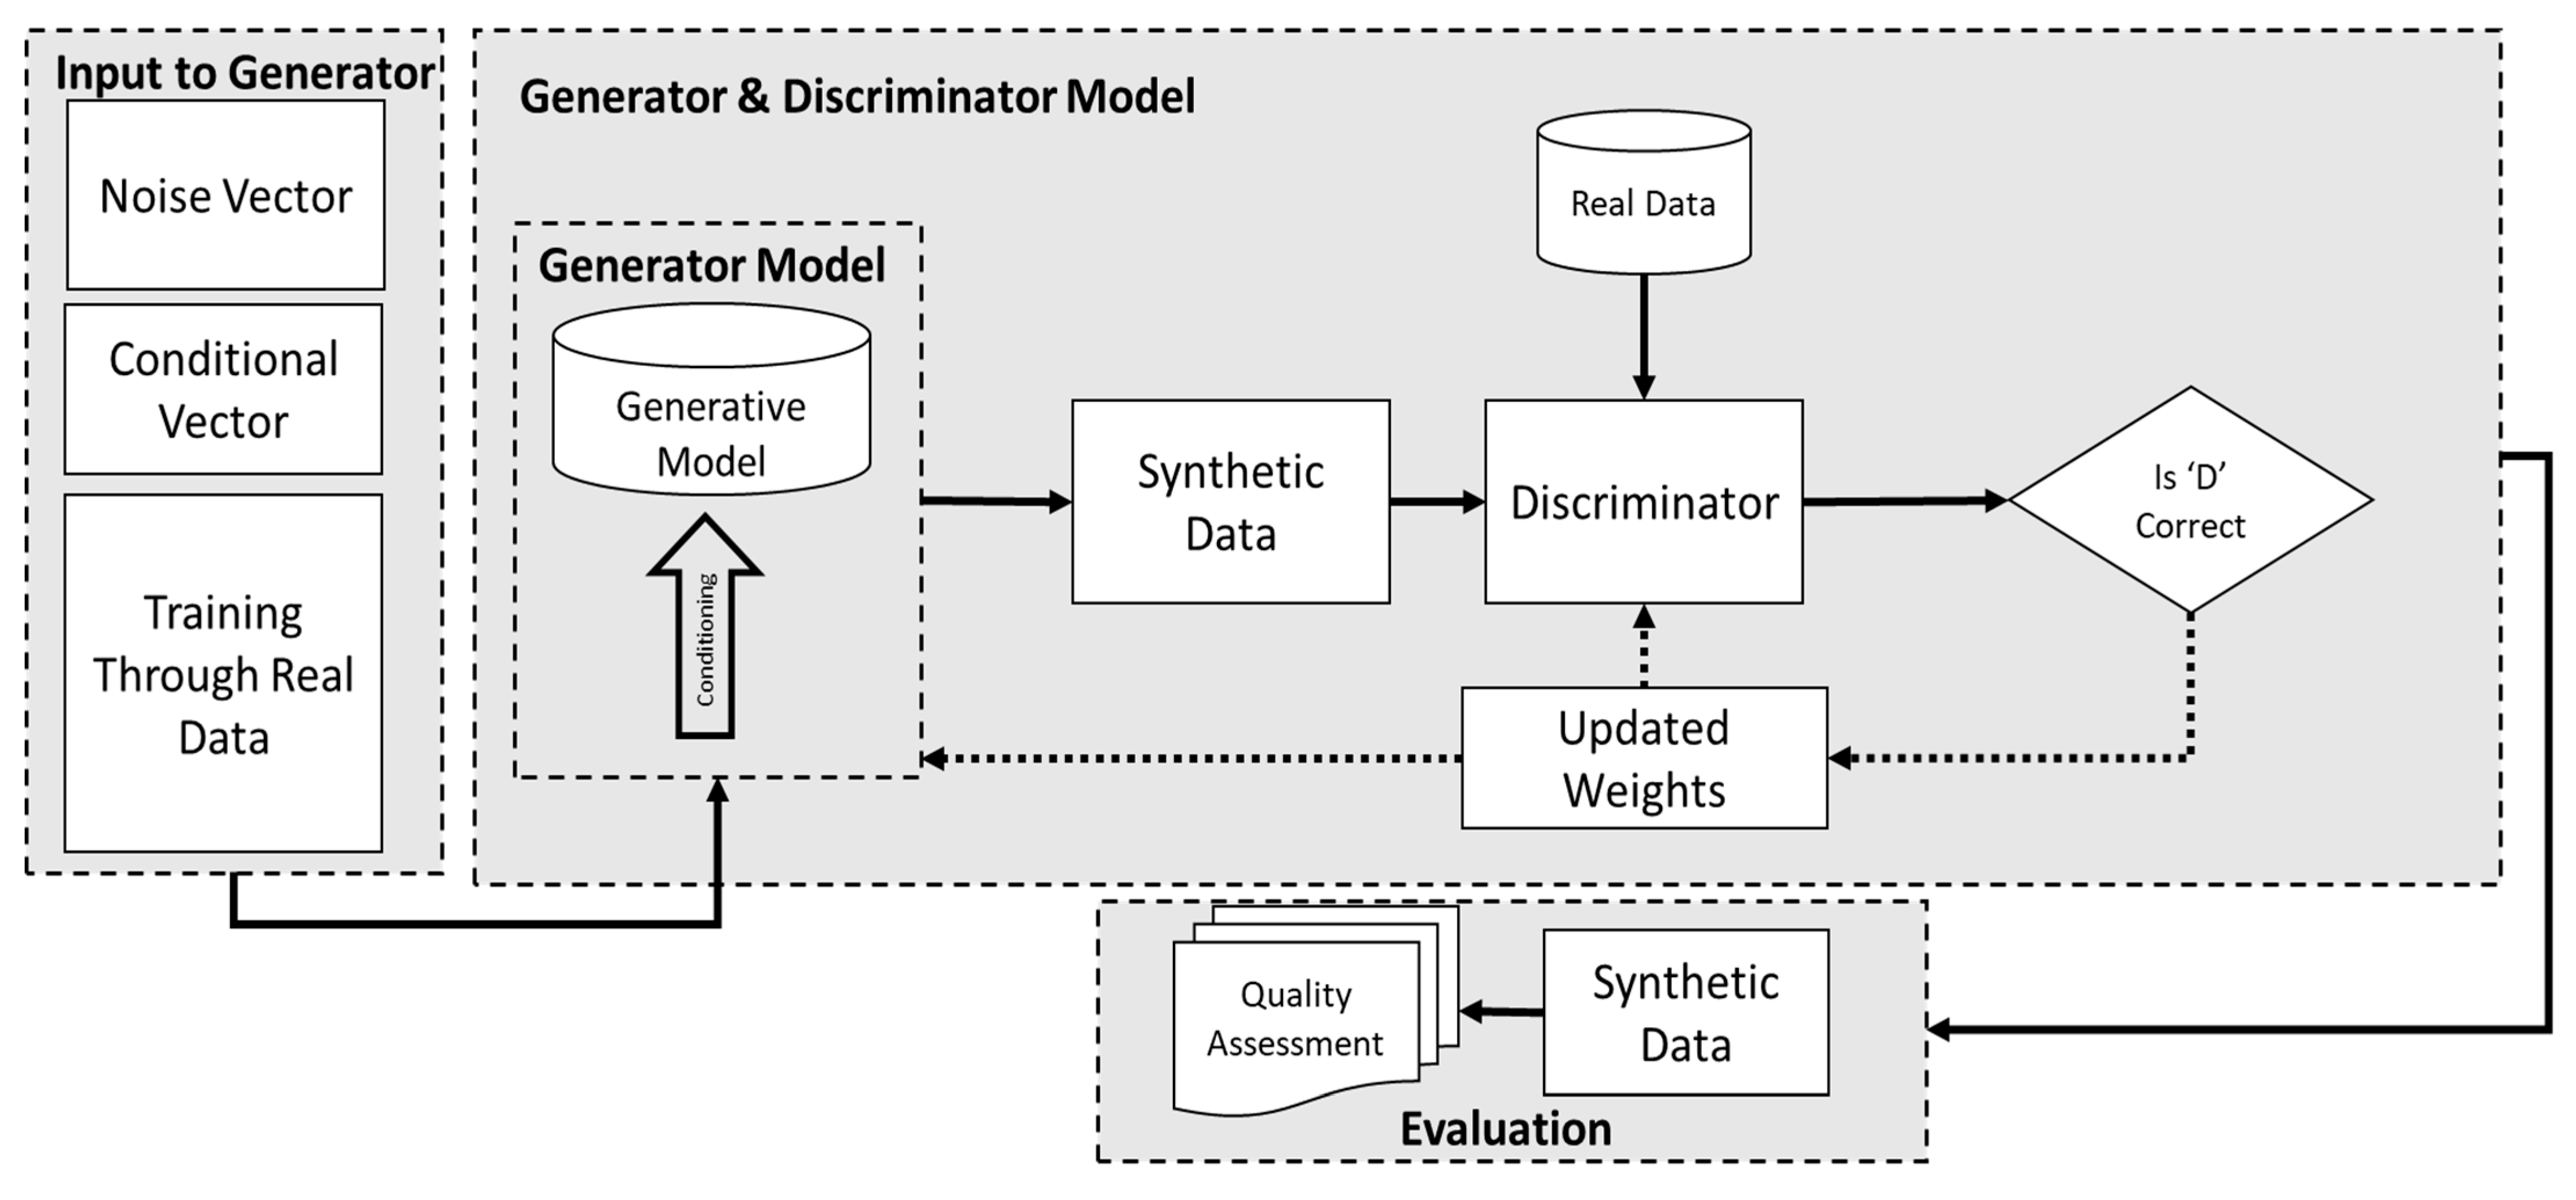
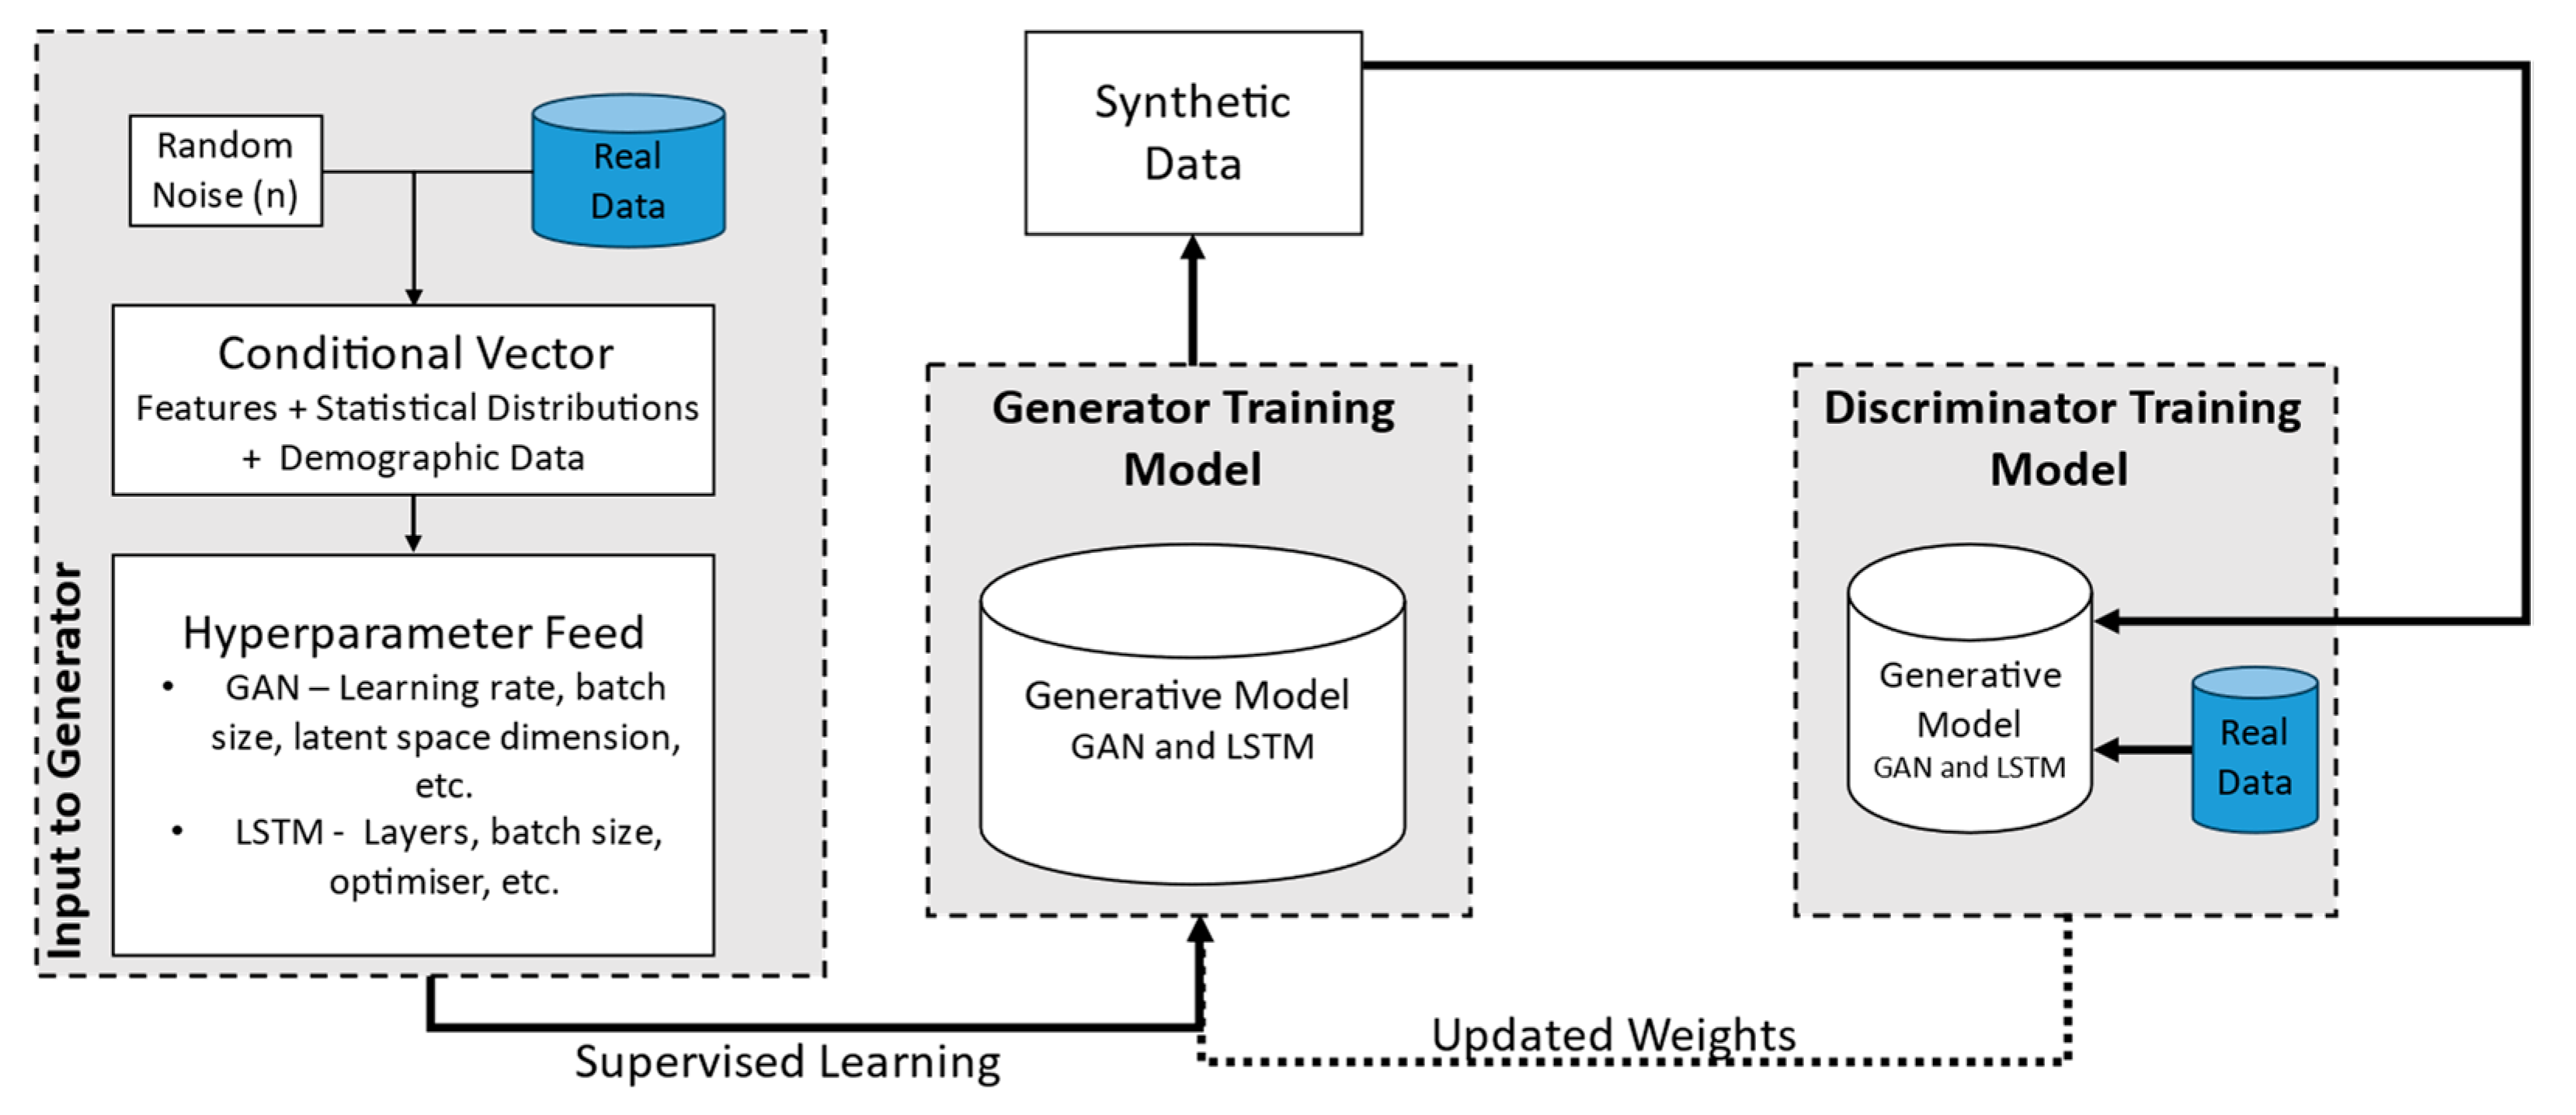
Figure 1 demonstrates the general structure employed to generate human physical synthetic fatigue datasets. This framework depicts GAN deep learning models utilised for synthetic data generation (SDG). Central to our methodology is the generative adversarial network (GAN) architecture, which consists of two main components, a generator model for generating and a discriminator model for evaluating the generated data. The primary GAN models used in this study are the conditional GAN and tabular LSTM GAN. These adversarial networks were selected due to their ability to train generator GANs using conditional vectors, effectively addressing challenges related to controlling generated data and managing imbalanced, multimodal, and multidimensional tabular data [24]. The generator model’s capability is enhanced to produce realistic statistical tabular data, thereby stabilising ML model training and improving its accuracy. The training procedure involves preprocessing raw data, feature generation and selection, hyperparameter optimisation, regularisation techniques, and continuous convergence monitoring by utilising the models, as depicted in Figure 1.
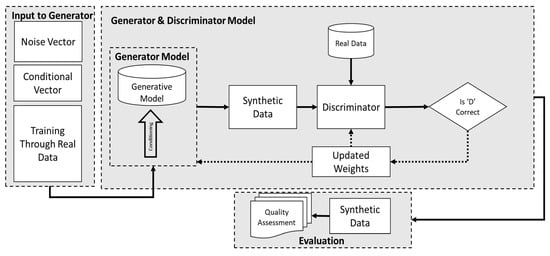
Figure 1.
A framework of the deep learning conditional GAN ML model used for SDG.
The generator model uses a fixed-length random conditional and noise vector which are drawn from multivariate normal distributions for generating samples within specified conditions. This vector serves as the seed for the conditional vector provided to the generative process, establishing a compressed representation and a latent space containing latent variables critical for the domain. On the contrary, the discriminator evaluates how authentic are generated examples, distinguishing between actual and generated data. After training, the generator, having effectively developed feature selection capabilities, can repurpose its feature selection from the input data by updating weights from the discriminator’s input.
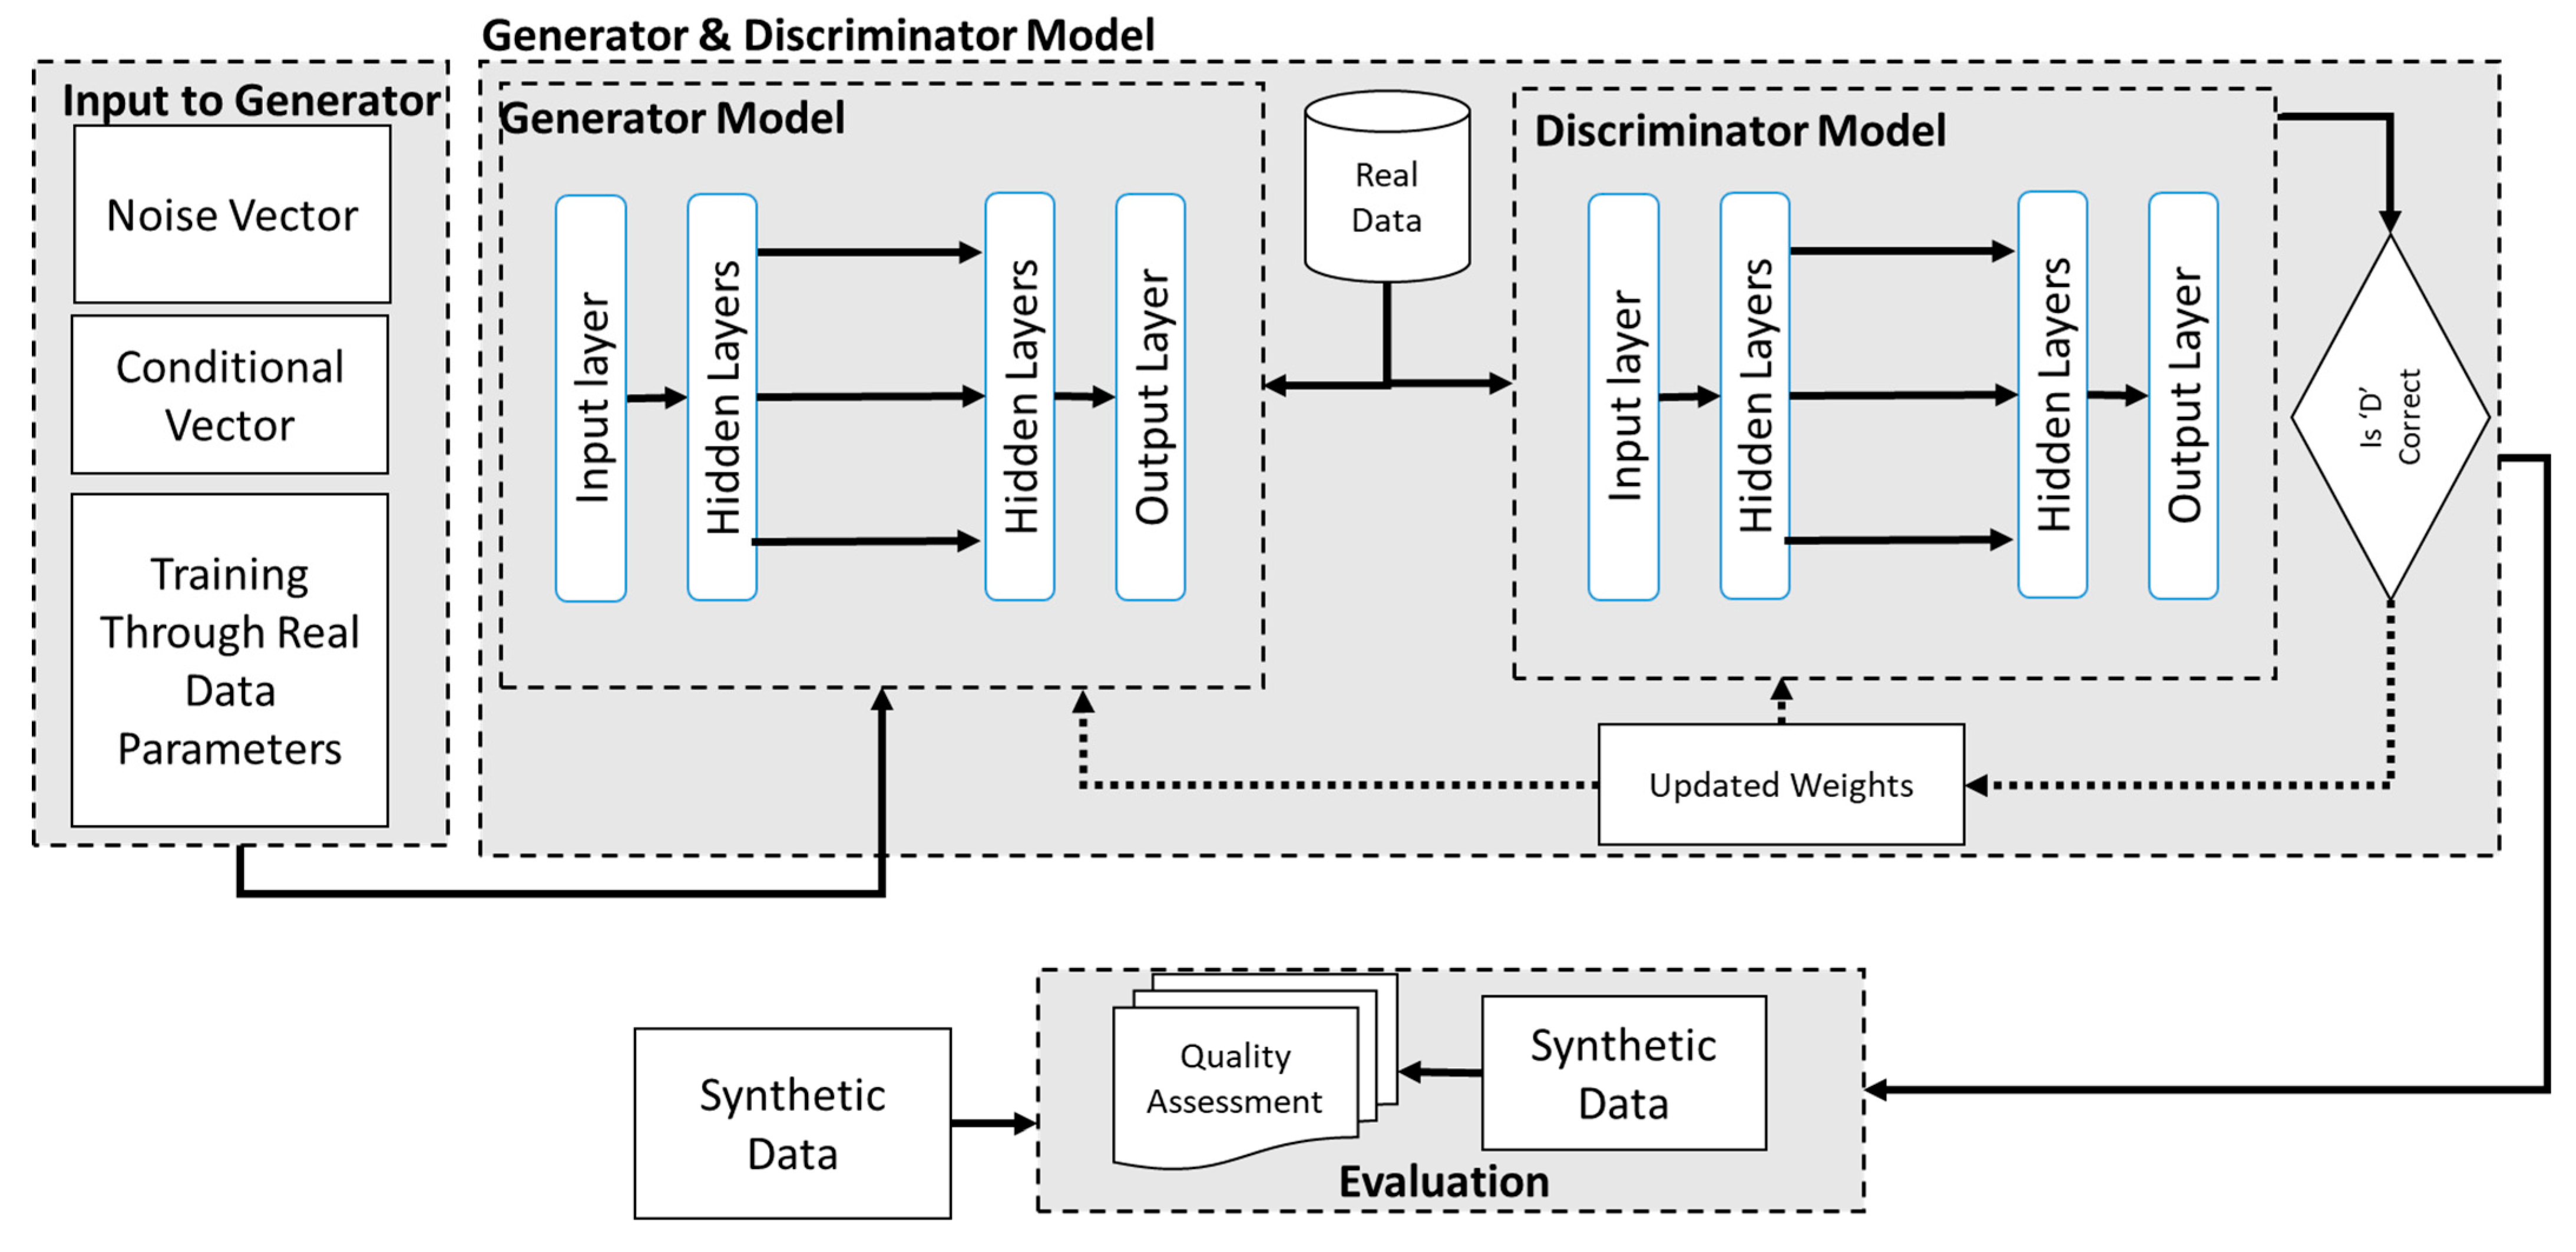
Figure 2 presents the architecture utilised for producing the SDG with the tabular LSTM GAN. As shown in Figure 2, it uses a similar principle as mentioned above in the conditional GAN except for the changes found in the working. The tabular LSTM model also uses a generator and discriminator model except it is inspired by the original LSTM architecture which uses different layers to generate synthetic data. In this model approach it uses an input layer which is fed with noise, a conditional vector, and real data to learn from. This is then supplied to the input layers with different activation functions such as ‘ReLU’ and these hidden layers then produce the SD and then supply it to the discriminator. The discriminator also contains similar layers which then assign weight and classify the generated sample with the original data and then automatically update the weight until a realistic SD is generated. Both the conditional GAN and LSTM GAN are trained and evaluated on similar principles.
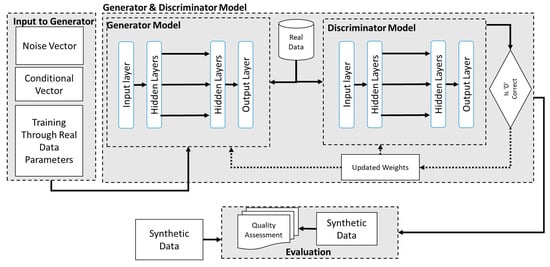
Figure 2.
Tabular LSTM GAN SDG Architecture.
We employed principal component analysis (PCA) scatter plots, field distribution stability, and distribution density analysis to quantitatively evaluate the performance of the generated synthetic data. These metrics include similar indices to assess the dataset diversity and similarity between synthetic and original datasets. Additionally, various classifiers, such as wrappers, filters, and ensemble models, were used to classify fatigue and non-fatigue states through training on synthetic data and evaluating original data, demonstrating improvements achieved through synthetic data. Therefore, this study advocates using SDG to address ML model data challenges.
3.2. Model Training for Synthetic Data Generation
3.2.1. Data Gathering for Synthetic Data Generation (SDG)
The initial phase of our study involves the meticulous acquisition of relevant data necessary for SDG. These data are vital for two purposes: (a) testing the generated synthetic data; (b) training the machine learning model on a combination of real and synthetic datasets. For this research, we sourced data from open-source repositories with a specific focus on detecting human physical fatigue [35]. The data collection involved multiple modalities, including electromyography (EMG), inertial measurement units (IMUs), and photoplethysmography (PPG). Additionally, self-reported assessments were conducted using the Borg Rating of Perceived Exertion and the Karolinska Sleepiness Scale. These were supplemented by demographic information, anthropometric measurements, and maximum voluntary isometric contraction (MVIC) force measurements.
However, for the scope of this study, we concentrated on utilising EMG, IMU, and Borg test data. EMG data provide insights into muscle activity, IMU data capture motion and orientation, and Borg test data offer subjective assessments of exertion levels. This multifaceted approach ensures a comprehensive understanding of physical fatigue.
The dataset includes six datasets for six different activities specifically chosen to reflect various physical exertion scenarios. These activities comprise three internal (IR) and three external (ER) shoulder and hand movements, performed at different flexion levels: 30–40% (T1IR, T4ER), 40–50% (T2IR, T4ER), and 50–60% (T3IR, T6ER), where ‘T’ represents a task [20]. These particular movements were selected to mimic a wide range of physical exertion activities, thereby representing a diverse industrial workforce [35]. The data capture a broad spectrum of exertion levels by incorporating these specific activities, ensuring their applicability to real-world industrial settings.
This thorough data collection process provided a robust foundation for training and testing our machine learning models. The detailed raw data from EMG, IMU, and Borg assessments allow for the creation of synthetic datasets that closely mimic real-world conditions. Consequently, this enhances the reliability and validity of our models in detecting and analysing human physical fatigue in various industrial contexts.
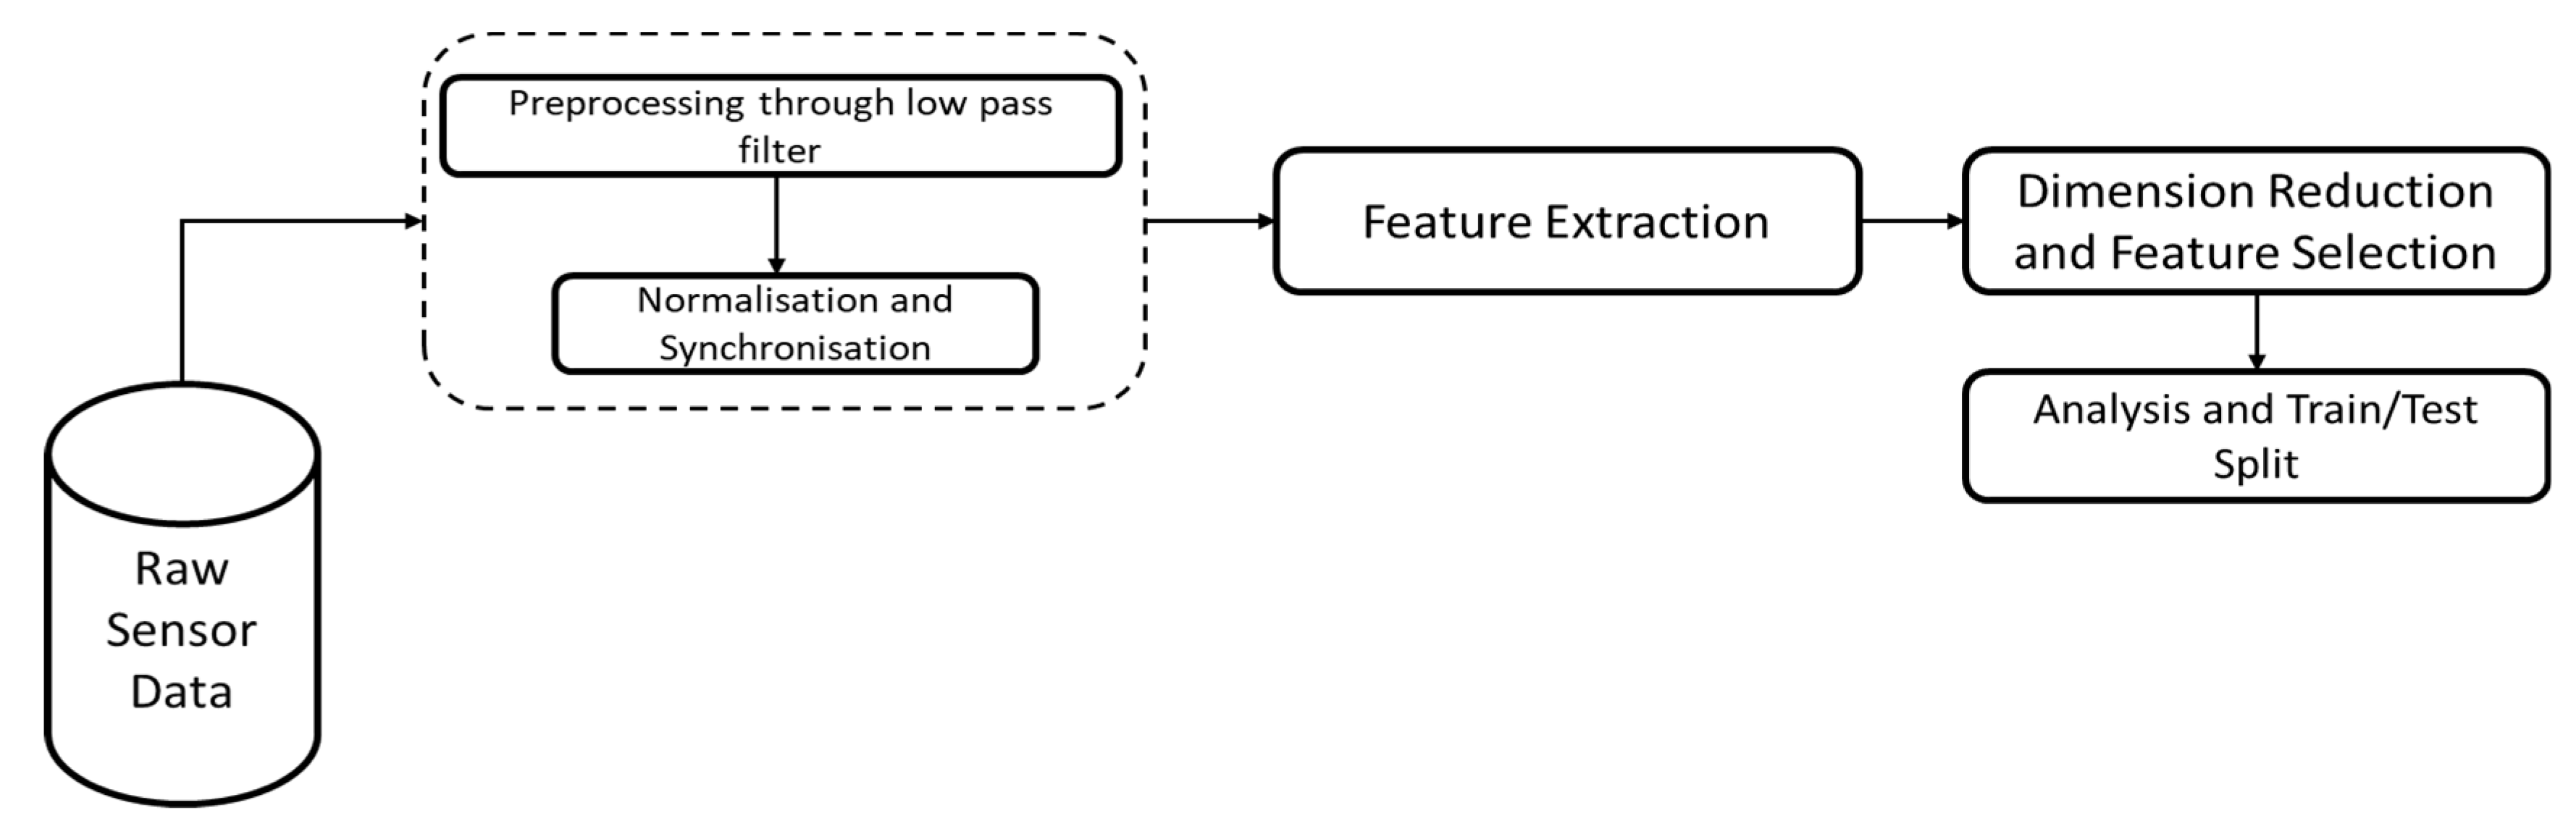
3.2.2. Data Preparations for SDG
SDG’s next step includes data preparation. In order to manage any errors within the datasets, techniques such as handling missing values, normalisations, etc. are employed. The general process for the data preparation is shown in Figure 3.

Figure 3.
Process for Data preparation—Feature Extraction for SDG.
Raw Sensor Data Preprocessing: The initial phase of our methodology involves the meticulous cleaning and analysis of raw sensor data to ensure their accuracy and integrity. Biomechanical and physiological sensor data undergo several essential cleaning steps. Firstly, a low-pass filter is applied to the EMG and IMU data to remove noise. Subsequently, the cleaned data are visualised to identify and rectify any additional erroneous data that automated filtering might have missed, such as faulty sensor values that are excessively high or low and participants who did not experience fatigue according to their subjective fatigue ratings. The next step involves synchronising data from different sensors, ensuring temporal alignment, and eliminating observations captured outside the experimental window. Although the data in this study were already synchronised, this step is crucial for other researchers. Finally, the normalisation of EMG and IMU data is performed to standardise the data, facilitating accurate analysis and comparison. This comprehensive data preprocessing ensures the robustness and reliability of the datasets used in subsequent study phases.
Feature Extraction: A critical step in sensor data analysis, as it allows for identifying and utilising relevant data characteristics that enhance the performance of machine learning models. The features extracted in this study are chosen based on their computational efficiency and proven effectiveness in previous research. Table 1 gives a brief presentation of the features extracted [36,37].

Table 1.
The features extracted from EMG and IMU sensors.
For electromyography (EMG) data, two types of features are extracted: time-domain features and frequency-domain features. Time-domain features include the mean absolute value (MAV), root mean square (RMS), zero crossing (ZC), slope sign changes (SSC), waveform length (WL), variance, and integrated EMG (IEMG). These features provide valuable insights into the signal’s amplitude and temporal characteristics. Frequency-domain features are extracted using the fast Fourier transform (FFT) and include mean frequency (MNF) and median frequency (MDF). These features capture the signal’s spectral content, offering a perspective complementary to the time-domain features.
For inertial measurement unit (IMU) data, the extracted features include the mean, standard deviation, maximum and minimum values, range, mean absolute deviation (MAD), and root mean square (RMS). These features are selected for their ability to succinctly represent the distribution and variability of the IMU signals, which are critical for assessing movement and orientation.
Feature Selection and Dimension Reduction: In this study, multiple features will be extracted during the feature extraction steps, utilising features that summarise the profiles based on non-overlapping time windows from 34 subjects. The selection of the time window length should depend on (a) the task cycle length, (b) the impact of fatigue on workers and production, and (c) balancing the trade-off between false alarms and early detection [38]. The computational complexity of training an ML model rises when the number of potential features is too many. Therefore, feature reduction becomes necessary to decrease computational complexity and, thus, enhance prediction performance and improve generalisation capability. The ultimate aim of the proposed framework is to diagnose fatigue and recommend appropriate interventions.
We employ a two-step approach based on Blum and Langley [39] for feature selection and reduction. A correlation analysis is conducted to remove features that do not change between fatigued and non-fatigued states. Subsequently, we apply various wrapper and embedded methods to select the best-performing features. We use support vector machines (SVM), logistic regression, and neural networks in the wrapper method. In the embedded method, we utilise LASSO and random forest algorithms. Random forests provided the most effective feature selection and dimension reduction among these. Preference was given to techniques that yielded fewer, more interpretable features with high prediction performance and low false alarm rates. This process led to the selection of 50 features across six datasets, forming the basis for synthetic data generation (SDG) in a tabular format.
3.2.3. Model Training for SDG
Following data preparation, the subsequent step involves training the selected models, specifically the conditional GAN. Although their training methodologies are similar, each model has distinctive characteristics. For example, a 2-layer LSTM generator makes up the framework of the conditional GAN, while a 4-layer perception (MLP) with various optimisers and activation functions serves as the discriminator. To avoid overfitting, dropout layers are introduced into both the generator model and the discriminator model through multiple epoch training.
The GAN training process with conditions necessitates a more supervised environment beyond the standard training algorithm, as seen in Figure 4. This is achieved by finding a random sample from the real dataset and looping through each epoch training. Adversarial training is employed for both models to train various generator and discriminator models. Additionally, optimisation strategies are explored to enhance the efficiency of the GAN process.
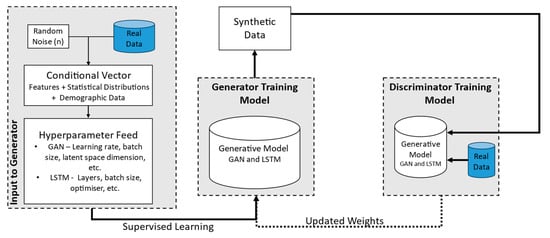
Figure 4.
Training Model Diagram.
The process of generating synthetic data using a deep learning conditional GAN modelling technique involves several steps, as depicted in the provided diagram (Figure 1). Initially, the procedure begins with the input to the generator, which includes three main components: a noise vector, a conditional vector, and real data for training. The noise vector is a randomly generated seed that initiates the generative process, providing the necessary randomness for data generation. The conditional vector supplies additional information or constraints to guide the generator, ensuring that the synthetic data meet specific requirements or mimic certain characteristics of the real data. Training through real data involves feeding actual data into the system to condition and improve the generator’s output.
The generator model is central to this methodology. It leverages noise and conditional vectors to create synthetic data that closely duplicate real data. The generative model processes these inputs and produces synthetic data intended to be indistinguishable from actual data. In the conditioning process, the generator incorporates features and patterns from the real data. In our case, two main condition constraints are used for the generator. First, the number of rows of data created per participant should not diminish or shorten in the case of target variables (e.g., subject, age, etc.). Second, for predictor variables, which are features for classifying and predicting fatigue, the eigenvalues of the covariance matrices for each subject are checked to ensure they are all positive. Positive eigenvalues are necessary for generating synthetic data using the multivariate normal distribution, as they ensure the covariance matrix is valid and the synthetic data will have realistic variability.
Once the generator produces synthetic data, they are evaluated by the discriminator model. The discriminator also receives real data for comparison purposes. Its role is to assess synthetic data and determine their authenticity, distinguishing between real and generated data. The discriminator outputs a judgment on whether the data are real or synthetic, and based on its accuracy, the weights of both the generator and discriminator are updated. This feedback loop continues iteratively: the generator learns to produce more realistic data, and the discriminator becomes better at detecting synthetic data.
In the final implementation, the dataset is loaded into a panda data frame for processing, which is crucial for subsequent data manipulation and analysis. Next, the eigenvalues of the covariance matrices for each subject are checked to ensure they are all positive. Following this, synthetic data generation is performed using the mean and covariance matrix of the features for each subject and fatigue condition. During this step, a small regularisation factor is added to the covariance matrix to handle any potential numerical instability, ensuring the robustness of the synthetic data by preventing the covariance matrix from becoming ill-conditioned. Finally, all the generated synthetic data are combined into a single data frame. This consolidated dataset is then saved as a CSV file, making it ready for further analysis and use in training machine learning models. This detailed and methodical approach ensures that the generated synthetic data maintain statistical properties similar to the real data, facilitating effective training and evaluation of machine learning models.
In summary, the process of generating synthetic data using a GAN involves meticulous preparation and conditioning of input data, iterative improvement of the generator and discriminator models through feedback, and rigorous quality assessment to ensure the synthetic data closely duplicate real data. This comprehensive approach ensures that the generated synthetic data are both realistic and useful for various applications in machine learning and data analysis.
3.2.4. Evaluation of GAN Algorithm for SDG
The conditional GAN model, an evolution of the well-established GAN framework, introduces algorithmic enhancements that significantly improve efficiency, accuracy, and capabilities of generating with given conditions. However, a pertinent question arising from this exploration is how it would impact or affect the performance of ML algorithms when using synthetic data.
Evaluating the synthetic data generated by the deep learning models involves a meticulous comparison with the original training data to ensure their validity and effectiveness. This evaluation process employs both quantitative and qualitative metrics. Quantitative analysis includes statistical measures such as principal component analysis (PCA) scatter plots, distribution density analysis, and field distribution stability. These metrics assess the diversity and distributional similarity between synthetic and real data, ensuring the synthetic data retain the intrinsic properties of the original dataset. Furthermore, the synthetic data must be evaluated for their capability to reflect fatigue accurately. This involves training machine learning models on synthetic data and subsequently testing them with actual data. This approach helps in evaluating fatigue and supports the generation of synthetic data.
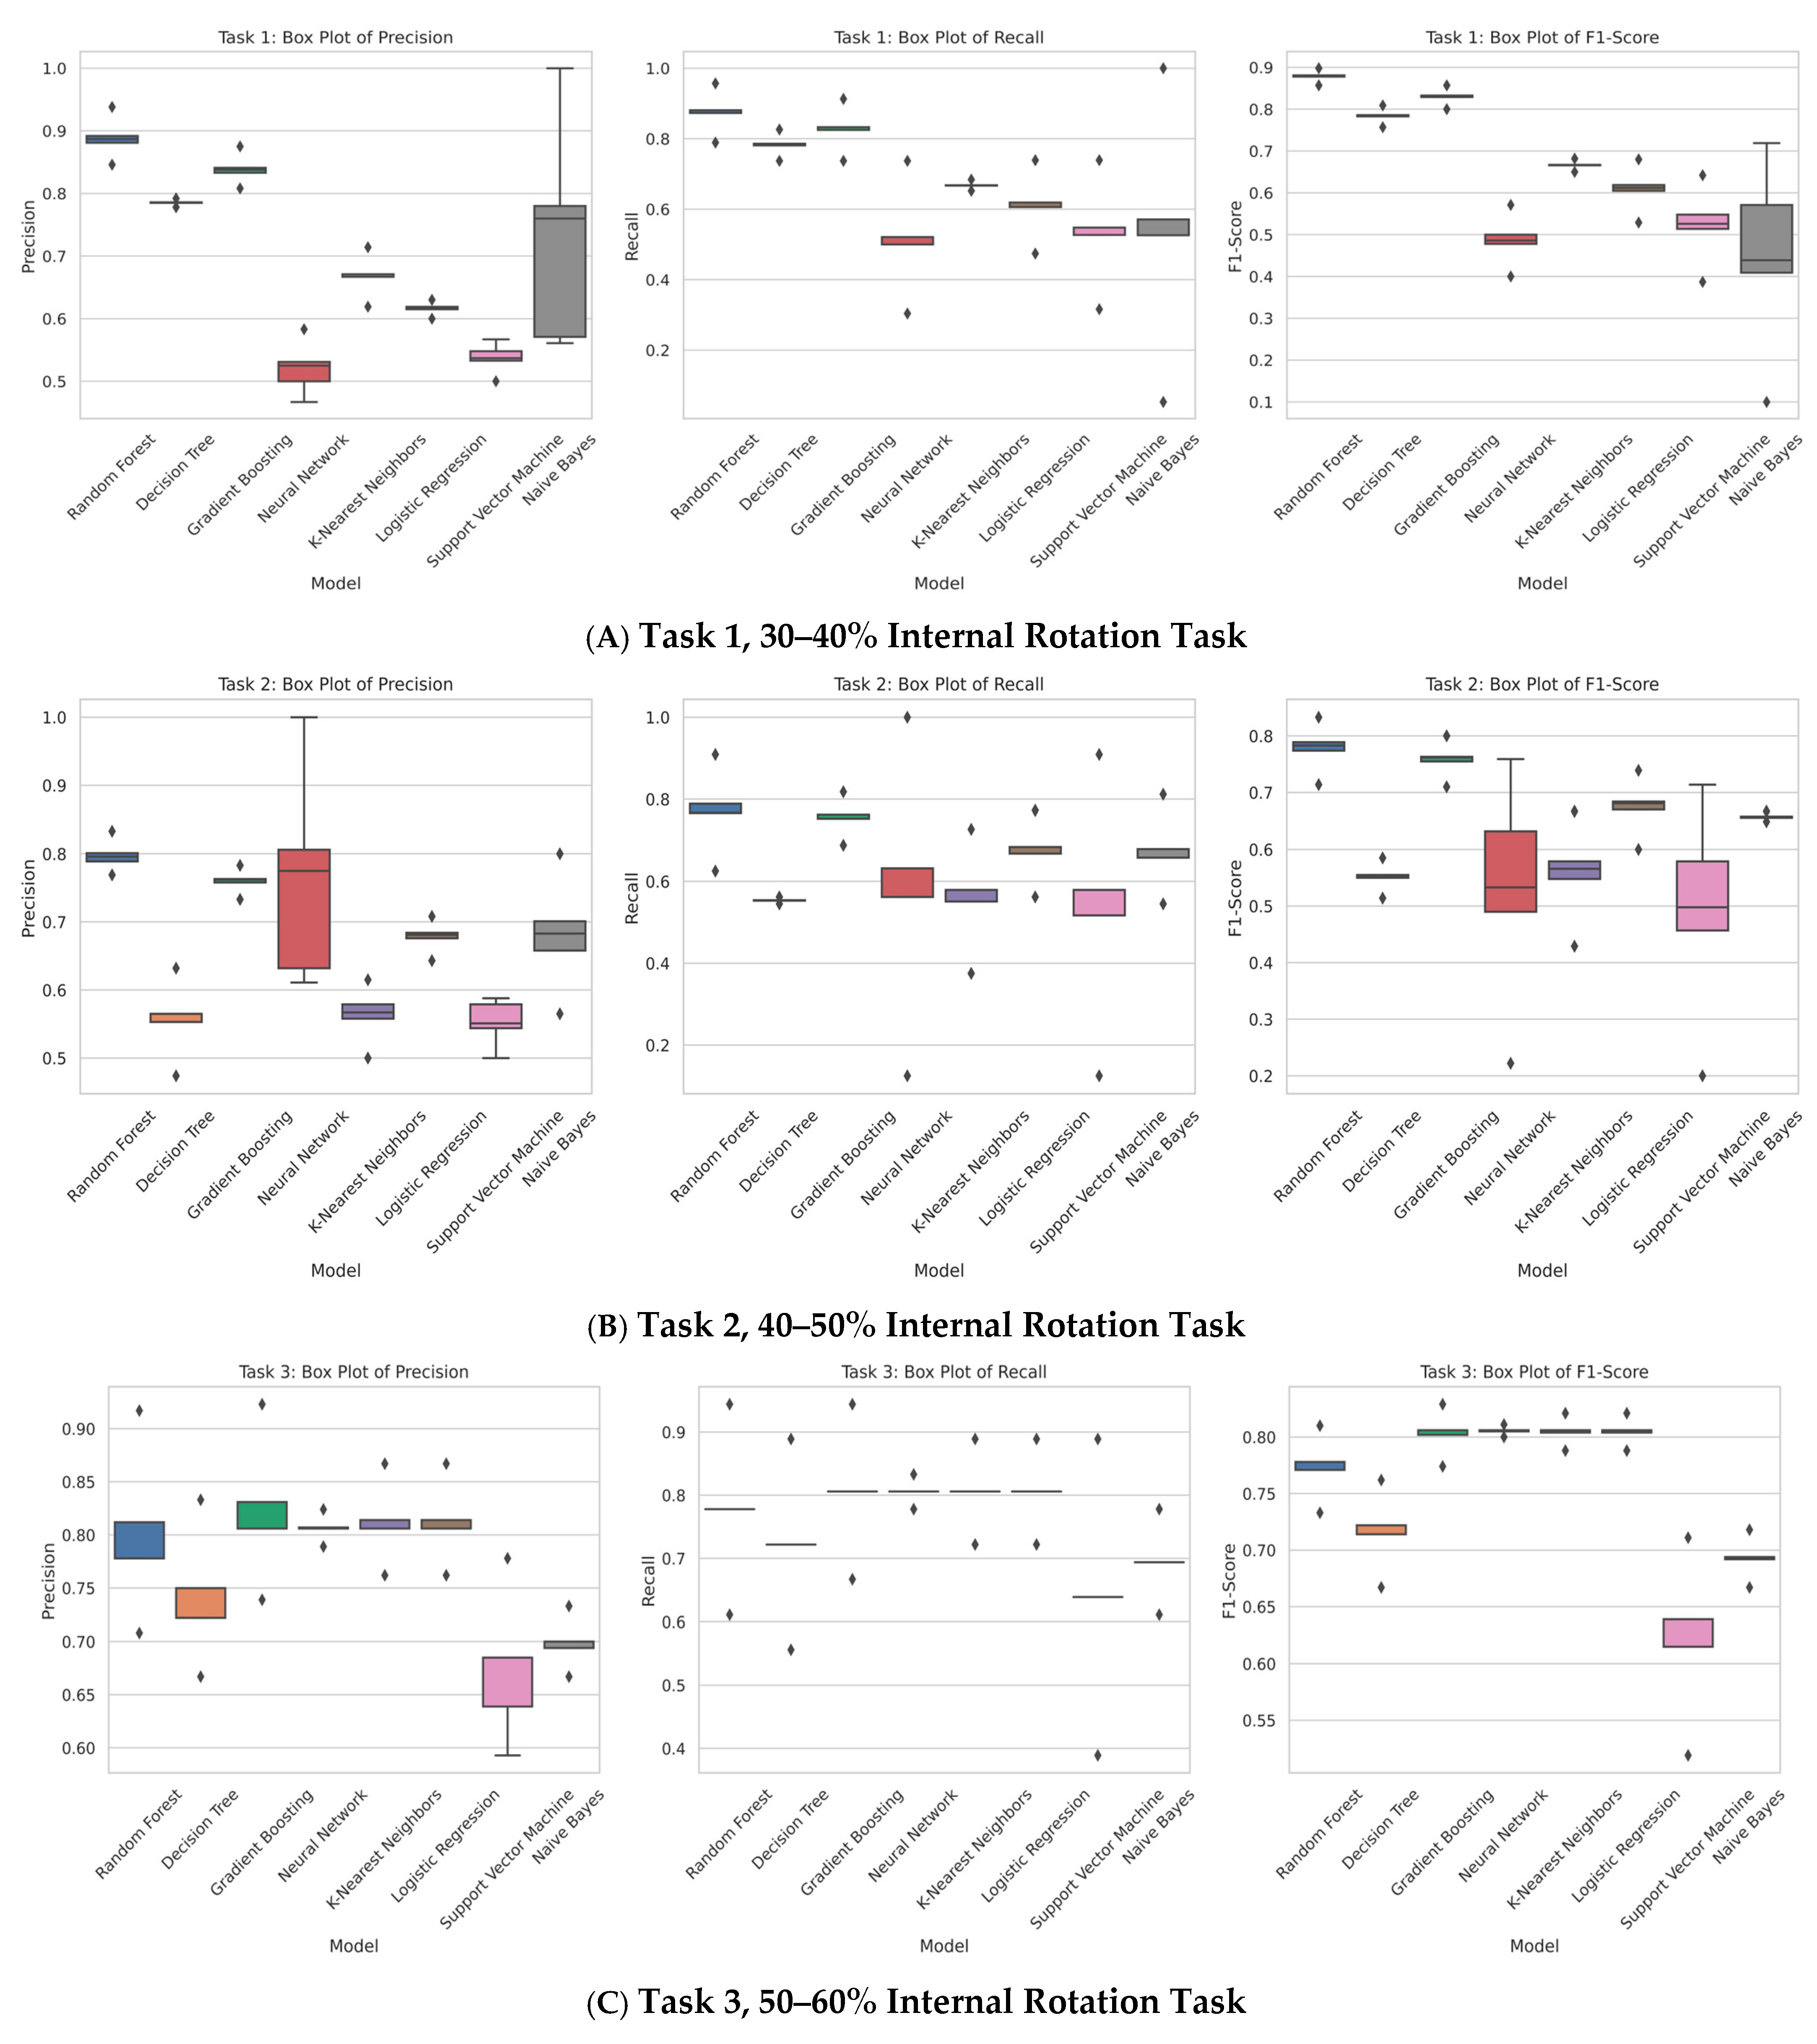
Similarity indices are also employed to gauge how closely the synthetic data mimic the statistical characteristics of the real data. Qualitative evaluation involves a visual inspection of the synthetic data to identify any anomalies or inconsistencies that quantitative metrics might not capture. The synthetic data are also tested with various machine learning algorithms to evaluate their utility in predictive modelling. To address whether integrating synthetic data in a study has an impact, we first need to evaluate different analytical modelling classifiers based on their precision, recall, and accuracy. For this purpose, we selected a diverse set of analytical models, including single, statistical, and ensemble models, to assess the original six-task dataset using the aforementioned metrics. To comprehensively represent the various analytical models employed in this evaluation, the models used include random forests, decision trees, gradient boosting, backpropagation neural networks, k-nearest neighbours (KNN), logistic regression, support vector machines (SVM), and naïve Bayes. These models were assessed based on their precision, recall, and F1-score for the metrics of Fatigue (‘1’) and Not Fatigue (‘0’), along with accuracy, macro average, and weighted average. These metrics were used to evaluate and set a baseline on original data so they can be compared and evaluated when trained on synthetic data and tested on original data. This is shown in Table A1 in Appendix B. For the purposes of this study, the results are visualised through box plots. Performance metrics such as accuracy, precision, recall, and F1-score are compared between models trained on real data and those trained on synthetic data to determine the synthetic data’s efficacy. Mathematically: precision—P = TP/(TP + FP), recall—R = TP/(TP + FN) and F1 = 2 × (P × R)/(P + R), where TP is ‘true positive’, FP and FN are false positive and negative, respectively. This comprehensive evaluation process ensures that the generated synthetic data are robust, reliable, and capable of substituting real data for training machine learning models, thereby confirming their potential for broader applications in data analysis and predictive modelling.
4. Results and Discussion
To assess the effectiveness of the SDG for human fatigue detection by ML models, all GAN models underwent meticulous training. Keeping in mind the recognised knowledge of human fatigue’s subjective nature, capturing diverse conditions and patterns of fatigue onset is essential. Given the complexity of human fatigue, a thorough and systematic approach is required to make certain that the synthetic data produced accurately capture the multifaceted aspects associated with fatigue. The implemented model’s performance hierarchy was meticulously determined within our investigation’s scope. This approach underscores the importance of generating synthetic data that can effectively replicate the diverse and nuanced conditions under which human fatigue occurs, thereby enhancing the reliability and applicability of fatigue detection models in real-world scenarios.
Each box plot illustrates the precision, recall, and F1-score distribution for the classifiers employed in the respective tasks. The boxes depict the interquartile range (IQR), which contains the middle 50% of the data points, with the line inside the box indicating the median. The whiskers extend to the minimum and maximum values within 1.5 times the IQR from the lower and upper quartiles, respectively. Outliers beyond this range are represented as individual points. This visualisation aids in establishing a baseline threshold for understanding and developing synthetic data generation (SDG) methods.
The box plots presented in Figure 5 illustrate the evaluation of fatigue by classifying different fatigue states. Among the models tested, random forest emerged as the best-performing model, achieving an interquartile range (IQR) which means accuracy of over 80% when the train/test split was 80–20%. This performance was closely followed by gradient boosting, which also approached an accuracy of 80%.
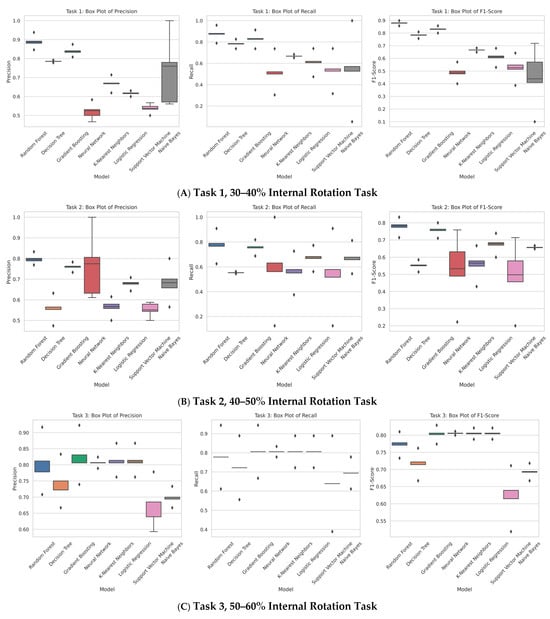
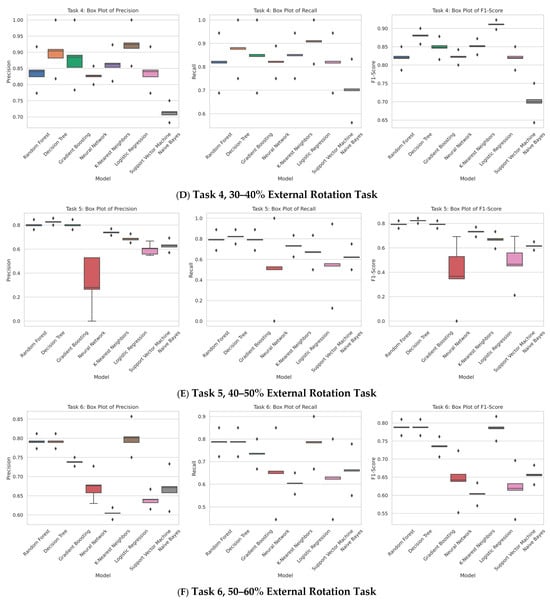
Figure 5.
Box plot for the different tasks: (A) Task 1, (B) Task 2, (C) Task 3, (D) Task 4, (E) Task 5, (F) Task 6.
4.1. Synthetic Data Generation Evaluation for Different Tasks
When replicating a multimodal, multidimensional, imbalanced dataset, synthetic data production presents unique challenges, particularly in comprehending various patterns, formulating conclusions for the generator, and replicating them similarly. Unambiguously constructing an SDG of fatigue, one must comprehend the fatigue development pattern. To distinguish between the actual and synthetic datasets, we used the aforementioned metrics from Section 3.2.4. These are compared against the baseline comparison from Figure 5C which comprises box plots which demonstrate a comparison of different models when used with specific features across the two datasets (real and SDG data). These box plots in Figure 5 provide a baseline comparison for better analysis. They illustrate the performance differences when training on synthetic data and evaluating on real data versus training on real data. Each of these tools has a specific function in our comparative research. By reducing the dataset’s dimensionality, PCA scatter plots make it possible to see the variance and structure between the two primary components. This helps determine whether the original data’s distribution and underlying patterns are replicated in the synthetic data [40]. By comparing the probability density functions of different attributes, distribution density analysis sheds light on how closely the synthetic data resemble the statistical characteristics of the original data. By analysing the overlap and deviations in these density plots, one may determine how similar the feature distributions are between the two datasets [41]. Box plots are used to depict field distribution stability, which looks at the central tendency, variability, and distribution of important features [42]. This method demonstrates how consistently synthetic data keep the median, interquartile range, and potential outliers compared to the real data.
4.1.1. Task 1—30–40% Internal Rotation
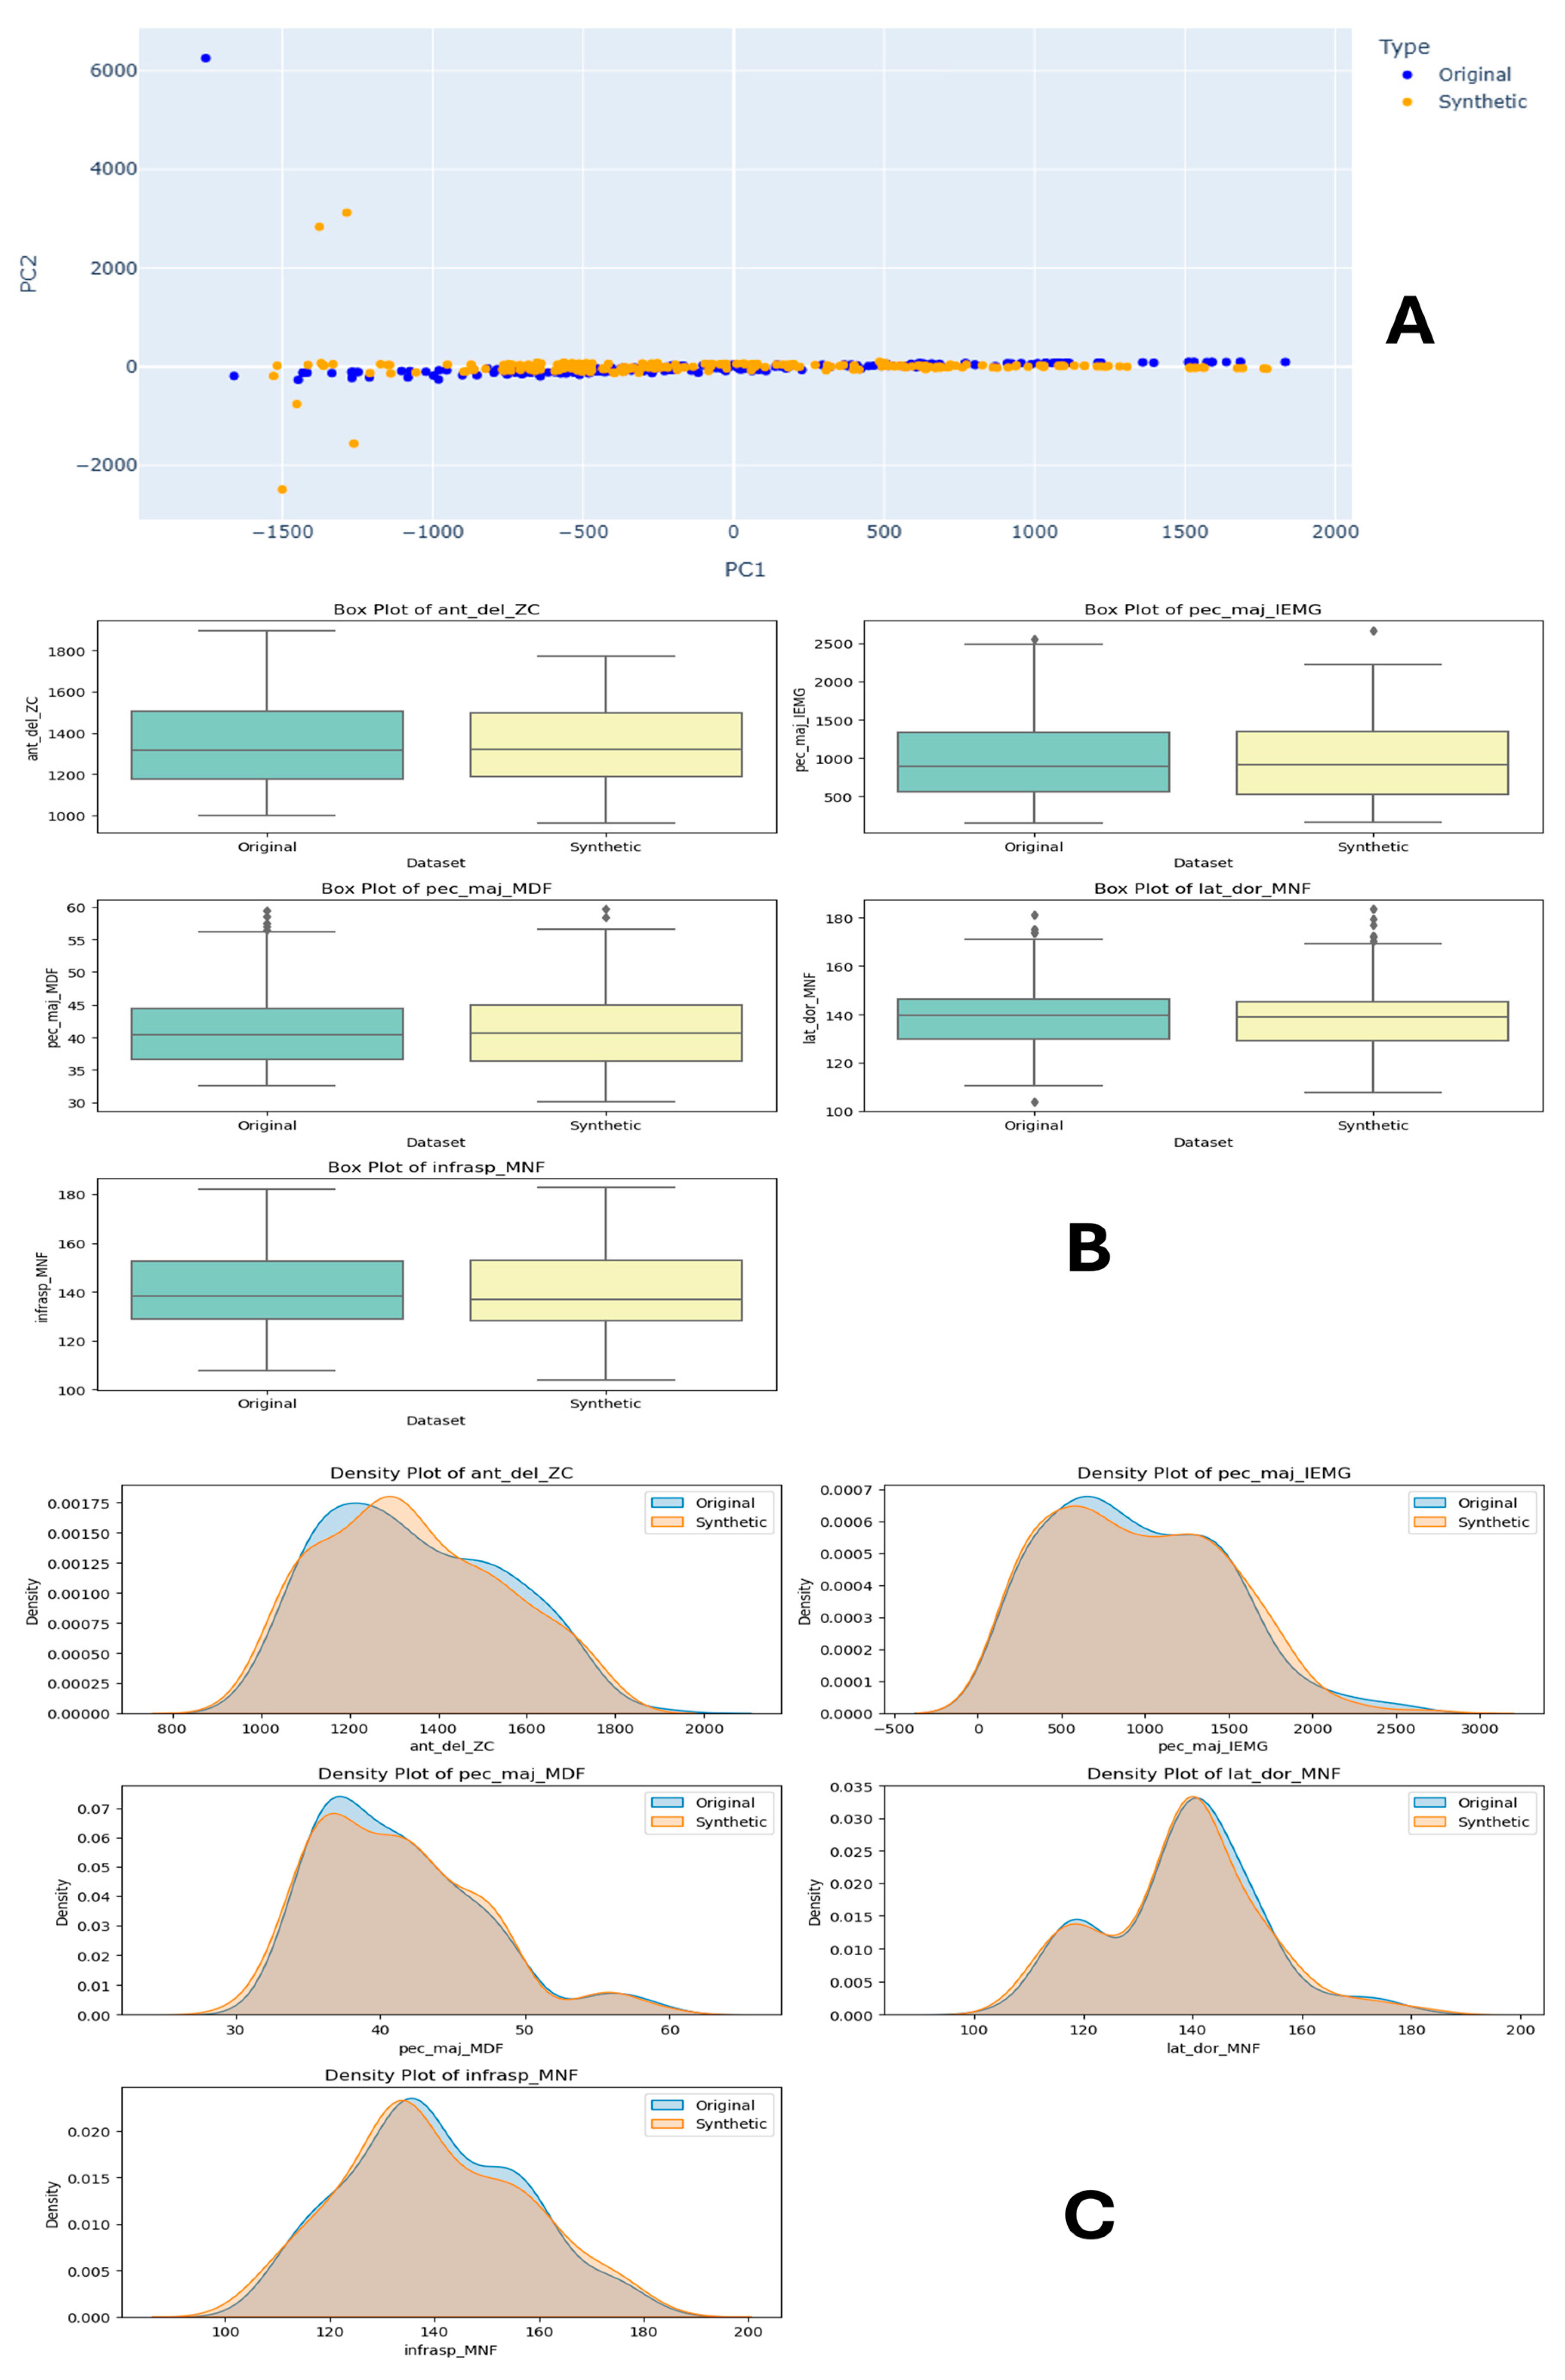
Task 1 consists of shoulder and hand movements, which are performed in a lateral position and elbow flexion at 30–40%. The comparison is delineated across three main sections: principal component analysis (PCA), density plots, and box plots.
Figure 6A features the PCA visualisations for both the original and synthetic datasets. The PCA of the original dataset shows a compact distribution of data points, while the PCA of the synthetic dataset displays a slightly more dispersed pattern along the principal components. This indicates that synthetic data have a broader variance spread than the original data, which may impact the model’s generalisation ability.
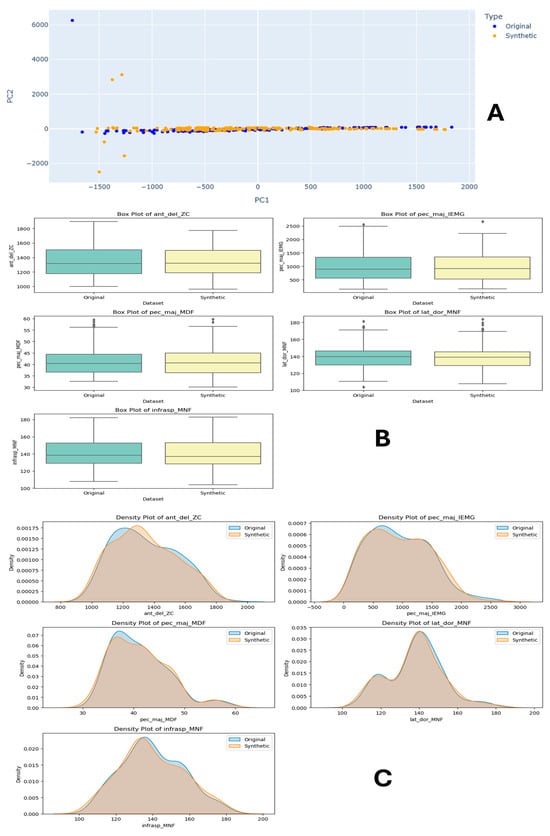
Figure 6.
Task 1 (30–40% Internal Rotation) Principal Component Analysis (PCA) scatter plots (A), Field Distribution Stability (B), and Distribution Density Analysis (C).
In Figure 6C, density plots for the top 5 features are illustrated to compare the distributions between the original and synthetic datasets. The density plots for features such as zero crossing of EMG signal obtained from anterior deltoid muscle (ant_del_ZC) and the pectoralis major muscle sEMG feature (pec_maj_IEMG), as well as the mean frequency of the same muscle (pec_maj_MDF) followed by infraspinatus muscle ‘infrasp_MNF’, show that the synthetic data closely mimic the original data distribution, albeit with slight deviations in density. These visualisations suggest that the synthetic data successfully capture the general trends and characteristics of the original data, making them potentially useful for model training.
The box plots for features like ‘ant_del_ZC’, ‘pec_maj_IEMG’, ‘pec_maj_MDF’, and ‘infrasp_MNF’ illustrate the median, quartiles, and outliers of the datasets. The comparison shows that the central tendency and spread of the synthetic data are similar to the original data. However, there are noticeable differences in the spread and presence of outliers. This similarity in statistical properties reinforces the potential of synthetic data to be used effectively in machine learning models.
Overall, the visualisations collectively demonstrate that the synthetic dataset is a close approximation of the original dataset in terms of both distribution and statistical properties.
4.1.2. Task 2—40–50% Internal Rotation
Task 2 synthetic and original data comparison is presented in Figure 7, which is a detailed comparison between original and synthetic datasets for human physical fatigue detection. In Figure 7A, the PCA plots show the distribution of data points for both datasets, where the original dataset (blue) demonstrates a more compact distribution with distinct clusters. In contrast, the synthetic dataset (orange) exhibits a broader spread, indicating slight variations in data variance. Figure 7C presents density plots that compare the distribution of various features between the original and synthetic datasets. The top 5 features, such as infraspinatus muscle median frequency (isp_trap_MDF), pectoralis major muscle EMG signal feature (pec_del_MDF), and infraspinatus muscle ‘infrasp_MNF’, followed by anterior deltoid muscle IMU feature ‘ant_del_acc’, are visualised, revealing that the synthetic data closely follow the original data’s distribution with minor deviations, suggesting a successful approximation of the original data’s characteristics. In Figure 7B, features like ‘isp_trap_MDF’, ‘pec_del_MDF’, and ‘infrasp_MNF’ are examined, showing that the central tendency and spread (median, quartiles) of the synthetic data are similar to those of the original data, with some differences in outliers and spread. This indicates that the synthetic data reasonably replicate the statistical properties of the original dataset. Collectively, these sections demonstrate that the synthetic dataset approximates the original dataset well, making it a viable alternative for training machine learning models in human physical fatigue detection.
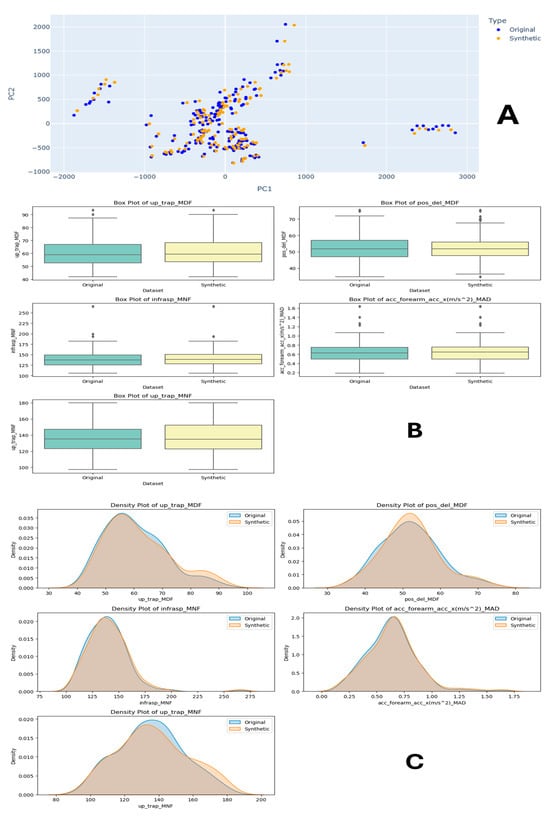
Figure 7.
Task 2 (40–50% Internal Rotation) Principal Component Analysis (PCA) scatter plots (A), Field Distribution Stability (B), and Distribution Density Analysis (C).
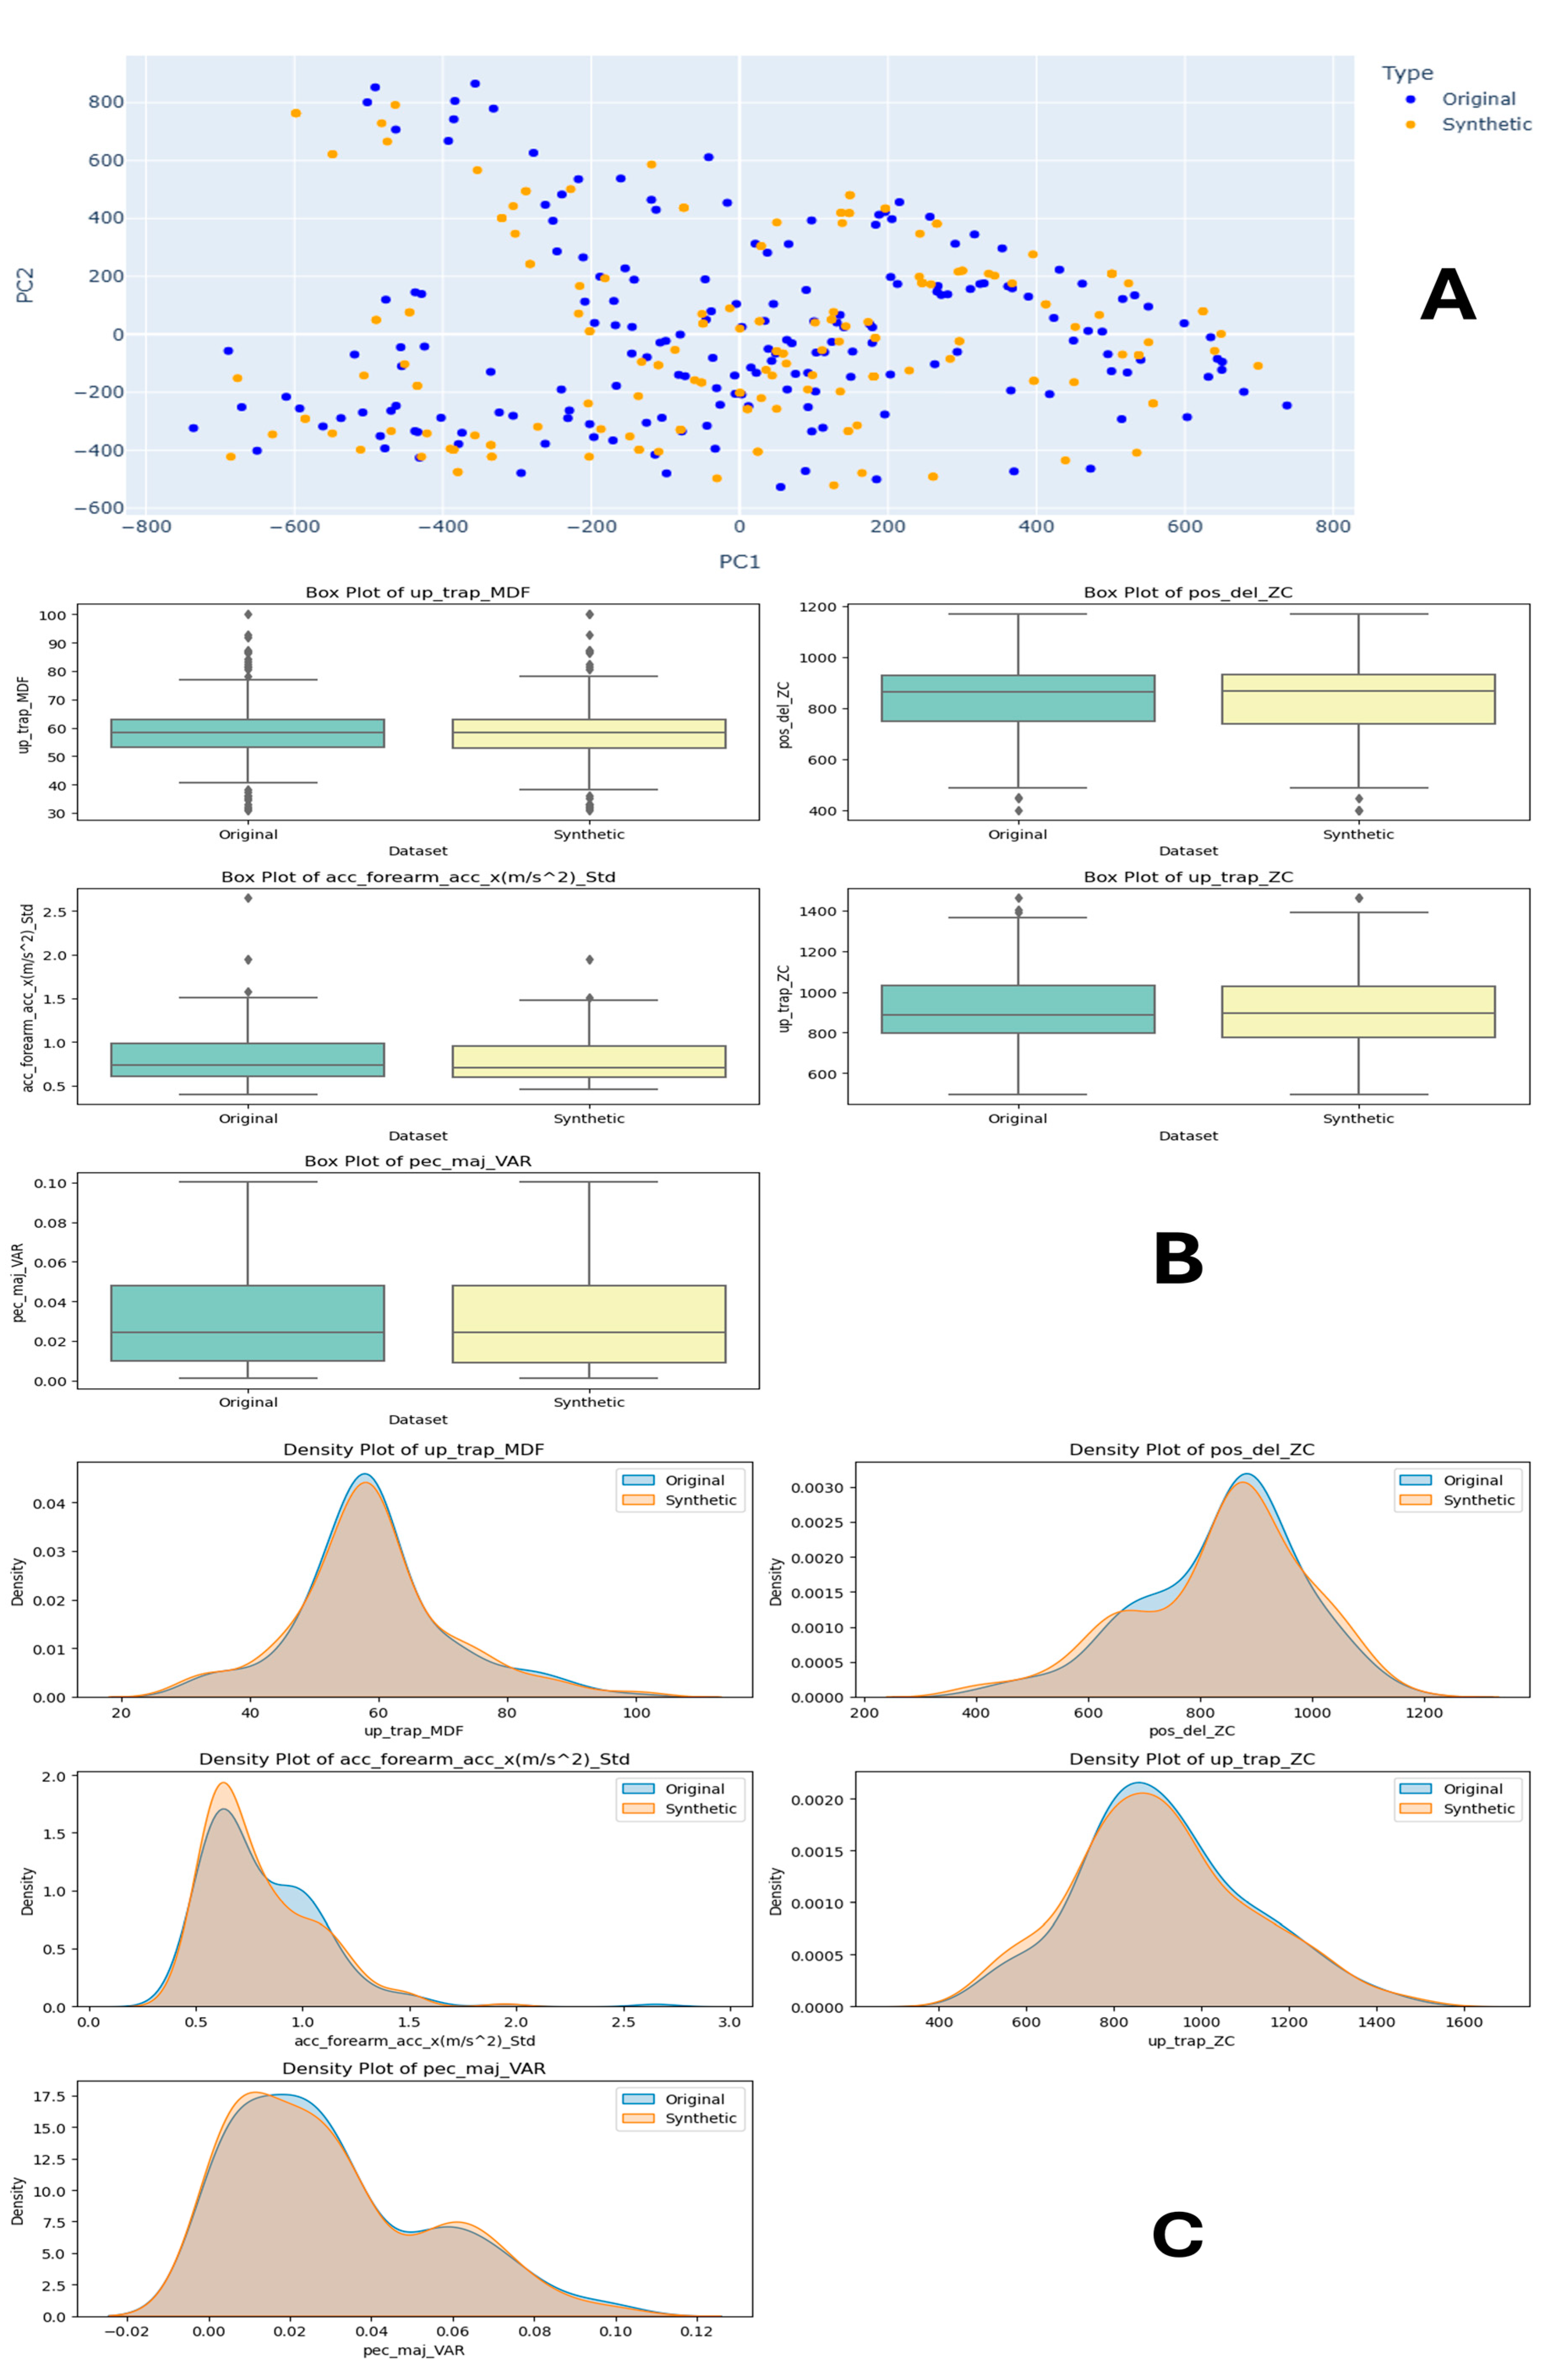
4.1.3. Task 3—50–60% Internal Rotation
For Task 3 comparison, as shown in Figure 8A, the PCA plots show the original dataset (blue) with distinct clusters and a compact distribution, while the synthetic dataset (orange) displays a more dispersed distribution, indicating some variance differences. Figure 8C features density plots for various features, such as the infraspinatus muscle median frequency from EMG signal (isp_trap_MDF), IMU acceleration (acc_forearm), and variance of the pectoralis major muscle EMG signal feature (pec_maj_VAR), followed by zero crossing (pec_del_ZC and usp_trap_ZC). These plots reveal that the synthetic data closely mirror the original data’s distribution with minor deviations, suggesting they successfully capture the original data’s characteristics. Figure 8B includes comparing the field distribution stability of the original and synthetic data for features like ‘isp_trap_MDF’, ‘pec_del_ZC’, and ‘acc_forearm’. The box plots show similar central tendencies and spreads, with some differences in outliers, indicating that the synthetic data reasonably replicate the statistical properties of the original dataset. Overall, the synthetic dataset appears to approximate the original dataset well, making it suitable for training machine learning models in human physical fatigue detection. This advocates for synthetic data to be a viable alternative for training machine learning models in human physical fatigue detection, especially in scenarios where the original data are scarce or sensitive.
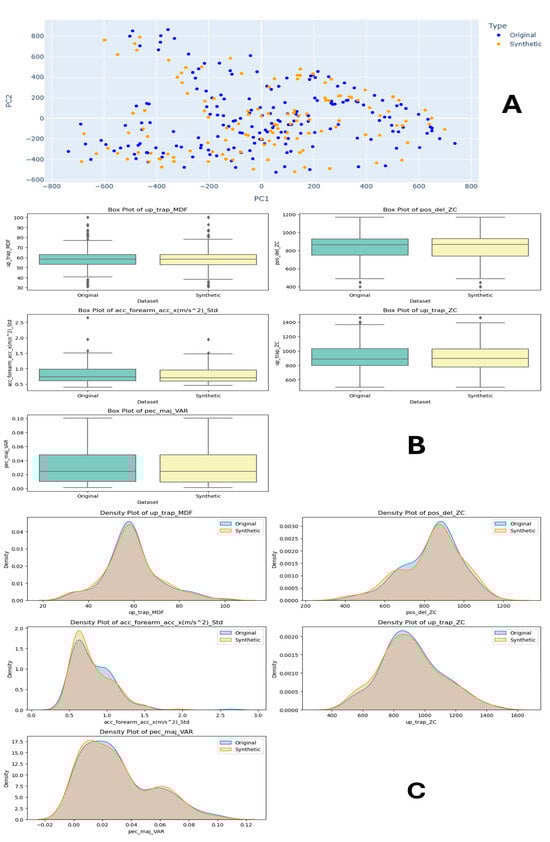
Figure 8.
Task 3 (50–60% Internal Rotation) Principal Component Analysis (PCA) scatter plots (A), Field Distribution Stability (B), and Distribution Density Analysis (C).
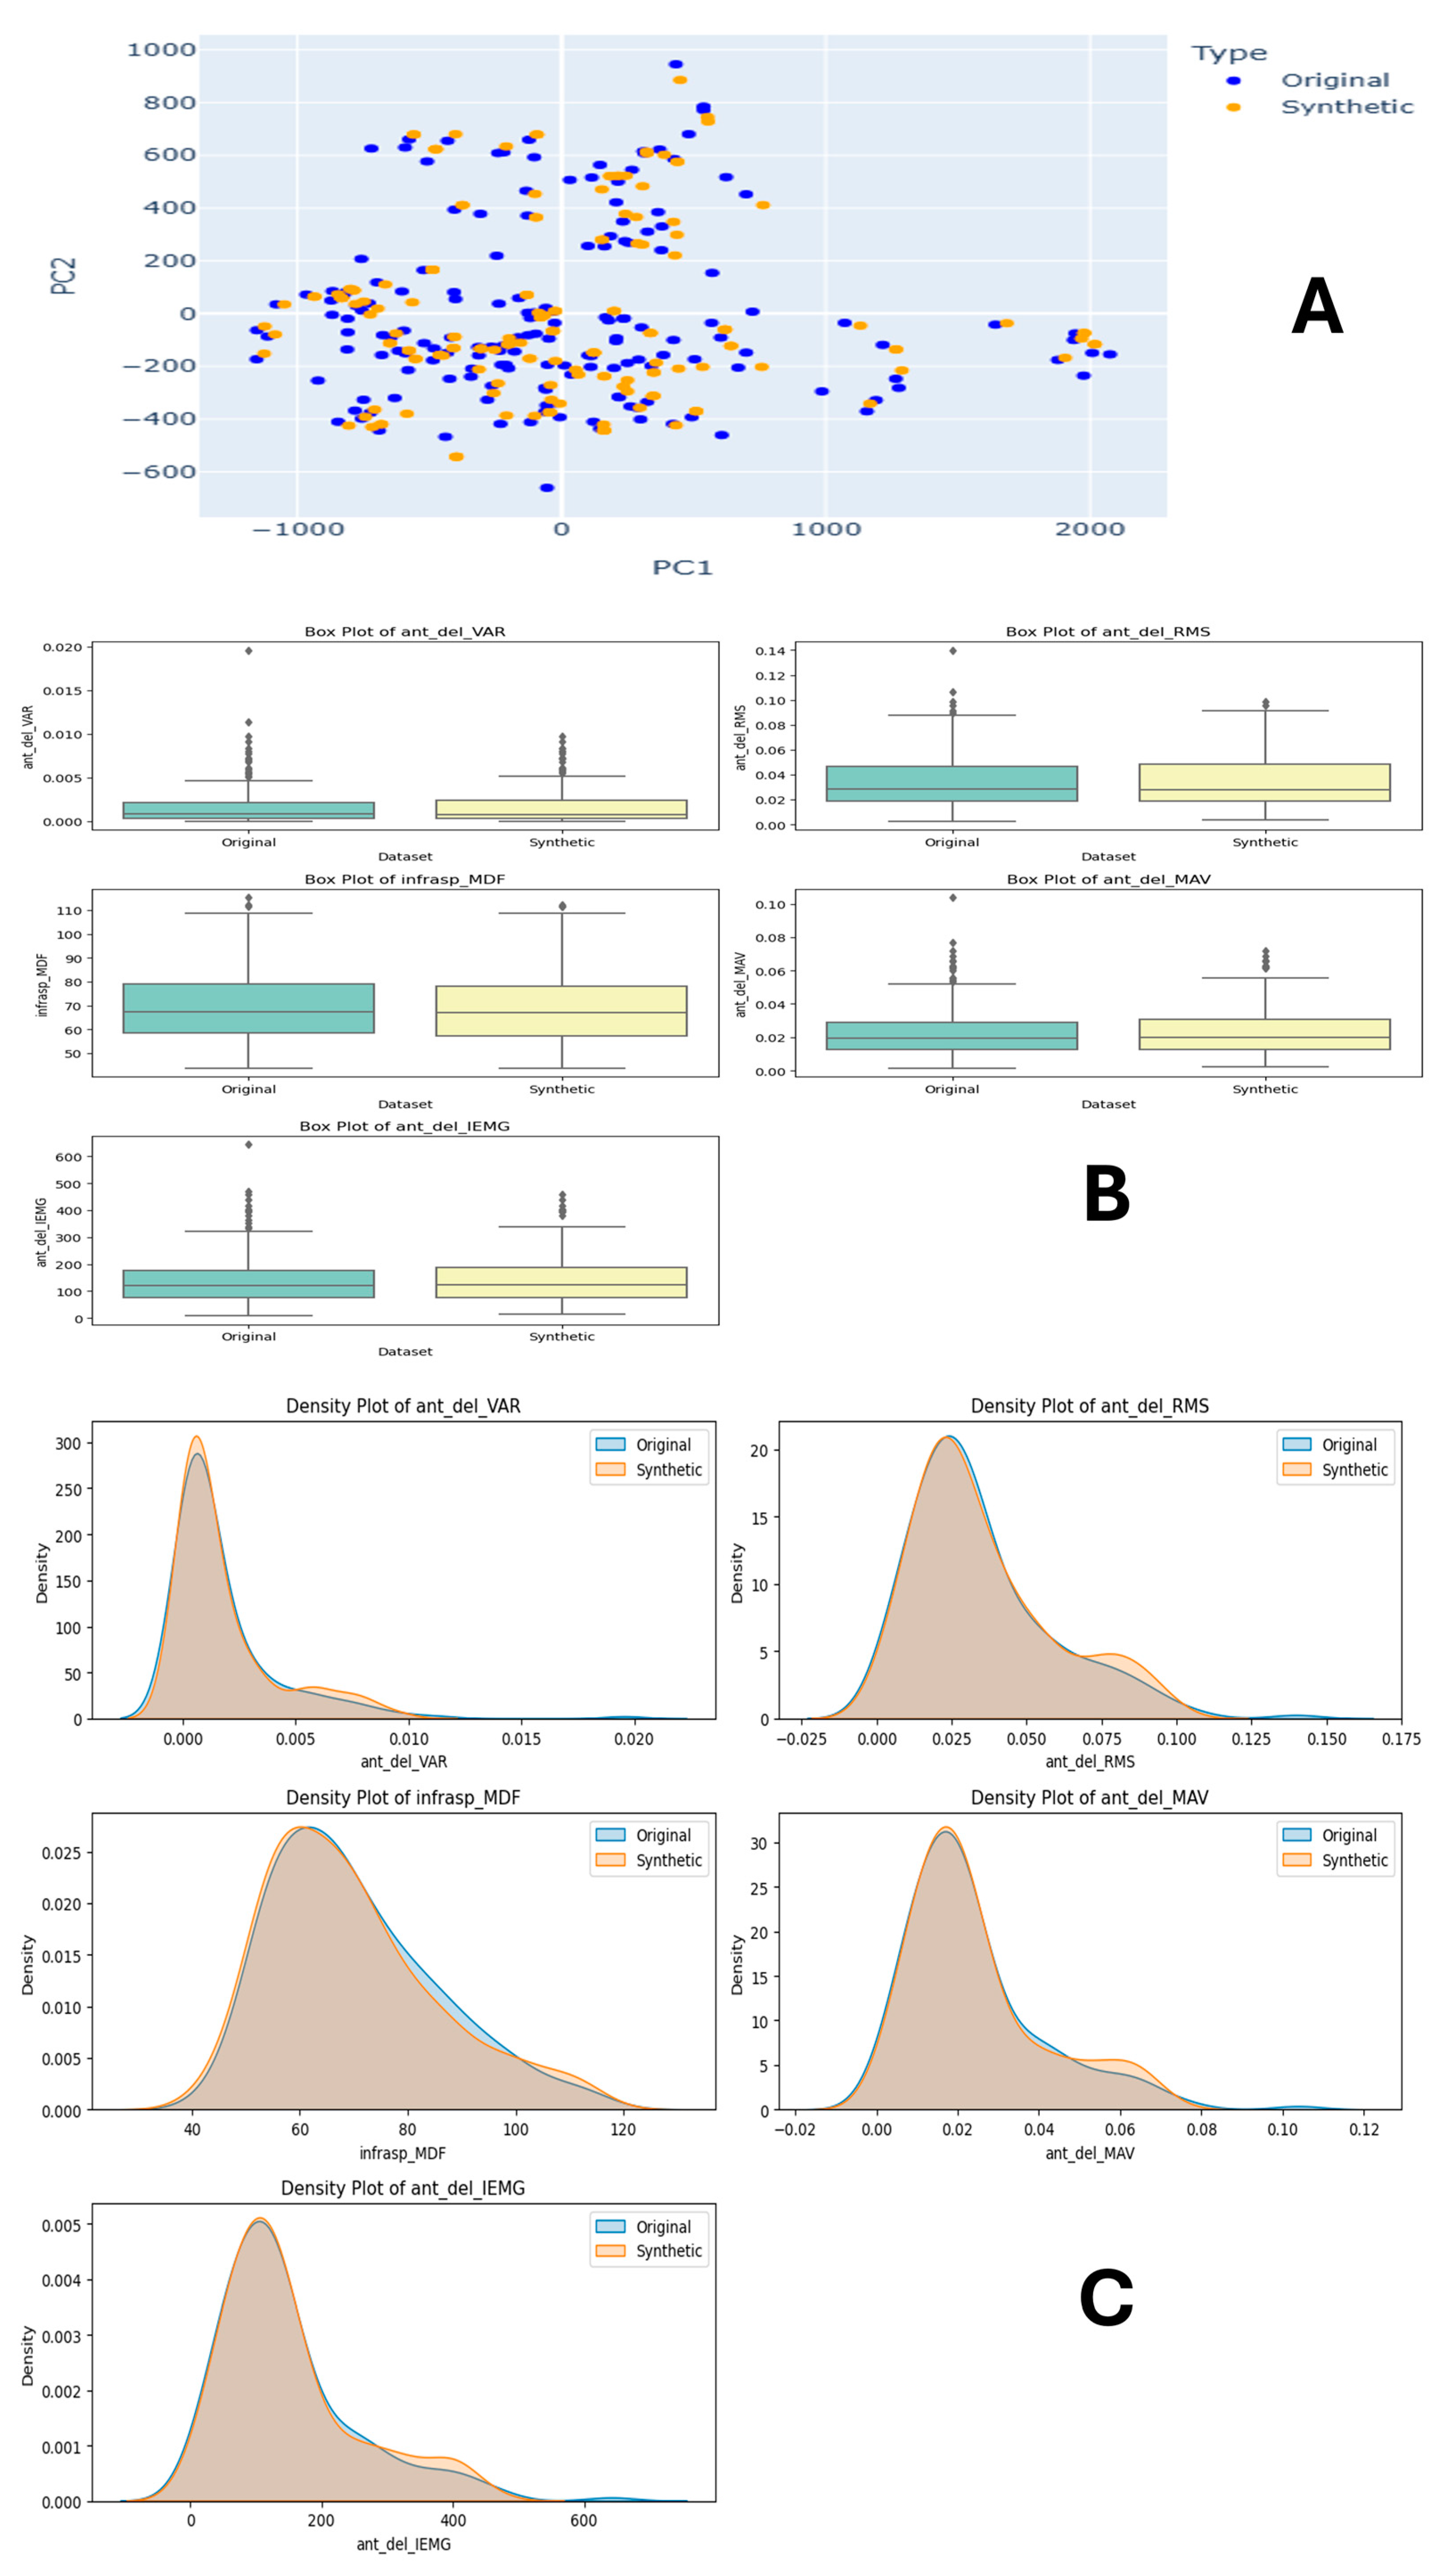
4.1.4. Task 4—30–40% External Rotation
Task 4, Figure 9, PCA plots (Figure 9A) show the original data (blue) are compact, while the synthetic data (orange) are more spread out. Density plots (Figure 9C) for various features indicate that synthetic data closely follow the original data’s distribution. Box plots (Figure 9B) show similar central tendencies and spreads, with some differences in outliers. The synthetic data effectively approximate the original dataset, making them suitable for model training when compared with other internal rotation tasks. This has demonstrated that both models have worked equally well on external rotation tasks.
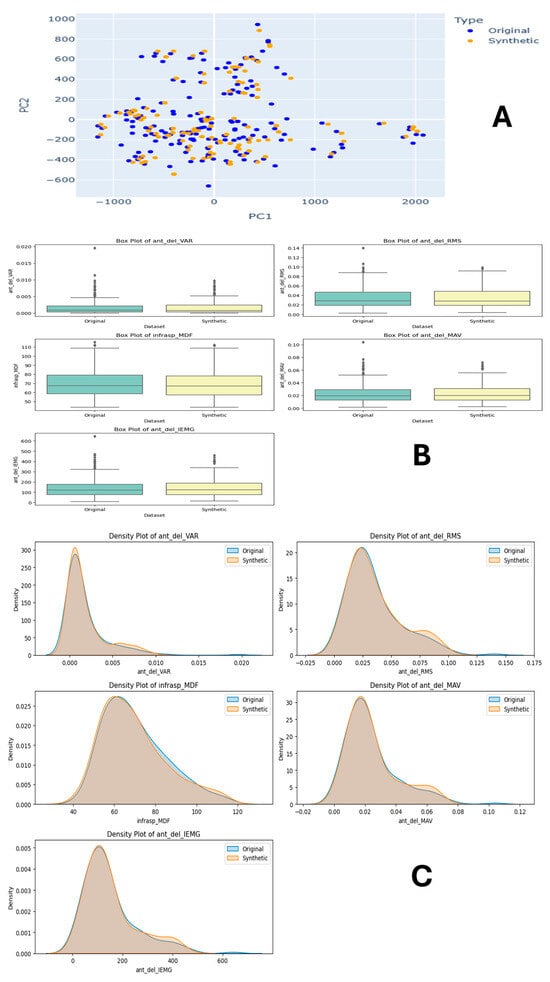
Figure 9.
Task 4 (30–40% External Rotation) Principal Component Analysis (PCA) scatter plots (A), Distribution Density Analysis (B), and Field Distribution Stability (C).
4.1.5. Task 5—40–50% External Rotation
Task 5 consists of external rotations. Figure A1A, shows PCA plots where the original dataset (blue) has a compact and clustered distribution, while the synthetic dataset (orange) is more dispersed, indicating differences in variance. Figure A1C features density plots for features such as variance of the EMG signal for anterior deltoid muscle (ant_del_VAR), then the infraspinatus muscle EMG signal (infrasp_MDF), then ‘ant_del_IEMG’, ‘ant_del_RMS’, and ‘ant_del_MAV’. These plots demonstrate that the synthetic data closely follow the original data’s distribution with the allowed amount of deviations. Figure A1B shows the field distribution stability for features like ‘ant_del_VAR’, ‘infrasp_MDF’, and ‘ant_del_IEMG’. The box plots reveal similar central tendencies and spreads between the datasets, with some differences in outliers, suggesting that the synthetic data reasonably replicate the original dataset’s statistical properties. Overall, the synthetic dataset approximates the original dataset well, making it a viable option for training machine learning models in human physical fatigue detection.
4.1.6. Task 6—50–60% External Rotation
For Task 6, in Figure A2A, PCA plots illustrate the original dataset (blue) with a compact and clustered distribution, while the synthetic dataset (orange) shows a more dispersed pattern. Figure A2C features density plots for various features, including ‘infrasp_ZC’, ‘infrasp_SSC’, ‘ant_del_RMS’, ‘ant_del_SSC’, and ‘infrasp_MNF’. These plots reveal that the synthetic data closely mirror the original data’s distribution with minor deviations, suggesting they effectively capture the original data’s characteristics. Figure A2B presents box plots comparing the field distribution stability of features such as ‘infrasp_ZC’, ‘infrasp_SSC’, ‘ant_del_RMS’, ‘ant_del_SSC’, and ‘infrasp_MNF’. The box plots indicate similar central tendencies and spread between the datasets, with some variations in outliers. Overall, the synthetic dataset approximates the original dataset well, making it a viable option for training machine learning models in human physical fatigue detection.
4.2. Evaluating Synthetic Data Model Training
The ML models were trained on the synthetic data generated and then tested on the original dataset to compare the results of classifying fatigue states and whether they have improved or no substantial change occurred. In our approach, these, as mentioned earlier in Section 4.1, were compared against the box plots for the baseline comparison from Figure 5C. A comparison of different models when used with specific features across the two datasets (real and SDG data) was carried out. Figure 5 shows box plots that provide a baseline comparison for better analysis. These, when compared with Table 2, illustrated that the performance has improved when training on synthetic data and predicting fatigue from real data versus training on real data. Furthermore, accuracy is often employed to gauge classifier performance; however, it becomes inadequate with imbalanced datasets as it favours more prevalent classes [43]. To address this issue, we utilise precision and recall for each class and compute their weighted mean across all classes, known as the F1-score [44]. Precision indicates the proportion of correct predictions for a class, while recall reflects the proportion of correctly identified actual class instances [45]. We calculated and compared the results of two top-performing classifiers with the highest margins: random forest and gradient boosting. These classifiers were chosen to evaluate their impact on classifying fatigue states. We then compared the results presented in Figure 3 with these classifiers.
Table 2.
Evaluation between classifiers when trained on synthetic data and tested on original data.
The performance evaluation of two classifiers, random forest (RF) and gradient boosting (GB), was conducted with respect to their precision, recall, and F1-scores for two classes. For class 0, the RF classifier achieved a precision of 0.97, recall of 0.87, and an F1-score of 0.92, whereas the GB classifier recorded a precision of 0.95, recall of 0.76, and an F1-score of 0.84. For class 1, RF attained a precision of 0.87, a recall of 0.97, and an F1-score of 0.92, while GB achieved a precision of 0.78, a recall of 0.96, and an F1-score of 0.86. Both classifiers demonstrated an overall accuracy of 0.92 for RF and 0.85 for GB. The macro average and weighted average metrics for RF were consistently 0.92 across precision, recall, and F1-score, indicating balanced performance across classes. In contrast, GB displayed macro averages of 0.87 for precision, 0.86 for recall, and 0.85 for F1-score, with weighted averages mirroring these values. This analysis underscores the superior performance of the random forest and gradient boosting classifier in classifying states of fatigue when trained on synthetic data and tested on original data. Overall, this presents that the SDG gaps are the bridge for the problem that occurred due to data challenges and the improvement of the machine learning model.
Furthermore, tuning hyperparameters for ML model RF and GB such as n-estimators, min-samples-split, max-features, and max-depth is vital for enhancing ML performance. Increasing n-estimators enhances accuracy and is ideally set from 100–1000 for both models. Adjusting min-sample-split prevents overfitting on small patterns and the recommended range is 2–10. Using ‘sqrt’ or ‘log2’ should be considered while choosing max features which control the no. of features considered at each split, helping to balance bias and variance, and is often effective. Meanwhile, setting max-depth properly also helps in reducing overfitting while maintaining predictive power. Alternatively, vital hyperparameters like the learning rate in GB regulate model updates. Properly tuning these parameters thoroughly can further enhance the ML model’s prediction.
5. Conclusions
In this paper, we explored the process of synthetic data generation for the detection of human physical fatigue using a deep learning conditional generative model. The methodology employed a generator to produce synthetic samples and a discriminator to evaluate their accuracy, updating weights accordingly. A conditioning vector, noise, and real data were supplied to the generator to train these models. Given the fatigued dataset’s multidimensional, multimodal, and imbalanced nature, the initial stages involved data preparation, feature extraction, and selection, making the dataset ready for synthesis. Subsequently, various classifiers were employed to understand their performance on the original data, and the same classifiers were trained on the synthetic data. The results demonstrated that the use of synthetic data improved the precision, recall, and F1-scores for both random forest and gradient boosting classifiers. The dataset was further evaluated through PCA scatter plots, distribution density analysis plots, and field distribution stability plots, all of which indicated that the synthetic data closely produced the data when compared with the original datasets.
Future research endeavours will broaden the potential to examine and explore more cutting-edge techniques involving deep learning conditional GANs for data augmentation and feature selection. Although the study advocates for SDG, it does have some limitations to be noted. They are: both the models possess a mode collapse limitation in sequential data and data label dependency. Additionally, SDG overall lacks real-world variability. To overcome these, exploring state-of-the-art approaches and further experimentation with hyperparameters could lead to further enhancement of the classifier’s performance. Additionally, extending investigations that encompass a wide variety of variables, industrial scenarios, and powerful classifiers would contribute meaningful perspectives on the generalisability and versatility of these SDG techniques across various contexts.
Author Contributions
A.L.: Writing—original draft, Methodology, Formal analysis, Conceptualisation. Y.L.: Writing—review and editing, Supervision, Methodology, Conceptualisation. P.M.: Writing—review and editing, Supervision, Methodology. Z.J.: Writing—review and editing, Supervision. All authors have read and agreed to the published version of the manuscript.
Funding
This research received no external funding.
Institutional Review Board Statement
Ethical review and approval were undertaken for this study by required people involved in data collection.
Data Availability Statement
The data referenced in Section 3.2 is publicly available for readers. It has been archived in the repository and can be accessed at the following link: https://zenodo.org/record/841506673 (accessed on 14 January 2025).
Conflicts of Interest
The authors declare no conflict of interest.
Appendix A
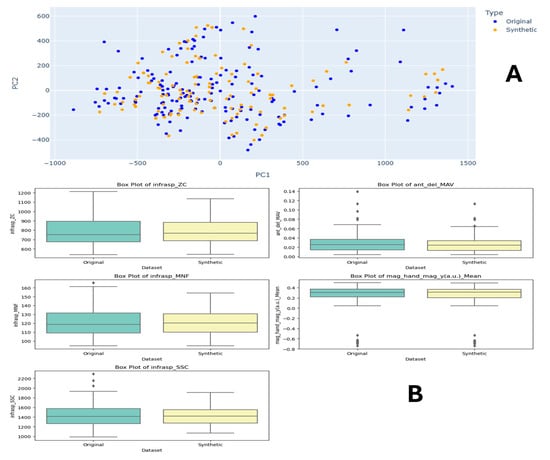
Figure A1.
Task 5 (40–50% External Rotation) Principal Component Analysis (PCA) scatter plots (A), Field Distribution Stability (B), and Distribution Density Analysis (C).
Figure A1.
Task 5 (40–50% External Rotation) Principal Component Analysis (PCA) scatter plots (A), Field Distribution Stability (B), and Distribution Density Analysis (C).
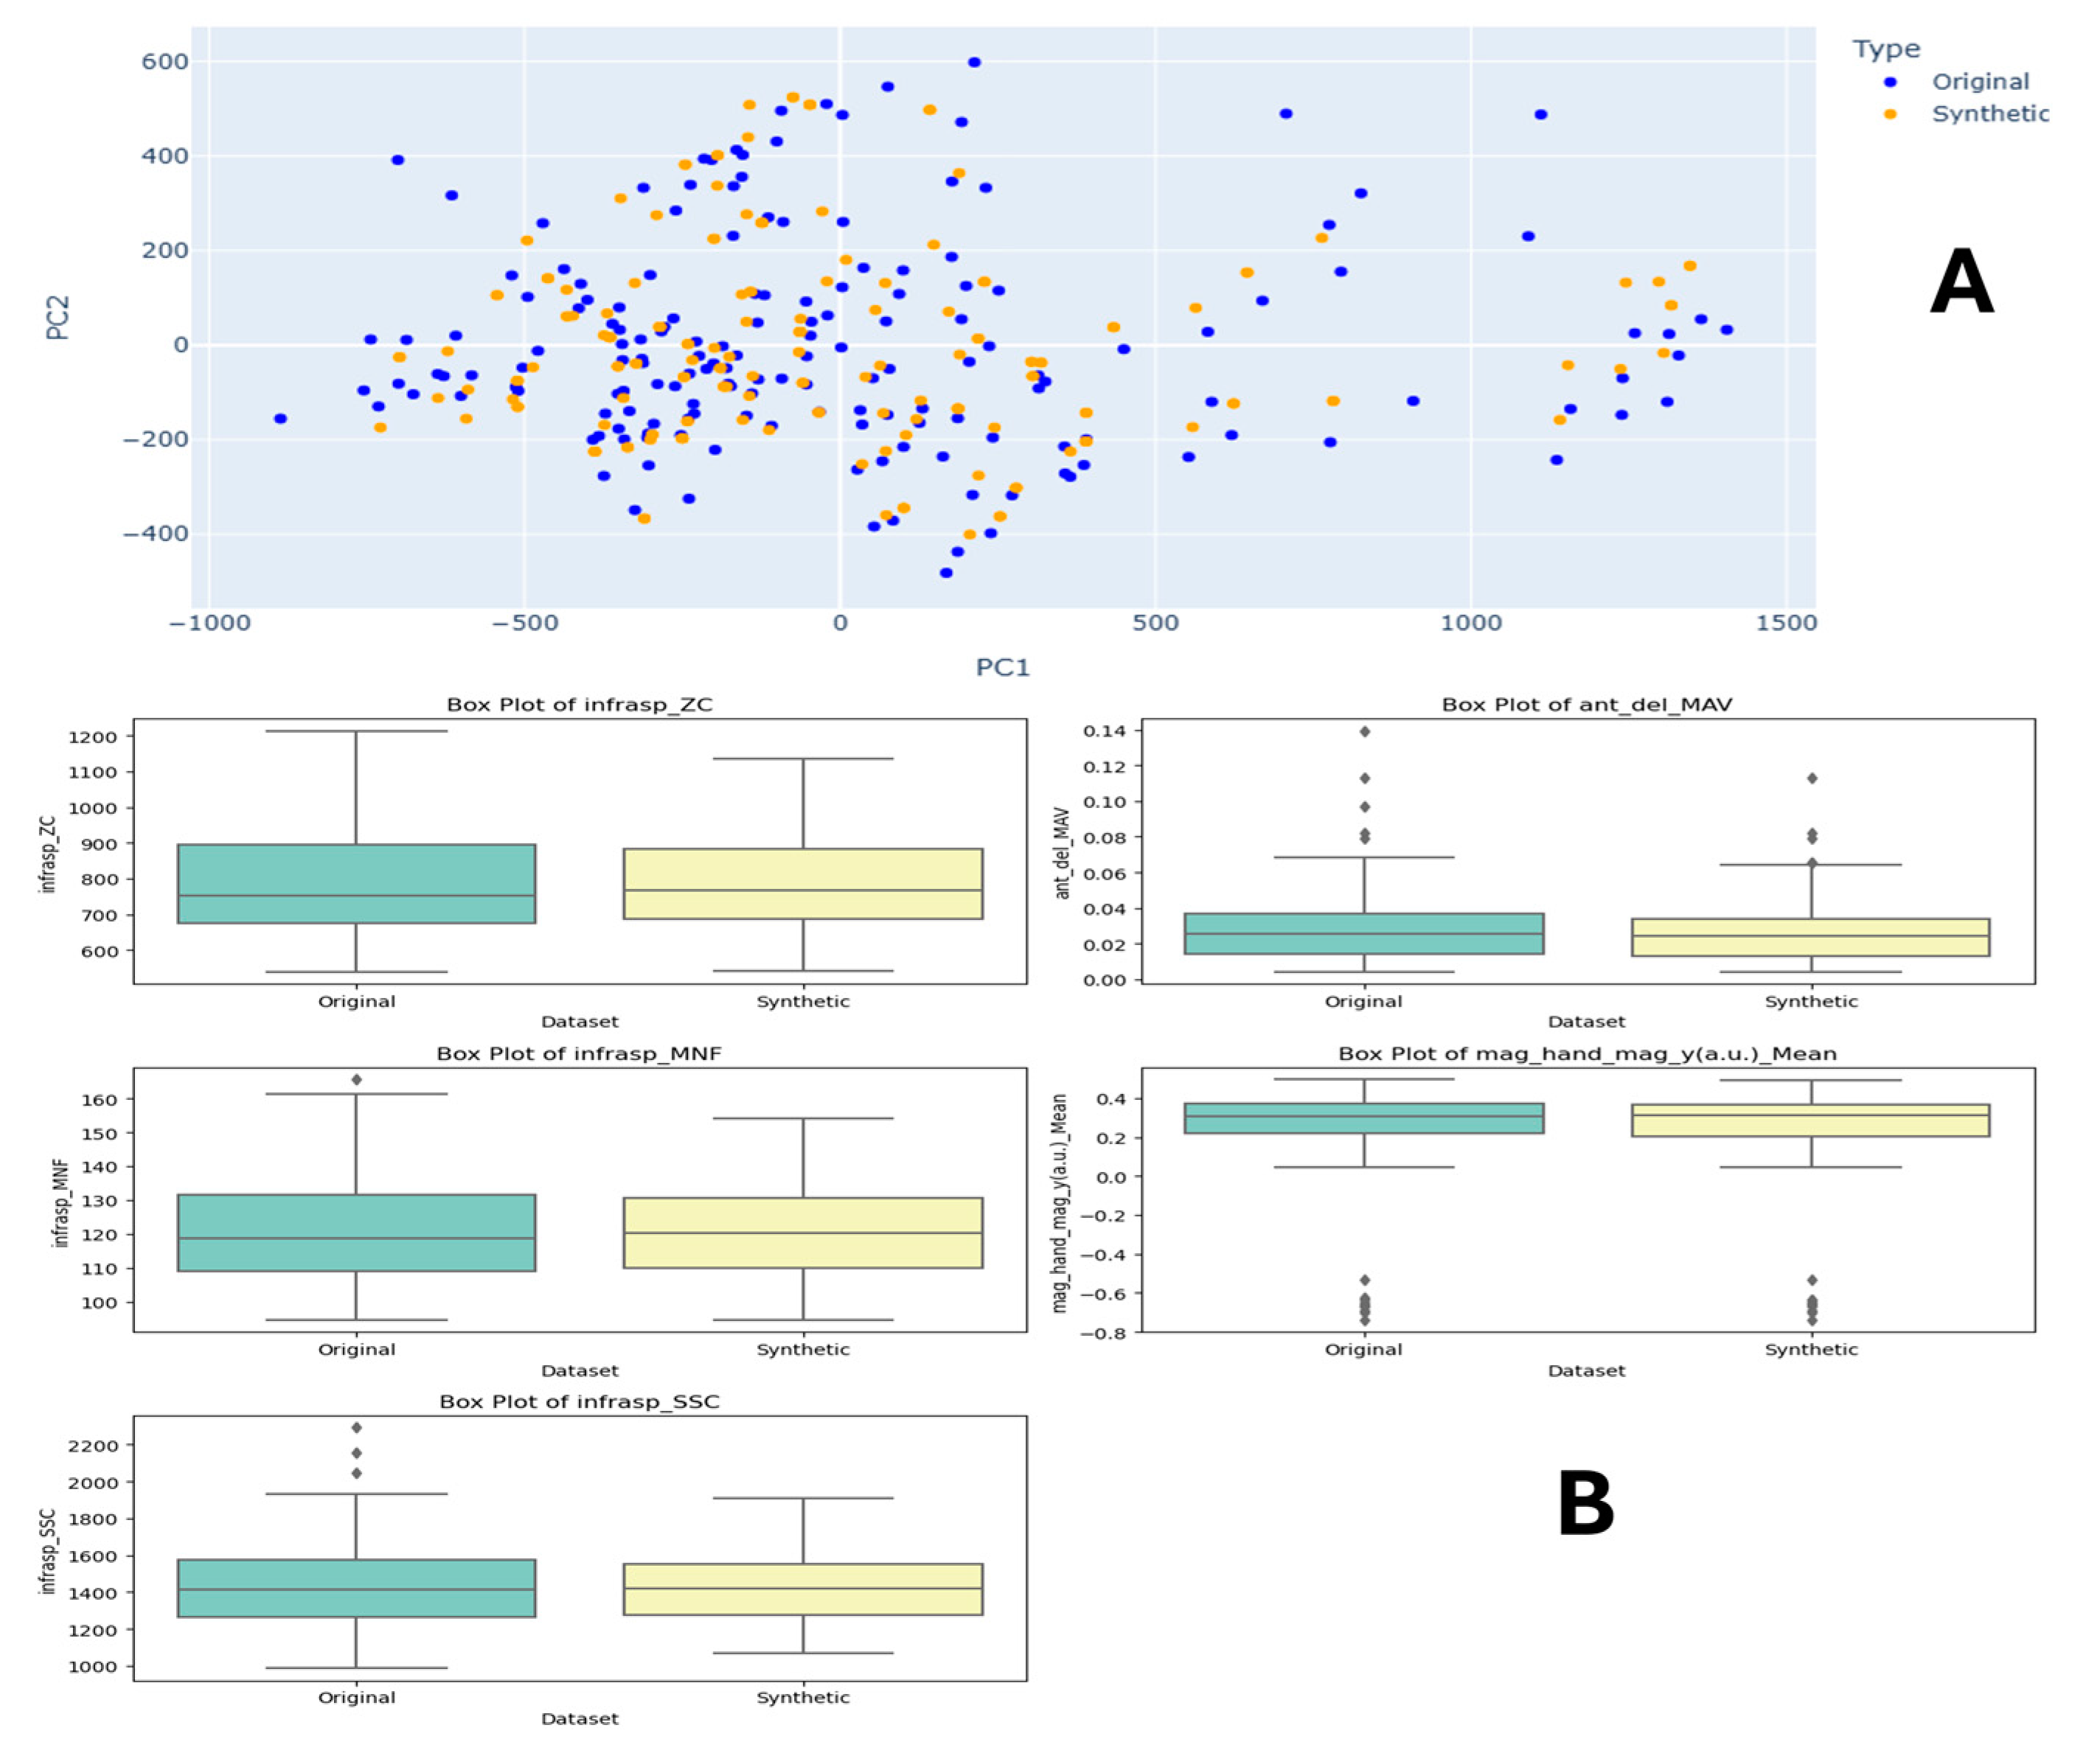

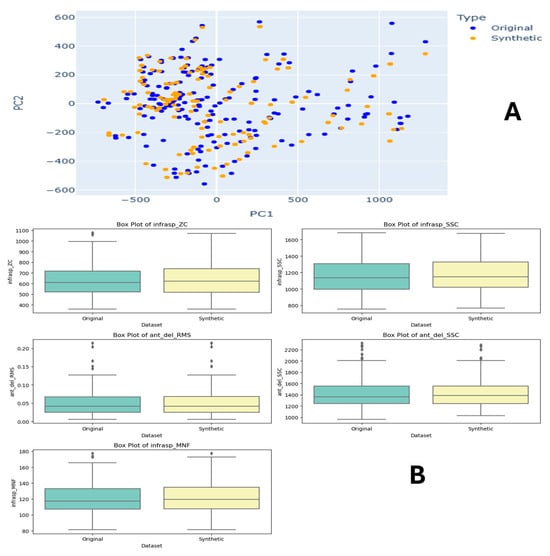
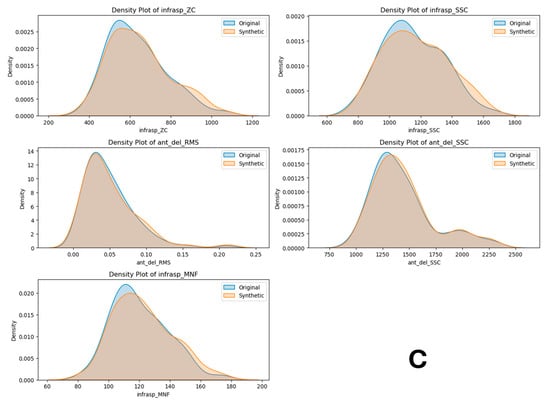
Figure A2.
Task 6 (40–50% External Rotation) Principal Component Analysis (PCA) scatter plots (A), Field Distribution Stability (B), and Distribution Density Analysis (C).
Figure A2.
Task 6 (40–50% External Rotation) Principal Component Analysis (PCA) scatter plots (A), Field Distribution Stability (B), and Distribution Density Analysis (C).


Appendix B
Table A1.
Result table of classifiers training on real data.
Table A1.
Result table of classifiers training on real data.
| Dataset | Model | Metric | Precision | Recall | F1-Score |
|---|---|---|---|---|---|
| T1 | Random Forest | 0 | 0.846 | 0.957 | 0.898 |
| 1 | 0.938 | 0.789 | 0.857 | ||
| accuracy | 0.881 | 0.881 | 0.881 | ||
| macro avg | 0.892 | 0.873 | 0.878 | ||
| weighted avg | 0.887 | 0.881 | 0.879 | ||
| Decision Tree | 0 | 0.792 | 0.826 | 0.809 | |
| 1 | 0.778 | 0.737 | 0.757 | ||
| accuracy | 0.786 | 0.786 | 0.786 | ||
| macro avg | 0.785 | 0.781 | 0.783 | ||
| weighted avg | 0.785 | 0.786 | 0.785 | ||
| Gradient Boosting | 0 | 0.808 | 0.913 | 0.857 | |
| 1 | 0.875 | 0.737 | 0.8 | ||
| accuracy | 0.833 | 0.833 | 0.833 | ||
| macro avg | 0.841 | 0.825 | 0.829 | ||
| weighted avg | 0.838 | 0.833 | 0.831 | ||
| Neural Network | 0 | 0.583 | 0.304 | 0.4 | |
| 1 | 0.467 | 0.737 | 0.571 | ||
| accuracy | 0.5 | 0.5 | 0.5 | ||
| macro avg | 0.525 | 0.521 | 0.486 | ||
| weighted avg | 0.531 | 0.5 | 0.478 | ||
| K-Nearest Neighbours | 0 | 0.714 | 0.652 | 0.682 | |
| 1 | 0.619 | 0.684 | 0.65 | ||
| accuracy | 0.667 | 0.667 | 0.667 | ||
| macro avg | 0.667 | 0.668 | 0.666 | ||
| weighted avg | 0.671 | 0.667 | 0.667 | ||
| Logistic Regression | 0 | 0.63 | 0.739 | 0.68 | |
| 1 | 0.6 | 0.474 | 0.529 | ||
| accuracy | 0.619 | 0.619 | 0.619 | ||
| macro avg | 0.615 | 0.606 | 0.605 | ||
| weighted avg | 0.616 | 0.619 | 0.612 | ||
| Support Vector Machine | 0 | 0.567 | 0.739 | 0.642 | |
| 1 | 0.5 | 0.316 | 0.387 | ||
| accuracy | 0.548 | 0.548 | 0.548 | ||
| macro avg | 0.533 | 0.527 | 0.514 | ||
| weighted avg | 0.537 | 0.548 | 0.526 | ||
| Naïve Bayes | 0 | 0.561 | 1 | 0.719 | |
| 1 | 1 | 0.053 | 0.1 | ||
| accuracy | 0.571 | 0.571 | 0.571 | ||
| macro avg | 0.78 | 0.526 | 0.409 | ||
| weighted avg | 0.76 | 0.571 | 0.439 |
References
- Dawson, D.; McCulloch, K. Managing fatigue: It’s about sleep. Sleep. Med. Rev. 2005, 9, 365–380. [Google Scholar] [CrossRef] [PubMed]
- Yung, M. Fatigue at the Workplace: Measurement and Temporal Development. Ph.D. Thesis, University of Waterloo, Waterloo, ON, Canada, 2016. [Google Scholar]
- Iqbal, M.; Lee, C.K.M.; Ren, J.Z. Industry 5.0: From Manufacturing Industry to Sustainable Society. In Proceedings of the IEEE International Conference on Industrial Engineering and Engineering Management, Kuala Lumpur, Malaysia, 7–10 December 2018; pp. 1416–1421. [Google Scholar] [CrossRef]
- Görür, O.C.; Rosman, B.; Sivrikaya, F.; Albayrak, S. Social Cobots: Anticipatory Decision-Making for Collaborative Robots Incorporating Unexpected Human Behaviors. In Proceedings of the ACM/IEEE International Conference on Human-Robot Interaction, Chicago, IL, USA, 5–8 March 2018; pp. 398–406. [Google Scholar] [CrossRef]
- Lambay, A.; Liu, Y.; Morgan, P.L.; Ji, Z. Machine learning assisted human fatigue detection, monitoring, and recovery: Review. Digit. Eng. 2024, 1, 100004. [Google Scholar] [CrossRef]
- Buerkle, A.; Al-Yacoub, A.; Eaton, W.; Zimmer, M.; Bamber, T.; Ferreira, P.; Hubbard, E.M.; Lohse, N. An Incremental Learning Approach to Detect Muscular Fatigue in Human– Robot Collaboration. IEEE Trans. Hum. Mach. Syst. 2023, 53, 520–528. [Google Scholar] [CrossRef]
- Haenlein, M.; Kaplan, A. A Brief History of Artificial Intelligence: On the Past, Present, and Future of Artificial Intelligence. Calif. Manag. Rev. 2019, 61, 5–14. [Google Scholar] [CrossRef]
- Lu, Y.; Shen, M.; Wang, H.; Wang, X.; van Rechem, C.; Fu, T.; Wei, W. Machine Learning for Synthetic Data Generation: A Review. arXiv 2021, arXiv:2302.04062. [Google Scholar]
- Lee, P. Synthetic Data and the Future of AI 2024. Available online: https://ssrn.com/abstract=4722162 (accessed on 14 January 2025).
- Hernandez, G.; Valles, D.; Wierschem, D.C.; Koldenhoven, R.M.; Koutitas, G.; Mendez, F.A.; Aslan, S.; Jimenez, J. Machine Learning Techniques for Motion Analysis of Fatigue from Manual Material Handling Operations Using 3D Motion Capture Data. In Proceedings of the 2020 10th Annual Computing and Communication Workshop and Conference, CCWC, Las Vegas, NV, USA, 6–8 January 2020; pp. 300–305. [Google Scholar] [CrossRef]
- Jordan, M.I.; Mitchell, T.M. Machine learning: Trends, perspectives, and prospects. Science 2015, 349, 255–260. [Google Scholar] [CrossRef]
- Shen, M.; Chang, Y.T.; Wu, C.T.; Parker, S.J.; Saylor, G.; Wang, Y.; Yu, G.; Van Eyk, J.E.; Clarke, R.; Herrington, D.M.; et al. Comparative assessment and novel strategy on methods for imputing proteomics data. Sci. Rep. 2022, 12, 1067. [Google Scholar] [CrossRef]
- Babbar, R.; Schölkopf, B. Data scarcity, robustness and extreme multi-label classification. Mach. Learn 2019, 108, 1329–1351. [Google Scholar] [CrossRef]
- Raghunathan, T.E. Synthetic Data. Annu. Rev. Stat. Appl. 2021, 8, 129–140. [Google Scholar] [CrossRef]
- Fonseca, J.; Bacao, F. Tabular and latent space synthetic data generation: A literature review. J. Big. Data 2023, 10, 115. [Google Scholar] [CrossRef]
- Abay, N.C.; Zhou, Y.; Kantarcioglu, M.; Thuraisingham, B.; Sweeney, L. Privacy Preserving Synthetic Data Release Using Deep Learning. In Machine Learning and Knowledge Discovery in Databases; ECML PKDD 2018; Lecture Notes in Computer Science; Springer International Publishing: Berlin/Heidelberg, Germany, 2019; pp. 510–526. [Google Scholar] [CrossRef]
- Abowd, J.M.; Vilhuber, L. How Protective Are Synthetic Data? In Proceedings of the Privacy in Statistical Databases, Istanbul, Turkey, 24–26 September 2008; Springer International Publishing: Berlin/Heidelberg, Germany, 2019; pp. 239–246. [Google Scholar] [CrossRef]
- Bolón-Canedo, V.; Sánchez-Maroño, N.; Alonso-Betanzos, A. A review of feature selection methods on synthetic data. Knowl. Inf. Syst. 2013, 34, 483–519. [Google Scholar] [CrossRef]
- Lambay, A.; Liu, Y.; Morgan, P.; Ji, Z. A Data-Driven Fatigue Prediction using Recurrent Neural Networks. In Proceedings of the 2021 3rd International Congress on Human-Computer Interaction, Optimization and Robotic Applications (HORA), Ankara, Turkey, 11–13 June 2021; IEEE: New York, NY, USA, 2021; pp. 1–6. [Google Scholar] [CrossRef]
- Lambay, A.; Morgan, P.L.; Liu, Y.; Ji, Z. Model Training Through Synthetic Data Generation: Investigating the Impact on Human Physical Fatigue. In Proceedings of the AHFE 2024 International Conference on Applied Human Factors and Ergonomics and the Affiliated Conferences, Nice, France, 24–27 July 2024; p. 100004. [Google Scholar]
- Li, D.C.; Chen, S.C.; Lin, Y.S.; Huang, K.C. A Generative Adversarial Network Structure for Learning with Small Numerical Data Sets. Appl. Sci. 2021, 11, 10823. [Google Scholar] [CrossRef]
- Khaled, E.E.; Hoptroff, R. The synthetic data paradigm for using and sharing data. Cut. Exec. Update 2019, 19, 1–12. [Google Scholar]
- Hernandez, M.; Epelde, G.; Alberdi, A.; Cilla, R.; Rankin, D. Synthetic data generation for tabular health records: A systematic review. Neurocomputing 2022, 493, 28–45. [Google Scholar] [CrossRef]
- Al-Qerem, A.; Ali, A.M.; Attar, H.; Nashwan, S.; Qi, L.; Moghimi, M.K.; Solyman, A. Synthetic Generation of Multidimensional Data to Improve Classification Model Validity. J. Data Inf. Qual. 2023, 15, 1–20. [Google Scholar] [CrossRef]
- Kiran, A.; Kumar, S.S. A methodology and an empirical analysis to determine the most suitable synthetic data generator. IEEE Access 2024, 12, 12209–12228. [Google Scholar] [CrossRef]
- Abedi, M.; Hempel, L.; Sadeghi, S.; Kirsten, T. GAN-Based Approaches for Generating Structured Data in the Medical Domain. Appl. Sci. 2022, 12, 7075. [Google Scholar] [CrossRef]
- Renani, M.S.; Eustace, A.M.; Myers, C.A.; Clary, C.W. The use of synthetic IMU signals in the training of deep learning models significantly improves the accuracy of joint kinematic predictions. Sensors 2021, 21, 5876. [Google Scholar] [CrossRef]
- Rafiei, A.; Rad, M.G.; Sikora, A.; Kamaleswaran, R. Improving mixed-integer temporal modeling by generating synthetic data using conditional generative adversarial networks: A case study of fluid overload prediction in the intensive care unit. Comput. Biol. Med. 2024, 168, 107749. [Google Scholar] [CrossRef]
- Goncalves, A.; Ray, P.; Soper, B.; Stevens, J.; Coyle, L.; Sales, A.P. Generation and evaluation of synthetic patient data. BMC Med. Res. Methodol. 2020, 20, 1–40. [Google Scholar] [CrossRef]
- Lacasa, M.; Prados, F.; Alegre, J.; Casas-Roma, J. A synthetic data generation system for myalgic encephalomyelitis/chronic fatigue syndrome questionnaires. Sci. Rep. 2023, 13, 14256. [Google Scholar] [CrossRef] [PubMed]
- Leonardi, R.; Ragusa, F.; Furnari, A.; Farinella, G.M. Exploiting Multimodal Synthetic Data for Egocentric Human-Object Interaction Detection in an Industrial Scenario. arXiv 2023. [Google Scholar] [CrossRef]
- Mundt, M.; Koeppe, A.; David, S.; Witter, T.; Bamer, F.; Potthast, W.; Markert, B. Estimation of Gait Mechanics Based on Simulated and Measured IMU Data Using an Artificial Neural Network. Front. Bioeng. Biotechnol. 2020, 8, 41. [Google Scholar] [CrossRef] [PubMed]
- Croitoru, F.-A.; Hondru, V.; Ionescu, R.T.; Shah, M. Diffusion Models in Vision: A Survey. IEEE Trans. Pattern. Anal. Mach. Intell. 2023, 45, 10850–10869. [Google Scholar] [CrossRef]
- Zhao, L.; Hu, Y.; Yang, X.; Dou, Z.; Wu, Q. ICDDPM: Image-conditioned denoising diffusion probabilistic model for real-world complex point cloud single view reconstruction. Expert. Syst. Appl. 2025, 259, 125370. [Google Scholar] [CrossRef]
- Yasar, M.N.; Sica, M.; O’Flynn, B.; Tedesco, S.; Menolotto, M. A dataset for fatigue estimation during shoulder internal and external rotation movements using wearables. Sci. Data 2024, 11, 433. [Google Scholar] [CrossRef]
- Reaz, M.B.I.; Hussain, M.S.; Mohd-Yasin, F. Techniques of EMG signal analysis: Detection, processing, classification and applications. Biol. Proced. Online 2006, 8, 11–35. [Google Scholar] [CrossRef]
- Bangaru, S.S.; Wang, C.; Aghazadeh, F. Data quality and reliability assessment of wearable emg and IMU sensor for construction activity recognition. Sensors 2020, 20, 5264. [Google Scholar] [CrossRef]
- Maman, Z.S.; Chen, Y.J.; Baghdadi, A.; Lombardo, S.; Cavuoto, L.A.; Megahed, F.M. A data analytic framework for physical fatigue management using wearable sensors. Expert. Syst. Appl. 2020, 155, 113405. [Google Scholar] [CrossRef]
- Blum, A.L.; Langley, P. Selection of relevant features and examples in machine learning. Artif. Intell. 1997, 97, 245–271. [Google Scholar] [CrossRef]
- Sano, N. Synthetic Data by Principal Component Analysis. In Proceedings of the 2020 International Conference on Data Mining Workshops (ICDMW), Sorrento, Italy, 17 November 2020; pp. 101–105. [Google Scholar] [CrossRef]
- Heine, J.; Fowler, E.E.E.; Berglund, A.; Schell, M.J.; Eschrich, S. Techniques to produce and evaluate realistic multivariate synthetic data. Sci. Rep. 2023, 13, 12266. [Google Scholar] [CrossRef] [PubMed]
- Krishnan, V.; Bugbee, B.; Elgindy, T.; Mateo, C.; Duenas, P.; Postigo, F.; Lacroix, J.S.; San Roman, T.G.; Palmintier, B. Validation of Synthetic, U.S. Electric Power Distribution System Data Sets. IEEE Trans. Smart. Grid. 2020, 11, 4477–4489. [Google Scholar] [CrossRef]
- He, H.; Garcia, E.A. Learning from Imbalanced Data. IEEE Trans. Knowl. Data Eng. 2009, 21, 1263–1284. [Google Scholar] [CrossRef]
- Sokolova, M.; Lapalme, G. A systematic analysis of performance measures for classification tasks. Inf. Process Manag. 2009, 45, 427–437. [Google Scholar] [CrossRef]
- Alharbi, F.; Ouarbya, L.; Ward, J.A. Synthetic Sensor Data for Human Activity Recognition. In Proceedings of the 2020 International Joint Conference on Neural Networks (IJCNN), Glasgow, UK, 19–24 July 2020; pp. 1–9. [Google Scholar] [CrossRef]

Disclaimer/Publisher’s Note: The statements, opinions and data contained in all publications are solely those of the individual author(s) and contributor(s) and not of MDPI and/or the editor(s). MDPI and/or the editor(s) disclaim responsibility for any injury to people or property resulting from any ideas, methods, instructions or products referred to in the content. |
© 2025 by the authors. Licensee MDPI, Basel, Switzerland. This article is an open access article distributed under the terms and conditions of the Creative Commons Attribution (CC BY) license (https://creativecommons.org/licenses/by/4.0/).