Article

Influence of Geometric Dimensions on the Performance of Switched Reluctance Machine

by
Ana Camila F. Mamede
1,*,
José Roberto Camacho
1 and
Rui Esteves Araújo
2
1
School of Electrical Engineering, Universidade Federal de Uberlândia, Uberlândia, Minas Gerais 38408-100, Brazil
2
INESC TEC and Faculty of Engineering, University of Porto, 4200-465 Porto, Portugal
*
Author to whom correspondence should be addressed.
Machines 2019, 7(4), 71; https://doi.org/10.3390/machines7040071
Submission received: 23 September 2019 / Revised: 9 November 2019 / Accepted: 11 November 2019 / Published: 13 November 2019

Abstract

:
In a design of a switched reluctance machine, there are a number of parameters that are chosen empirically inside a certain interval, therefore to find an optimum geometry it is necessary to determine how each parameter acts on the performance of the machine. This work presents a study on the influence of geometric dimensions on the performance of the switched reluctance machine. The analysis is done through finite element simulations based on the variation of one parameter while the others are fixed. Graphical and numerical results of torque and magnetic flux are presented for a 6/4 three-phase machine and an 8/6 four-phase machine. The study presented aims to provide consistent data on which dimensions should be modified for specific applications, and thus to base choices made in the design and optimization stage.

1. Introduction

A switched reluctance machine (SRM) is a doubly salient electrical machine that cannot operate without power electronic switches. Although it was introduced in 1838 [1], SRM was not usable before the development of power electronics and components suitable for its control. SRM has several advantages, such as high reliability, mechanical robustness, simple construction without windings or magnets on the rotor, phase failure tolerance, low manufacturing cost, high torque density, high torque, among others [2,3]. The main disadvantages are the high torque ripple that is inherent in SRM and can cause high vibration rates and acoustic noises; the need for a rotor position sensor; and high friction losses for high speeds. Most of these drawbacks can be reduced by proper design, improved geometry and control methods.
Due to its characteristics, SRM is a strong candidate for numerous industrial, commercial, automotive, domestic applications, among others. SRM’s ability to work with variable speeds, together with the low cost and reliability of SRM, has made this a promising replacement for the induction machine for application in wind power generation. The wide range of wind variation makes it necessary to use a gearbox to adjust the speed of the induction machine. Thus, using the switched reluctance generator would reduce costs and increase the efficiency of the wind power system. Some studies that research the behavior of the switched reluctance generator in variable speed situations are presented in [4,5,6,7].
Additionally, SRM also gained ground in the development of electric and hybrid automotive vehicles. The use of an electric generator connected to the wheel axis, or the generator installed inside the wheel [8], allows the generation of electric energy through the torque provided by the movement of the wheels, thus the batteries can be recharged feeding the car electric system [8]. In [9] the application of a four-phase SRM, of 50 kW power in hybrid electric vehicles is proposed.
The sensitivity analysis is a useful study for any motor designer, it is important to understand the need for such a study in the context of a practical application. For every SRM drive system, there are several design and geometrical parameters that impact the electrical drives performance differently. However, in this study, we only consider the machine dimensions. Several analytical studies have been proposed for SRM using sensitivity analysis techniques [10,11]. However, none of them have focused on the parametric sensitivity analysis to determine the effect of the main parameters in the shape of output torque.
The main contributions of this paper include the following:
  • We describe our approach to geometric influence by analyzing the behavior of SRM output quantities (flux linkage and torque) by finite element simulation for two motors, a three-phase 6/4 SRM and a four-phase 8/6 SRM. This study encompasses the effect of eight dimensions on machine performance, which are individually analyzed to determine its influence on the average torque value and saturation.
  • We present a novel perspective of evaluating the performance of SRM through constructing and analyzing performance graphs, which help the designer to understand which geometric dimensions should be modified for specific applications.
The main findings of this study are an important tool for the designer as it allows him to relate the effects of geometric dimensions to analytical design equations through graphs.
The remainder of this paper is organized as follows. Section 2 of this paper presents considerations about the SRM design and its formulation. The analysis will be developed for two machines, one SRM 6/4 three-phase, and other SRM 8/6 four-phase, these machines are presented in Section 2. Section 3 shows the results obtained by finite element simulations in a graphical and quantitative way, and considerations about these results. Finally, in Section 4, the conclusions are presented.

2. SRM Design Considerations

The general theory governing the design of an electrical machine includes studies in the fields of electromagnetism, arrangement of the windings, the magnetic circuit behavior, inductance and resistance of windings [12]. The process of designing an electric machine takes into account all these studies and the empirical knowledge acquired over the years by designers and researchers. Designing a reluctance machine is not a very complicated task, but several factors must be taken into account during design, such as choosing appropriate values for flux density in the core, air gap, polar arcs. Bad choices can compromise the performance of the SRM final.
In the design of machines, there are a considerable number of free parameters. The task of finding an ideal solution becomes extremely complicated unless the number of these parameters is somewhat limited [12]. Often, machine design includes the selection of table-based parameters that provide empirical data on asynchronous, synchronous, direct current and double-salient machines. These tables provide a range of empirically defined values of flux and current density, for example, for various machine types that can be applied in the preliminary design phase [12]. This situation is repeated for SRM, and several of its parameters are selected in a range of values defined empirically by previous studies.
The SRM design is apparently similar to the design of traditional machines but diverges in several points due to the unique features of SRM. Some features, in fact, simplify the design, such as the absence of coils in the rotor, absence of brushes, empty space between the stator and rotor poles favor ventilation. However, other characteristics such as excessive saturation for some rotor positions, inductance nonlinearity, torque pulsation, negative torque production and the difficulty of modeling SRM make this a delicate process.
SRM performance analysis requires the dimensions of the rotor and stator blades, details of the windings, number of poles and polar arcs [3]. Therefore, an approximate sizing works as a starting point for SRM analysis in order to obtain an improved final design.

2.1. Revisit the Selection of SRM Dimensions

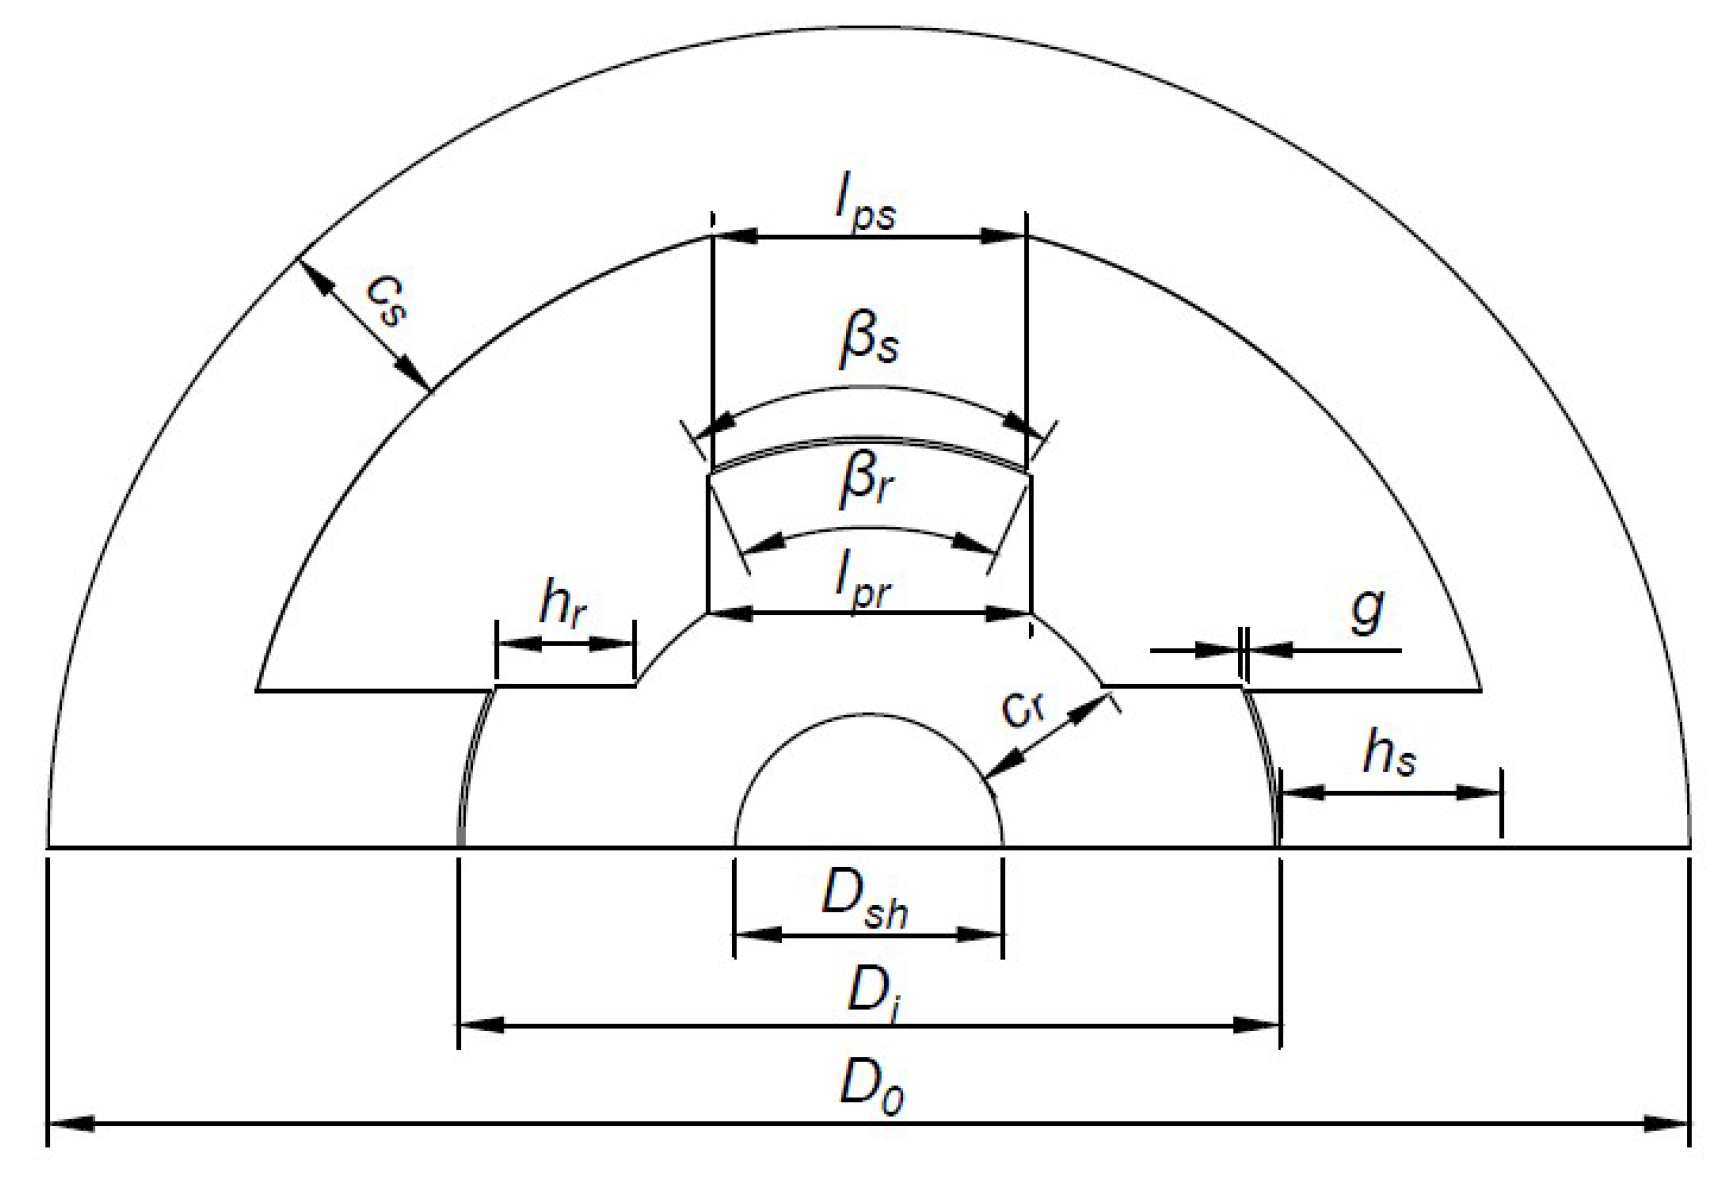
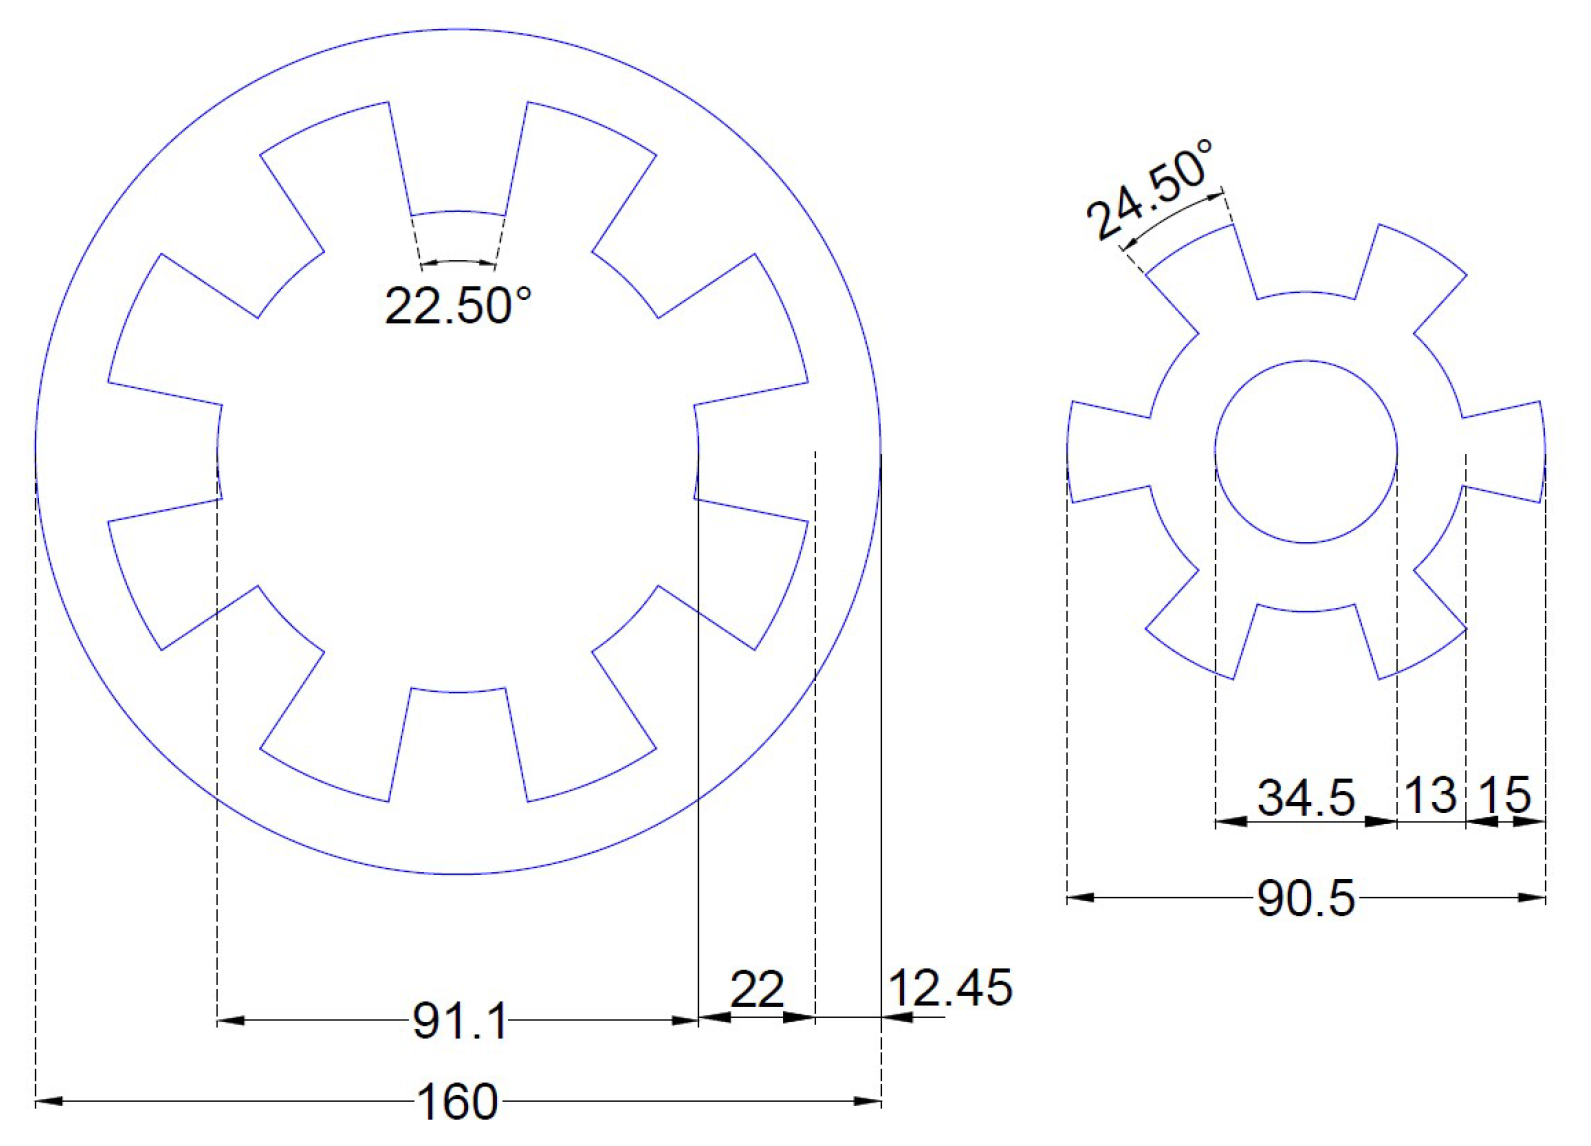
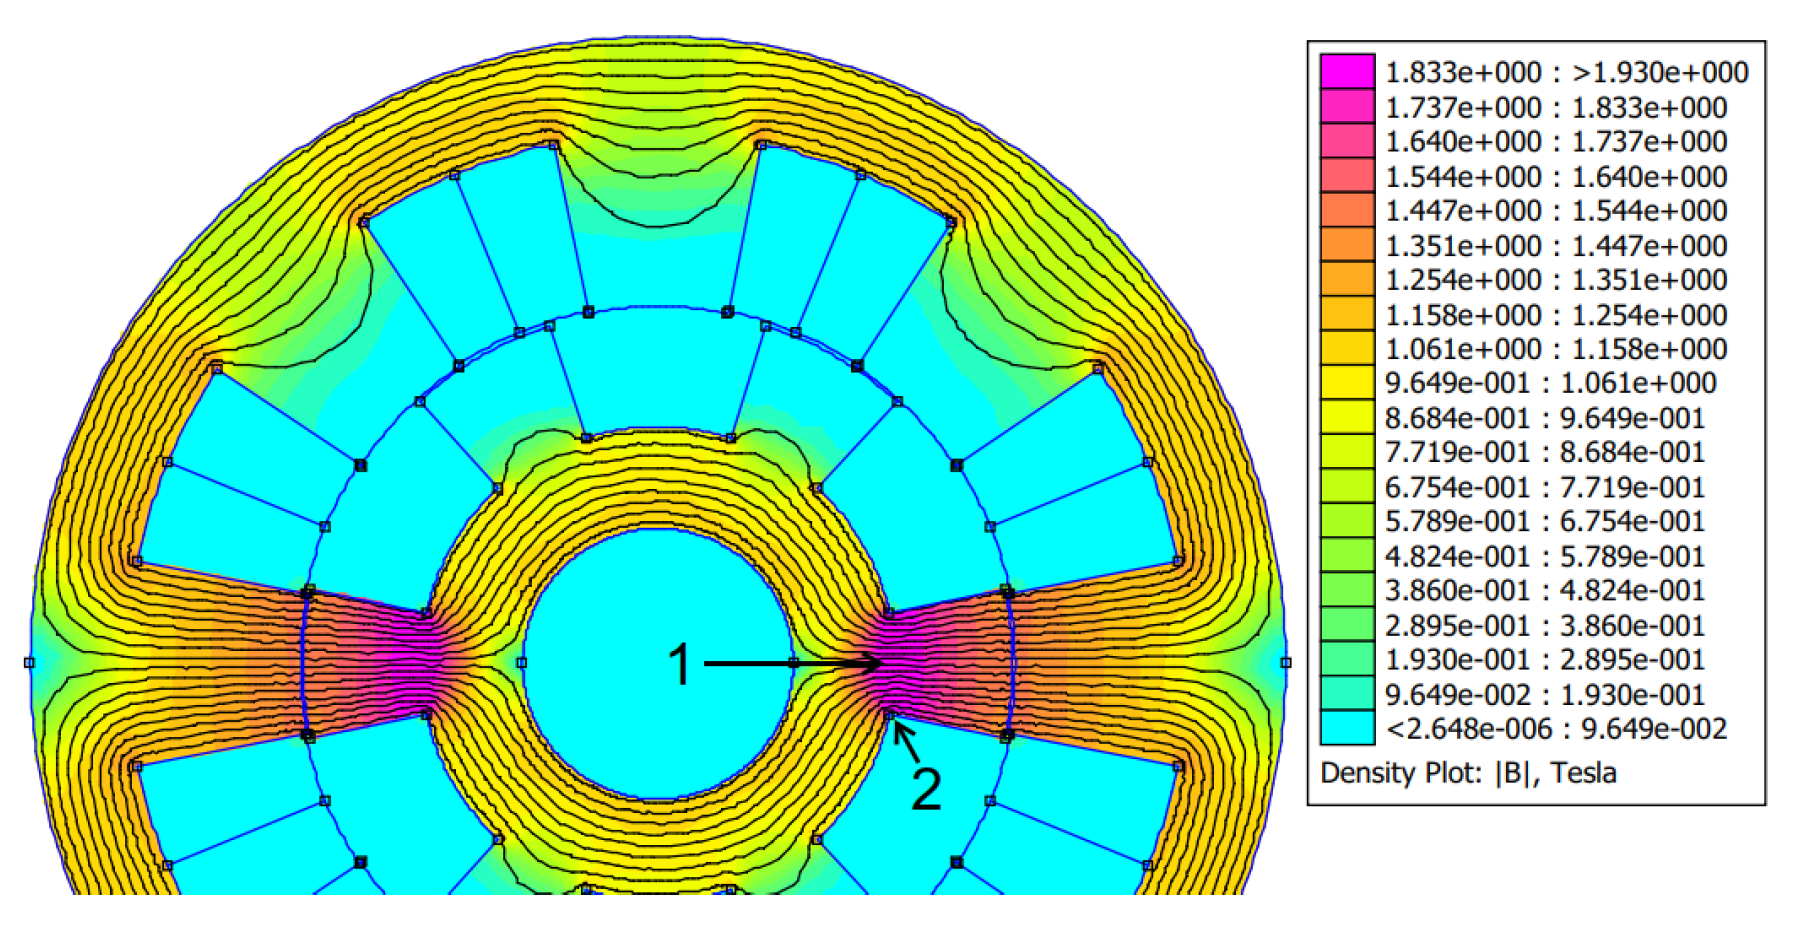
Figure 1 shows all the dimensions that must be determined for the construction of an SRM, where β s is the polar arc of the stator; β r is the polar arc of the rotor; l p s is the width of the stator pole; l p r is the width of the rotor pole; c s is the stator yoke thickness; c r is the rotor yoke thickness; h p s is the height of the stator pole; h p r is the height of the rotor pole; D s h is the diameter of the shaft; D i 
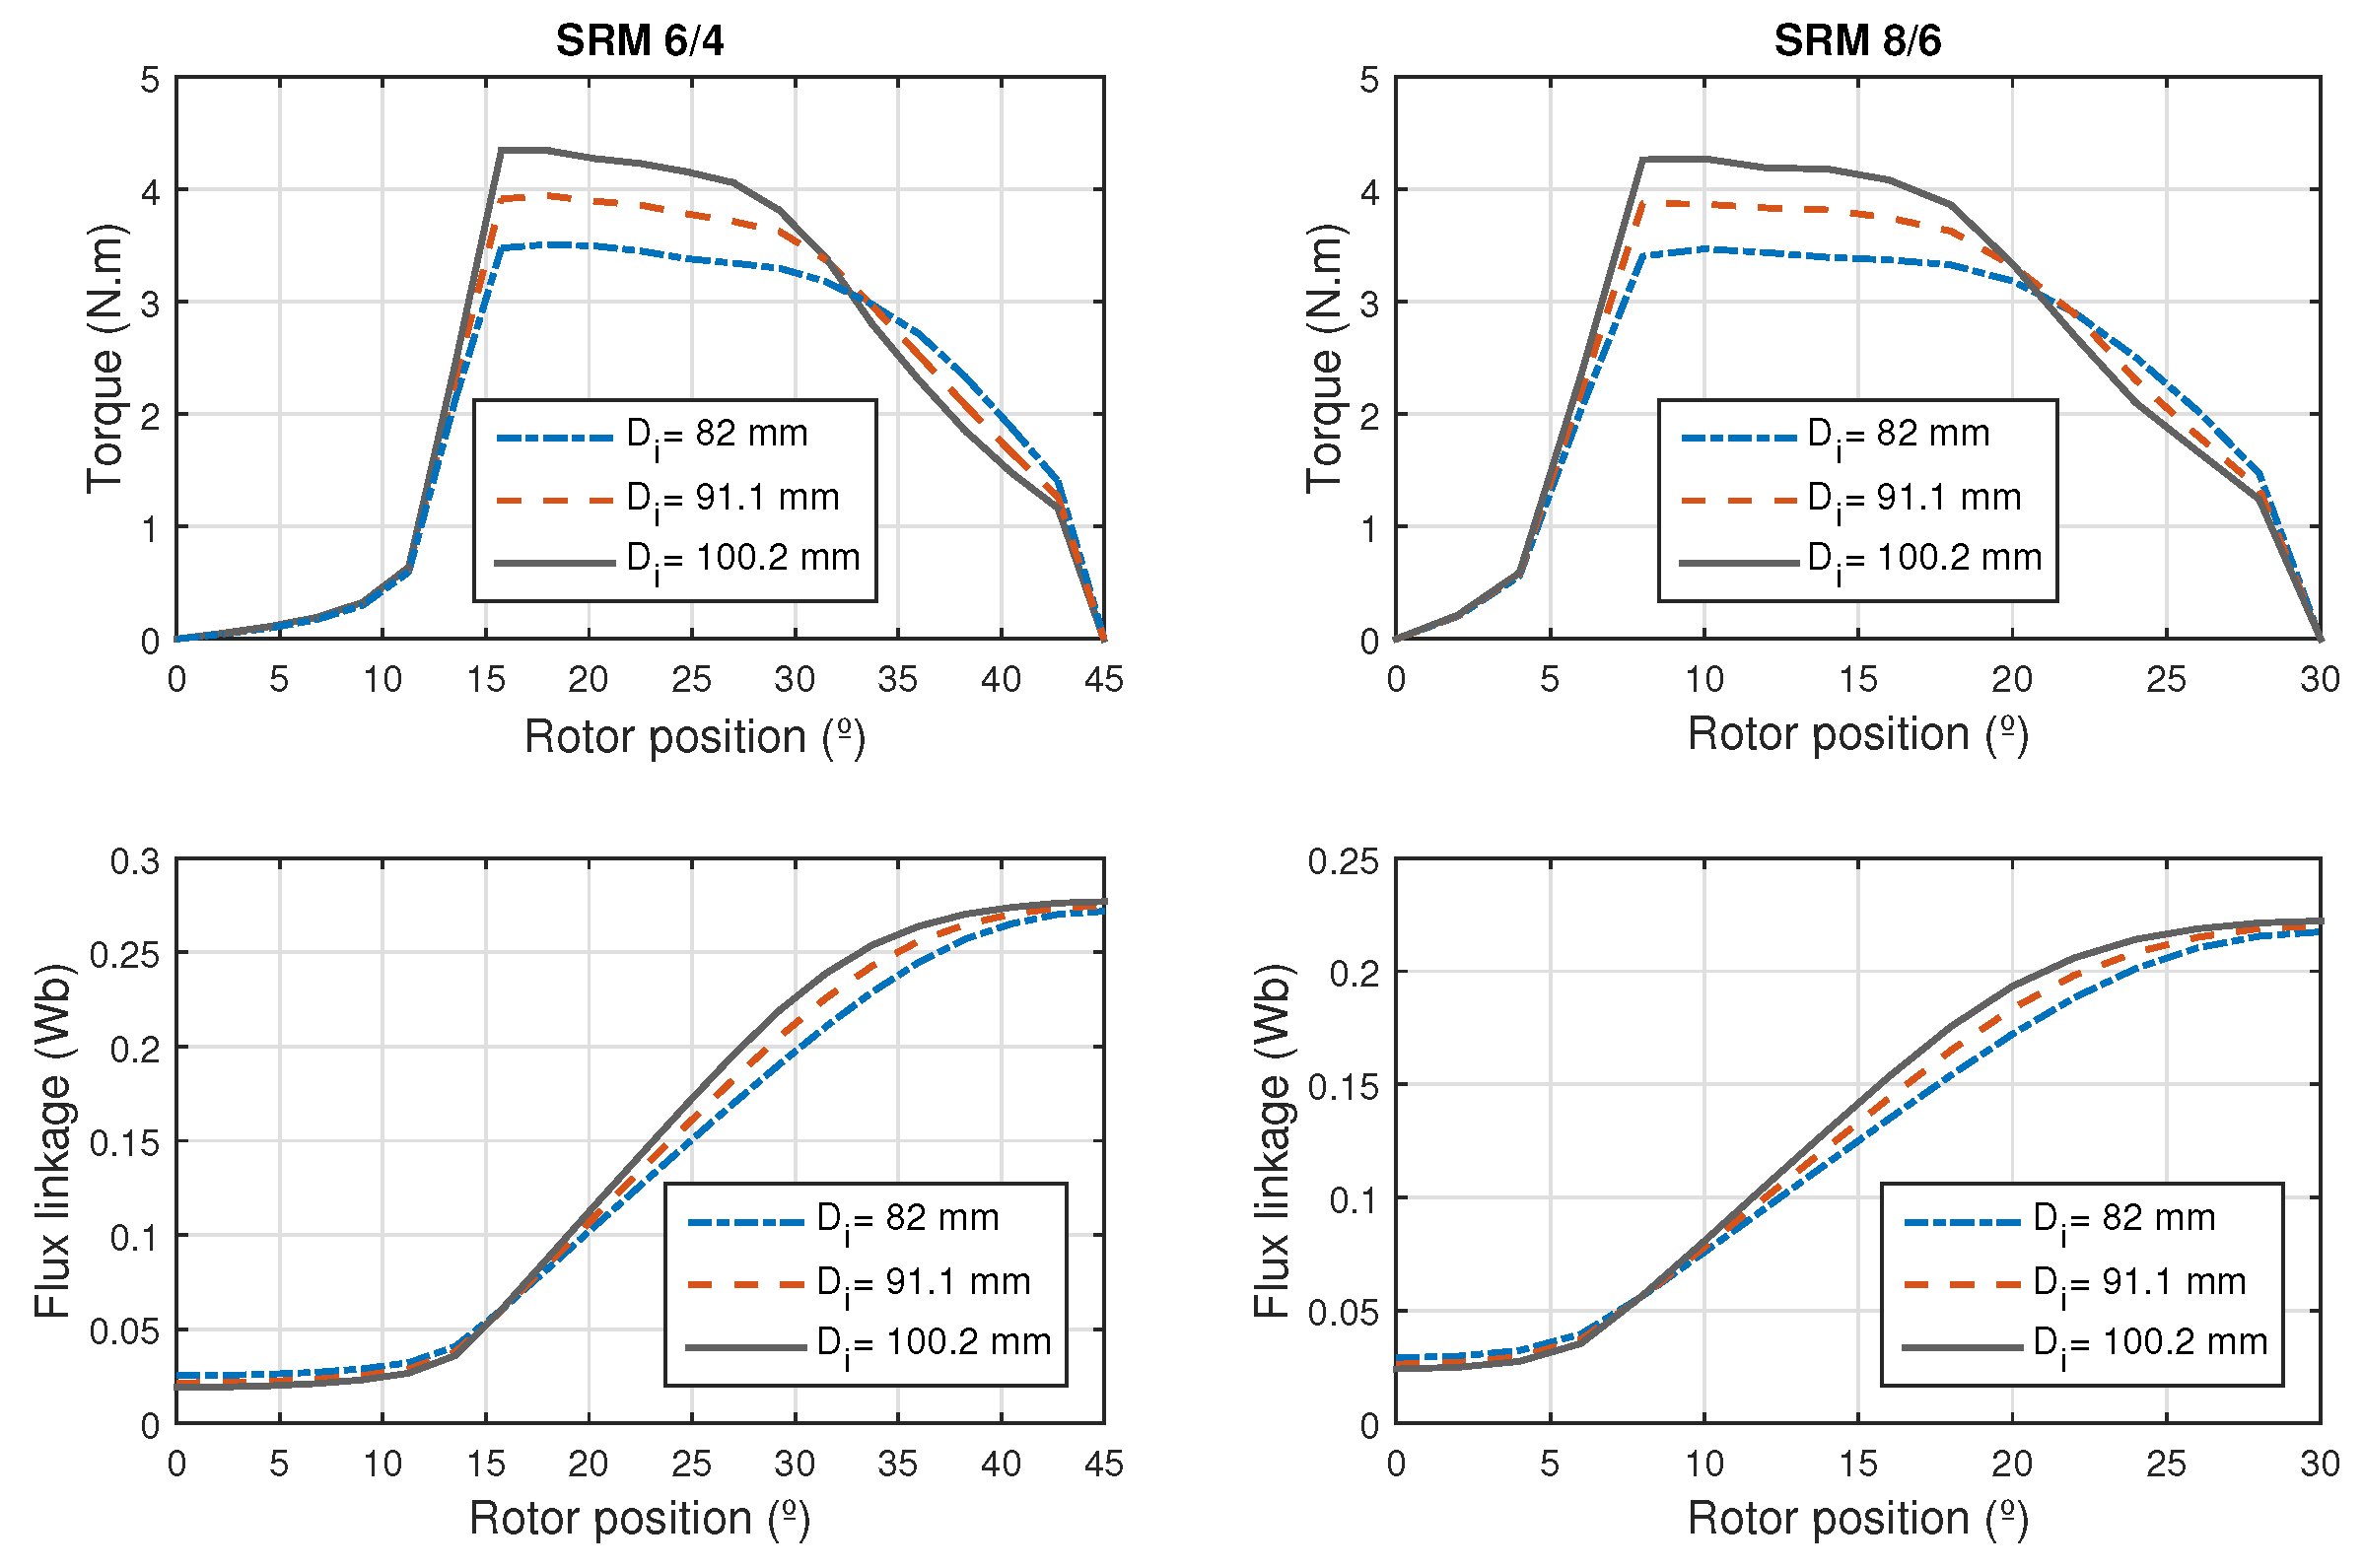
is the inner diameter; D o is the outer diameter; g is the length of the air gap.
The starting point for designing a machine is to obtain the SRM power output equation, this process is presented by [3] and from the output equation is determined the inner diameter of the machine.
D i = P d k L · k e · k d · k 1 · k 2 · B · A s · N r t 3 ,
where P d is the power developed, k L the relationship with the length of the core L, k e the efficiency, k d the duty cycle, k 1 a constant equal to π 2 / 120 , k 2 
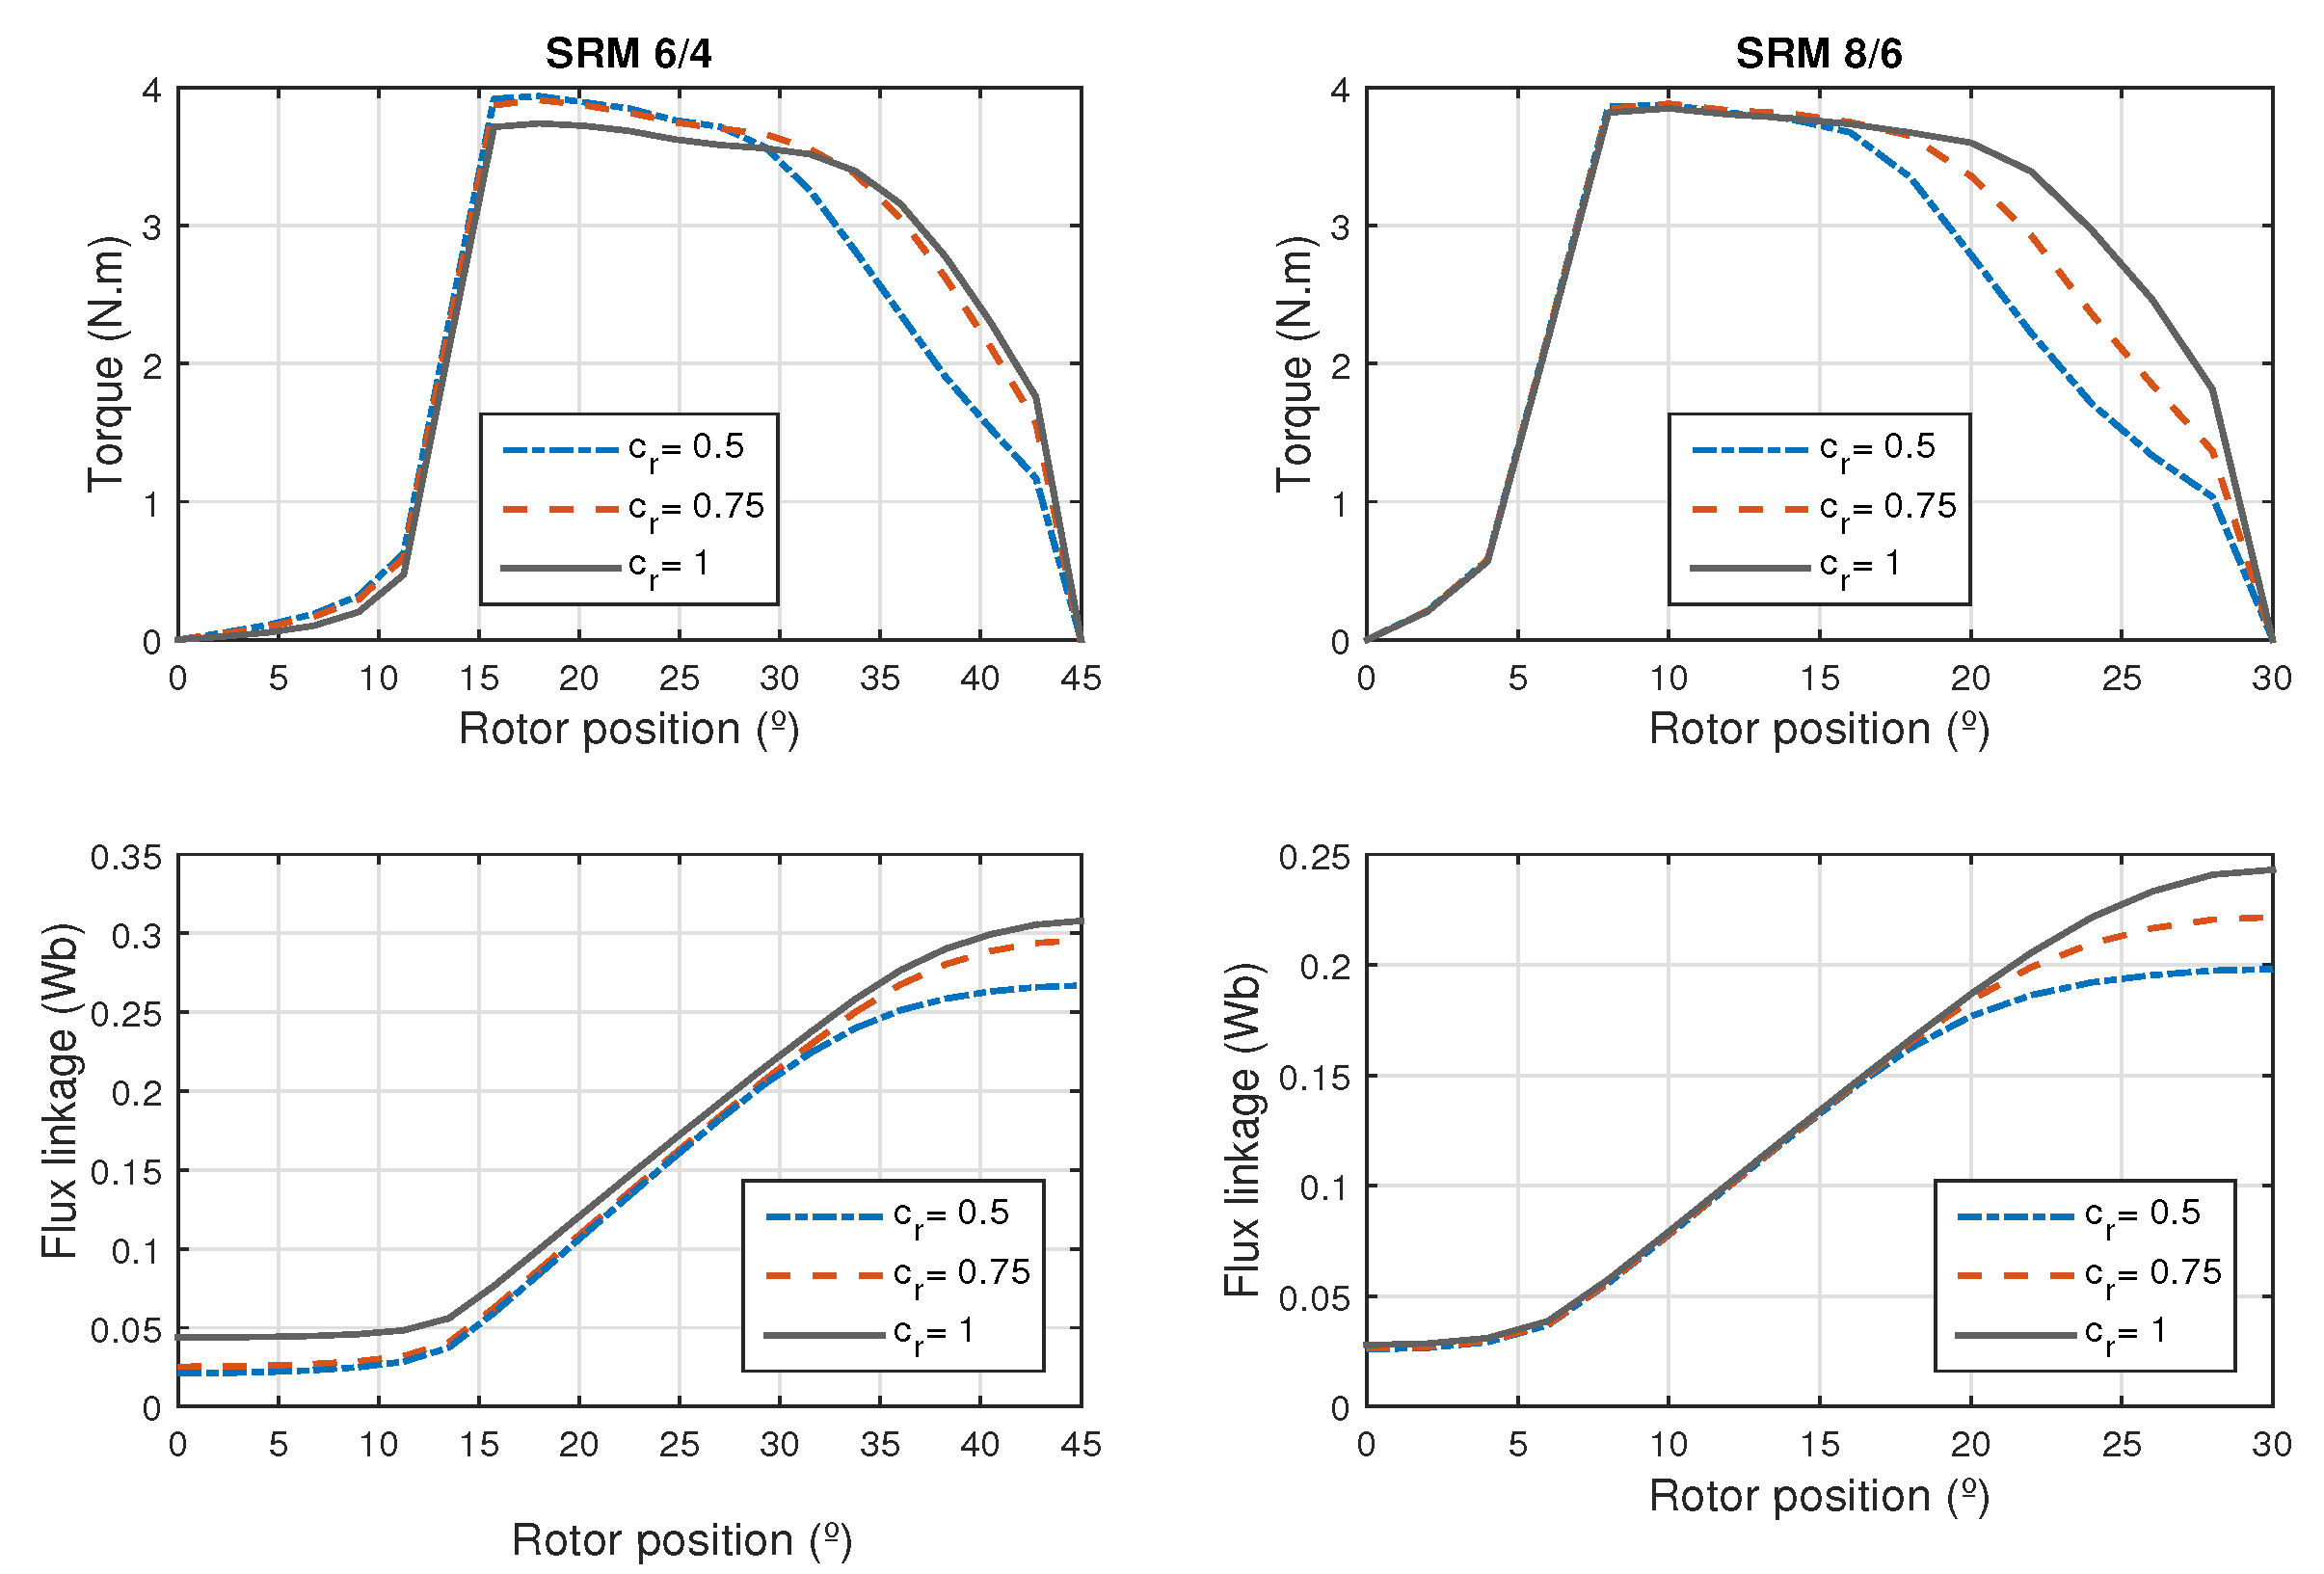
is the ratio between the inductance values in the misaligned and aligned position, B the flux density, A s is the specific electric loading and N r t the rotor speed in rpm.
The length of the core is determined as a multiple of the inner diameter, as shown in Equation (2). The value of k L is decided by the nature of the motor application and space limitation. For non-servo applications, the interval for k L is given by Equation (3), and for servo applications in Equation (4).
L = k L · D i
0.25 k L 0.7
1.0 k L 3.0
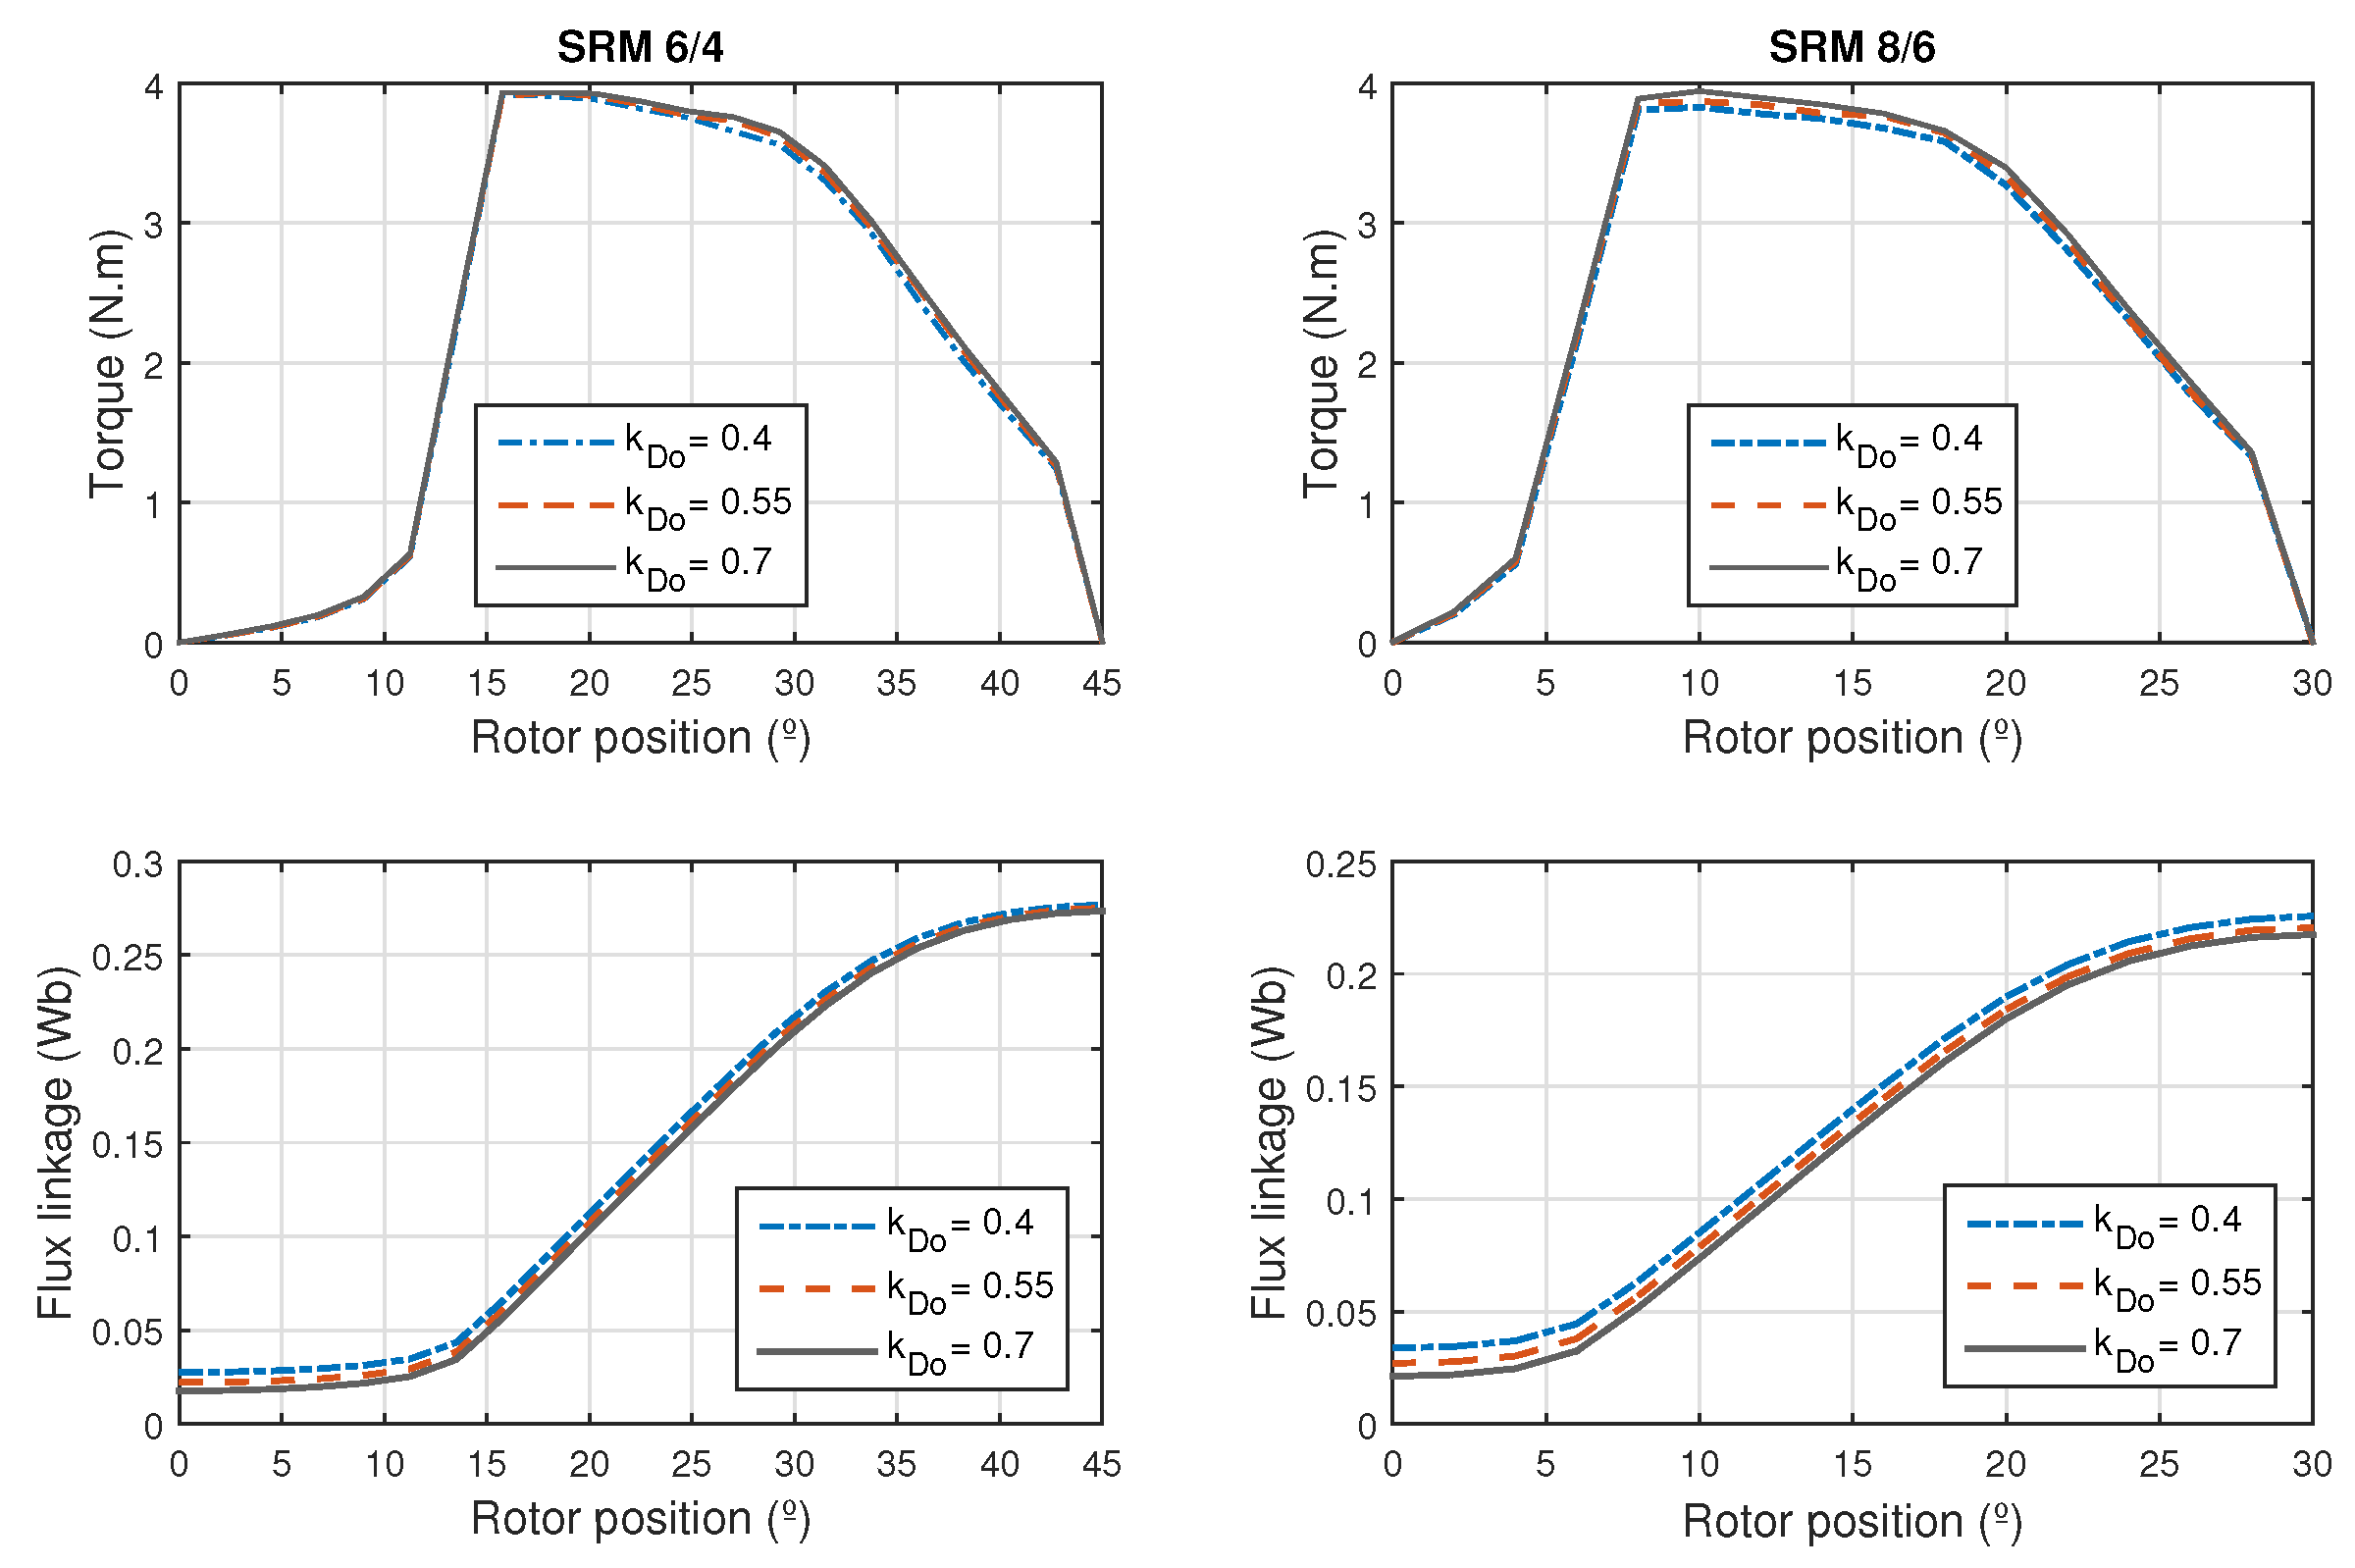
The outer diameter, as well as the core length, is determined as a multiple of the inner diameter. Typically, the internal diameter is 0.4 a 0.7 times the value of the outer diameter [1]. Equation (5) shows this relationship.
D 0 = D i k D 0
0.4 k D 0 0.7
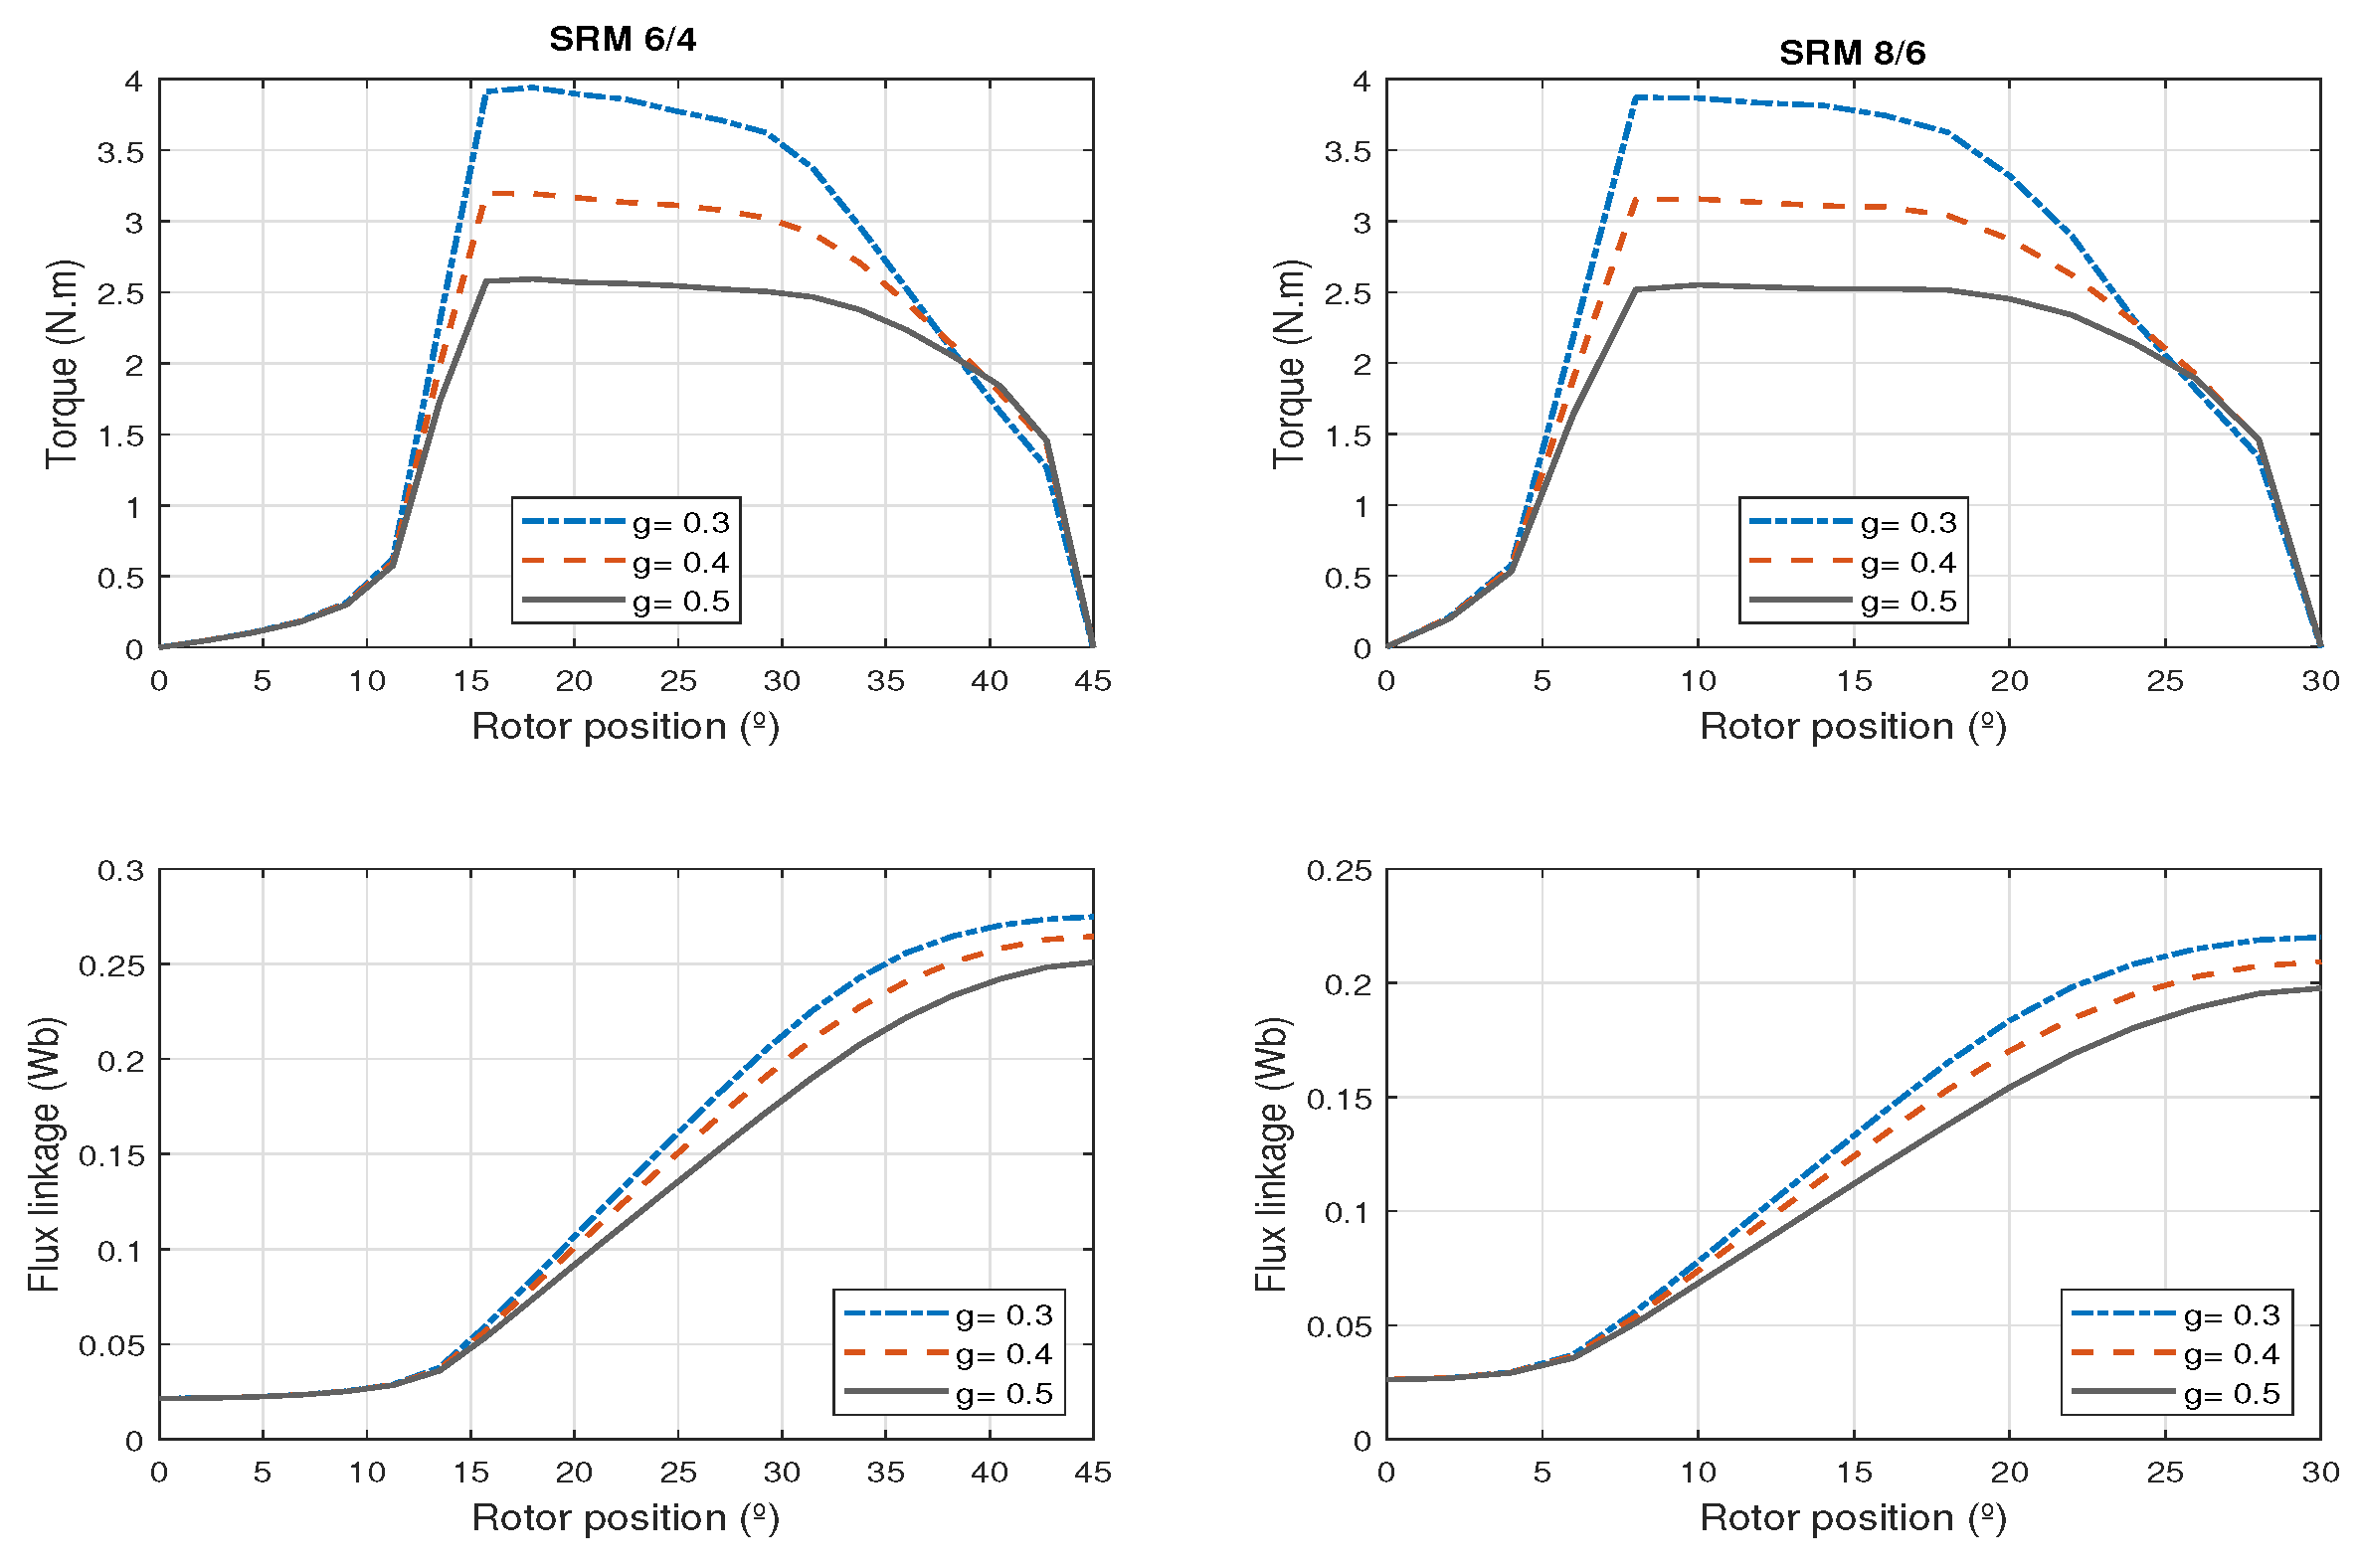
For switched reluctance machines, the air gap must be as small as possible to achieve a high average torque, high ratio between the inductance in the aligned and misaligned positions, with small rotor volumes. For [3] the air gap value should be chosen according to the size of the machine, for small machines, with power less than 1.0 hp, the air gap should vary between 0.18 and 0.25 mm, and machines with power above 1.0 hp may have air gaps from 0.3 to 0.5 mm. For other authors, the air gap length should be selected to be about 0.5 % to 1 % of the rotor diameter [12].
The width of rotor and stator poles are determined by the polar arcs and by the value of inner diameter. Thus, the stator and rotor pole widths may be computed respectively through Equations (7) and (8).
l p s = D i · s i n β s 2
l p r = ( D i 2 g ) · s i n β r 2 .
The stator yoke thickness should be large enough to support half the flux density passing through the stator pole. Therefore, the yoke thickness of the stator must be at least half the stator pole width. However, to improve robustness and minimize vibration and noise an additional factor should be considered. Thus, the value of the stator yoke thickness should be in the range:
l p s > c s 0.5 l p s .
It is recommended to choose values greater than the minimum for c s . Already the rotor yoke does not need to be as thick as the stator yoke thickness and neither has to be equal to the minimum value, which is equal to the minimum value of the stator yoke thickness. The rotor yoke thickness in terms of the stator pole width can be set in the range given below:
0.5 l p s < c r < 0.75 l p s .
Given the values of the outer and inner diameter and the stator yoke thickness, we can calculate the stator pole height value from Equation (11).
h s = D 0 D i 2 c s 2 ,
The height of the rotor pole can be determined in the same way, and is defined by:
h r = D i 2 g D s h 2 c r 2 .
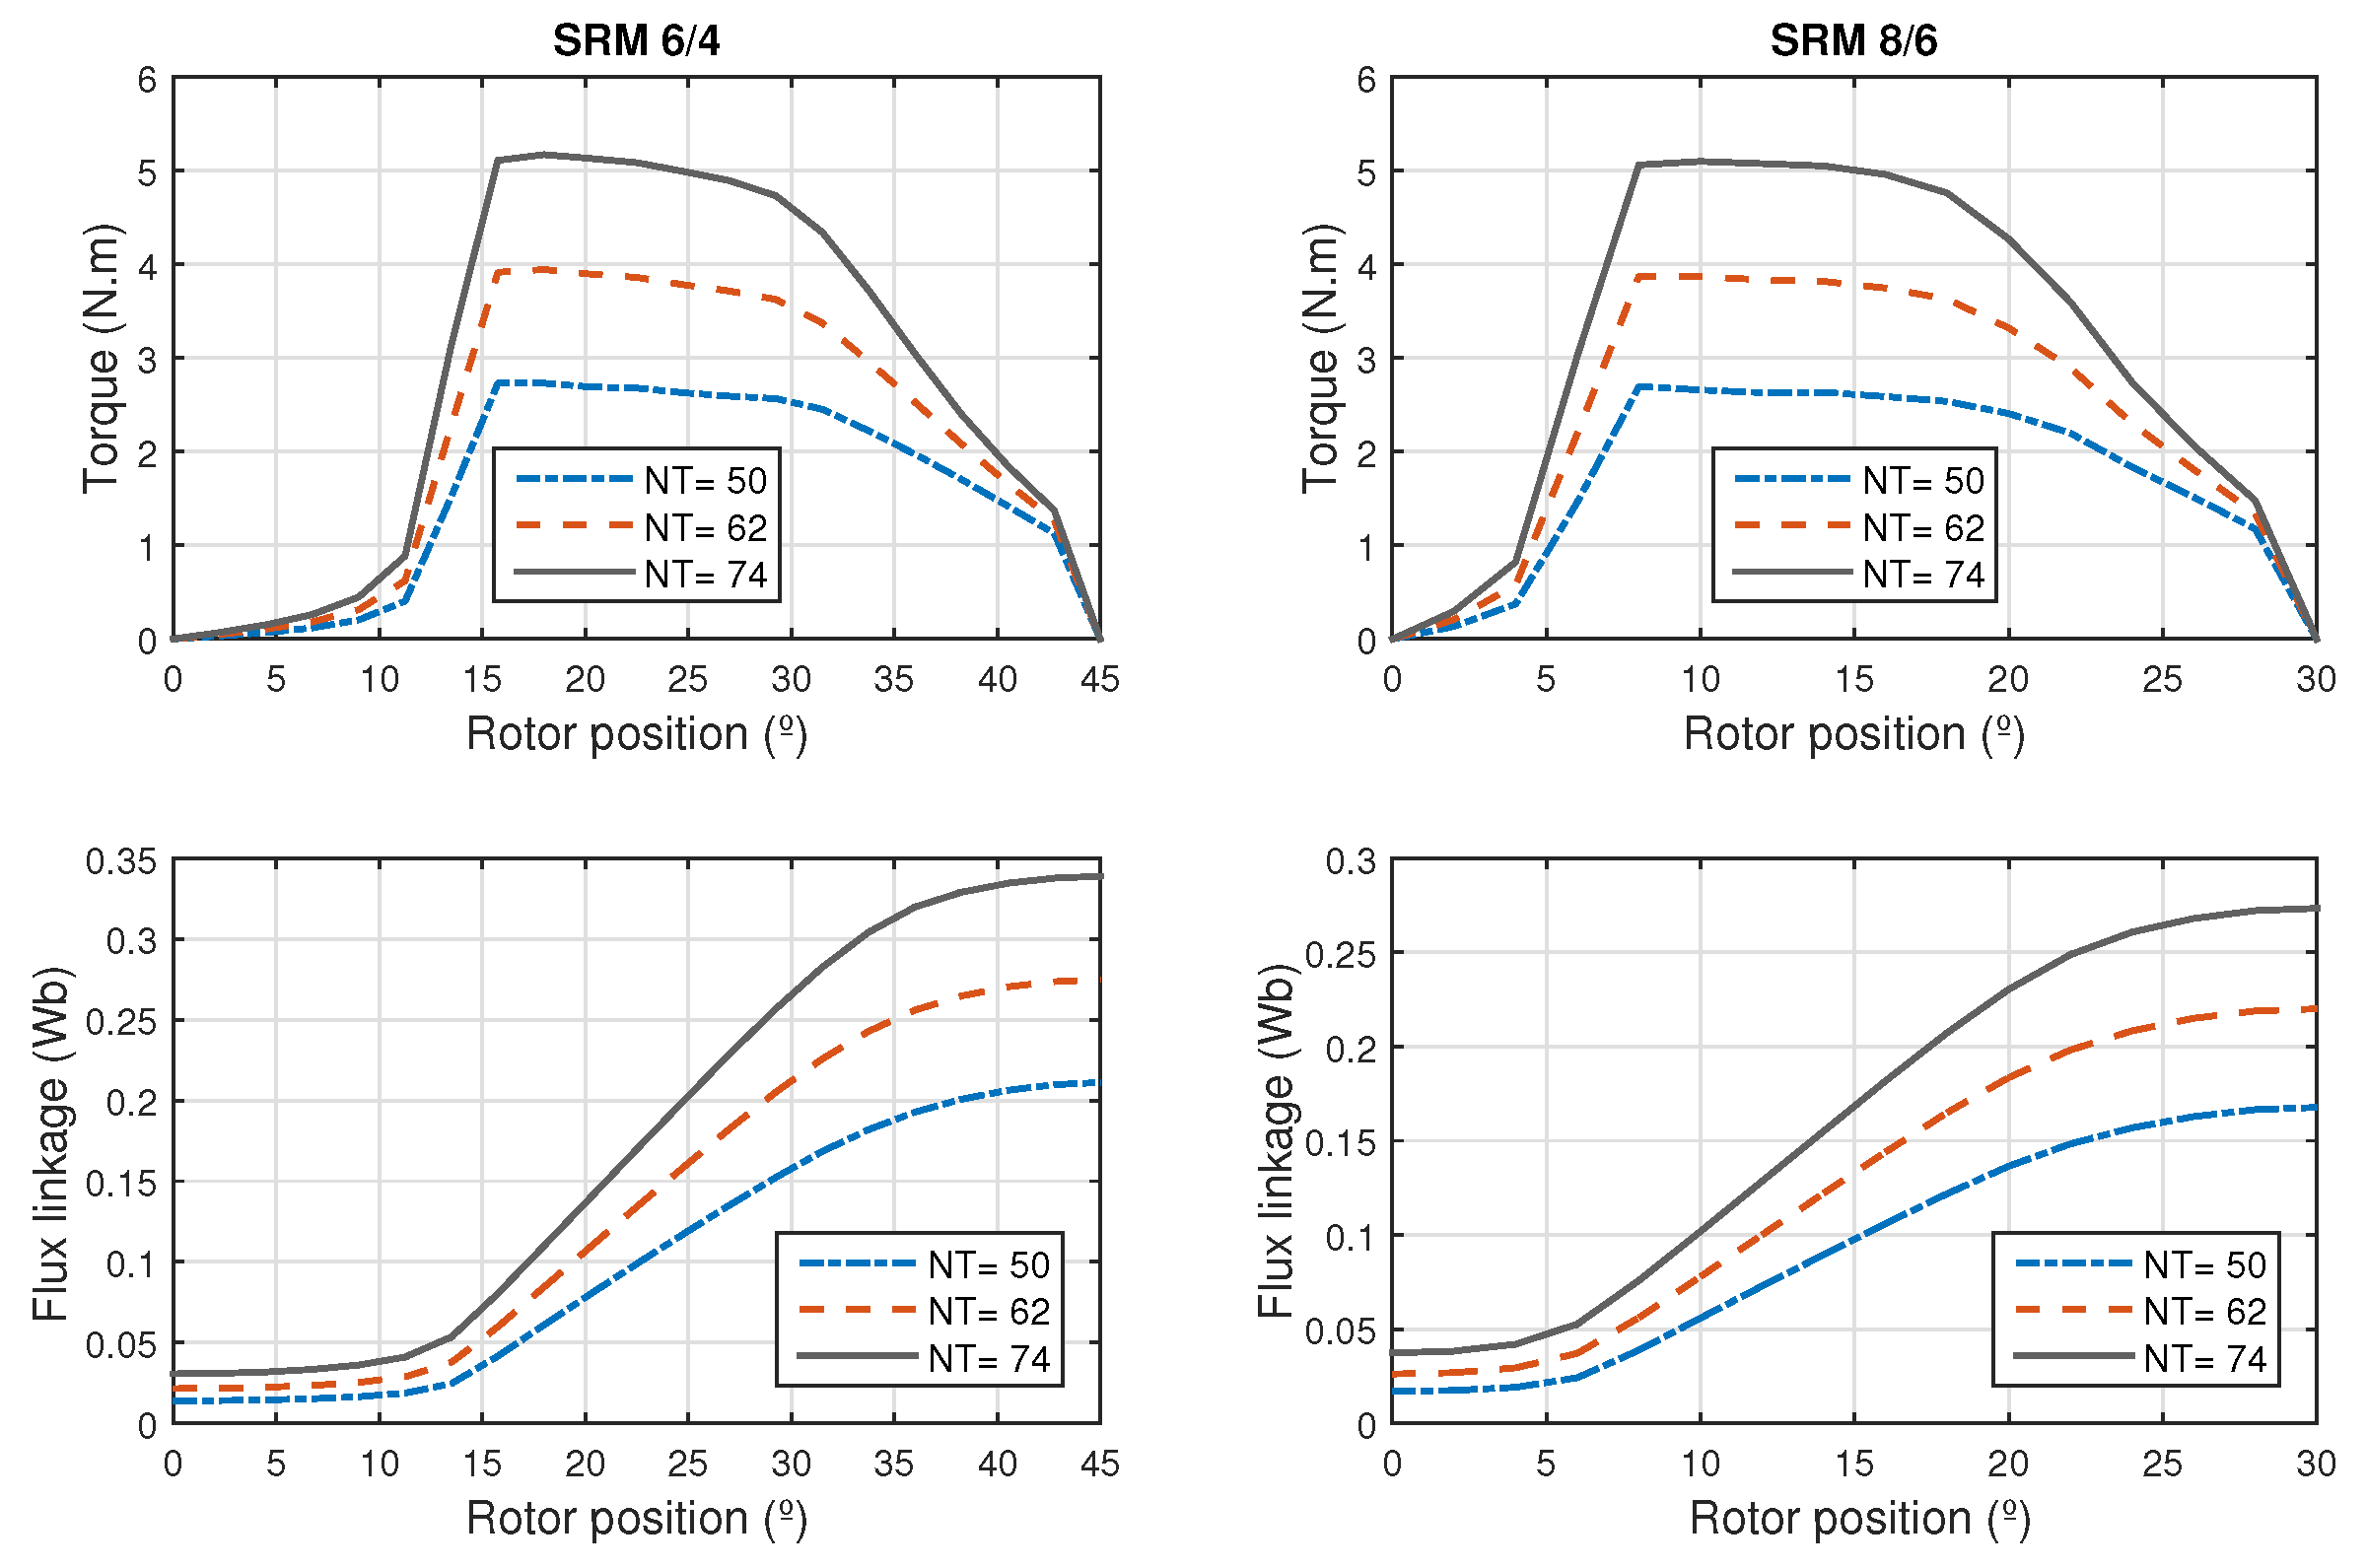
The number of turns ( N T ) per phase of the SRM can be calculated in terms of the magnetic field strength in the air gap ( H g ), the peak current ( I p ) and the air gap length, see Equation (13)
N T = 2 g I p · H g = 2 g I p · B μ 0 .
If J c it is the maximum current density allowed in a coil and q othe number of phases, the conductor section is calculated as:
a c = I p J c q .
The values of the polar arcs of the stator and the rotor are chosen to guarantee the proper starting of the machine and to shape the motor torque profile [3]. These requirements are inserted into the SRM project by offering a lower and upper limit for the values of the polar arcs. In order to guarantee the proper starting of the machine and to prevent the occurrence of parasitic currents due to the magnetic flux dispersion effect, the rotor polar arc must be larger than the polar arc of the stator [3,13].
β r β s .
Krishnan in [3] showed that the minimum value for polar arcs is set according to the number of poles of the machine by Equation (16).
min [ β s ] = 4 π N s · N r .
The angle between the corners of the adjacent rotor poles must be greater than the polar arc of the stator or there will be an overlap of the stator and rotor poles in the non-aligned position [14]. This implies that the minimum inductance value will be greater, reducing the difference between the maximum and minimum values, which leads to a reduction in the torque value. This relation is presented in Equation (17).
2 π N r β r > β s .
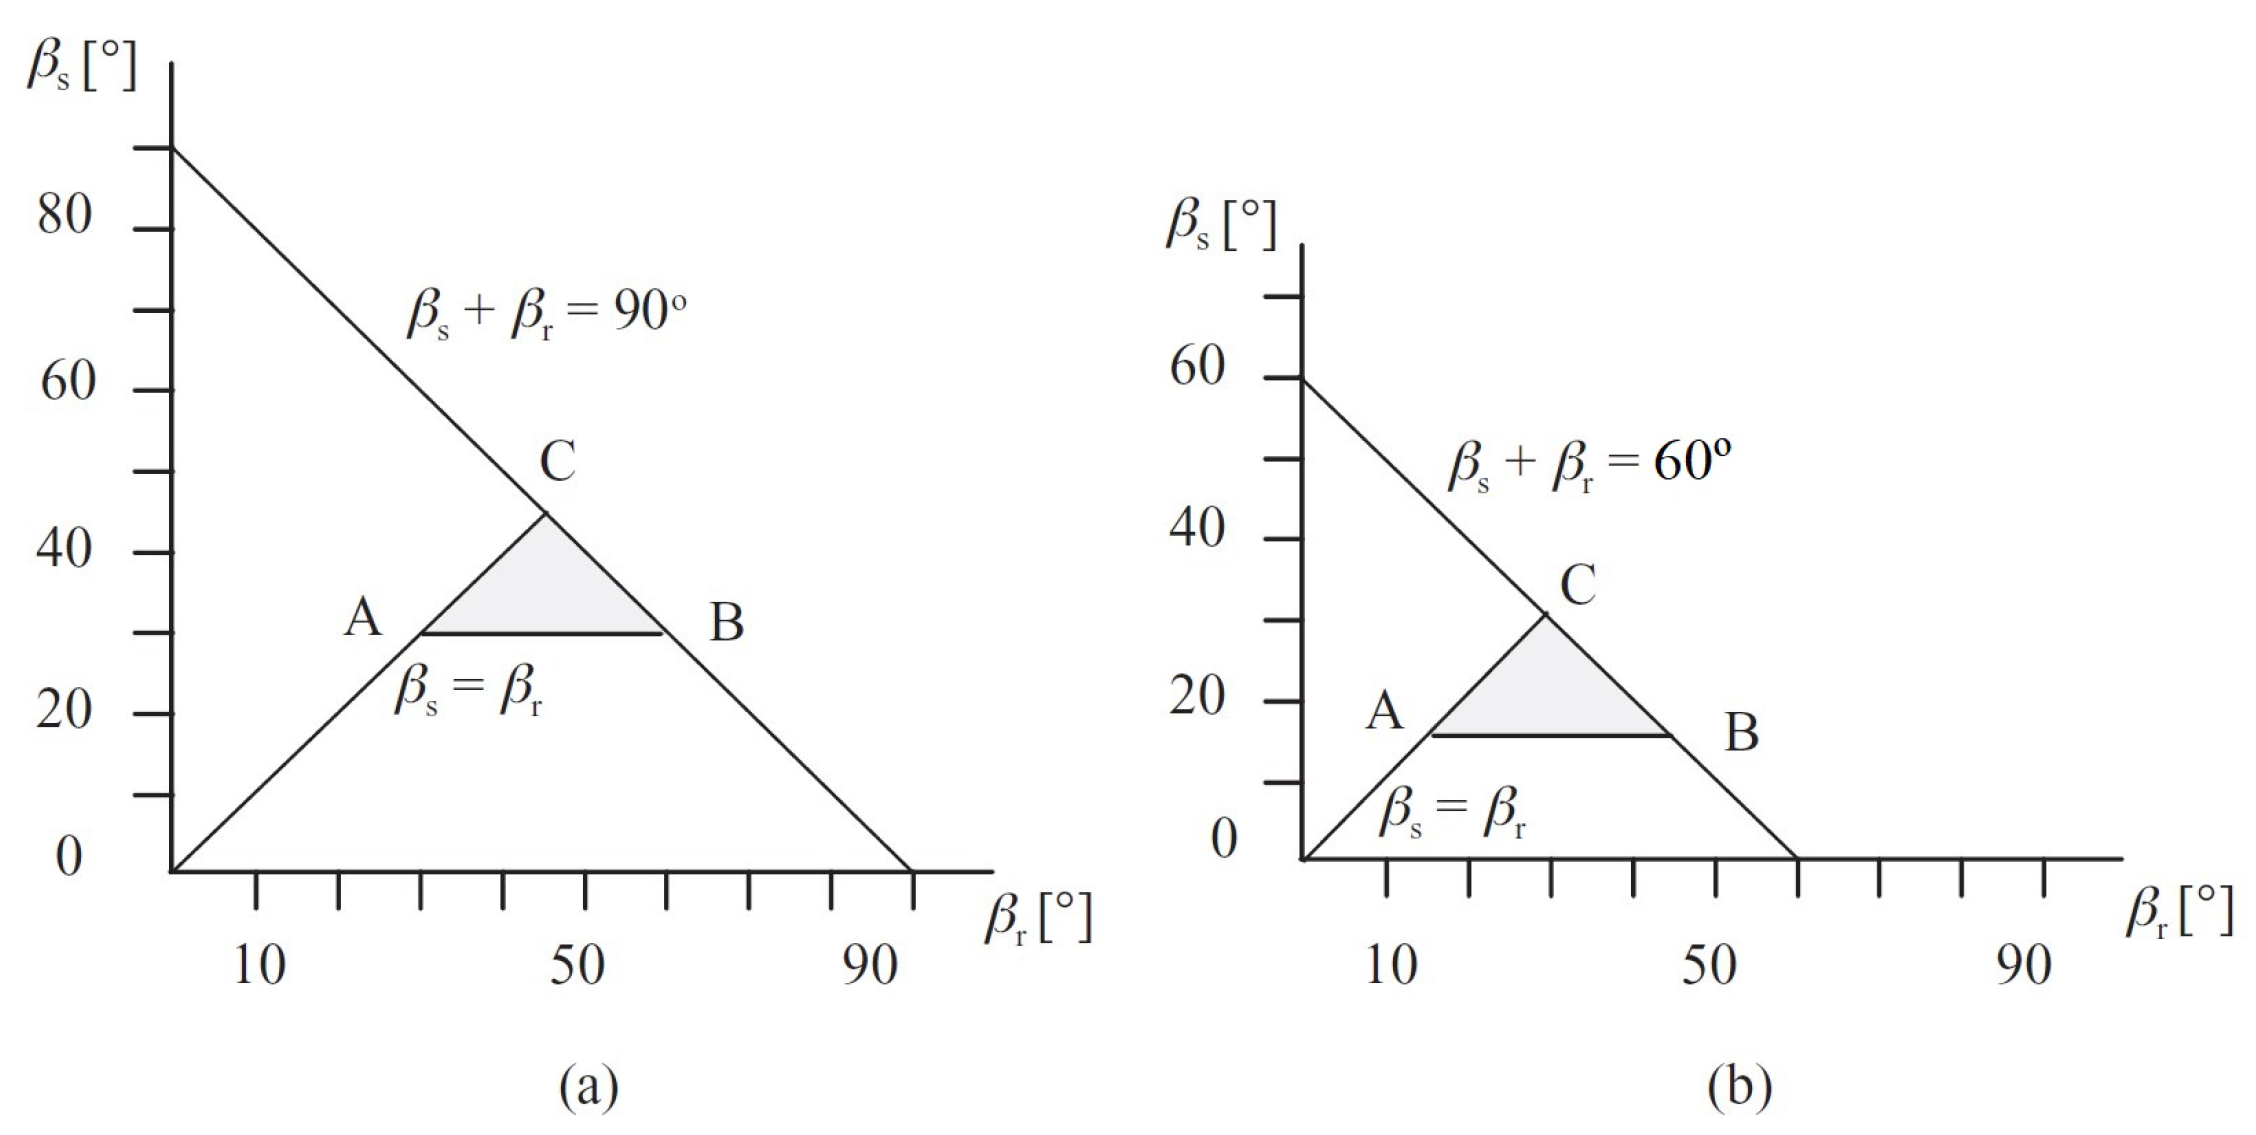
The conditions presented in Equations (15)–(17) can be represented graphically in a triangle of possibilities. It is necessary that the values of the polar arcs of the machine are in this triangle [14]. Figure 2 shows the triangle of possibilities for a SRM 6/4 and a SRM 8/6. For example, for a, SRM 8/6, if β s = 20 so 20 β r 40 .

2.2. Simulated Motors

From the design procedures of the SRM shown in Section 2.1, it can be seen that there are a number of free parameters and, moreover, a large part of the machine dimensions are chosen by a given range empirically. Thus, to find an optimal geometry it is necessary to determine how each parameter acts on the performance of the machine and thus to base the choices of a design for a given application. The analysis will be supported by data obtained from two exploratory SRM.
The behavior of the SRM output quantities (flux linkage and torque) is analyzed by finite element simulation for two motors, one three phases 6/4 SRM and four phases 8/6 SRM. The 8/6 SRM is studied as it was designed in [15], the 6/4 SRM is adapted from the previous one, changing only the number of poles and value of the polar arcs.
Figure 3 and Figure 4 show the stator and rotor blades of these machines with some dimensions indicated in mm. The rated power of the SRM is 2.2 kW (3 hp) and the rated current is 10 A. Under these conditions, the average torque developed by 6/4 SRM is 3.3 N · m and 5 N · m by 8/6 SRM. Figure 5, Figure 6, Figure 7 and Figure 8 show the three-dimensional curve of inductance and torque in relation to the rotor position and current for 6/4 SRM and 8/6 SRM.

3. Analysis of the Influence of Geometrical Dimensions

This section aims to analyze the influence of each geometric dimension on SRM performance. For this, graphical and numerical results obtained through finite element simulations will be presented. This study will allow, in addition to the understanding of the influence of the parameters in the performance, the reduction of parameters and simplification of the modeling, also reducing its computational cost.
The computational simulation was carried out using the finite element method. The data were obtained using FEMM, which is a free software downloaded from www.femm.info. Each changed dimension will take three values in accordance with the intervals indicated in the design stage, a minimum, a average and a maximum value. FEMM utilizes adaptive mesh refinement which improves the convergence of important post-processed quantities like force, torque, and energy. Figure 9 and Figure 10 show the mesh generated by FEMM for SRM 6/4 and SRM 8/6, respectively. For certain dimensions that are function of other dimensions, such as the stator yoke thickness ( c s ), the rotor yoke thickness ( c r ) and the outer diameter ( D 0 ), the graphics will be presented as a function of the indicated range. To evaluate the influence of each individual parameter, the other motor parameters are kept fixed. The magnetic saturation of the motor was analyzed through the absolute value of B (flux density at T) at two SRM points, where the highest values of B in the machine are observed. These points are presented in Figure 11 and Figure 12.

3.1. Stator Polar Arc

For this analysis, all dimensions of the machines are maintained and the stator polar arcs assume the minimum, average and maximum values defined in the design step. Through the triangle of possibilities presented in Figure 2, the range of choice for the polar arcs of the stator are:
30 β s 6 / 4 45
15 β s 8 / 6 30 .
Figure 13 shows the flux linkage and torque graphs for the positive half-cycle of a SRM phase and Table 1 the average torque and B values for 6/4 and 8/6 SRM.
From the graphs shown in Figure 13, it can be observed that the increase of the polar arc of the stator causes an increase on the value of flux in the unaligned position, due to the greater overlap area with the rotor pole and the reduction on fringing magnetic flux.
The effective torque zone corresponds to the region in which the machine is capable of producing effective torque. For an SRM this value is lower than the stator polar arc β s but larger than the energy conduction angle ϵ [14]. The value of ϵ can be calculated by Equation (20).
ϵ = 2 π N s 2 N r .
Therefore, the larger the value of β s the longer the period of production of positive torque, consequently there is a significant change in the shape of the torque profile. For motors with more than three phases, when phase overlaps occurs this value influences the total torque and the torque ripple. For single and double phase SRM, the value of the stator polar arc will directly influence the value of the average torque available for the load.
The results presented in Table 1 confirm the comments made, with the increase of β s there is the growth of average torque and B values. However, this growth is not linear, for the upper values of the analyzed range the torque growth was very small. The shape of torque and flux linkage change as well.
Thus, the choice of the value of the polar arc of the stator must take into account the space between poles, to accommodate the coils, the value of the developed average torque and the shape of the torque profile, since the total torque of an SRM is the sum of the torques of its phases. Generally speaking the shape of the torque/flux profile will influence the total torque and ripple value, being also fundamental for the control of the machine.

3.2. Rotor Polar Arc

Since the value of β s is fixed, the range for choosing the polar arc of the rotor is then determined by the lower line of the possibilities triangle shown in Figure 2, presented as follows in Equations (21) and (22).
30 β r 6 / 4 60
22.5 β r 8 / 6 37.5 .
Figure 14 shows the flux linkage and torque plots for the positive half-cycle of a phase and Table 2 the average torque and B values for each SRM.
The graphs of Figure 14 show the same phenomenon presented in the variation of β s , which is the increase of the flux in the unaligned position with the increase of β r . In addition, it is observed that the larger the difference between β r and β s the larger the region where there is no torque production, which causes the reduction of the average torque value. Thus, it is observed that for the studied machines it is not interesting to have a very high value of β r since it results in a considerable region where there is no torque production, see torque curve for β r = 60 and β r = 37.5 for 6/4 and 8/6 SRM respectively. This is reflected in the torque values presented in Table 2 when for high values of β r there is a reduction in the value of the developed average torque and the reduction of B indicates a great reduction in the magnetic saturation of the SRM.

3.3. Stator Yoke Thickness

The stator yoke must be chosen according to the width of the stator pole, which in turn is determined by the polar arc of the stator. The range of choice for c s is given in Equation (9). Thus, the values chosen for the stator yoke in this study are according to the constant that is multiplied by l p s , and assume values of 0.5 , 0.75 and 1, both for 6/4 SRM and for 8/6 SRM.
Figure 15 shows the graphs of torque and flux linkage for the variation of c s and Table 3 the average torque value and B values.
For the variation of the stator yoke, it is observed that there is a slight variation in the value of the flux in the aligned position, and this also causes a small change in the torque profile. For 6/4 SRM, the torque curve of c s = 0.75 and c s = 1 are very close, as are the values presented in Table 3. This behavior repeats for 8/6 SRM, the curves and values are very close.
Therefore, the stator yoke has little influence on the flux linkage and torque produced by a SRM, so from the point of view of the stator volume/mass and the results presented here it is interesting to have a lower value of c s .

3.4. Rotor Yoke Thickness

The rotor yoke ( c r ) must be chosen within the range shown in Equation (10). However, as its influence on vibration is known this parameter will be analyzed with a larger interval, the same as the stator yoke. Following the same stator yoke pattern, the values analyzed were the same for both machines. Figure 16 shows the effects of c r variation on torque and flux linkage and Table 4 the average torque and B values at which particular c r .
From Figure 16 it can be observed that the rotor yoke thickness has significant influence on the shape of torque profile and on the maximum value of the flux linkage and consequently on the value of the average torque, as shown in Table 4. This means that with a higher rotor yoke thickness value a greater amount of energy is transferred from the stator to the rotor and to the motor shaft, hence the significant increase in torque.
Moreover, it is also observed that the variation of the rotor yoke had a more significant effect on the 8/6 SRM. According to the values presented in Table 4 there was an increase of approximately 9.13 % in the value of the average torque for c r = 0.75 in relation to c r = 0.5 , while for 6/4 SRM this increase was around 7.22 % .

3.5. Inner Diameter

The inner diameter is one of the first dimensions determined for a SRM. In order to understand how the D i affects the SRM performance, D i is gradually modified in ± 10 % . Figure 17 shows the torque and flux linkage in this conditions. Table 5 shows the average torque and B values.
It can be seen from Figure 17 that the value of the inner diameter interferes with the slope of the growth curve of the flux linkage and, consequently, the maximum value reached by the torque, as evinced by looking at Figure 17. In addition, it was noticed that there was not a significant difference between the maximum and minimum values of the flux linkage, but still the average torque value changed about 5 % , this happens because the saturation/power developed by the machine also changed.

3.6. Outer Diameter

The outer diameter is determined as a multiple of the inner diameter, as shown in Equation (5). The values of k D 0 adopted in this study will be 0.4 , 0.55 and 0.7 , typical values according to [1]. The effects of the variation of D 0 in the torque and flux linkage are presented in Figure 18 and the average torque and B values is presented in Table 6.
It is apparent from Figure 18 that the value of D 0 has an effectively small influence on the flux linkage and torque in the machines studied, this happens because the contact area between the stator and the rotor has not been changed, so the D 0 variation has effect only on flux scattering and magnetic saturation.
We observe from Table 6 a relative small variation in torque values for the variation of the external diameter. However, it is a misconception to think that the smaller the outside diameter the better, because the value of the outside diameter limits the variation of other parameters of the machine, mainly the number of turns since the space destined to the windings is determined by the height of the pole of the stator ( h s ), stator yoke ( c s ), stator polar arc ( β s ) and by D 0 .
Therefore, the choice of D 0 must be based on the number of turns, the size of the housing used and the location of installation.

3.7. Air Gap

The air gap length of an SRM must be determined according to its power range [3]. For simulated SRMs, this value should be chosen from 0.3 mm to 0.5 mm. Thus, the air gap assumes the following values: 0.3 mm, 0.4 mm and 0.5 mm. The sensitivity of the torque and the flux linkage for the air gap variation is shown in Figure 19 and the torque and B values is presented in Table 7.
Through the graphs shown in Figure 19 it is observed that the air gap value has a direct influence on the maximum value reached by the torque, the smaller the air gap the greater the maximum value of torque and average torque. This happens because the smaller the gap the lower its reluctance, that is, the lower the resistance to magnetic flux flowing from stator to rotor, so the value of flux linkage increases. Hence, the ratio of the flux in the aligned position to the unaligned position also increases and consequently the torque value.
Table 7 shows the torque and B values for the air gap length variation. With a increase of 0.1 mm in air gap, the average torque value reduces about 12.85 % for 6/4 SRM and 13.65 % for 8/6 SRM. The air gap value of a SRM should be the minimum allowed for its constructive characteristics.

3.8. Number of Turns

The number of turns of a coil of the SRM is determined by Equation (13) and takes into account the value of the magnetic field strength in the air gap. Furthermore, it should be considered how much space the coil will occupy to add an occupancy factor, to ensure that the turns will be well accommodated. If this is done, it may be necessary to reduce the number of turns or to allow more turns to be inserted. Figure 20 shows the graphs of torque and flux linkage for a variation of ± 20 % in the N T value and the torque and B values is presented in Table 8.
From the presented graphs it is observed that the number of turns interferes both in the value of the flux in the aligned and in the unaligned positions, but in different proportions. And this also influences the average torque value, the 20 % reduction in the number of turns caused a 27.6 % reduction in the average torque value for both 6/4 and 8/6 SRM. The increase of 20 % increased by 28.17 % the average torque value for the two machines.
In terms of saturation we can see that the variation is small, the 20 % increase in the number of turns caused an increase of less than 3 % in the value of B. So, if there are no limitations on the SRM electric power supply and space to accommodate the coil, the number of turns can be changed to achieve the desired torque value, for example.

4. Conclusions

At first, this work presented in detail the SRM design procedures, indicating the intervals of choice of dimensions and how this choice is often made subjectively and empirically. So, this work was dedicated to show the influence of dimensions on the performance of SRM through finite element simulations of two machines, a 6/4 three-phase SRM and an 8/6 four-phase SRM.
Eight dimensions of these machines were varied according to their upper and lower limit presented earlier. The results presented are the torque and flux linkage curve for a machine phase and the average torque value obtained through finite element simulations by the FEMM software. It is observed that the performance of the machine is sensitive to the variation of the dimensions, but in different proportions and manners. For stator yoke and inner diameter, for example, there is a slight variation in value and torque curve. For other dimensions, the influence is significant and still happens differently for the 6/4 and 8/6 SRM, in the case of the rotor yoke.
The results presented by the influence analysis of the dimensions are important and can be used to support decisions regarding the design, modeling and optimization of the switched reluctance machine in general and in specific applications and are of great value for future studies.

Author Contributions

All the authors contributed to the original idea and design of the study, to the analysis, to the drafting of the manuscript, reading and approving the final version. Conceptualization, A.C.F.M., J.R.C. and R.E.A.; Methodology, A.C.F.M.; Software, A.C.F.M.; Validation, A.C.F.M., J.R.C. and R.E.A.; Formal analysis, A.C.F.M.; Investigation, A.C.F.M.; Resources, J.R.C. and R.E.A.; Data curation, A.C.F.M.; Writing—original draft preparation, A.C.F.M.; Writing—review and editing, A.C.F.M., J.R.C. and R.E.A.; Visualization, A.C.F.M.; Supervision, J.R.C. and R.E.A.

Funding

This study was financed in part by the Coordenação de Aperfeiçoamento de Pessoal de Nível Superior—Brasil (CAPES)—Finance Code 001.

Conflicts of Interest

The authors declare no conflicts of interest.

References

  1. Miller, T.J.E.; James, R.J.H. Monographs in electrical and electronic engineering. In Switched Reluctance Motors and Their Control; Magna Physics Pub.: Orono, ME, USA, 1993. [Google Scholar]
  2. Ahn, J.W. Switched Reluctance Motor. In Torque Control; InTech: Rijeka, Croatia, 2011. [Google Scholar] [CrossRef]
  3. Krishnan, R. Switched Reluctance Motor Drives; CRC Press/Taylor & Francis Inc.: Boca Raton, FL, USA, 2001. [Google Scholar]
  4. Ganji, B.; Heidarian, M.; Faiz, J. Modeling and analysis of switched reluctance generator using finite element method. Ain Shams Eng. J. 2015, 6, 85–93. [Google Scholar] [CrossRef]
  5. Barros, T.A.S.; Filho, E.R. Direct Power Control for Switched Reluctance. Generator in Wind Energy. IEEE Lat. Am. Trans. 2015, 13, 123–128. [Google Scholar] [CrossRef]
  6. Hasanien, H.M.; Muyeen, S. Speed control of grid-connected switched reluctance generator driven by variable speed wind turbine using adaptive neural network controller. Electr. Power Syst. Res. 2012, 84, 206–213. [Google Scholar] [CrossRef]
  7. dos Santos Barros, T.A.; dos Santos Neto, P.J.; Filho, P.S.N.; Moreira, A.B.; Filho, E.R. An Approach for Switched Reluctance Generator in a Wind Generation System With a Wide Range of Operation Speed. IEEE Trans. Power Electron. 2017, 32, 8277–8292. [Google Scholar] [CrossRef]
  8. Xue, X.D.; Cheng, K.W.E.; Ng, T.W.; Cheung, N.C. Multi-Objective Optimization Design of In-Wheel Switched Reluctance Motors in Electric Vehicles. IEEE Trans. Ind. Electron. 2010, 57, 2980–2987. [Google Scholar] [CrossRef]
  9. Wang, S.; Zhan, Q.; Ma, Z.; Zhoug, L. Implementation of a 50-kW four-phase switched reluctance motor drive system for hybrid electric vehicle. IEEE Trans. Magn. 2005, 41, 501–504. [Google Scholar] [CrossRef]
  10. Besmi, M.R. Geometry Design of Switched Reluctance Motor to Reduce the Torque Ripple by Finite Element Method and Sensitive Analysis. J. Electr. Power Energy Convers. Syst. 2016, 1, 23–31. [Google Scholar]
  11. Ma, C.; Qu, L. Multiobjective Optimization of Switched Reluctance Motors Based on Design of Experiments and Particle Swarm Optimization. IEEE Trans. Energy Convers. 2015, 30, 1144–1153. [Google Scholar] [CrossRef]
  12. Pyrhonen, J.; Jokinen, T.; Hrabovcova, V. Design of Rotating Electrical Machines; John Wiley & Sons: Chichester, UK, 2014. [Google Scholar]
  13. Lawrenson, P.J.; Stephenson, J.M.; BIenkinsop, P.T.; Corda, J.; Fulton, N.N. Variable-speed switched reluctance motors. IEE Proc. B-Electr. Power Appl. 1980, 127, 253–265. [Google Scholar] [CrossRef]
  14. Vijayraghavan, P. Design of Switched Reluctance Motors and Development of a Universal Controller for Switched Reluctance and Permanent Magnet Brushless DC Motor Drives. Ph.D. Thesis, Virginia Polytechnic Institute and State University, Blacksburg, VA, USA, 2001. [Google Scholar]
  15. Moraes Filho, M.J.; Bianchi, R.B.; Gomes, L.C.; Andrade, D.A.; Silveira, A.W.F.V.; Santos, J.A., Jr.; Oliveira, C.A.; Souza, W.G. Projeto de máquina a relutância variável 8/6 e impacto do ângulo do polo do rotor em seu desempenho. In Proceedings of the XXI Congresso Brasileiro de Automática—CBA 2016, Espírito Santo, Brazil, 3–7 October 2016; pp. 1644–1649. [Google Scholar]
Figure 1. Dimensions in an switched reluctance machine (SRM).
Machines 07 00071 g001
Figure 2. Feasible pole arcs for the stator and rotor poles of an (a) 6/4 SRM three-phase (b) 8/6 SRM four-phase.
Machines 07 00071 g002
Figure 3. The 6/4 SRM stator and rotor blades.
Machines 07 00071 g003
Figure 4. The 8/6 SRM stator and rotor blades.
Machines 07 00071 g004
Figure 5. The 6/4 SRM inductance profile.
Machines 07 00071 g005
Figure 6. The 6/4 SRM torque profile.
Machines 07 00071 g006
Figure 7. The 8/6 SRM inductance profile.
Machines 07 00071 g007
Figure 8. The 8/6 SRM torque profile.
Machines 07 00071 g008
Figure 9. The 6/4 SRM mesh with 18,896 nodes and 37,430 elements.
Machines 07 00071 g009
Figure 10. The 8/6 SRM mesh with 22,146 nodes and 43,930 elements.
Machines 07 00071 g010
Figure 11. The 6/4 SRM points location of the B collection.
Machines 07 00071 g011
Figure 12. The 8/6 SRM points location of the B collection.
Machines 07 00071 g012
Figure 13. Influence of β s variation on torque and flux linkage of 6/4 and 8/6 SRM.
Machines 07 00071 g013
Figure 14. Influence of β r variation on torque and flux linkage of 6/4 and 8/6 SRM.
Machines 07 00071 g014
Figure 15. Influence of c s variation on torque and flux linkage of 6/4 and 8/6 SRM.
Machines 07 00071 g015
Figure 16. Influence of c r variation on torque and flux linkage of 6/4 and 8/6 SRM.
Machines 07 00071 g016
Figure 17. Influence of D i variation on torque and flux linkage of 6/4 and 8/6 SRM.
Machines 07 00071 g017
Figure 18. Influence of D 0 variation on torque and flux linkage of 6/4 and 8/6 SRM.
Machines 07 00071 g018
Figure 19. Influence of g variation on torque and flux linkage of 6/4 and 8/6 SRM.
Machines 07 00071 g019
Figure 20. Influence of number of turns ( N T ) variation on torque and flux linkage of 6/4 and 8/6 SRM.
Machines 07 00071 g020
Table 1. Results of the β s variation.
Variable6/4 SRM8/6 SRM
β s = 30 β s = 37.5 β s = 45 β s = 15 β s = 22.5 β s = 30
Average torque ( N · m ) 3.2803.3673.3603.9564.9665.029
| B 1 | ( T ) 1.9351.9361.9401.7201.9661.965
| B 2 | ( T ) 2.7722.7902.7952.4212.7762.797
Table 2. Results of β r variation.
Variable6/4 SRM8/6 SRM
β r = 30 β r = 45 β r = 60 β r = 22.5 β r = 30 β r = 37.5
Average torque ( N · m ) 3.1603.5383.2004.7225.3585.053
| B 1 | ( T ) 1.9571.5801.2231.9661.8811.649
| B 2 | ( T ) 2.7812.3432.0612.7122.6492.371
Table 3. Results of c s variation.
Variable6/4 SRM8/6 SRM
c s = 0.5 c s = 0.75 c s = 1.0 c s = 0.5 c s = 0.75 c s = 1.0
Average torque ( N · m ) 3.2593.3183.3324.8594.9744.994
| B 1 | ( T ) 1.9241.9431.9491.8661.9621.949
| B 2 | ( T ) 2.7022.8202.9342.6092.7812.729
Table 4. Results of c r variation.
Variable6/4 SRM8/6 SRM
c r = 0.5 c r = 0.75 c r = 1.0 c r = 0.5 c r = 0.75 c r = 1.0
Average torque ( N · m ) 3.2143.4463.3874.5774.9955.309
| B 1 | ( T ) 1.9391.8181.6501.9521.9391.865
| B 2 | ( T ) 2.7452.6272.4302.7592.7792.5955
Table 5. Results of D i variation.
Variable6/4 SRM8/6 SRM
D i = 82 D i = 91.1 D i = 100.2 D i = 82 D i = 91.1 D i = 100.2
Average torque ( N · m ) 3.1093.2803.4164.7024.9665.187
| B 1 | ( T ) 1.9191.9351.9481.9341.9661.982
| B 2 | ( T ) 2.6592.7722.7982.6942.7762.683
Table 6. Results of D 0 variation.
Variable6/4 SRM8/6 SRM
k D 0 = 0.4 k D 0 = 0.55 k D 0 = 0.7 k D 0 = 0.4 k D 0 = 0.55 k D 0 = 0.7
Average torque ( N · m ) 3.2263.2773.3124.8934.9595.023
| B 1 | ( T ) 1.8751.9241.9571.9391.9431.977
| B 2 | ( T ) 2.5232.7092.9582.5172.7152.827
Table 7. Results of g variation.
Variable6/4 SRM8/6 SRM
g = 0.3 g = 0.4 g = 0.5 g = 0.3 g = 0.4 g = 0.5
Average torque ( N · m ) 3.3222.8952.5095.0244.3383.732
| B 1 | ( T ) 1.9351.8611.7751.9661.8831.795
| B 2 | ( T ) 2.7722.6662.5442.7762.6832.541
Table 8. Results of N T variation.
Variable6/4 SRM8/6 SRM
NT = 50 NT = 62 NT = 74 NT = 50 NT = 62 NT = 74
Average torque ( N · m ) 2.3763.2804.2043.5944.9666.365
| B 1 | ( T ) 1.8651.9401.9781.8971.9662.002
| B 2 | ( T ) 2.6522.7722.8532.6632.7762.855

