Abstract
Even though scientific studies of smart stents are extensive, current smart stents focus on pressure sensors. This paper presents a novel implantable biocompatible smart stent for monitoring eventual restenosis. The device is comprised of a metal mesh structure, a biocompatible and adaptable envelope, and pair-operated ultrasonic sensors for restenosis monitoring through flow velocity. Aside from continuous monitoring of restenosis post-implantation, it is also important to evaluate whether the stent design itself causes complications such as restenosis or thrombosis. Therefore, computational fluid dynamic (CFD) analysis before and after stent implantation were carried out as well as finite element analysis (FEA). The proposed smart stent was put in the descending thoracic section of a virtually reconstructed aorta that comes from a computed tomography (CT) scan. Blood flow velocity showed that after stent implantation, there is not liquid retention or vortex generation. In addition, blood pressures after stent implantation were within the normal blood pressure values. The stress and the factor of safety (FOS) analysis showed that the stress values reached by the stent are very far from the yield strength limit of the materials and that the stent is stiff enough to support the applied loads exported from the CFD results.
1. Introduction
Abnormal narrowing of the arteries or veins is known as stenosis. Atherosclerosis is the primary pathology of cardiovascular disease in which the arteries narrow due to plaque build-up—that is, stenosis occurs. Consequently, the blood flow is obstructed, reducing the normal transport of nutrients and oxygen [1,2], and causing stroke, myocardial infarction and transient cerebral ischemic attacks [3]. Angioplasty is a procedure to treat stenosis that consists of widening narrowed arteries or veins by introducing an inflatable balloon that expands them. Angioplasty is often accompanied by the insertion of a stent through catheterization. A stent is an implantable device that maintains the expansion of the section of the vein, artery or lumen of the body where it has been inserted. Commonly, a stent is inserted in a contracted position and afterwards it is expanded radially [4,5,6]. Despite the use of stents for improving the blood flow, the physiological process can produce restenosis: a phenomenon that causes tissue growth, again closing the vessels [7,8].
In order to prevent restenosis, drug-eluting stents has been developed. A drug-eluting stent is a stent that delivers a restenosis antagonist drug to the tissue surrounding the stent [9]. However, drug-eluting stents increase the possibility of late stent thrombosis [10]. Although drug-eluting stents reduce in-stent restenosis [11], post-implantation monitoring continues to be required to detect any restenosis and its evolution precisely and reliably. To reduce in-stent restenosis, the stent material or design are important, since the shape and the biocompatibility of the stents can affect the incidence of restenosis and late thrombosis [12]. In any case, post-implantation monitoring is essential for patient healthcare.
Traditional techniques for restenosis monitoring are image-based, such as angiography techniques, which are invasive [13]. It is crucial that in-stent restenosis detection and monitoring can be performed in the least invasive way possible. Currently, non-invasive techniques using smart stents have been in development, proposing different solutions. The state of the art is extremely extensive. However, most of the stents are focused on the use of pressure sensors for monitoring in-stent restenosis. In [14], the authors presented a stent with a blood pressure sensor that is X-ray-addressable. The stent aims to monitor coronary in-stent restenosis non-invasively. In addition to the smart stent, a radiographer is required. Due to the radiation exposure, this system allows periodic but not continuous monitoring. Another smart stent is proposed in [2], where a stent functions as radiofrequency wireless pressure transductor for continuous monitoring of restenosis. Experiments showed that the presented device is robust and promising. Additional experiments are required to test long-term effects of the device on restenosis. Furthermore, monitoring restenosis and knowing if the physical design of the device positively or negatively influences the phenomenon of restenosis is important. Another stent with a pressure sensor is proposed in [3]. The authors proposed a stent built with 3D printing technology using a biocompatible polymer. The 3D printing method is a flexible method to print stents with difficult shapes. The 3D printing method makes the stent production easy, and the use of a proper designs helps to reduce the restenosis phenomenon.
Another factor to determinate the restenosis status is the velocity of blood flow, and Doppler flow wire (invasive method) and transthoracic Doppler echocardiography (non-invasive method) are commonly used to measure it [15]. However, even though scientific studies of smart stents are extensive, current smart stents focused on pressure sensors. This paper presents a novel implantable biocompatible smart stent for monitoring eventual restenosis. The proposed smart stent can measure the velocity of the blood flow using miniaturized ultrasonic transducers. In addition, the design of the proposed smart stent prevents in-stent restenosis. This manuscript expands the research work of [16], using the proposed smart stent within a descending thoracic aorta and simulating the blood flow before and after stent implantation as well as the stress and the factor of safety (FOS) in order to characterize the stent performance. It important to note that in [16], the stent was implanted in a coronary artery and in this paper extension, it has been implanted in the descending thoracic section of aorta and further analysis has been carried out.
2. Materials and Methods
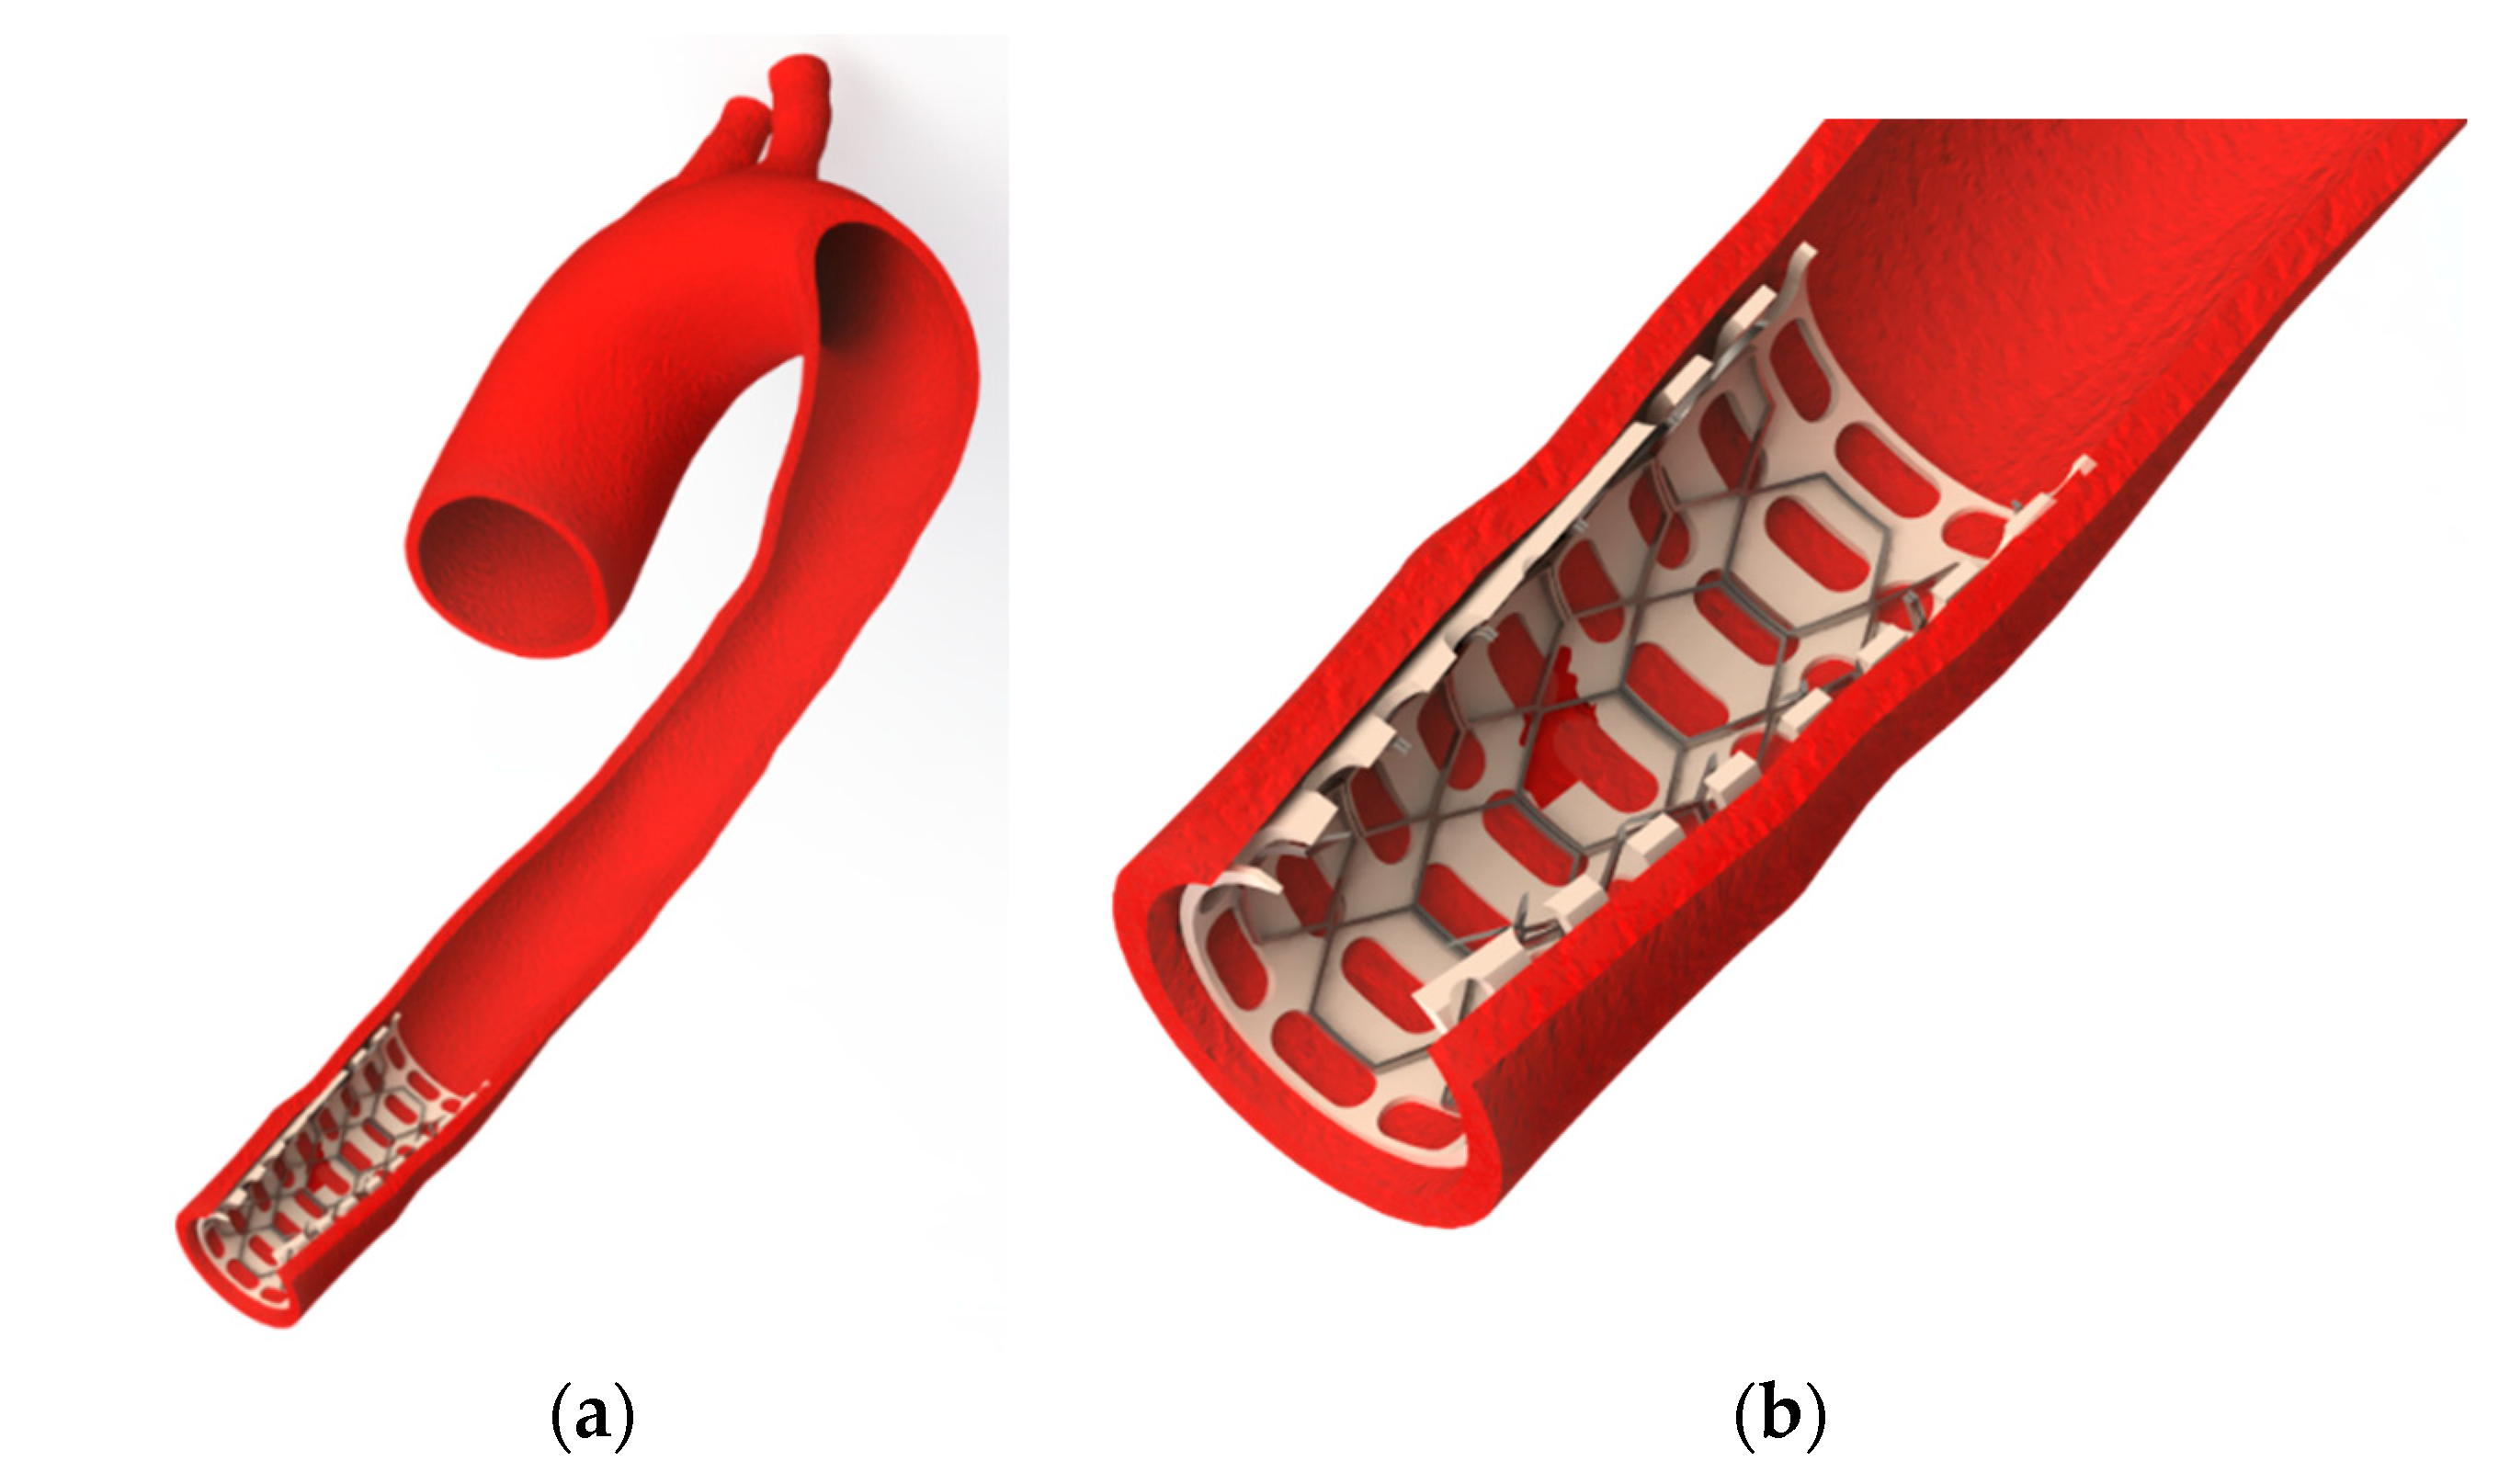
2.1. Device Description
Figure 1 shows the designed smart stent. In Figure 1, the stent parts are numbered in order to describe it. The device is composed of a metal mesh structure with cylindrical shape (2), a biocompatible and adaptable envelope (3) and pair-operated ultrasonic sensors (4) [16,17]. Two or more pair-operated ultrasonic sensors (4) can be used to measure the velocity of the blood flow at different places on the stent. The material of the metal structure can be titanium and the material of the envelope can be silicon elastomer. However, other biocompatible material could be used to build the device. The device can be implanted into lumen organs or blood vessels. The diameter of the stent can be expanded and adapted according to the treated lumen. The biocompatible and adaptable envelope (3) wraps the metal structural mesh (2). Two or more pair-operated ultrasonic sensors (4) are incorporated into the envelope (3) and covered by a flexible film made of biocompatible material (5). The ultrasonic sensors use a beam of ultrasonic energy that allow one to calculate the velocity of the blood flow of the blood.
Figure 1.
Proposed smart stent details.
Figure 2 shows the device implanted in the descending thoracic aorta. The transducers are connected to a small controller unit via catheterized millimeter wires. The wires are connected to the controller unit for power supply and signal acquisition. The controller unit is external to the patient and it can be permanently connected for continuous monitoring if required or it can be intermittently connected/disconnected for periodical monitoring. To obtain velocity of the blood flow, the small controller unit acquires the signal from the transducers, performs the required calculation and sends the data via Wi-Fi to a computer. A user interface shows real-time graphs of the velocity trend of the blood that can be saved for further processing. A small 3.7 V Li-Po battery is used by the tiny controller unit to ensure portability.
Figure 2.
Proposed smart stent implanted in an aorta artery: (a) full view; (b) zoomed in image of the stent into the aorta.
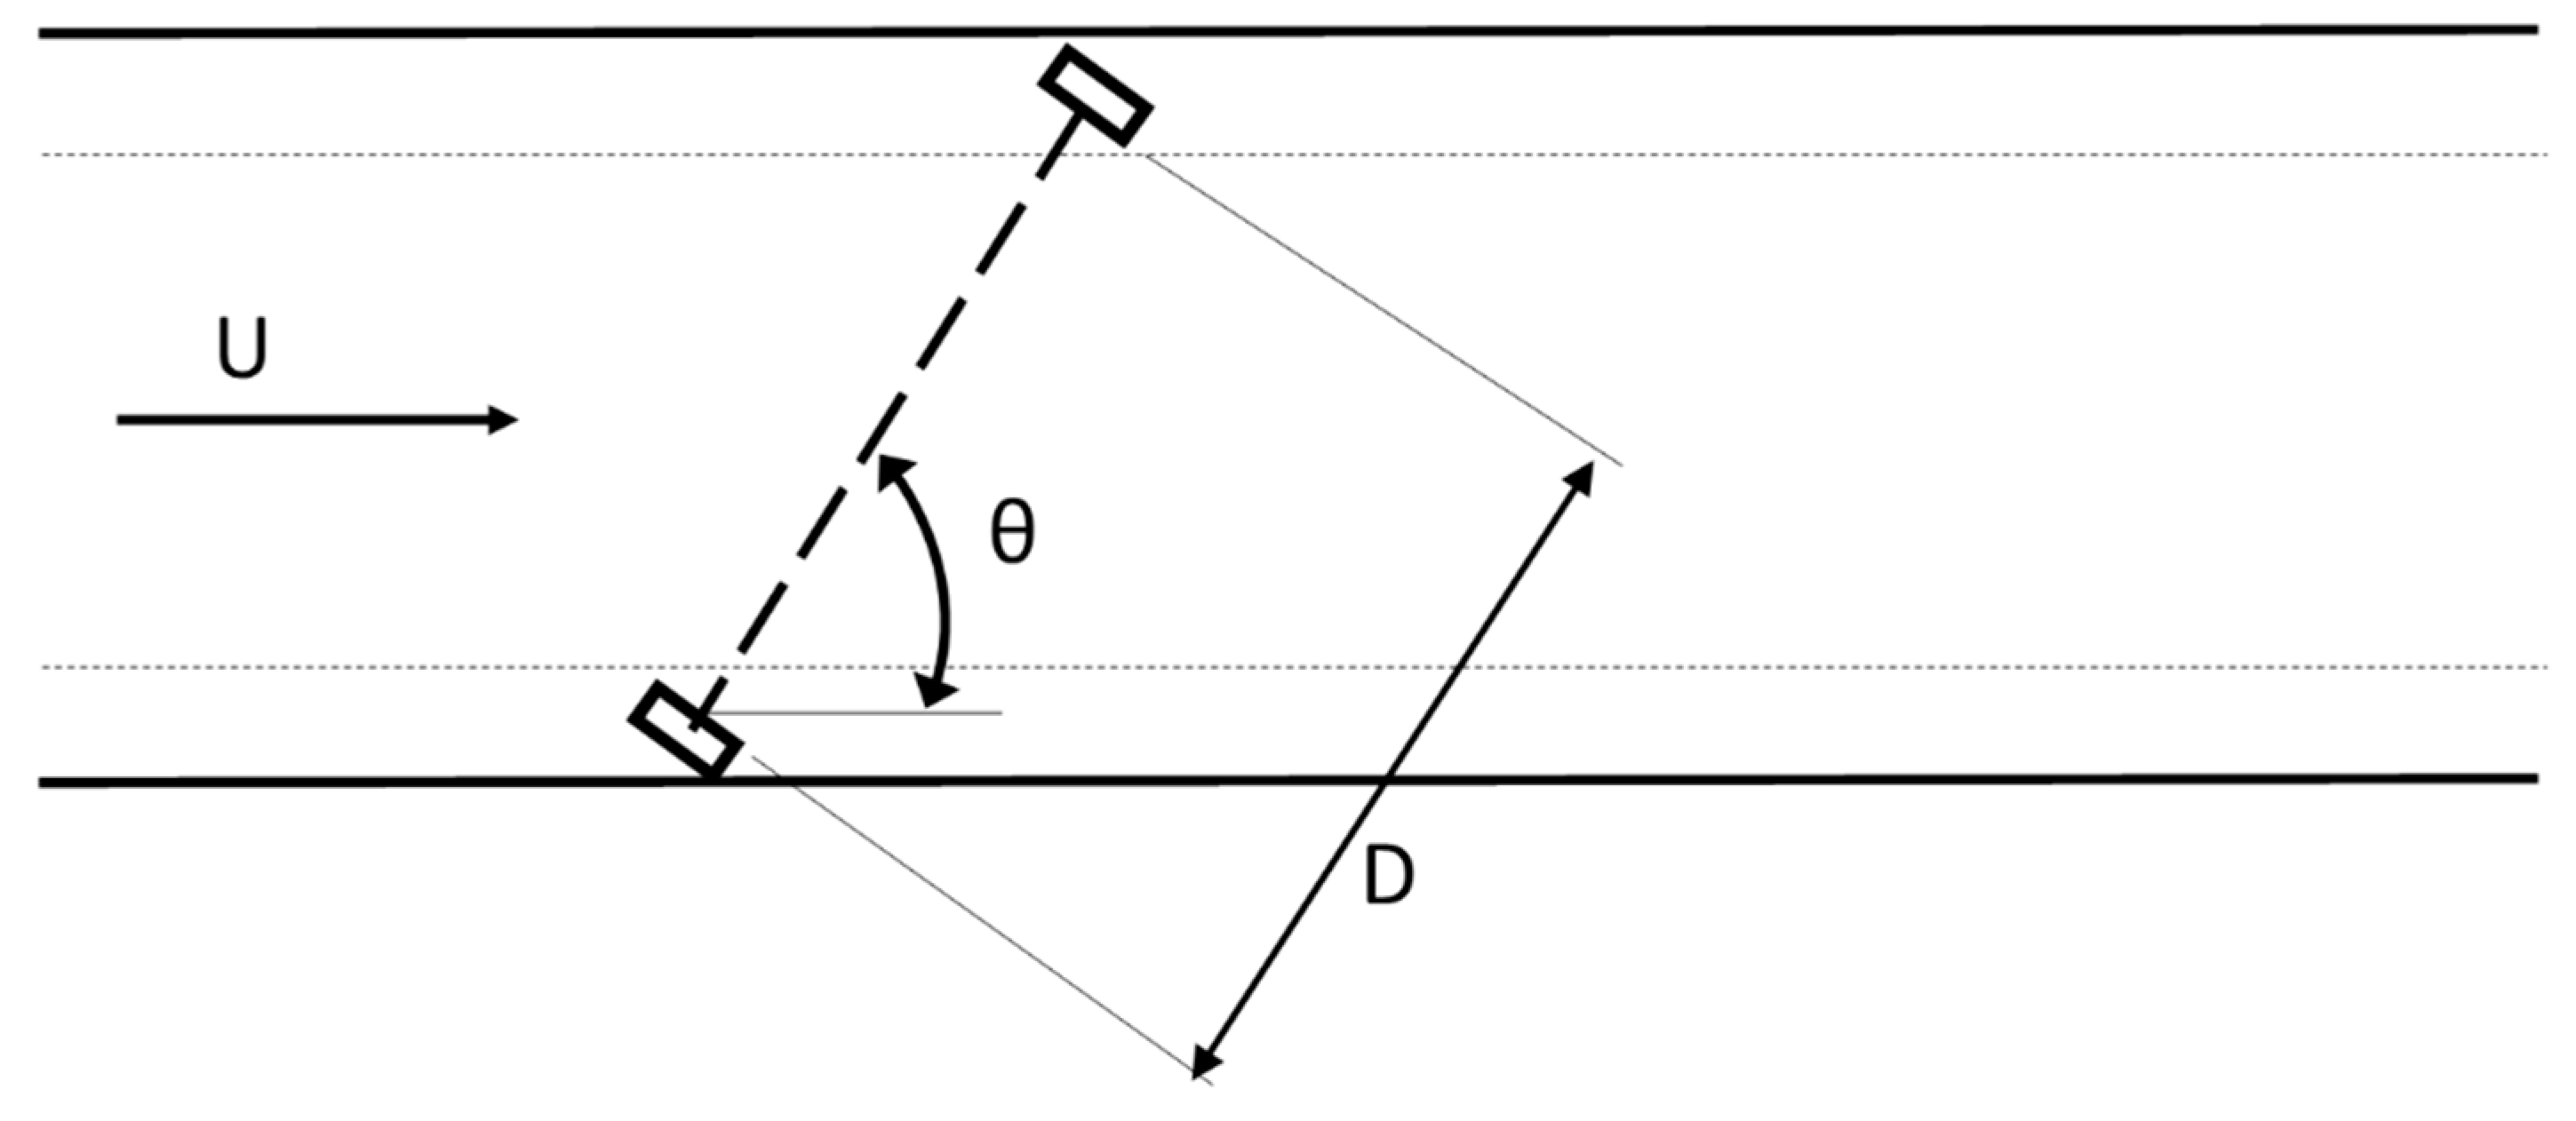
Figure 3 shows a scheme of two ultrasonic sensors that operate in pairs for calculating velocity of the blood flow based on transit time. The velocity of the blood flow can be calculated using the transit time of the signal t [16]:
where t is the transit time, D is the distance between transducers, c is the sound velocity and u is the velocity of the blood flow. When the blood flows in the same direction as the transmitted signal, the observed transit time is shortened, otherwise it lengthened. The t value is obtained through the catheterized small wires of millimeter diameter that are connected to the transducers. Subsequently, with the obtained t value and the other known variables, the velocity of the blood flow can be calculated.
Figure 3.
Scheme of two ultrasonic sensors that operate in pairs for calculating velocity of the blood flow based on time transit time.
2.2. Simulation Procedure
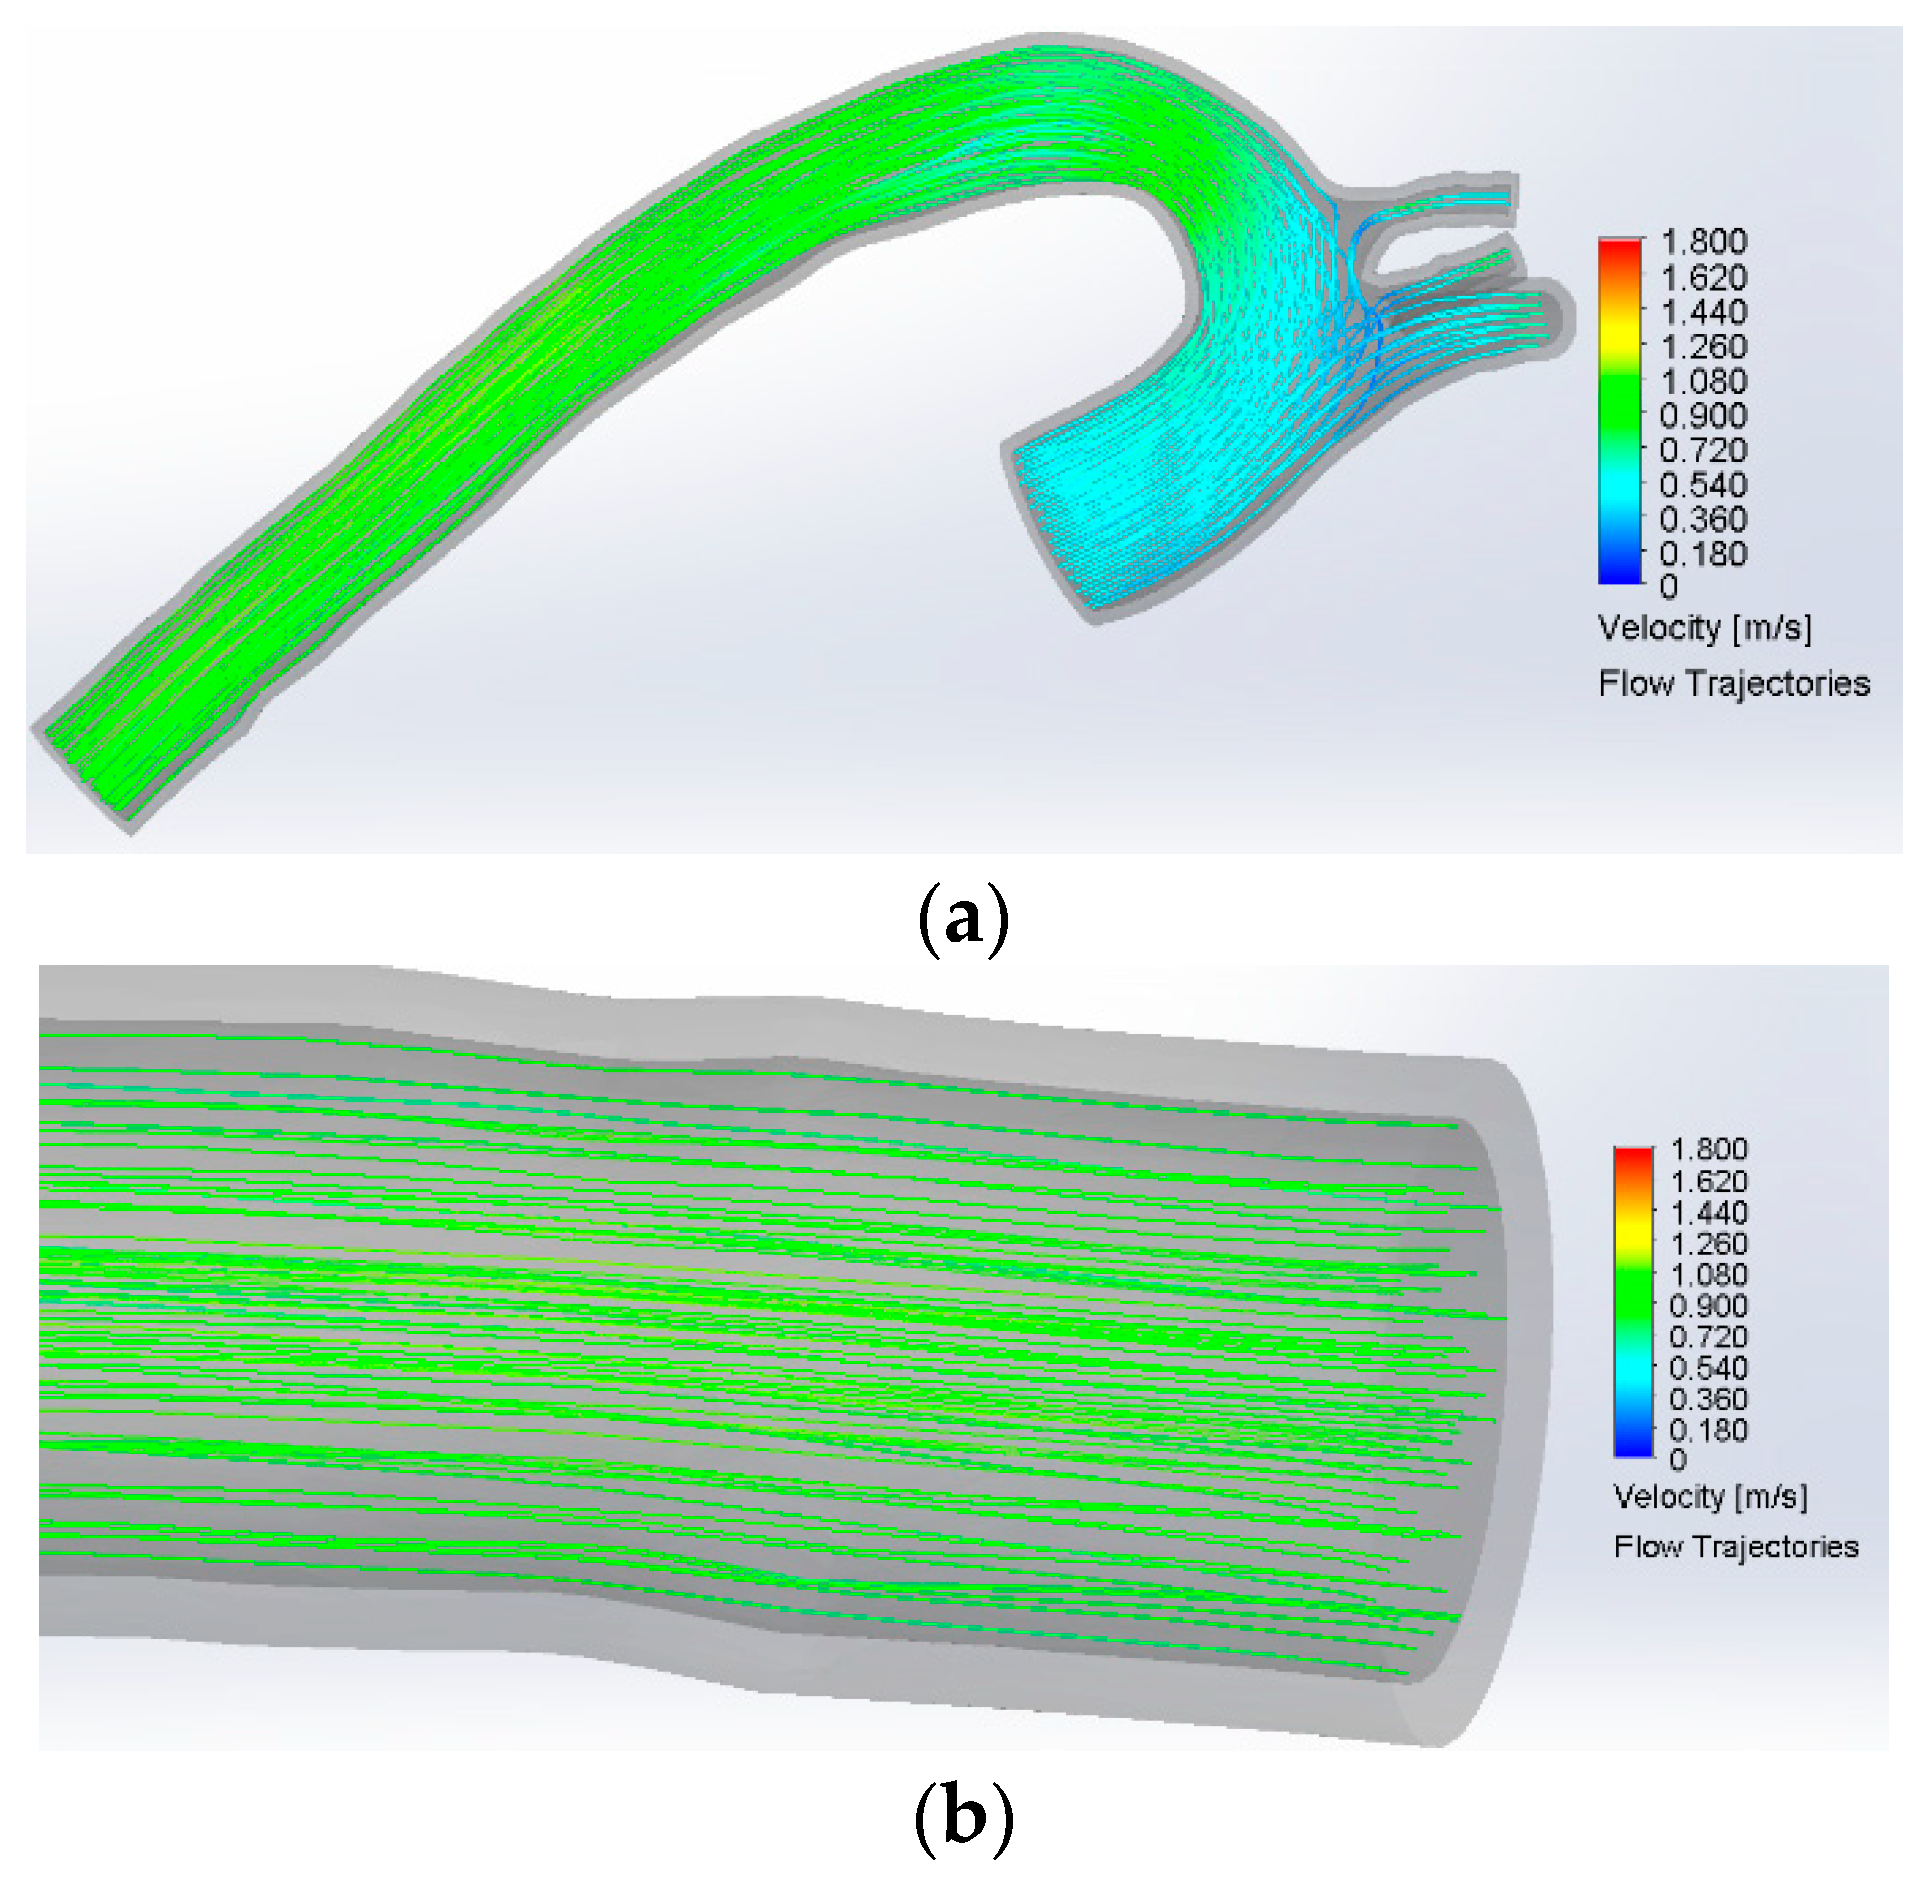
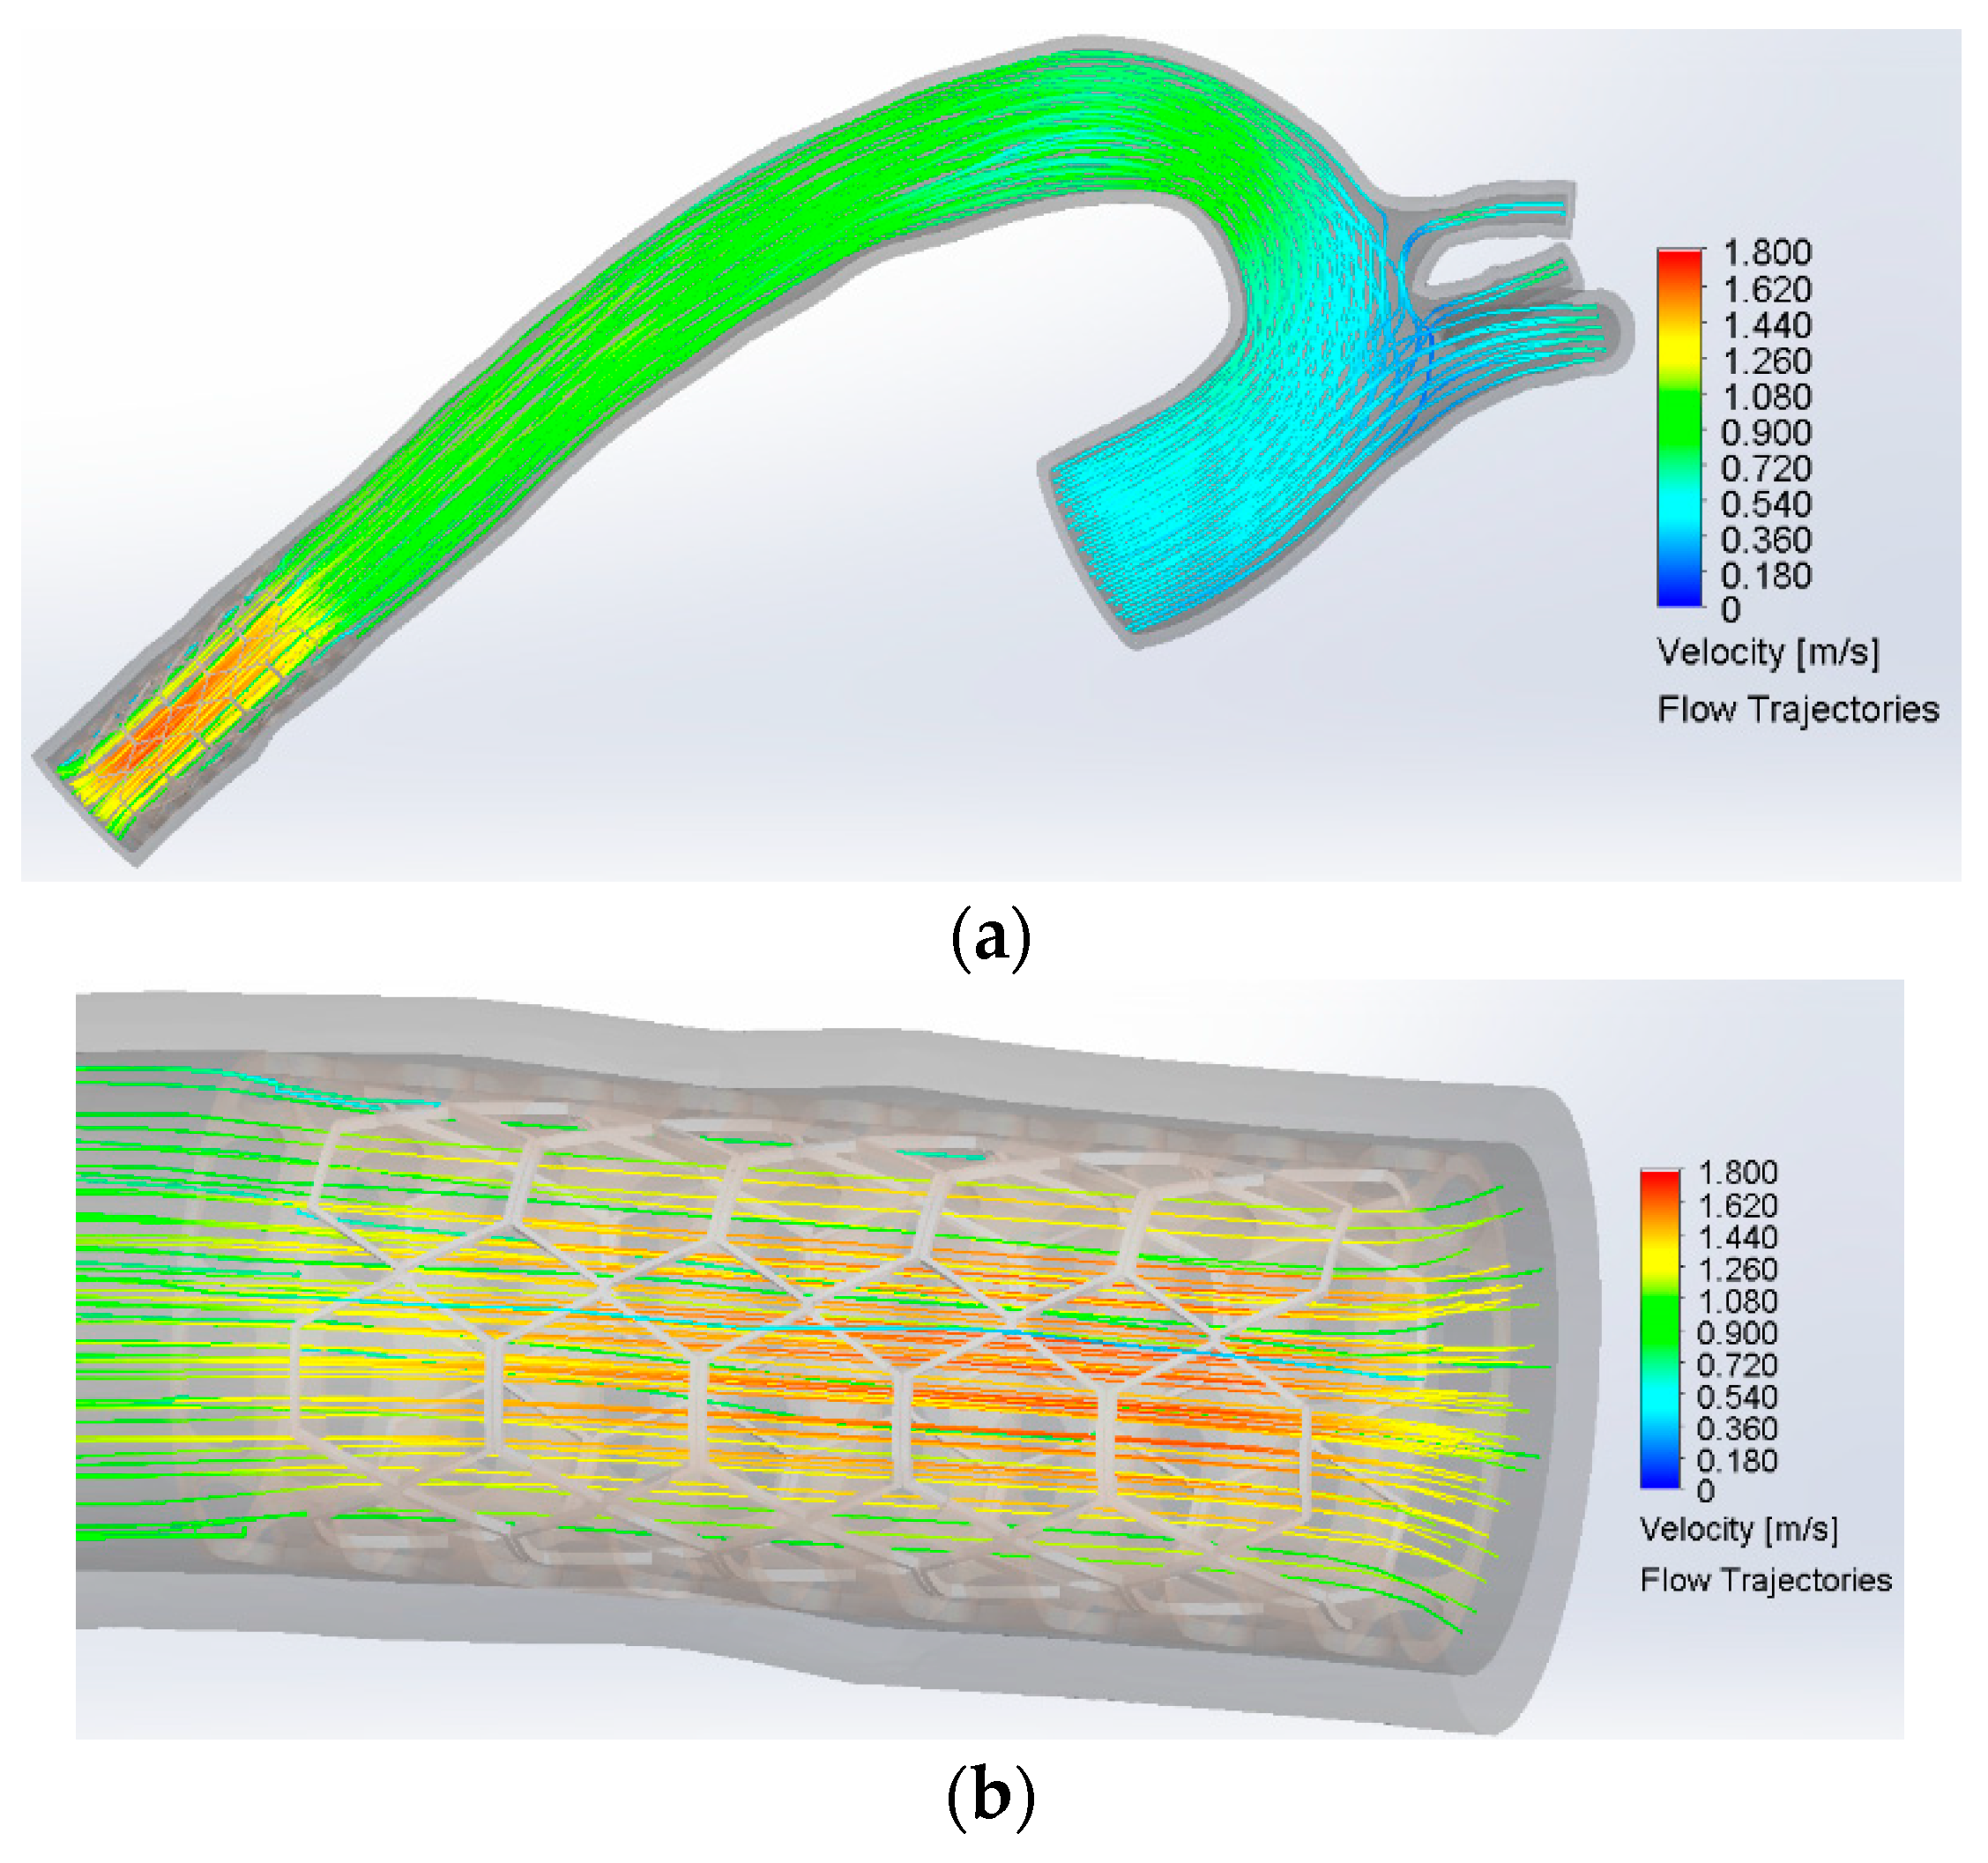
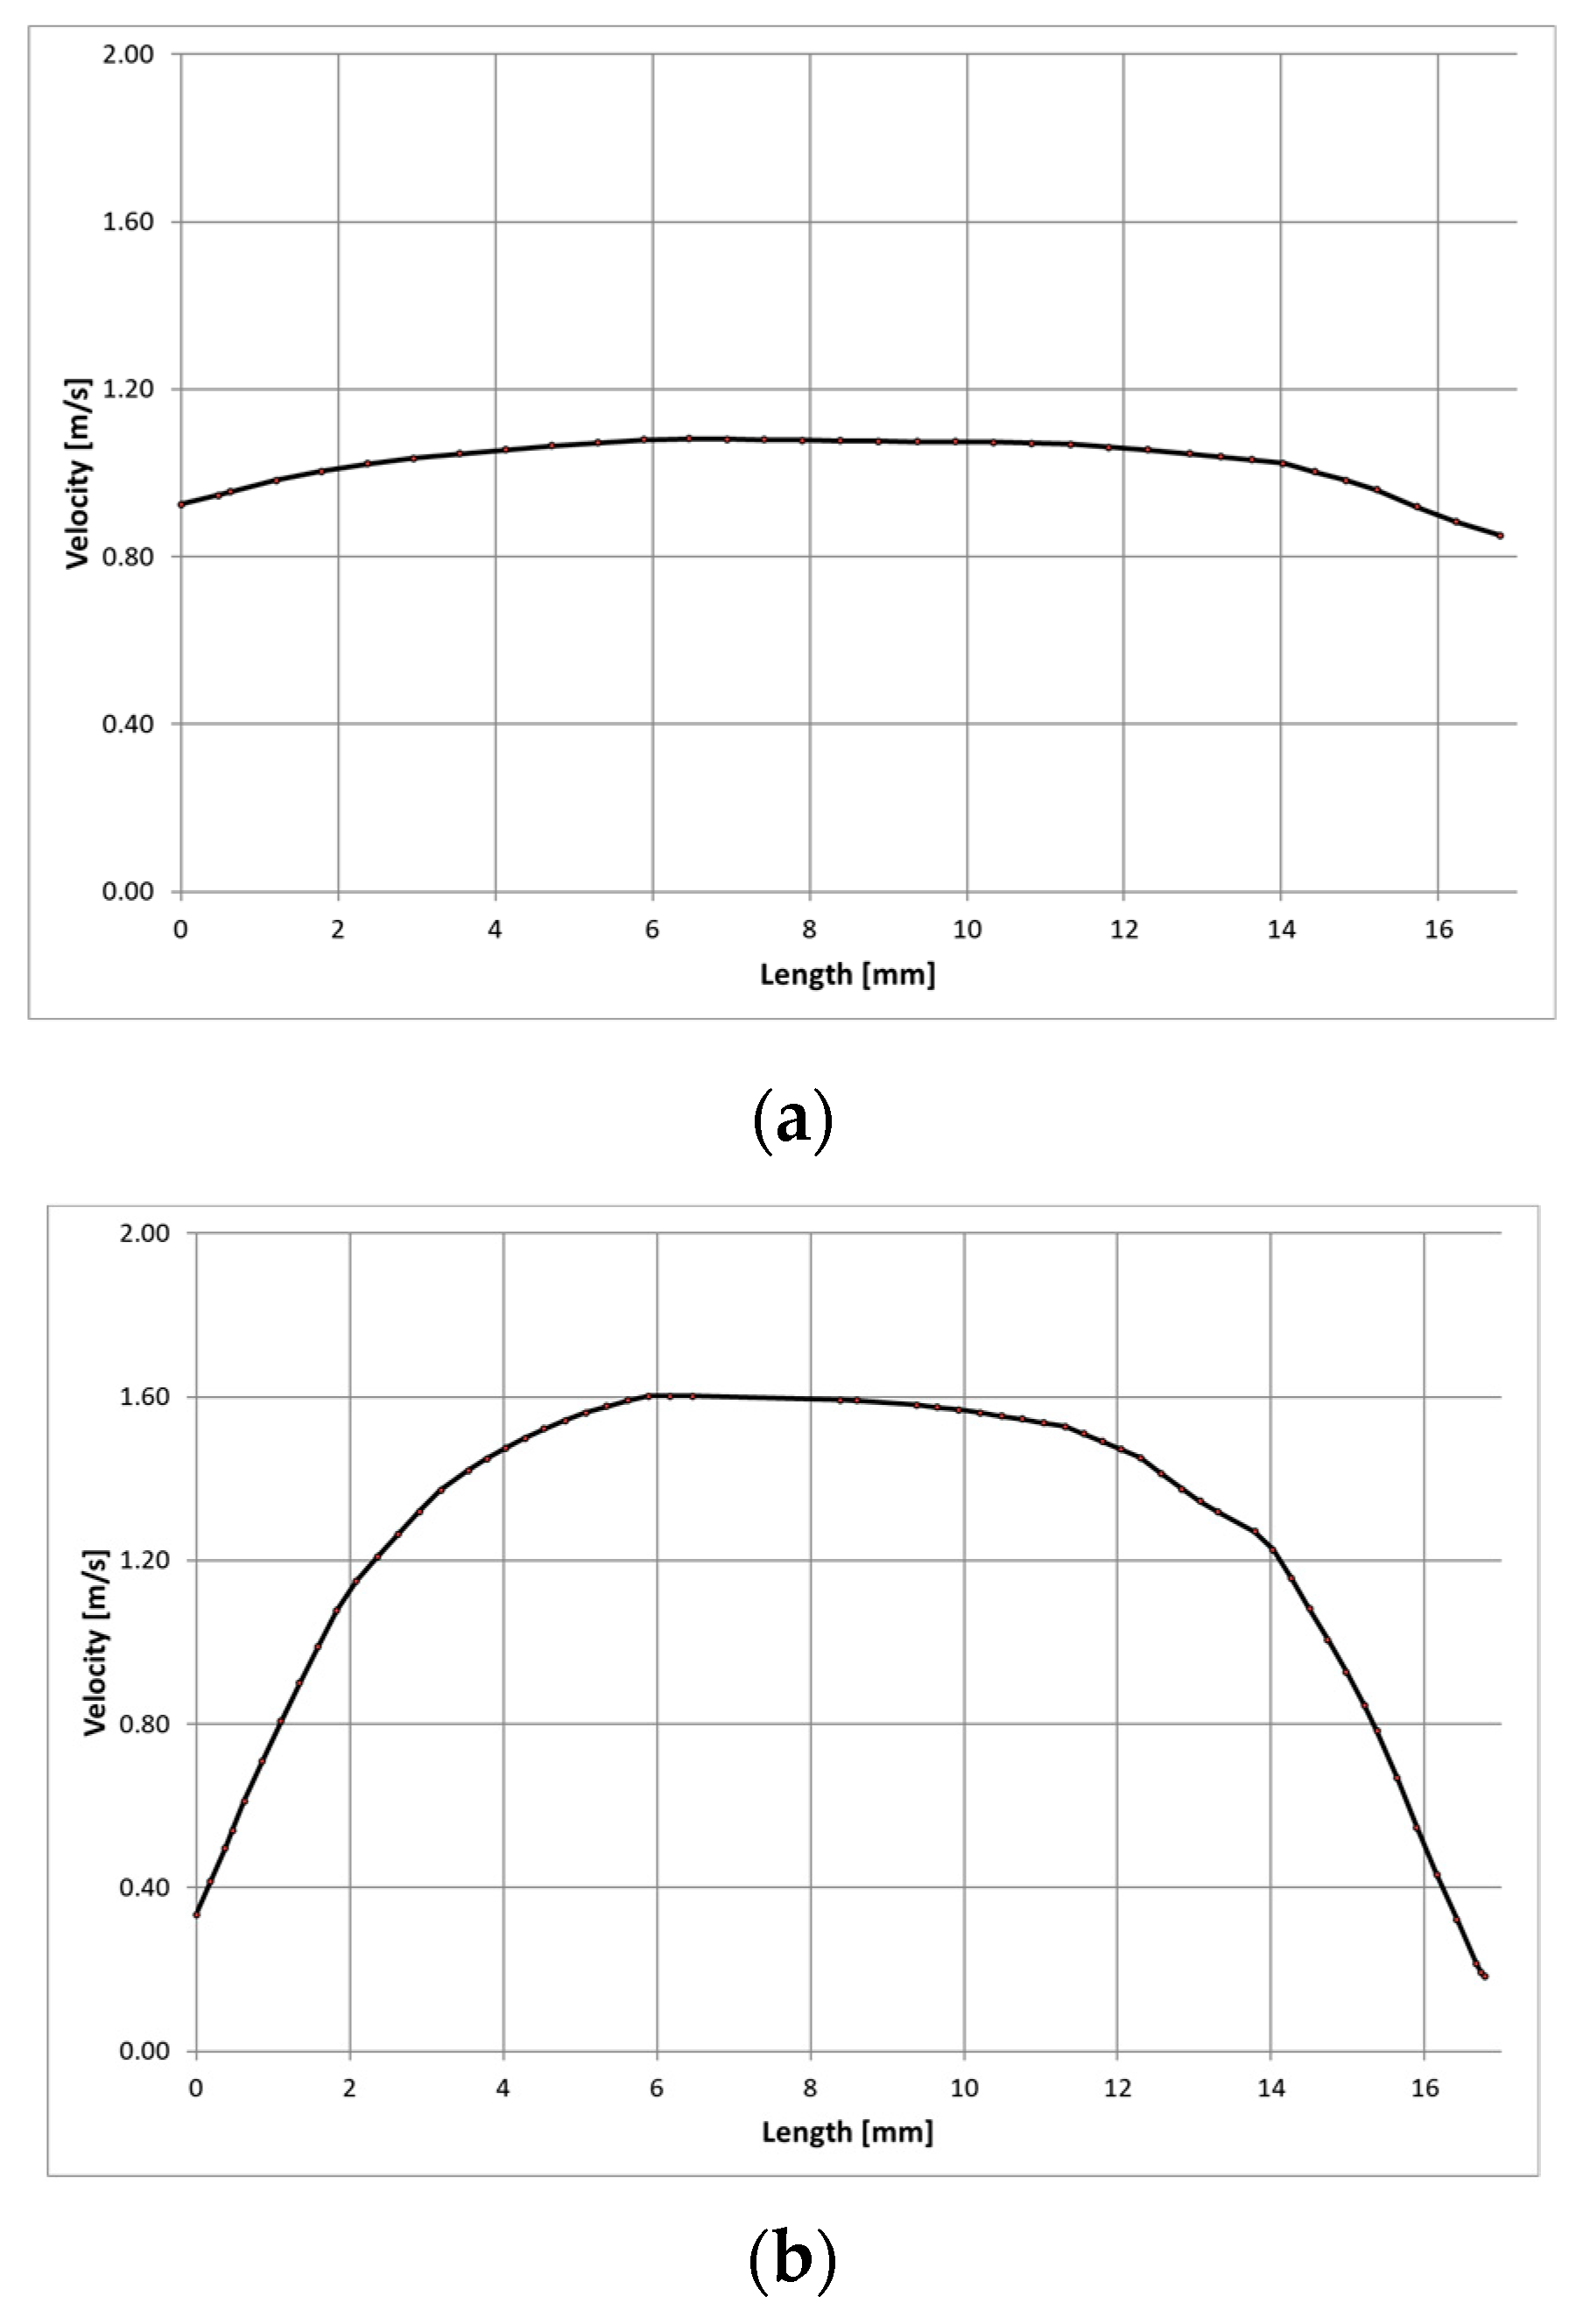
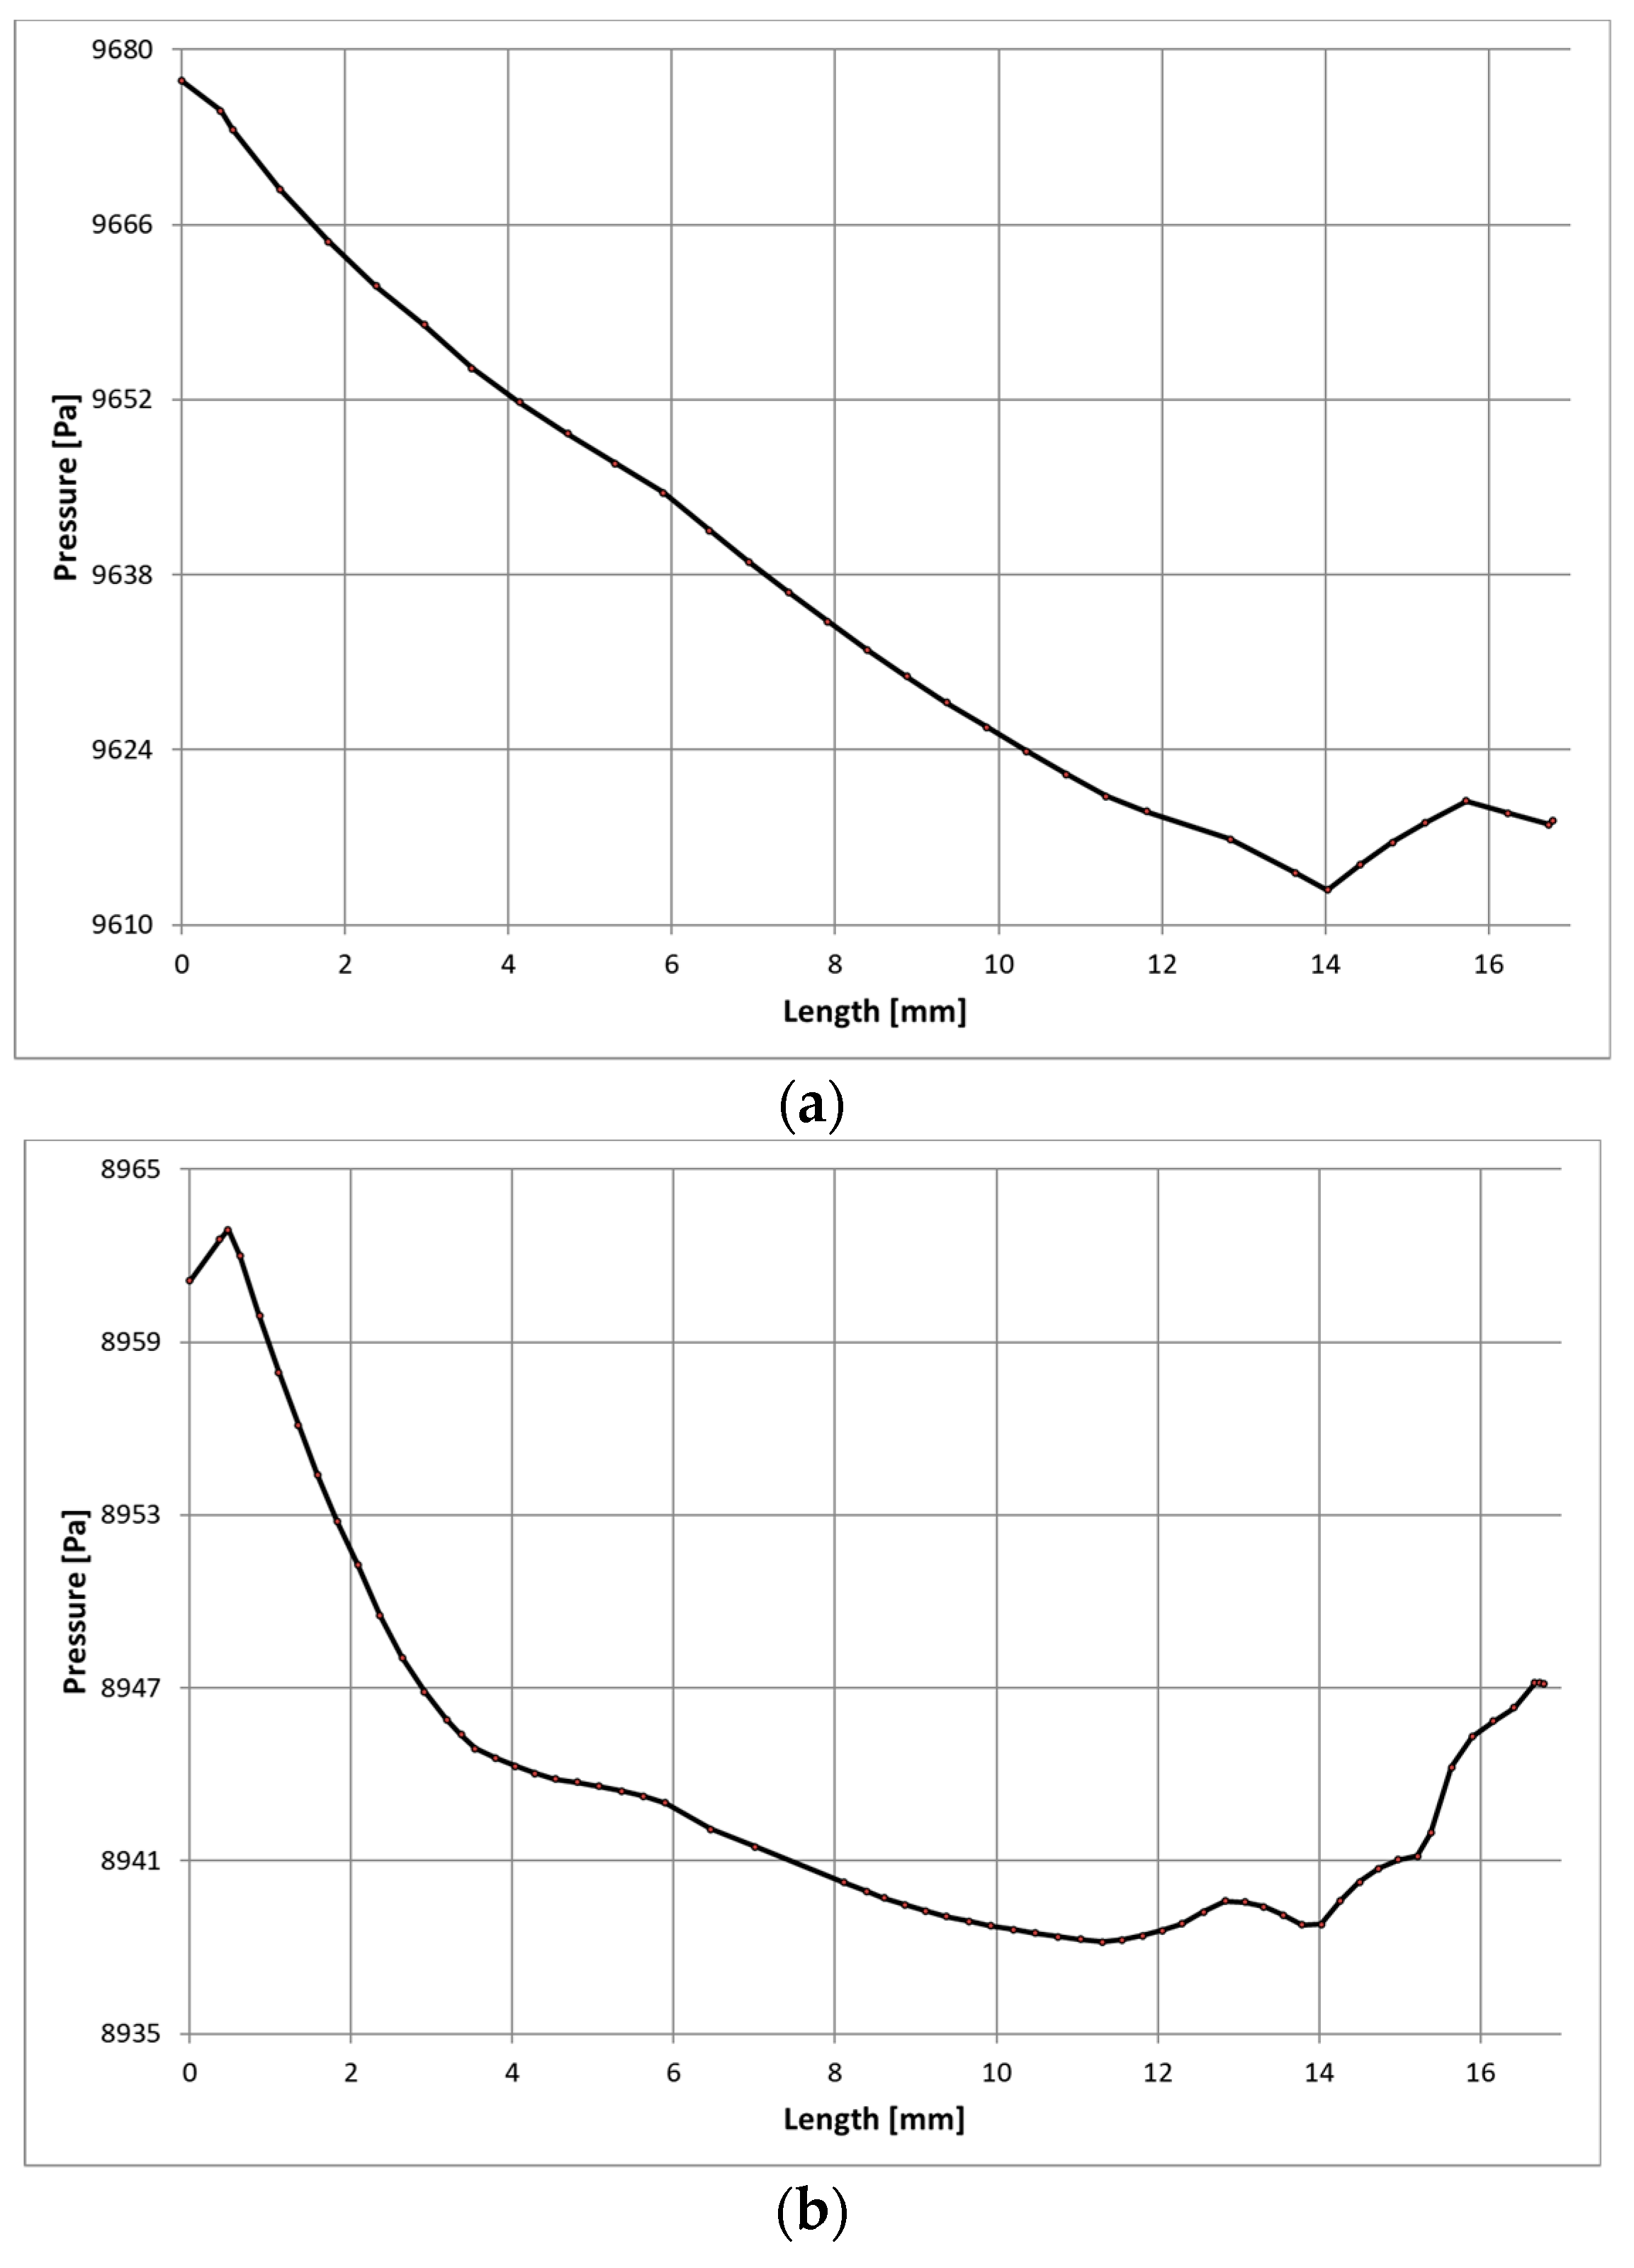
Continuous monitoring of restenosis post-implantation is important to prevent health complications. However, it is also important to evaluate if the stent design itself will not cause complications such as restenosis or thrombosis. Since velocity of the flow blood is an important parameter to evaluate the restenosis and thrombus formation, the velocity of the blood flow was evaluated along an aorta artery and along the smart stent that is inserted in the descending thoracic section of the aorta. In addition, pressures were computed in order to test pressure changes after stent implantation. Computational fluid dynamic (CFD) analysis was carried out using the SolidWorks Flow Simulation tool in SolidWorks software (version 2018, Dassault Systems, S.A., Suresnes, France). In SolidWorks Flow Simulation, it is possible to use blood fluid for simulation purposes. The blood model available in SolidWorks Flow Simulation includes blood parameters that are shown in Table 1. In addition, gravity and well-known parameters such as blood velocity, environmental pressure, and environmental temperature in the human body circulatory system were taken into account as initial conditions in the simulation according to the literature [18,19,20].
Table 1.
Predefined blood fluid parameters.
The SolidWorks Flow Simulation technology is based upon the use of Cartesian-based meshes, and meshing is one of the key elements of the CAD/CFD bridge for CAD-embedded CFD.
As a result of using Cartesian-based meshes, cells which are located fully in solid bodies (solid cells), in the fluid (fluid cells) and cells intersected the immersed boundary. In the simplest case, the partial cell consists of 2 control volumes (CV): a fluid CV and a solid CV. Each CV is then fully solid or fully fluid. For each CV, all necessary geometrical parameters such as volume and the coordinates of the cell center are computed.
Multiple layers of CVs are essential not only for fluid flow modelling but also for heat transfer phenomena, including the contact resistances and Joule heating calculations within a solid body [21].
For all the physical phenomena, the native CAD geometry is the source of initial geometric information. In fluid regions, SolidWorks Flow Simulation solves the Navier–Stokes equations, which are formulations of mass, momentum and energy conservation laws:
Thus, the fluid region represents the main computational challenge from the point of view of algorithmic complexity and of calculation overhead. Using the given CAD as a source of geometric information, it is essential to pay specific attention to the robustness and efficiency of the numerical methods used. SolidWorks Flow Simulation uses the solver and related numerical mentioned algorithms for modelling fluid flows.
The input parameters to define initial conditions of the blood during the simulation are shown in Table 2. The proposed smart stent was put in the descending thoracic section of a virtually reconstructed aorta. The aorta came from a computed tomography (CT) scan, the scan was converted to a stereolithography (STL) file and the boundaries were closed to allow an internal flow analysis. The parameters of the analysis mesh were set for an optimal simulation (Table 3).
Table 2.
Computational fluid dynamics (CFD) input parameters for initial conditions.
Table 3.
Analysis mesh parameters for fluid flow simulation.
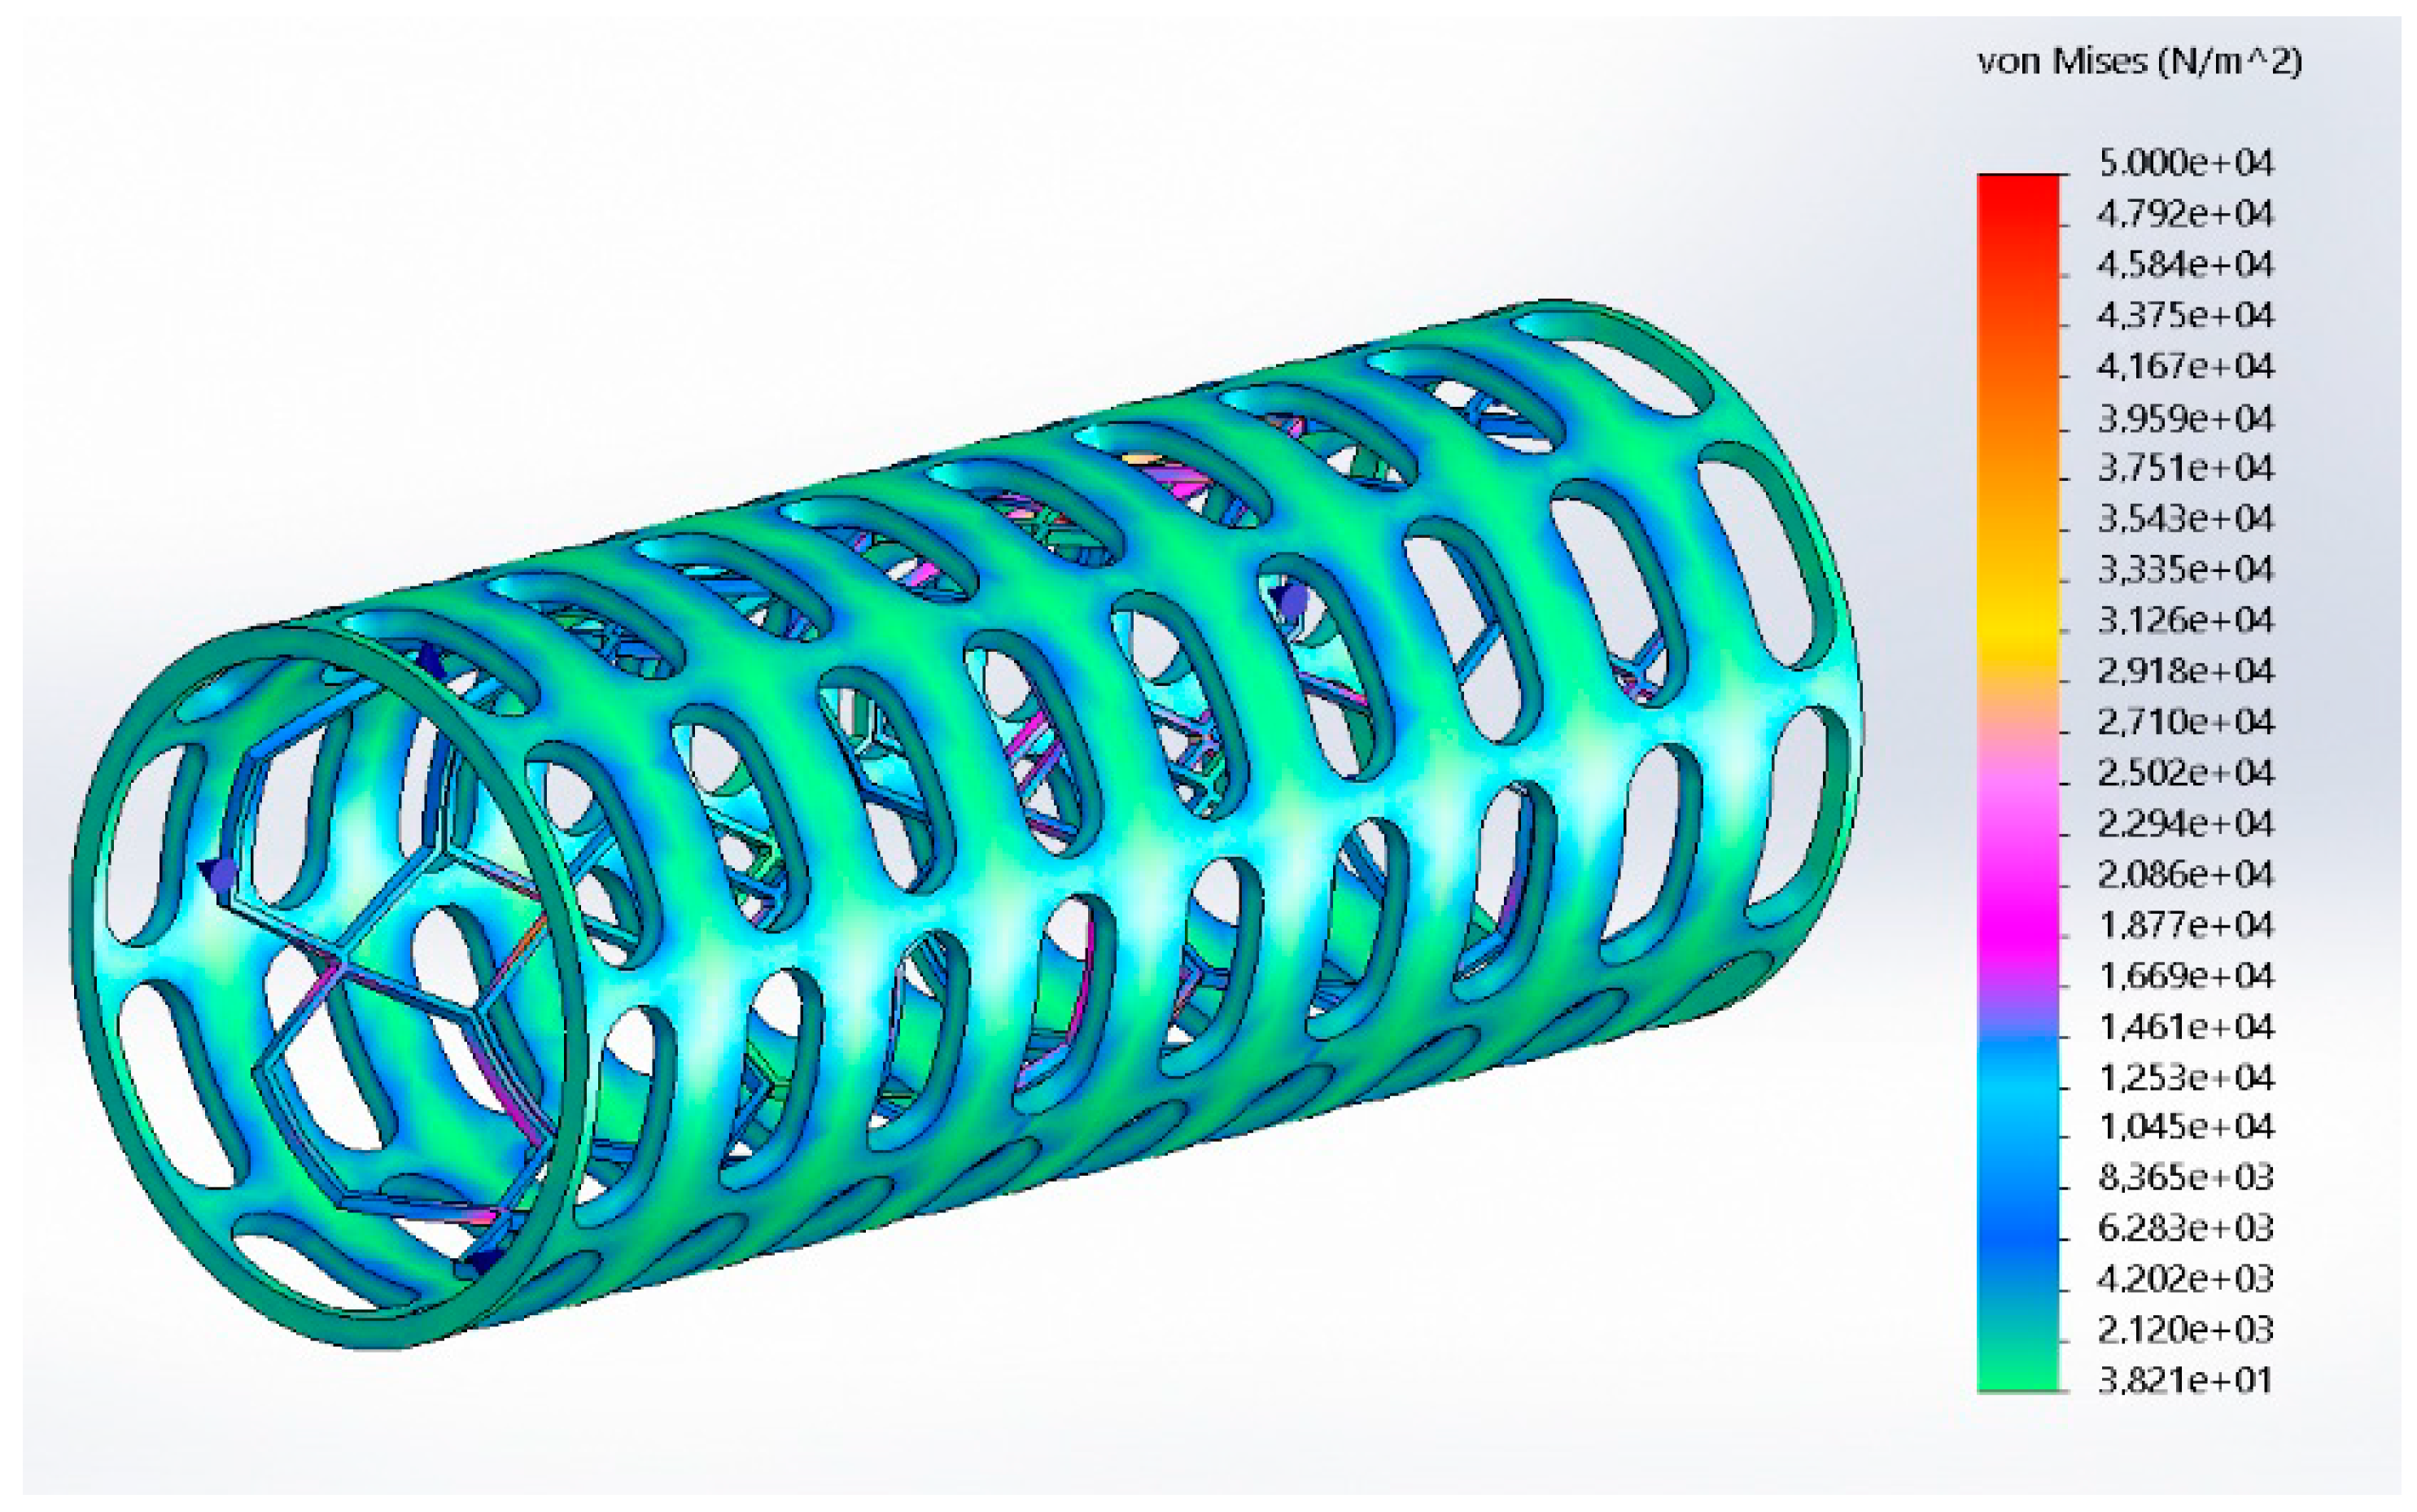
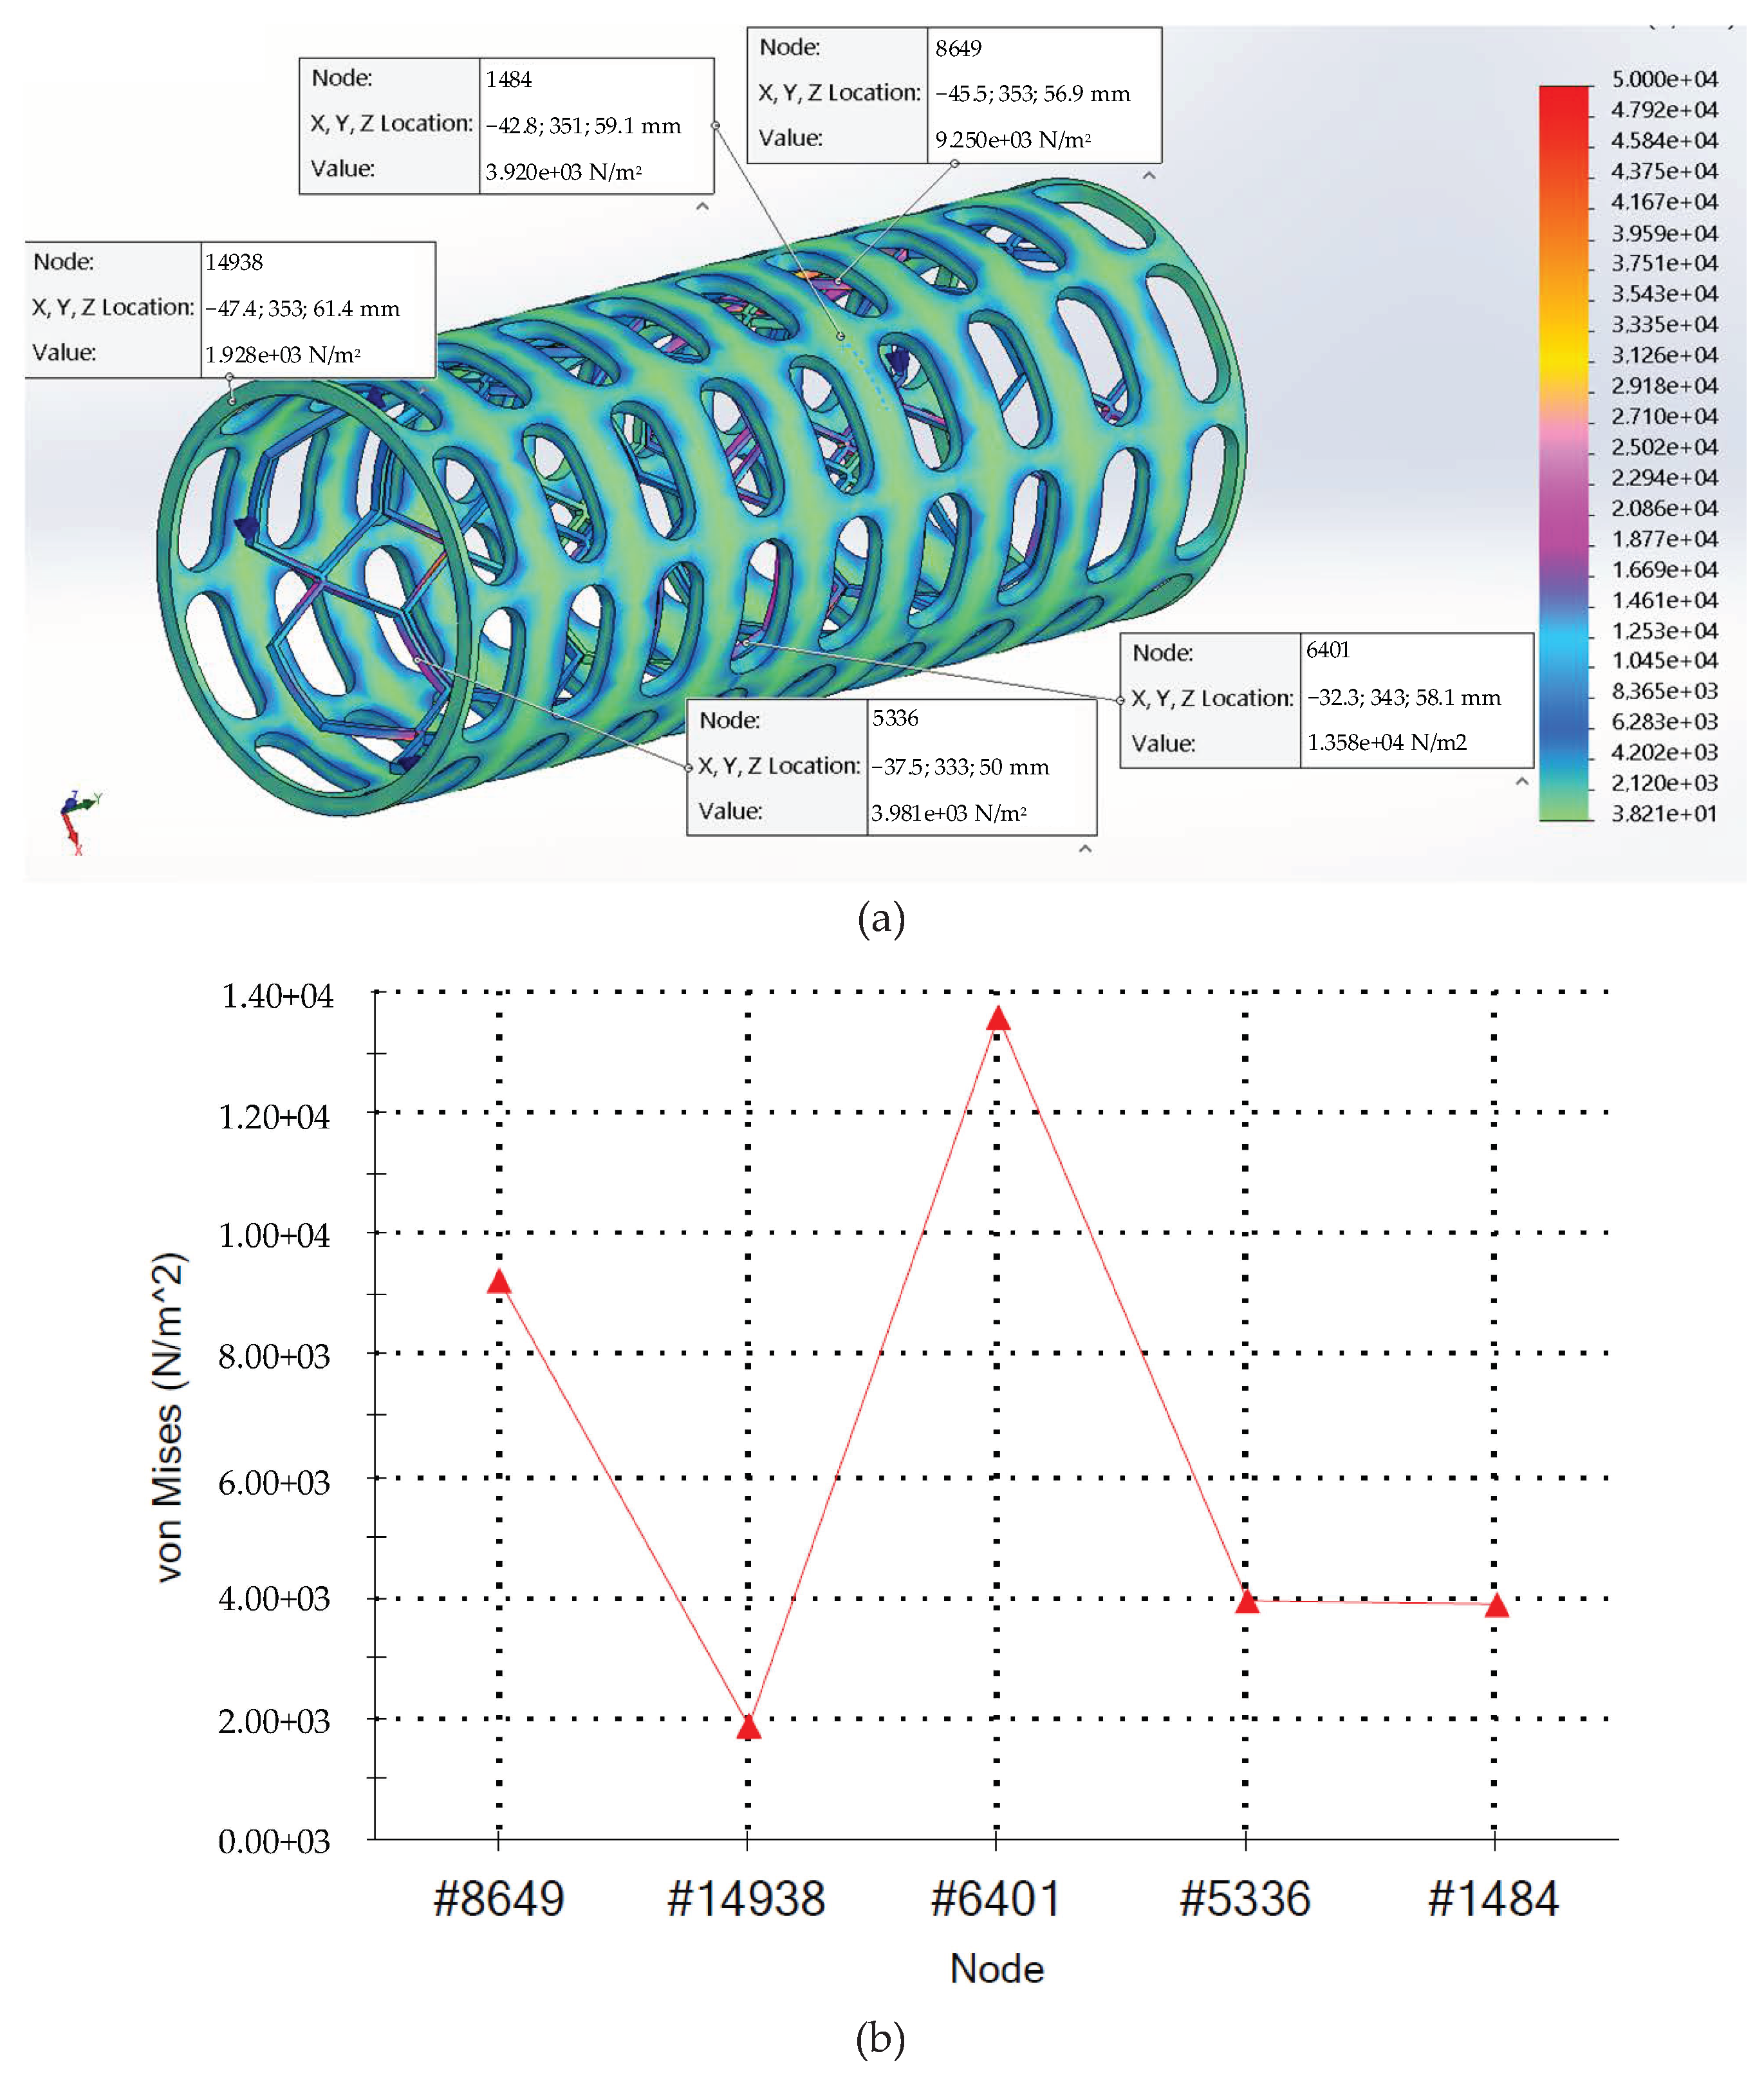
Effects of loads on the solid body (i.e., the stent) can be investigated by exporting the results of the computational fluid dynamic (CFD) analysis from “SolidWorks Flow Simulation” to “SolidWorks Simulation”. Therefore, loads such as thermal effect, environmental pressure, fluid pressure and velocity along the path coming from flow scenarios in SolidWorks Flow Simulation can be exported to SolidWorks Simulation in order to perform a stress analysis of the stent. SolidWorks Simulation is a finite element analysis (FEA) package that can analyze outputs on the solid body such as stress and factor of safety (FOS) when a linear static study is defined. The benefit of this method versus just defining the pressure and/or temperature load in a static study is that these imported loads are non-uniform. SolidWorks Flow Simulation exports all the gradients across the surfaces. This produces more realistic loads on the model. However, in the static analysis, fixtures do have to be added since it was not previously necessary to define these, as all physical geometry was stationary in the CFD tool. The static study requires fixtures to avoid an infinite movement of the geometry as a response to the loads. All the imported loads are applied to the model at the same time. The order does not matter since the laws of superposition compound all stresses. In terms of the effects of the loads imported, the reference temperature and/or pressure of the imported loads were specified. These values are used to determine how charges impact the state of the zero pressure. Zero strain arises when no stress on the model is applied. The Von Mises stress function was used as a criterion for the stress analysis. The Von Mises stress function, σvm, can be expressed in the form [22]:
where σ1, σ2 and σ3 are the three principal stresses acting on the x-, y-, and z-axes of the solid body. Von Mises stress is a non-negative, scalar stress measure that evaluates elasto-plastic properties. This number function represents a stress magnitude, which can be compared against the yield strength of the material in order to determine whether or not failure by yielding is predicted. On the other hand, using the maximum Von Mises stress criteria [22], the condition of safe design can be expressed as:
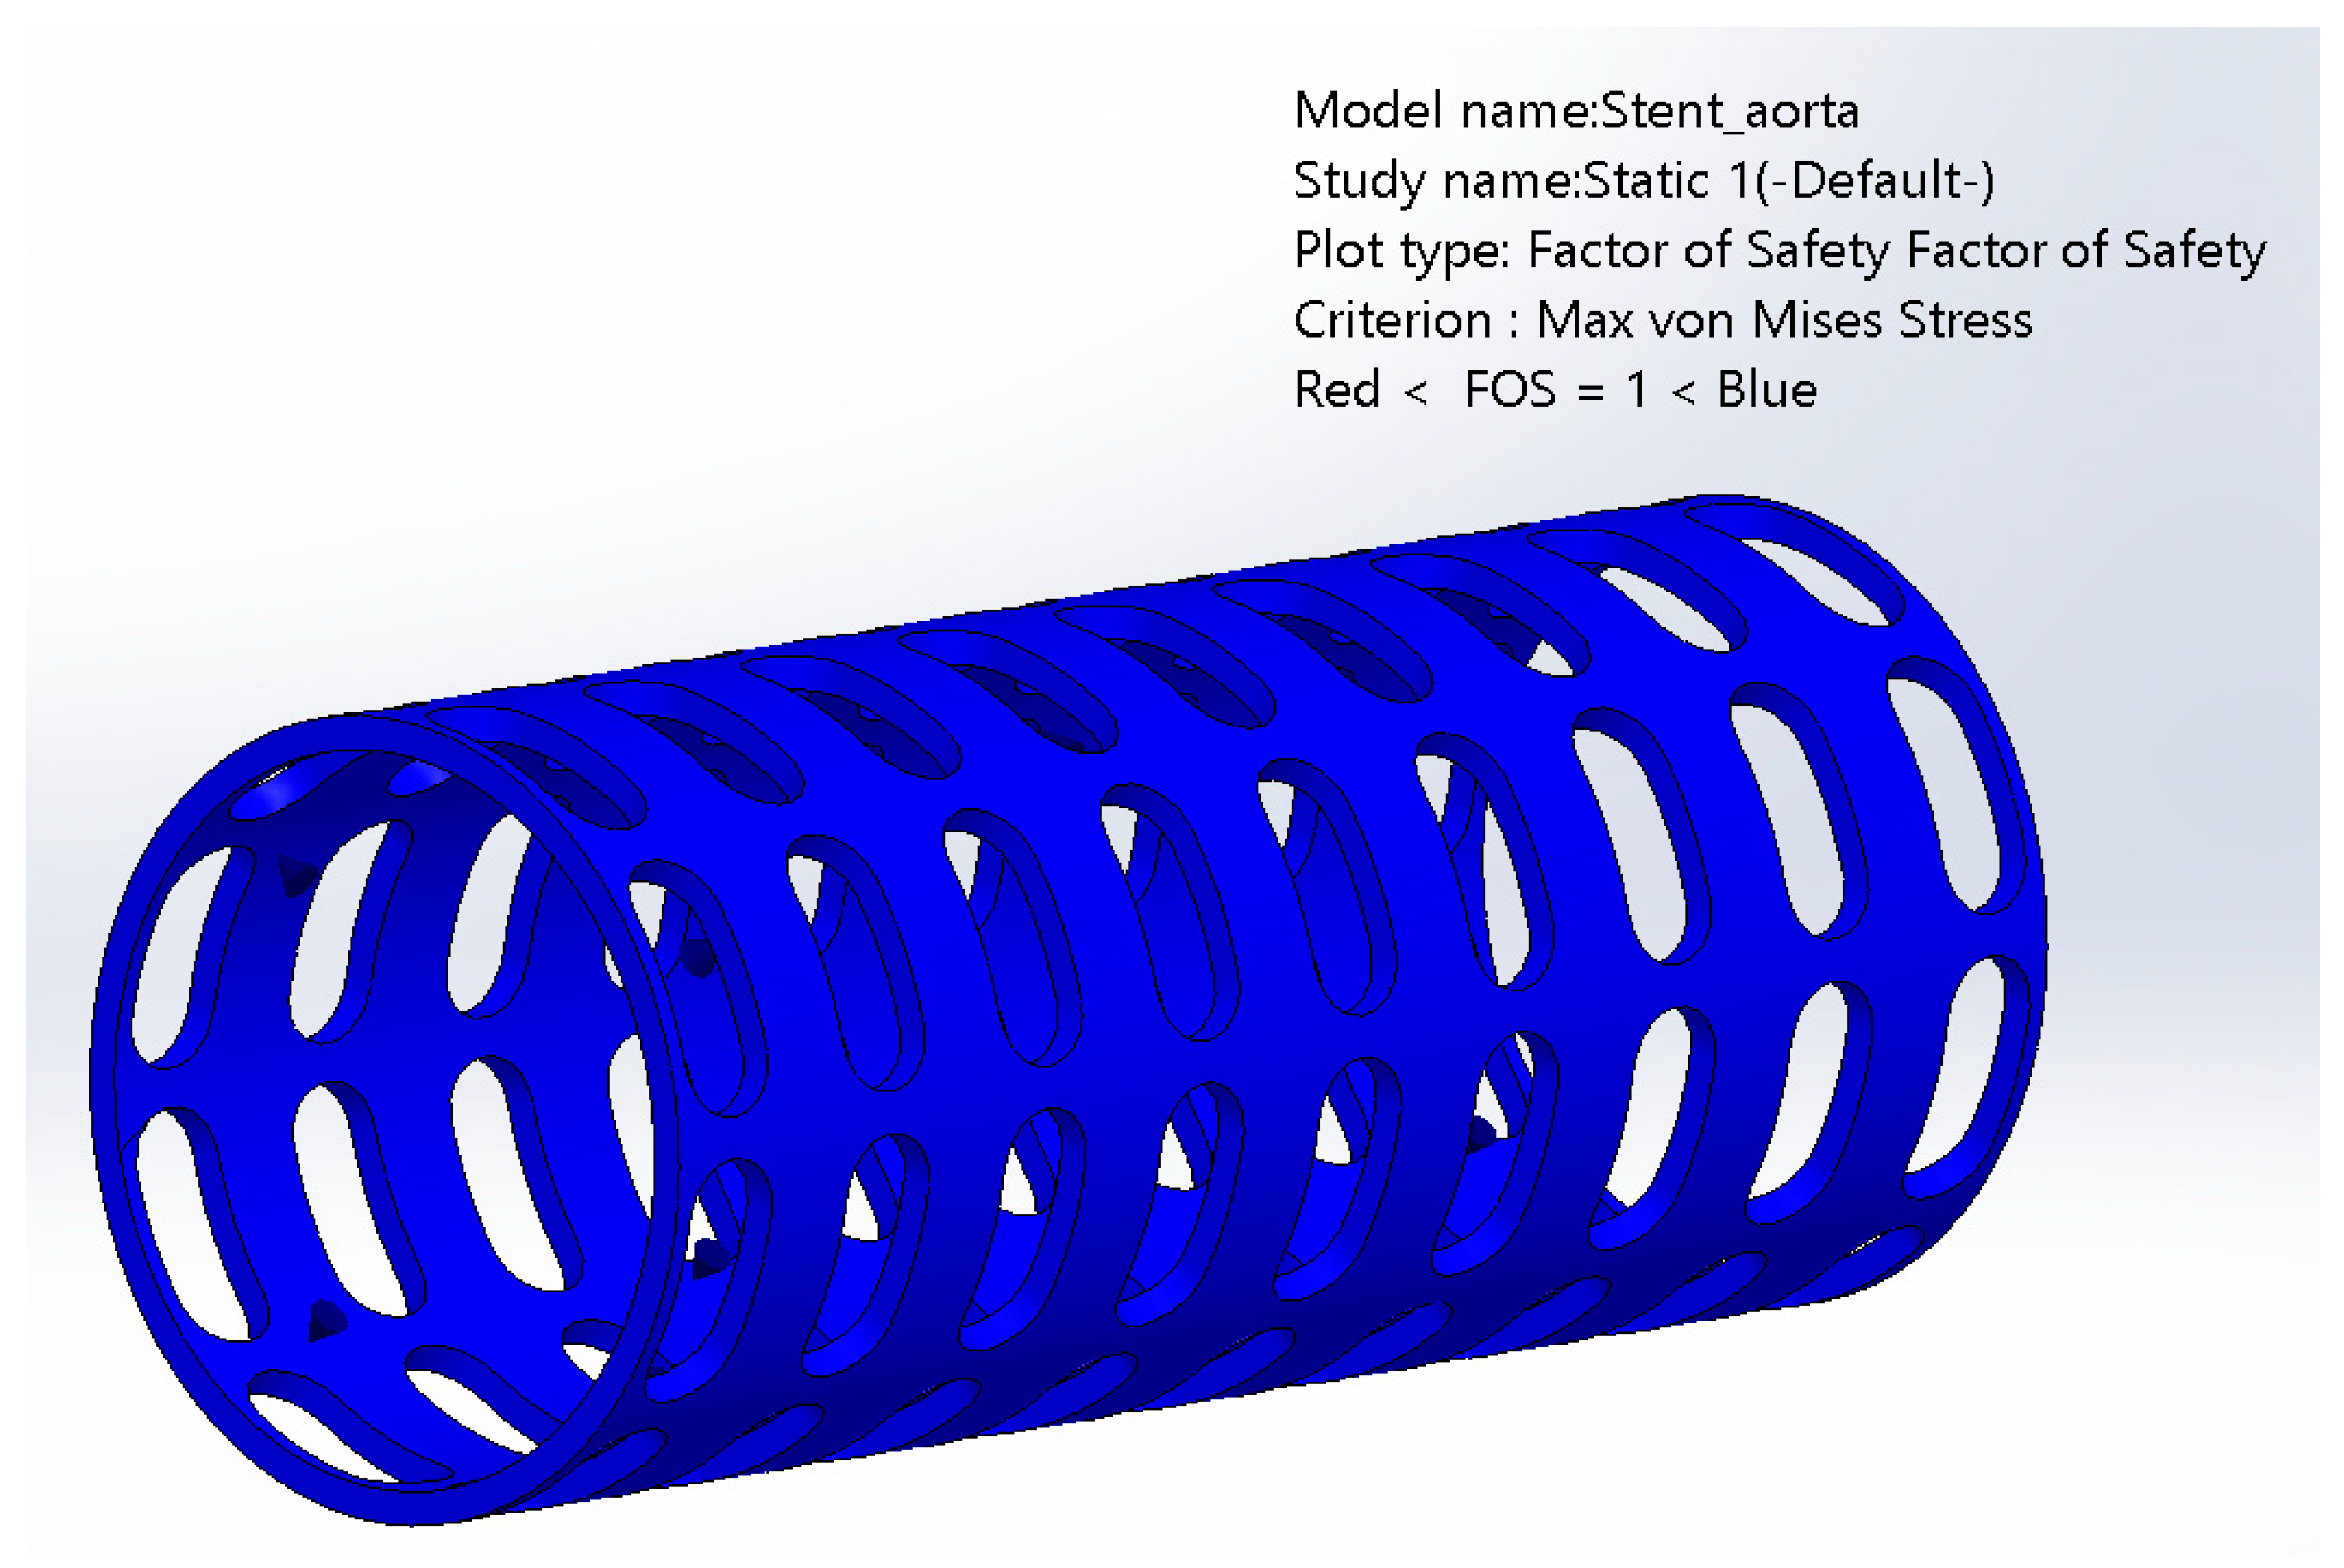
If the factor of safety (FOS) < 1, the material fails; if FOS = 0, the material is in a critical condition; and if FOS > 1, the material supports the applied loads without material failure.
Stress and FOS analysis were worked out through FEA modelling. Table 4 shows the mesh information used for the stress and FOS simulation. To establish a more complete image of the simulated environment, it was important to connect both simulations. Doing so, it was possible not only to determine the flow of the fluids, but also to study the stresses on geometry. In the simulation settings, titanium was used for the metal structure of the smart stent and silicon elastomer for the envelope. Table 5 and Table 6 show the mechanical properties of the titanium and the silicon elastomer used for the stent stress simulation, respectively.
Table 4.
Mesh information for stent stress and factor of safety (FOS) simulation.
Table 5.
Mechanical properties of titanium for stent stress and FOS simulation.
Table 6.
Mechanical properties of silicon elastomer for stent stress and FOS simulation.
3. Results
3.1. Computational Fluid Dynamic Analysis before and after Stent Implantation
Figure 4 shows the computed flow trajectories and velocities before stent implantation obtained from the computational fluid dynamic (CFD) analysis carried out in SolidWorks Flow Simulation. On the other hand, Figure 5 shows the computed flow trajectories and velocities obtained after stent implantation. In addition, Figure 6 shows the blood velocity plot of a cross-section of the aorta with respect to the section length without stent and after stent implantation to better understand the velocity trend. Table 7 shows the maximum, mean and minimum cross-section velocity before and after stent implantation.
Figure 4.
Computed flow trajectories and velocities for the aorta before stent implantation: (a) full view; (b) zoomed-in image of the place where the stent will be implanted.
Figure 5.
Computed flow trajectories and velocities after stent implantation: (a) full view; (b) zoomed-in image ofthe implanted stent.
Figure 6.
Cross-section velocities: (a) before stent implantation; (b) after stent implantation.
Table 7.
Maximum, mean and minimum cross-section velocity before and after stent implantation.
Figure 7 shows the dynamic blood pressure trend of a cross-section of the aorta with respect to the section length without stent and after stent implantation to better understand the pressure trend. Table 8 shows the maximum, mean and minimum cross-section pressure before and after stent implantation.
Figure 7.
Blood pressures: (a) Before stent implantation; (b) After stent implantation.
Table 8.
Maximum, mean and minimum cross-section pressure before and after stent implantation.
3.2. Stress and FOS Analysis
Figure 8 shows the computed stress. The stress values ranged between 3.82 × 101 and 6.17 × 10⁴ N/m2. In addition, Figure 9a displays five selected nodes of the stent and Figure 9b shows the plot of the nodal stress. These nodes were chosen since they are the most stressed ones, taking into account the loads such as thermal effect, environmental pressure, fluid pressure and velocity along the path coming from flow scenarios. Figure 10 shows the analysis of the factor of safety (FOS), where the blue colour indicates that the FOS is greater than 1.
Figure 8.
Computed results from stress analysis.
Figure 9.
Static nodal stress: (a) Nodes position, (b) Nodal stress plot.
Figure 10.
Computed factor of safety (FOS).
4. Discussion
Computational fluid dynamic (CFD) analysis and finite element analysis (FEA) have been used in recent years as very valuable tools in the study of stents and particularly fluid flow simulation plays an important role to avoid stent restenosis. Different mathematical models have been developed to provide reliable tools for stent simulation [23,24,25], and thanks to its previous or complementary results can be obtained before in vitro and in vivo experimentation [26]. Numerical simulation tools can be used for different approaches such as to test a stent’s performance, to optimize a stent’s design, to test different materials and different geometries, to test different treatments and to simulate and to customize a stent within a real reconstructed vascular model, to test the blood flow changes within aneurisms after stent implantation, to study the stent positioning, and to study a drug-eluting stent’s performance [27,28,29]. The presented CFD analysis and FEA represent important steps to better understanding the blood flow behavior after stent implantation and the structure performance when loads are applied. Consequently, they represent important steps before stent implementation and before in vitro and in vivo experiments. On the other hand, it is important to highlight that the 3D printing technologies for rapid prototyping allow the implementation of new geometries using biocompatible materials [30,31].
Regarding Figure 4, Figure 5 and Figure 6 and Table 7, before stent implantation, the blood velocity was within the range of normal blood velocities [18] and the velocity trend decreased when the blood approached the aorta surface. As expected, after stent implantation, a high flow rate is concentrated in the center of the stent and it decreases gradually, but the blood fluid never reaches zero velocity, thus there is not liquid retention or vortex generation after stent implantation. After stent implantation, the mean and the maximum cross-section velocity increased with respect to the results obtained before stent implantation since the cross-section area is reduced. However, the mean velocity after stent implantation remains within normal blood velocity ranges under normal conditions velocities [18]. On the other hand, the maximum velocity after stent implantation is within the range of the normal peak blood velocities of a thoracic aorta that, according to the literature, range from 1.50 to 1.75 m/s [32]. Therefore, the results in Figure 4, Figure 5 and Figure 6 and Table 7 demonstrate that stent implantation does not affect the flow functionality in terms of velocity, thus avoiding in-stent restenosis.
It is important to note that the blood pressure can influence the risk of restenosis [33]; a high blood pressure is associated with increased risk of restenosis [34]. Regarding Figure 7 and Table 8, the blood pressure values were within the normal blood pressure values before stent implantation [19]. As expected, after stent implantation, the blood pressure values decreased since an increase in velocity implies a decrease in pressure according to Bernoulli’s equation [35]. In both, before and after stent implantation, the blood pressure values were within the normal blood pressure values that, according to the literature, range from 7999.34 to 15,998.70 Pa [19].
As seen in Figure 8 and Figure 9, the highest stress values are on the metal mesh structure and the smallest stress values are on the envelope. However, the highest stress values are very far from the yield strength limit of the used titanium for the metal mesh structure, which is 3.70 × 10⁸ N/m2. Moreover, all the stress values on the entire stent are very far from the yield strength limit of the used silicon elastomer for the envelope, namely 2.40 × 10⁶ N/m2. In addition, the stress is symmetrically distributed on the stent structures. Consequently, the stress values show that the stent structure is stiff and it can support the applied loads. It is important to remember that the applied loads were exported from the CFD analysis. Therefore, CFD analysis was an essential step to compute stent stress and factor of safety (FOS). On the other hand, the analysis FOS in Figure 10 had values greater than 1, showing that the stent materials support the applied loads without material failure.
5. Conclusions
This paper introduced a novel implantable biocompatible smart that operates with ultrasonic pair-operated ultrasonic sensors for restenosis monitoring through flow velocity. Computational fluid dynamic (CFD) analysis and finite element analysis (FEA) have been essential procedures to understand the operation of an implantable stent and the feasibility of its construction and lab experimentation. The proposed smart stent was implanted in the descending thoracic section of a virtually reconstructed aorta for simulation proposes. Blood flow velocity showed that after stent implantation, there is not liquid retention or vortex generation. In addition, blood pressures after stent implantation were within the normal blood pressure values. The stress and the Factor of Safety (FOS) analysis showed that the stress values reached by the stent are very far from the yield strength limit of the materials and that the stent is stiff enough to support the applied loads exported from the CFD results. Therefore, the implemented CFD and FEA analysis showed that the proposed device has an optimum performance in terms of blood velocity, blood pressure, stent stress, and index FOS. In addition, it is important to highlight that the proposed smart stent uses detection techniques for easy monitoring. The uses of ultrasonic transducers make the system flexible since they can be used both as a transmitter and as a receiver. In addition, since the stent has been designed for the use of wireless transmission, small dimensions can be used for the controller on the patient’s body. Moreover, since scientific studies of smart stents focused on pressure sensors, the proposed biocompatible smart stent is a novel alternative with a design for stent restenosis prevention, monitoring blood flow velocity, and a flexible technique for monitoring it post-implantation. Manufacturing and experimental tests will be part of the future works.
6. Patents
Cafolla, D.; Sebastiano, F. Dispositivo impiantabile per il monitoraggio dell’evoluzione delle eventuali restenosis [Implantable device for monitoring the evolution of restenosis]. Italian patent application No. 202020000001102, submission date: 09 March 2020.
Author Contributions
Conceptualization, D.C. and F.S.; methodology, D.C.; validation, D.C.; formal analysis, D.C. and B.D.M.C.-R.; investigation, D.C. and B.D.M.C.-R.; resources, D.C., F.S. and B.D.M.C.-R.; data curation, D.C. and B.D.M.C.-R.; writing—original draft preparation, D.C. and B.D.M.C.-R.; writing—review and editing, B.D.M.C.-R. and D.C.; visualization, D.C. and B.D.M.C.-R.; supervision, D.C.; project administration, D.C. All authors have read and agreed to the published version of the manuscript.
Funding
This research received no external funding.
Conflicts of Interest
The authors declare no conflict of interest.
References
- Rauch, U.; Osende, J.I.; Fuster, V.; Badimon, J.J.; Fayad, Z.; Chesebro, J.H. Thrombus Formation on Atherosclerotic Plaques: Pathogenesis and Clinical Consequences. Ann. Intern. Med. 2001, 134, 224–238. [Google Scholar] [CrossRef] [PubMed]
- Chen, X.; Assadsangabi, B.; Hsiang, Y.; Takahata, K. Enabling Angioplasty-Ready “Smart” Stents to Detect In-Stent Restenosis and Occlusion. Adv. Sci. 2018, 5, 1700560. [Google Scholar] [CrossRef] [PubMed]
- Park, J.; Kim, J.; Kim, D.; Shanmugasundaram, A.; Park, S.; Kang, S.; Kim, S.; Jeong, M.; Lee, D. Wireless pressure sensor integrated with a 3D printed polymer stent for smart health monitoring. Sens. Actuators B Chem. 2019, 280, 201–209. [Google Scholar] [CrossRef]
- Rubartelli, P.; Niccoli, L.; Verna, E.; Giachero, C.; Zimarino, M.; Fontanelli, A.; Vassanelli, C.; Campolo, L.; Martuscelli, E.; Tommasini, G. Stent implantation versus balloon angioplasty in chronic coronary occlusions: Results from the GISSOC trial. J. Am. Coll. Cardiol. 1998, 32, 90–96. [Google Scholar] [CrossRef]
- Wilson, W.M.; Cruden, N.L.M. Advances in coronary stent technology: Current expectations and new developments. Res. Rep. Clin. Cardiol. 2013, 4, 85–96. [Google Scholar]
- Stentys. Available online: http://www.stentys.com/products/xposition-s/ (accessed on 28 September 2020).
- Bi, Y.; Zhu, X.; Yu, Z.; Yi, M.; Han, X.; Ren, J. Clinical outcomes of self-expandable metallic stents for malignant obstructive atelectasis. Sci. Rep. 2020, 10, 3600. [Google Scholar] [CrossRef] [PubMed]
- Chang, F.C.; Luo, C.B.; Chung, C.P.; Kuo, K.H.; Chen, T.Y.; Lee, H.J.; Lin, C.J.; Lirng, J.F.; Guo, W.Y. Influence of Vertebrobasilar Stenotic Lesion Rigidity on the Outcome of Angioplasty and Stenting. Sci. Rep. 2020, 10, 3923. [Google Scholar] [CrossRef]
- Burt, H.M.; Hunter, W.L. Drug-eluting stents: A multidisciplinary success story. Adv. Drug Deliv. Rev. 2006, 58, 350–357. [Google Scholar] [CrossRef]
- Joner, M.; Finn, A.V.; Farb, A.; Mont, E.K.; Kolodgie, F.D.; Ladich, E.; Kutys, R.; Skorija, K.; Gold, H.K.; Virmani, R. Pathology of drug-eluting stents in humans: Delayed healing and late thrombotic risk. J. Am. Coll. Cardiol. 2006, 48, 193–202. [Google Scholar] [CrossRef]
- Hill, R.A.; Dündar, Y.; Bakhai, A.; Dickson, R.; Walley, T. Drug-eluting stents: An early systematic review to inform policy. Eur. Heart J. 2004, 25, 25–902. [Google Scholar] [CrossRef]
- Kastrati, A.; Mehilli, J.; Dirschinger, J.; Pache, J.; Ulm, K.; Schühlen, H.; Seyfarth, M.; Schmitt, C.; Blasini, R.; Neumann, F.J.; et al. Restenosis after coronary placement of various stent types. Am. J. Cardiol. 2001, 87, 34–39. [Google Scholar] [CrossRef]
- Collins, R.; Burch, J.; Cranny, G.; Aguiar-Ibáñez, R.; Craig, D.; Wright, K.; Berry, E.; Gough, M.; Kleijnen, J.; Westwood, M. Duplex ultrasonography, magnetic resonance angiography, and computed tomography angiography for diagnosis and assessment of symptomatic, lower limb peripheral arterial disease: Systematic review. BMJ 2007, 334, 1257–1261. [Google Scholar] [CrossRef] [PubMed]
- Gulari, M.N.; Ghannad-Rezaie, M.; Novelli, P.; Chronis, N.; Marentis, T.C. An X-ray detectable pressure microsensor for monitoring coronary in-stent restenosis. In Proceedings of the 2014 IEEE 27th International Conference on Micro Electro Mechanical Systems (MEMS), San Francisco, CA, USA, 26–28 January 2014; pp. 893–896. [Google Scholar] [CrossRef]
- Lethen, H.; Tries, H.P.; Kersting, S.; Lambertz, H. Validation of noninvasive assessment of coronary flow velocity reserve in the right coronary artery: A comparison of transthoracic echocardiographic results with intracoronary Doppler flow wire measurements. Eur. Heart J. 2003, 24, 1567–1575. [Google Scholar] [CrossRef]
- Cafolla, D.; Sebastiano, F. An Implantable Biocompatible Smart Stent for Monitoring Eventual Restenosis. In Advances in Italian Mechanism Science: Mechanisms and Machine Science; Springer: Cham, Switzerland, 2020; Volume 91, pp. 861–867. [Google Scholar] [CrossRef]
- Cafolla, D.; Sebastiano, F. Dispositivo Impiantabile per il Monitoraggio Dell’evoluzione delle Eventuali Restenosis [Implantable Device for Monitoring the Evolution of Restenosis]. Italian Patent Application No. 202020000001102, 9 March 2020. [Google Scholar]
- Bogren, H.G.; Buonocore, M.H. 4D magnetic resonance velocity mapping of blood flow patterns in the aorta in young vs. elderly normal subjects. J. Magn. Reson. Imaging 1999, 10, 861–869. [Google Scholar] [CrossRef]
- Master, A.M.; Dublin, L.I.; Marks, H.H. The normal blood pressure range and its clinical implications. J. Am. Med. Assoc. 1950, 143, 1464–1470. [Google Scholar] [CrossRef] [PubMed]
- Geneva, I.I.; Cuzzo, B.; Fazili, T.; Javaid, W. Normal body temperature: A systematic review. Open Forum Infect. Dis. 2019, 6, ofz032. [Google Scholar] [CrossRef] [PubMed]
- Sobachkin, A.; Dumnov, G. Numerical basis of CAD-embedded CFD. In Proceedings of the NAFEMS World Congress, Salzburg, Austria, 9–12 June 2013. [Google Scholar]
- Budynas, R.G.; Nisbett, J.K.; Shigley, J.E. Shigley’s Mechanical Engineering Design, 8th ed.; McGraw-Hill: New York, NY, USA, 2008; p. 216. [Google Scholar]
- Zunino, P.; D’Angelo, C.; Petrini, L.; Vergara, C.; Capelli, C.; Migliavacca, F. Numerical simulation of drug eluting coronary stents: Mechanics, fluid dynamics and drug release. Comput. Methods Appl. Mech. Eng. 2009, 198, 3633–3644. [Google Scholar] [CrossRef]
- Martin, D.; Boyle, F.J. Computational structural modelling of coronary stent deployment: A review. Comput. Methods Biomech. Biomed. Eng. 2011, 14, 331–348. [Google Scholar] [CrossRef] [PubMed]
- Hsu, J.H.; Younan, D.; Pandalai, S.; Gillespie, B.T.; Jain, R.A.; Schippert, D.W.; Narins, C.R.; Khanna, A.; Surowiec, S.M.; Davies, M.G.; et al. Use of computer simulation for determining endovascular skill levels in a carotid stenting model. J. Vasc. Surg. 2004, 40, 1118–1125. [Google Scholar] [CrossRef] [PubMed]
- Berry, J.L.; Manoach, E.; Mekkaoui, C.; Rolland, P.H.; Moore, J.E.; Rachev, A. Hemodynamics and Wall Mechanics of a Compliance Matching Stent: In Vitro and In Vivo Analysis. J. Vasc. Interv. Radiol. 2002, 13, 97–105. [Google Scholar] [CrossRef]
- Berry, J.L.; Santamarina, A.; Moore, J.E.; Moore, J.E., Jr.; Roychowdhury, S.; Routh, W.D. Experimental and Computational Flow Evaluation of Coronary Stents. Ann. Biomed. Eng. 2000, 28, 386–398. [Google Scholar] [CrossRef] [PubMed]
- Augsburger, L.; Reymond, P.; Rufenacht, D.A.; Stergiopulos, N. Intracranial stents being modeled as a porous medium: Flow simulation in stented cerebral aneurysms. Ann. Biomed. Eng. 2011, 39, 850–863. [Google Scholar] [CrossRef] [PubMed]
- Zhang, Y.; Chong, W.; Qian, Y. Investigation of intracranial aneurysm hemodynamics following flow diverter stent treatment. Med. Eng. Phys. 2013, 35, 608–615. [Google Scholar] [CrossRef] [PubMed]
- Misra, S.K.; Ostadhossein, F.; Babu, R.; Kus, J.; Tankasala, D.; Sutrisno, A.; Walsh, K.A.; Bromfield, C.R.; Pan, D. 3D-Printed Multidrug-Eluting Stent from Graphene-Nanoplatelet-Doped Biodegradable Polymer Composite. Adv. Healthcare Mater. 2017, 6, 1700008. [Google Scholar] [CrossRef] [PubMed]
- Guerra, A.J.; Ciurana, J. 3D-printed bioabsordable polycaprolactone stent: The effect of process parameters on its physical features. Mater. Design. 2018, 137, 430–437. [Google Scholar] [CrossRef]
- Brant, W.E. The Core Curriculum: Ultrasound, 1st ed.; Lippincott Williams & Wilkins: Philadelphia, PA, USA, 2001; p. 554. [Google Scholar]
- Rigatelli, G.; Zuin, M.; Dell’Avvocata, F.; Vassilev, D.; Daggubati, R.; Nguyen, T.; Thang, N.V.V.; Foin, N. Evaluation of coronary flow conditions in complex coronary artery bifurcations stenting using computational fluid dynamics: Impact of final proximal optimization technique on different double-stent techniques. Cardiovasc. Revasc. Med. 2017, 8, 233–240. [Google Scholar] [CrossRef] [PubMed]
- Tocci, G.; Coluccia, R.; Modestino, A.; Sciarretta, S.; Paneni, F.; Zardi, D.M.; Pace, B.A.; Nannini, C.; Abbolito, S.; Sorropaco, G.; et al. Coronary Intrastent Restenosis and Blood Pressure Levels: Retrospective Analysis of a Large Cohort of Patients with Coronary Single Vessel Disease. High. Blood Press. Cardiovasc. Prev. 2008, 15, 333. [Google Scholar] [CrossRef]
- Lawence-Brown, M.M.D.; Liffman, K.; Semmens, J.B.; Sutalo, I.D. Vascular Arterial Haemodynamics. Mechanisms of Vascular Disease: A Reference Book for Vascular Specialists [Internet]; University of Adelaide Press: Adelaide, Australia, 2011; p. 553. [Google Scholar]
Publisher’s Note: MDPI stays neutral with regard to jurisdictional claims in published maps and institutional affiliations. |
© 2020 by the authors. Licensee MDPI, Basel, Switzerland. This article is an open access article distributed under the terms and conditions of the Creative Commons Attribution (CC BY) license (http://creativecommons.org/licenses/by/4.0/).


