Article

A 1D–3D Approach for Fast Numerical Analysis of the Flow Characteristics of a Diesel Engine Exhaust Gas

Training Ship Management Center, Pukyong National University, Busan 48513, Korea
Machines 2021, 9(10), 239; https://doi.org/10.3390/machines9100239
Submission received: 17 September 2021 / Revised: 13 October 2021 / Accepted: 14 October 2021 / Published: 17 October 2021

Abstract

:
It is necessary to analyze the intake/exhaust gas flow of a diesel engine when turbocharger matching and when installing emission control devices such as exhaust gas recirculation (EGR), selective catalytic reduction (SCR), and scrubbers. Analyzing the intake/exhaust gas flow using a 3D approach can use various analytical models, but it requires a significant amount of time to perform the computation. An approach that combines 1D and 3D is a fast numerical analysis method that can utilize the analysis models of the 3D approach and obtain accurate calculation results. In this study, the flow characteristics of the exhaust gas were analyzed using a 1D–3D coupling algorithm to analyze the unsteady gas flow of a diesel engine, and whether the 1D–3D approach was suitable for analyzing exhaust systems was evaluated. The accuracy of the numerical analysis results was verified by comparison with the experimental results, and the flow characteristics of various shapes of the exhaust system of a diesel engine could be analyzed. Numerical analysis using the 1D–3D approach was able to be computed about 300 times faster than the 3D approach, and it was a method that could be used for research focused on the exhaust system. In addition, since it could quickly and accurately calculate intake/exhaust gas flow, it was expected to be used as a numerical analysis method suitable for analyzing the interaction of diesel engines with emission control devices and turbochargers.

1. Introduction

Tier III has been in effect since 2016, and ships built after 2016 must reduce their NOx emissions by at least 80% compared to ships built before 2010. Methods of reducing NOx include installing an exhaust gas recirculation (EGR), a selective catalytic reduction (SCR) [1], or using a dual-fuel engine [2]. In an SCR, the design of the mixer affects the performance, and Mehdi et al. studied the optimal design to reduce NOx using a numerical investigation [3]. Zeng et al. used CFD simulation to study the optimal design of a tower-type SCR [4], and the method of analyzing the gas flow of the SCR using numerical analysis is being used with its accuracy verified.
In order to meet the SOx emission regulations, low-sulfur oil with a sulfur content of 0.5% or less must be used [5], and the method of installing a scrubber or using liquefied natural gas (LNG) as fuel is applied. In the case of a dual-fuel engine using diesel and liquefied natural gas, research results have shown that it can reduce NOx emissions by 65% as well as SO2 by 91% [6], and it is attracting attention as a next-generation engine that can reduce environmental pollution.
In a dual-fuel engine or an engine using LNG as fuel, an explosion relief valve must be installed in the manifold as a countermeasure against an explosion accident occurring in the intake/exhaust system. Since the explosion relief valve of the intake/exhaust system has different characteristics from the explosion relief valve installed in the crankcase of the diesel engine, it is necessary to analyze the gas flow for the intake/exhaust system of the engine to predict the performance [7].
A diesel engine is equipped with a turbocharger to improve output, and turbocharger matching is performed according to engine specifications and operating conditions [8]. Kozak et al. used a numerical simulation method to analyze the results according to the shape of a two-stage turbine system, investigated the flow field and confirmed that the variable technology improves the efficiency of the two-stage turbine system [9]. As such, the numerical analysis method for gas flow analysis in turbochargers, SCRs, dual-fuel engines, and explosion relief valves has been verified for accuracy and used, and it is a useful method not only to predict performance but also to shorten the development process. However, in order to analyze the interaction of the emission control device or the turbocharger with the engine, it is necessary to perform a numerical analysis including the intake/exhaust gas flow.
Computational fluid dynamics (CFD) is used in various fields, such as predicting the performance of gas turbines. Meloni used CFD to analyze emissions from heavy-duty gas turbine burners and validated the analysis results by comparing them to experimental results [10]. Cruz-Manzo et al. predicted inter-stage dynamic compressor performance for a twin-shaft industrial gas turbine by combining a 1D compressor model and a 0D component model [11]. Numerical analysis conducted by combining different dimensions is usefully used as a method to obtain high-accuracy analysis results.
Among the methods of analyzing gas flow, numerical analysis using a 3D approach can use various analysis models, and it is possible to model the same as actual phenomena [12]. However, since a lot of time is required to perform the computation, it is not suitable to numerically analyze the entire intake/exhaust gas flow of a diesel engine equipped with emission control devices and a turbocharger using a 3D approach. A 1D approach is a fast computational method and provides accurate results for simple shapes such as straight pipes [13]. However, various analysis models cannot be applied, and the accuracy of analysis results for complex shapes is low. In the author’s previous study, a method of applying a discharge coefficient was used to increase the accuracy of the results of a 1D gas flow analysis. The method of applying the discharge coefficient can improve the pressure error, but there was a limit, and the phase difference caused by the complex shape cannot be improved [14]. In addition, 1D gas flow analysis is not suitable for analyzing gas flow according to shape changes, since analysis results such as pressure and velocity cannot be expressed in contours.
In order to improve for the shortcomings of the 3D and 1D approaches described above, an approach that combines 1D and 3D is being used. He et al. conducted a numerical study by combining 1D simulation and 3D CFD simulation for combustion and emission characteristics in a medium-speed diesel engine using in-cylinder cleaning technology. The 1D CFD model used AVL Boost software to simulate the engine working cycle, and the 3D CFD model used AVL Fire software. The method of combining 1D and 3D used a function built into the software [15]. Millo et al. analyzed the gas flow in the cylinder of the diesel engine by combining the 1D commercial code GT-SUITE and the 3D commercial code CONVERGE CFD. To combine 1D and 3D, the function built into the commercial code is used, and a method for predicting the performance of a diesel engine is proposed using the results of gas flow analysis [16].
Since the intake/exhaust system of a marine engine is designed in consideration of the effect of the reflected wave, it is necessary to analyze the gas flow considering the effect of the pressure wave. The author developed a 1D–3D coupling algorithm suitable for analyzing the gas flow of a diesel engine in a previous study. The 1D and 3D zones are coupled by using the method of characteristics (MOC), and the gas flow of the cylinder as well as the entire intake/exhaust system can be analyzed. In addition, it has been developed to model 1D and 3D zones according to user needs [17]. A 1D–3D coupling algorithm of the pipe system applicable to the intake/exhaust pipe was developed, numerical analysis was performed using this algorithm for reservoir–pipe–valve system, and the results were verified. The result of analyzing the gas flow by dividing it into 1D or 3D zones based on the central point of the pipe showed an error of less than 2.20%, and was able to be calculated 11.46 times faster than the 3D approach [18].
In the author’s previous research, the development of the 1D–3D approach and the accuracy of numerical analysis were studied as the subject; the subject of this study was the utilization method of the 1D–3D approach and the speed of computing numerical analysis. The difference between the 1D–3D approach developed by the author and other studies was that 1D and 3D were coupled using the MOC and user-defined functions (UDFs), and only Ansys Fluent R15.0 was used as a commercial CFD code. Therefore, the equations used for numerical analysis of gas flow could be freely modified. The purpose of this study was to evaluate whether numerical analysis using the 1D–3D approach developed by the author could be used to analyze emission control devices, and to verify whether it was suitable for analyzing the characteristics of exhaust gases according to the shape changes in the exhaust system of a diesel engine. By using the characteristics results of the exhaust gas, it was possible to analyze the effect of the emission control device installed in the exhaust system of a diesel engine and the turbocharger interacting with the diesel engine. In addition, numerical analysis using the 1D–3D approach could be utilized for exhaust-system-focused research because it did not require many resources to calculate the intake/exhaust gas flow of a diesel engine. In the following content, modeling for numerical analysis using the 1D–3D approach and the shape changes into four types of exhaust system are explained. Then, the contents of comparison with the experimental results for validation and the results of numerical analysis were described.

2. Numerical Analysis

2.1. Modeling

Figure 1 shows the modeling for numerical analysis using the 1D–3D approach for the gas flow in a diesel engine. The gas flow of intake/exhaust pipes, ports, valves, and a cylinder were modeled, and numerical analysis was performed using Ansys Fluent R15.0. In order to analyze the flow characteristics of the devices applied to the exhaust system, the exhaust pipe was modeled into the four shapes described in the following section as the subject of the analysis.
For the method of coupling 1D and 3D, an algorithm developed in the author’s previous research was used. Using the 1D–3D coupling algorithm applied to the air intake system, the intake/exhaust gas flow of the compression ignition engine could be calculated in about 20 min. The result of numerical analysis of the gas flow was not only able to obtain accurate results with an error of about 0.58%, but also visualized the flow by expressing the pressure and velocity results analyzed in the 3D zone as contours [17].
If the cylinder and intake/exhaust valves are numerically analyzed in a 3D approach, the dynamic mesh could be used to simulate the movement of the piston and valves, which is a computationally time-consuming technique [19]. Therefore, in order to save computation time, the 1D approach was used for the cylinder and intake/exhaust valves and the 3D approach was used for the complex shape of intake/exhaust ports, because a large error occurs when using the 1D approach. One-dimensional–three-dimensional coupling was performed at the intake pipe, intake valve, and exhaust valve, and the position where the exhaust port and the exhaust pipe meet was the pressure measurement point of the exhaust pipe in the experiment.
To perform numerical analysis of the 3D zones, standard k-epsilon was used for the viscous model, and PISO (pressure-implicit with splitting of operators) was used for the solution scheme. For the boundary condition of the 1D–3D coupling face, a pressure far-field condition was applied, and the boundary condition of the valve system 1D–3D coupling face was changed to the wall while the intake/exhaust valve was closed. The initial condition of the intake/exhaust gas was the same atmospheric pressure as the experimental conditions (naturally aspirated exhaust gas was released into the atmosphere), and the pressure results were obtained by applying the discharge coefficient obtained from the average mass flow rate.
Figure 2 shows the pressure results of the entire intake/exhaust system modeled for numerical analysis using the 1D–3D approach. The 1D zone represents the intake pipe pressure as a line-plot, and the 3D zone represents the pressure contour. The number of meshes of the 1D zone in the intake pipe was 35, and the pressure results were shown for each mesh position (distance, X). Additionally, the cylinder pressure was able to obtain the pressure result according to the crank angle (CA°). Figure 2 showed the pressure results at 254 CA° (a) when the exhaust valve was fully opened and 461 CA° (b) when the intake valve was fully opened in the entire intake/exhaust system of the diesel engine. In addition, numerical analysis using the 1D–3D approach could obtain intake/exhaust system results at all crank angles.
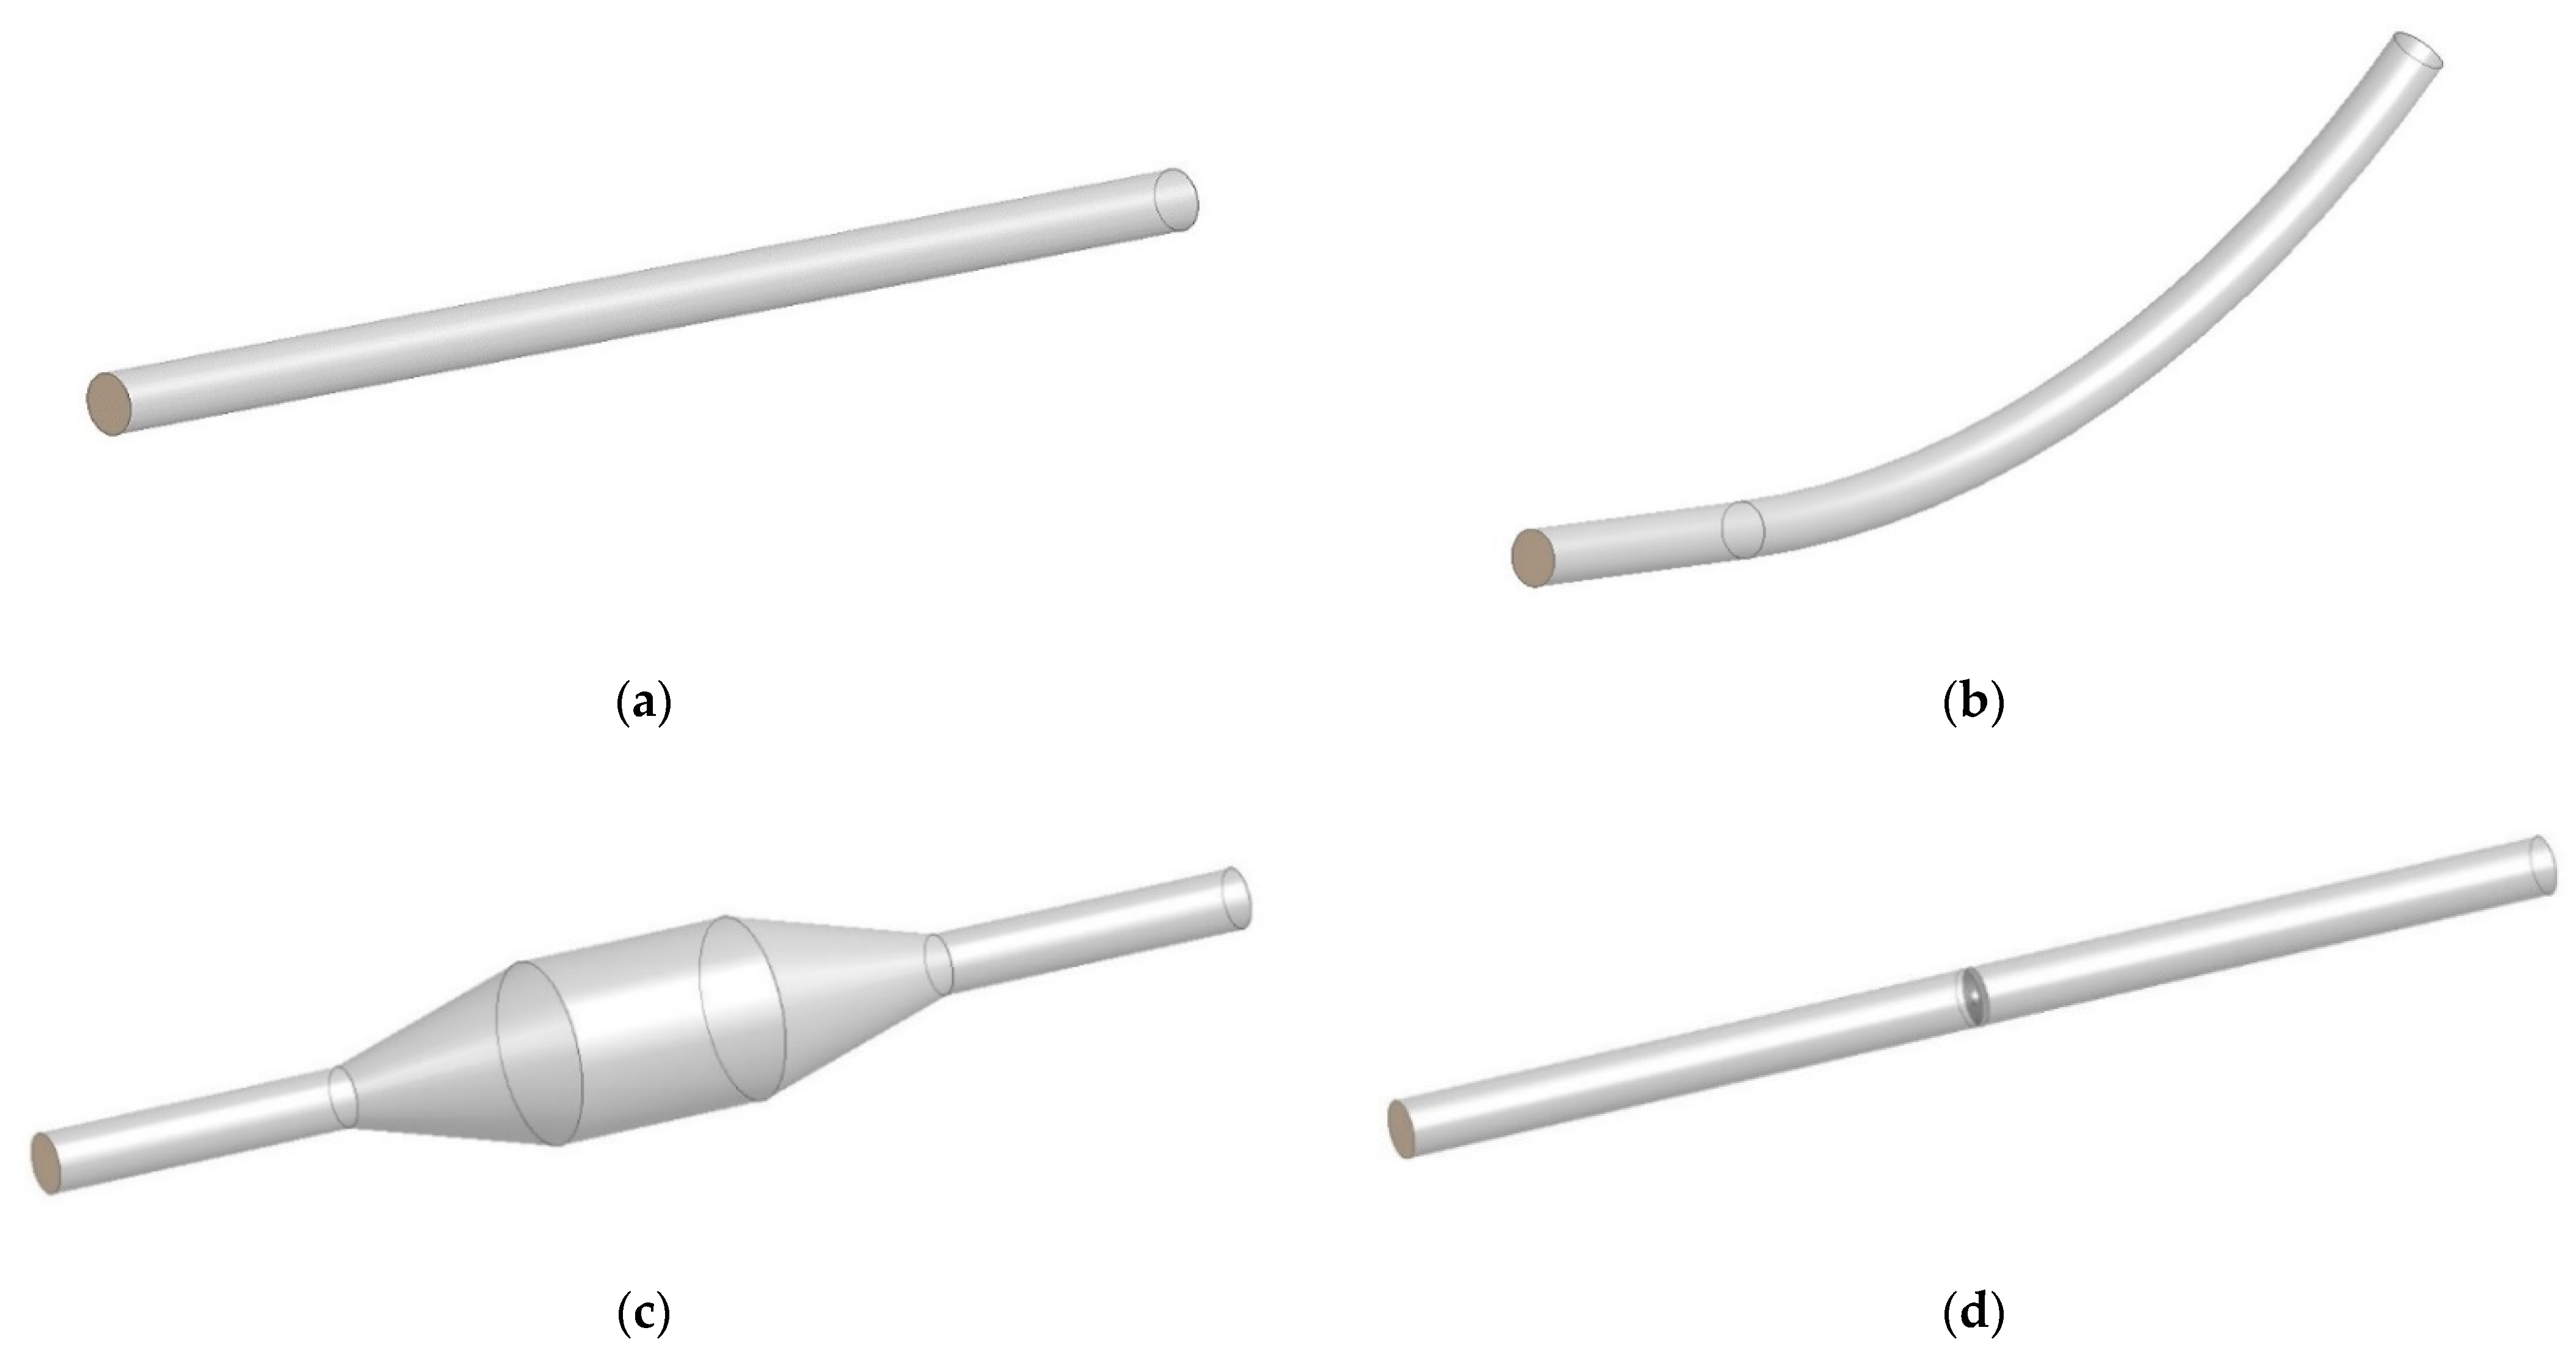
The exhaust system of a diesel engine consists of the manifold, the exhaust duct, etc., and has a complex shape composed of bent pipes and tapered pipes. In order to investigate whether the flow characteristics of various shapes of exhaust systems could be analyzed using the 1D–3D approach, modeling was performed of a curved pipe, SCR shapes composed of tapered pipes, and a pipe with an orifice.
Figure 3 shows the four shapes of the exhaust system to be analyzed. Shape (a) was a straight pipe; it was the same size as used in the experiment, and it was modeled to verify the accuracy by comparing the numerical analysis results with the experimental results. Shape (b) was a bent pipe, and it was modeled to analyze the characteristics of the gas flow passing through the wall. Shape (c) was a pipe composed of tapered pipes and was the shape of the expansion duct of SCR [20]. Shape (d) was a model of an orifice installed in the center of the pipe. A method of analyzing the gas flow of a turbocharger installed in a diesel engine using an orifice is being studied [21]. The orifice was modeled so that it could be used to study the gas flow of the turbocharger.
The 1D–3D coupling algorithm used in this study could also be used for coupling 1D and 2D. However, the reason for modeling in 3D was to increase the accuracy in calculating the gas flow through the intake/exhaust valve. Since the gas flow passing through the seat of the intake/exhaust valve passed circularly around the valve, the F_CENTROID functions of the UDFs were applied to realize this.

2.2. Time Step

In order to numerically analyze the interaction of intake/exhaust gas flow with the exhaust system of a diesel engine, it was necessary to calculate the entire crank angle, not just a few moments. Calculating the entire crank angle requires many time steps, and the number of time steps greatly affects the computation time [22].
The mesh size was determined by the mesh independence, and the time step size was determined by the ratio of the minimum mesh size to the gas velocity. The time step size for numerical analysis was also different in the 1D and 3D zones because the mesh size was different. In order to use the 1D–3D approach, it was necessary to synchronize the time steps, and because the synchronization of the time steps uses linear interpolation, more than two 3D calculations must be performed in a 1D time step to obtain stable results [18].
Table 1 presents the size of the time step of the 3D zone according to the gas velocity, and the number of time steps in the 3D zone calculated for one time step in the 1D zone. The average gas velocity was 50 m/s, and since four times the steps in 3D were calculated per one time step in 1D, it was shown that stable results could be obtained in the synchronization of time steps using linear interpolation.

3. Results

3.1. Validation

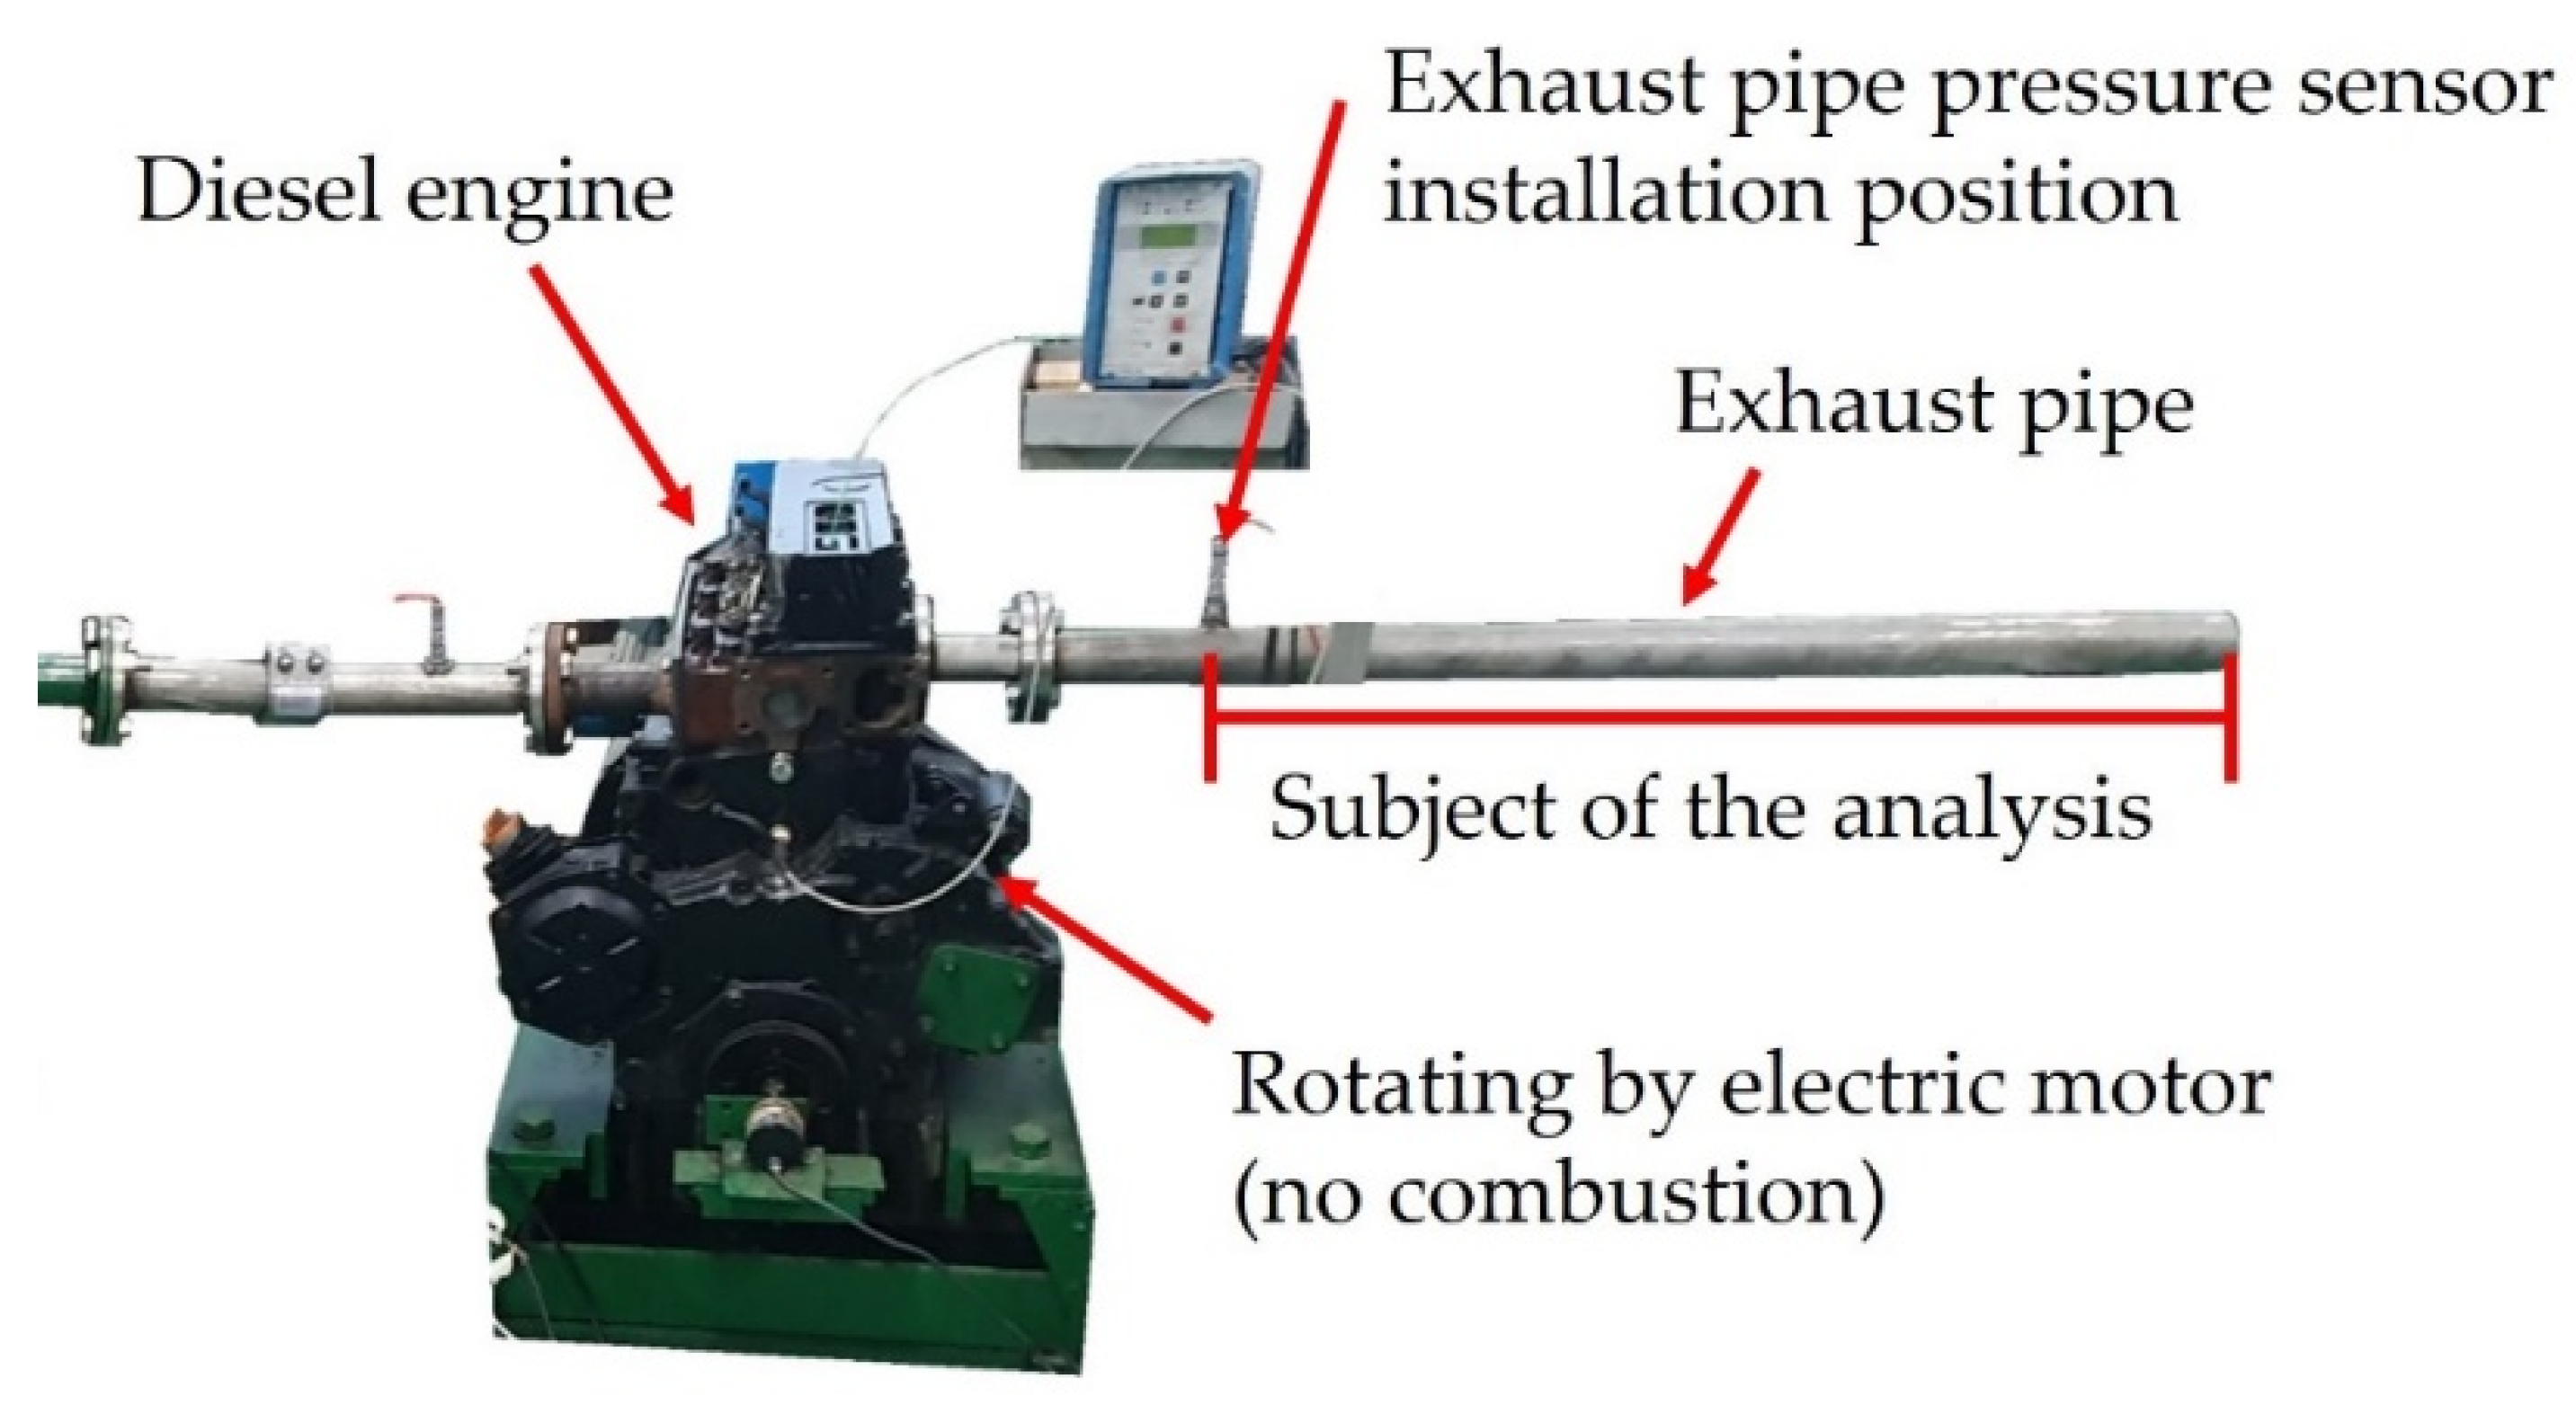
To validate the results of analyzing the gas flow of the diesel engine using the 1D–3D approach, the numerical results were compared with the cylinder and exhaust pipe pressures measured in the experiment. Figure 4 shows a photograph of the experimental device, and the interference effect between cylinders was excluded by configuring the four-stroke diesel engine as a single cylinder. The intake air method was naturally aspirated, the gas in a cold flow state where it was measured that no combustion reactions occurred. The exhaust pipe was a straight pipe, gas was discharged into the atmosphere from the end, and the results of the 1D–3D approach numerical analysis in the straight pipe were compared to the experimental results. The pressure was measured at 200 RPM intervals from engine speed 700 to 1500 RPM.
Figure 5 showed the cylinder pressure results of the experiment and the 1D–3D approach numerical analysis for validation. The timing of the increase and decrease in the cylinder pressure were the same in the experiment and the 1D–3D approach numerical analysis, and the maximum cylinder pressure was shown at the TDC (0 CA°) of the compression stroke. Table 2 presents the maximum cylinder pressure results of the 1D–3D approach numerical analysis based on the experimental results. The pressure error was less than 1.8%, and accurate results were obtained even when the engine speed was changed.
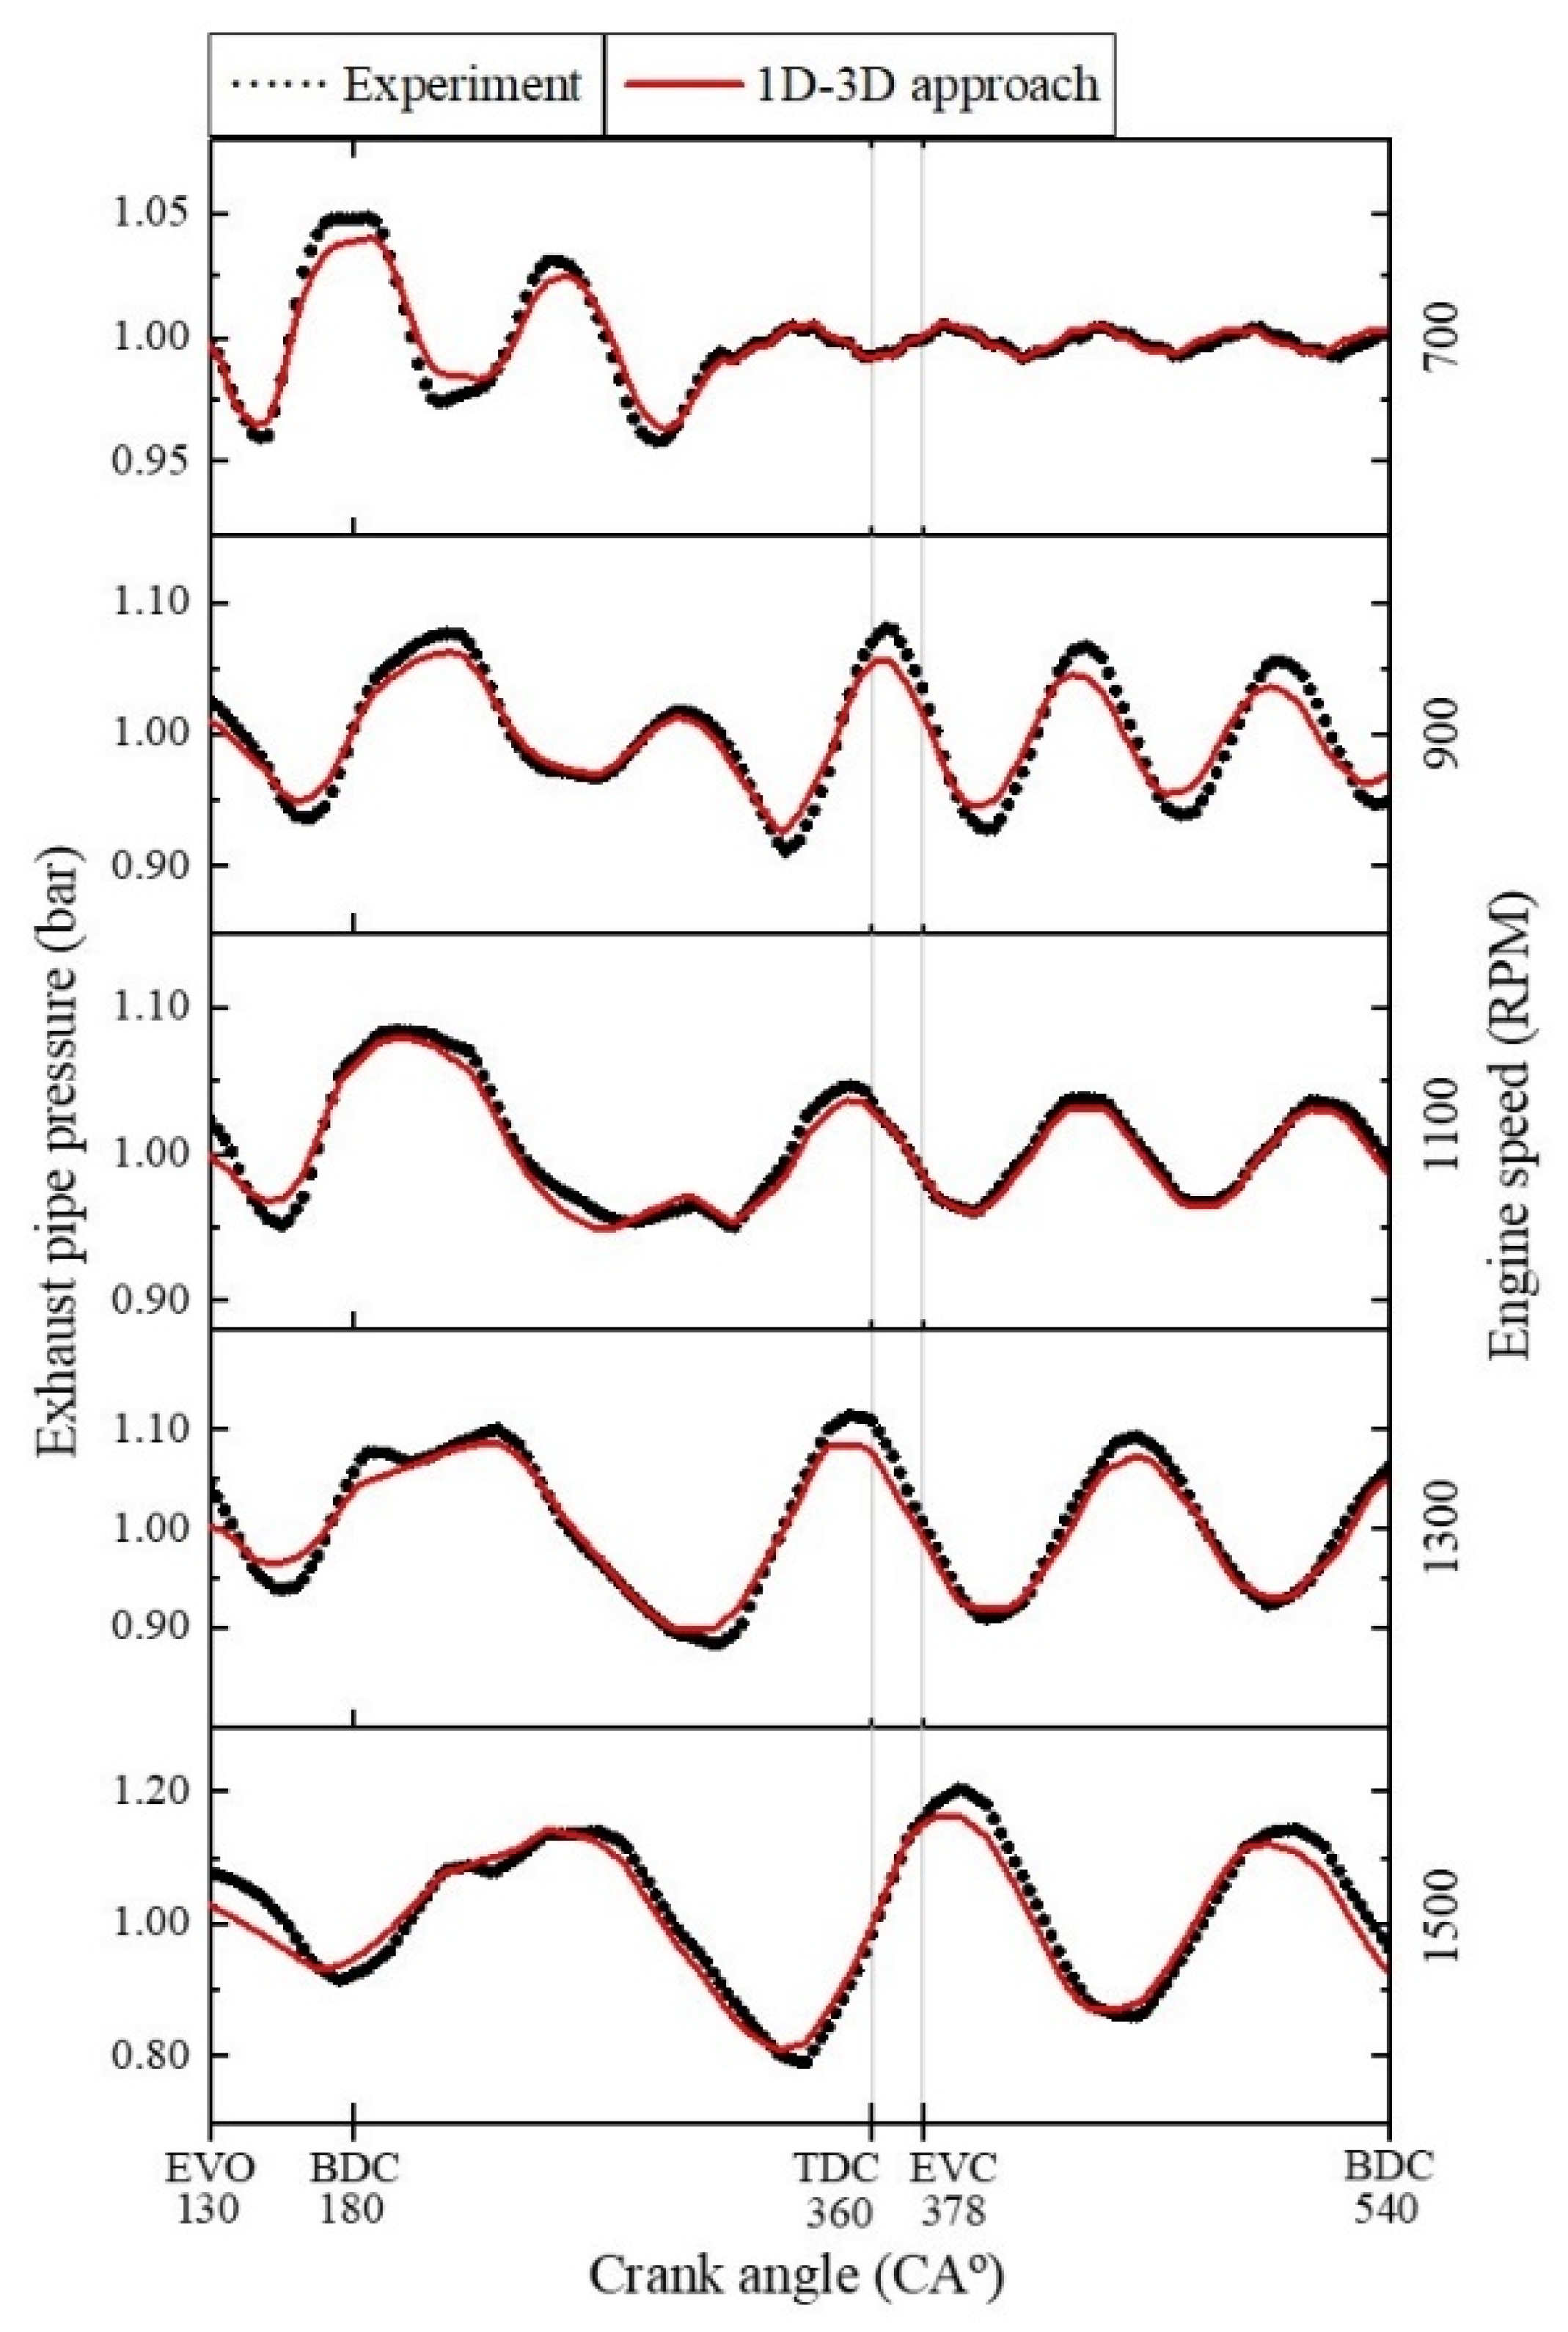
Figure 6 shows the experiment and the 1D–3D approach numerical analysis results for the exhaust pipe pressure in the shape of a straight pipe. From the timing of the exhaust valve opening (EVO) to the timing of the exhaust valve closing (EVC), the cycle of pressure increase and decrease was found to be longer as the engine speed increased. After EVC, the pressure of the gas flow through the exhaust pipe appeared in the form of periodic pulses. This showed that the overlap of the pressure wave of the gas flow passing through the pipe and the reflected wave generated at the open-end appears in the form of a pulsating flow [23]. The pressure error of the exhaust pipe was 2.8% on average, and the error was the smallest at 1100 RPM. In the following section, the flow characteristics according to the shape change are described as the results of numerical analysis at an engine speed of 1100 RPM.

3.2. Flow Characteristics According to the Shape Change of the Exhaust System

The pressure, streamline, and velocity results were analyzed, which can be used to study the flow characteristics of turbocharger matching and the emission control device applied to the exhaust system. The results were compared when the exhaust valve was fully opened, and the pressure results were expressed as contours so that they could be used to analyze the pressure waves. In the exhaust system of a diesel engine it is necessary to analyze the pressure wave, because the pressure wave caused by the outflow from the cylinder at the start of the exhaust process affects the system until the end of the exhaust process due to the inertia effect [24]. The shock wave can be analyzed using the streamline result, and it is also used in the study of supersonic flow [25].
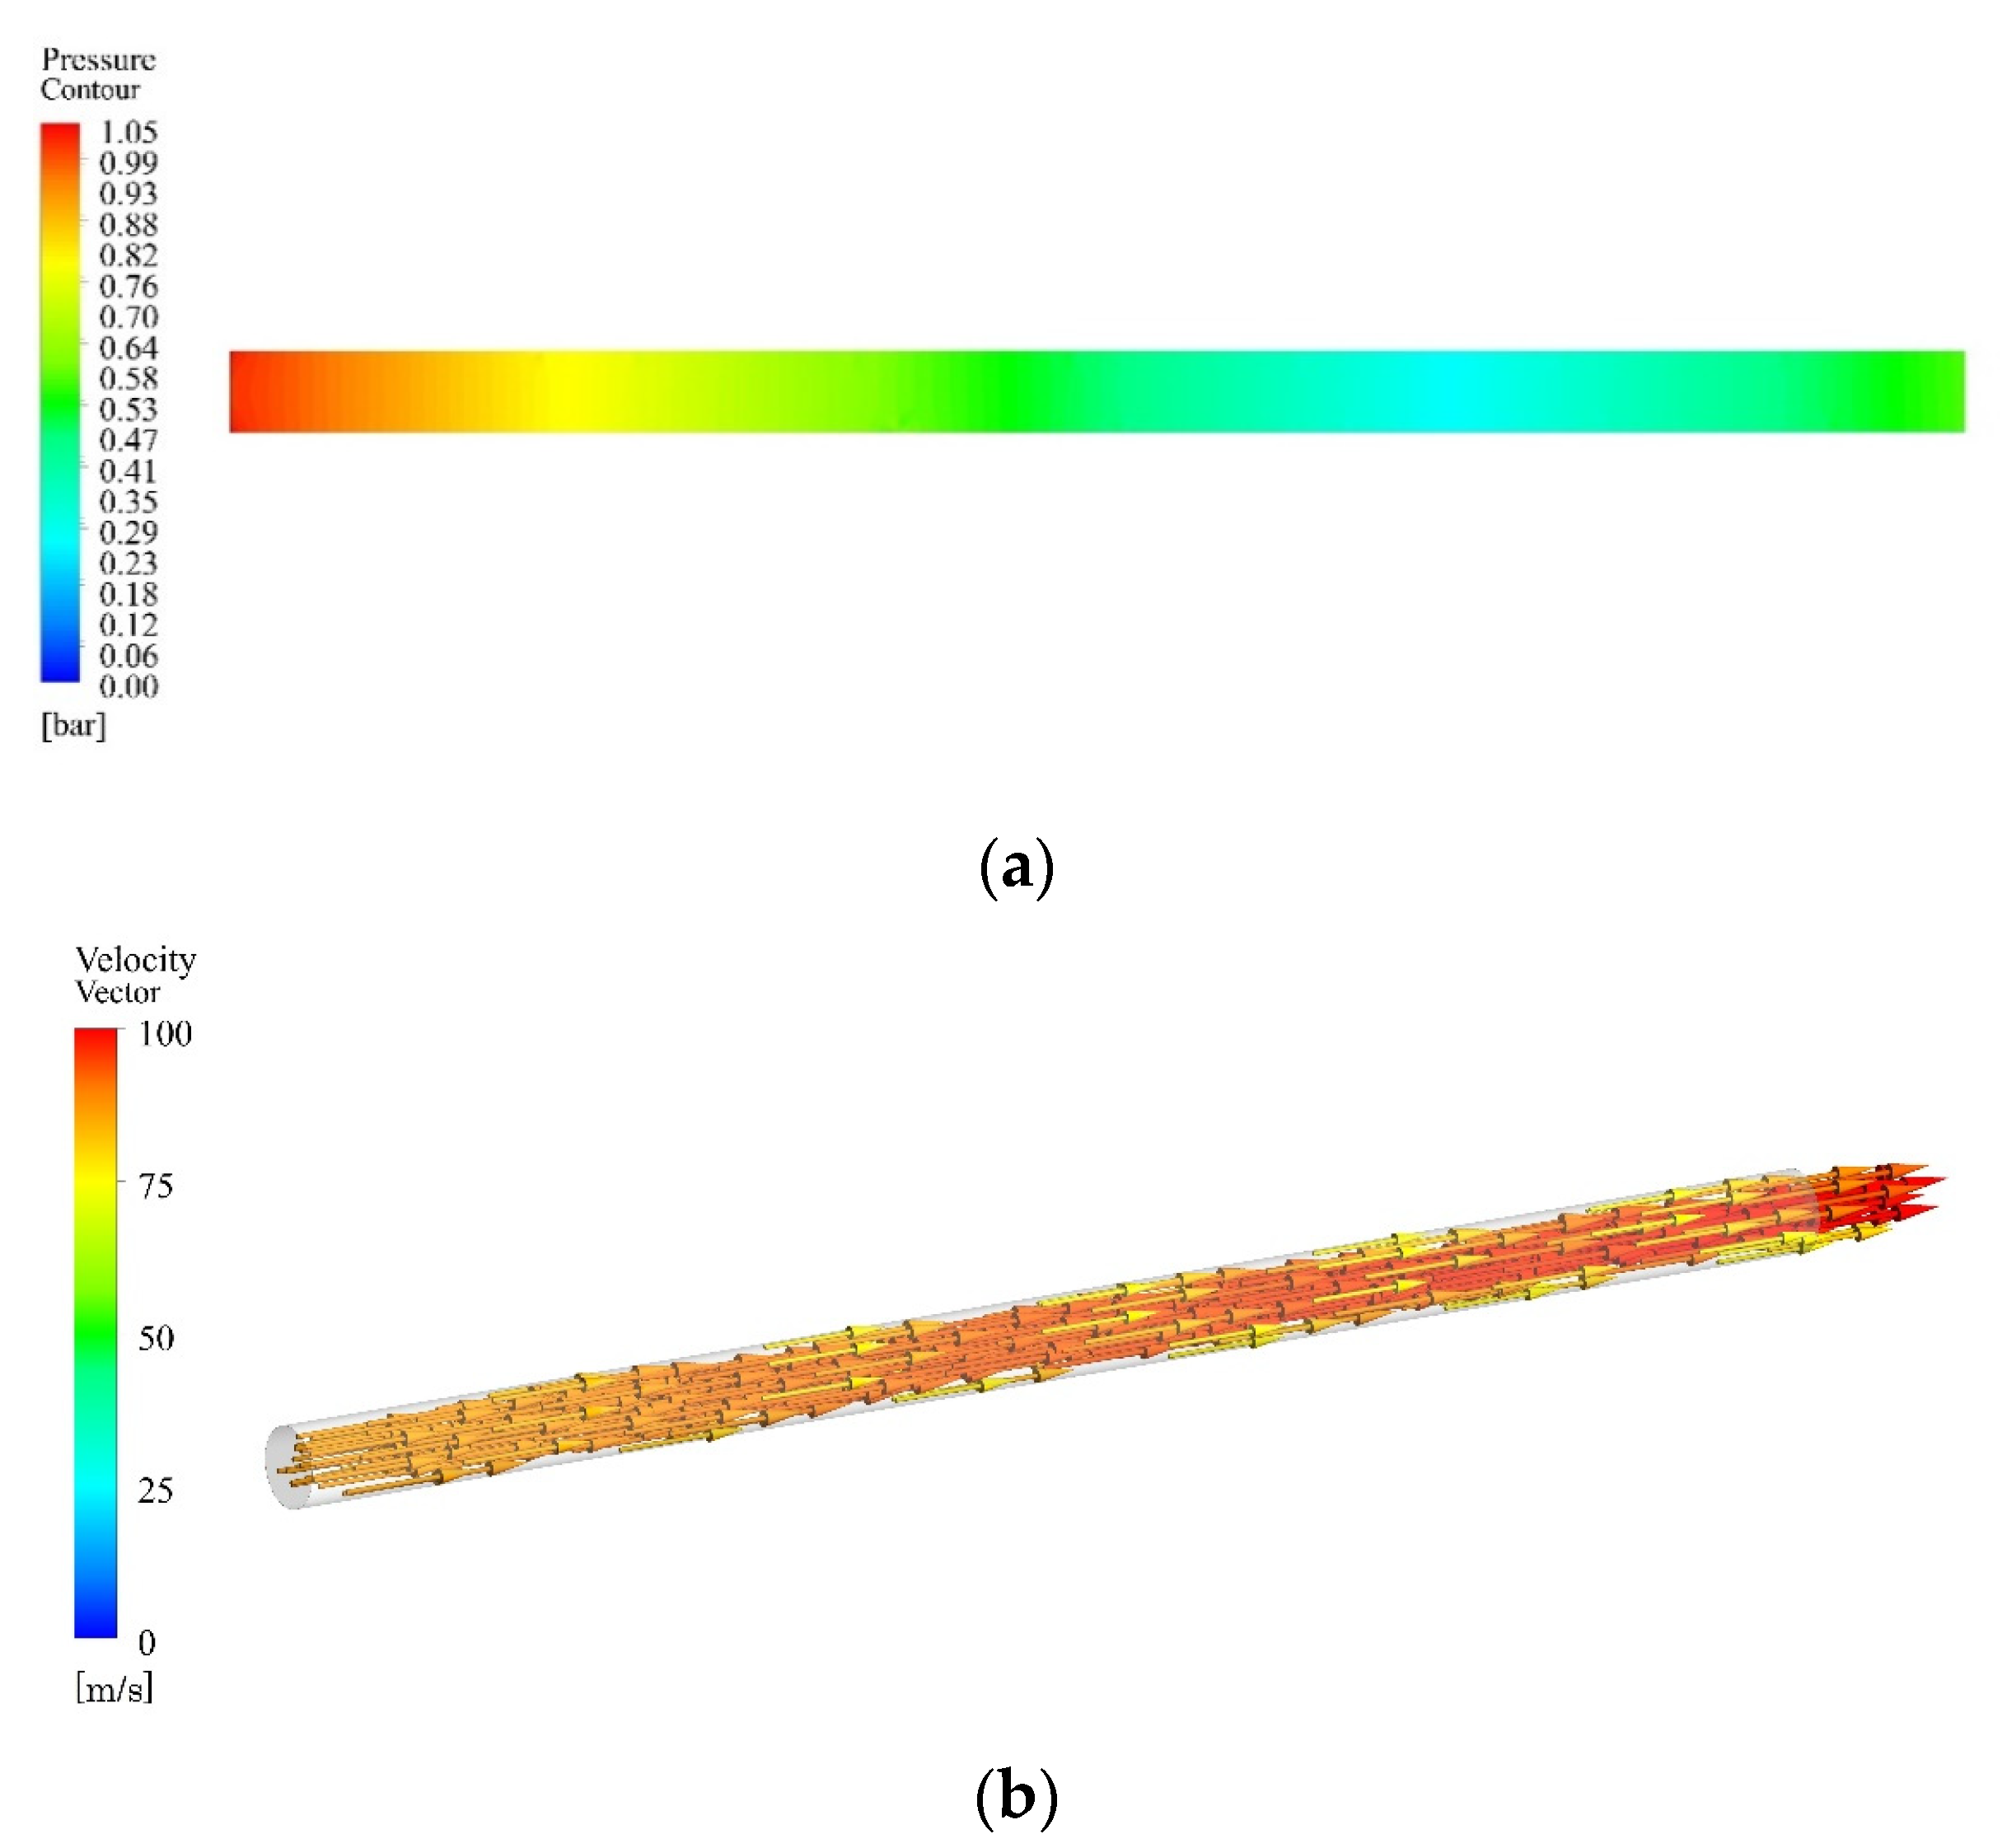
Figure 7 shows the pressure contour (a) and velocity vector (b) results obtained by the 1D–3D approach numerical analysis for the exhaust pipe with the same straight pipe shape as that of the experimental device. It was a state in which the gas was discharging through the end of the exhaust pipe and the reflected wave generated at the open end was overlapping the pressure wave passing through the pipe. Additionally, the gas flow through the near wall was slower than that of the center of the straight pipe in the velocity vector results. It could be predicted that the timing and position of the overlapping of the pressure wave and the reflected wave would be different depending on the length of the exhaust pipe, and it is expected that the results of the 1D–3D approach numerical analysis can be used to analyze the pulsation flow.
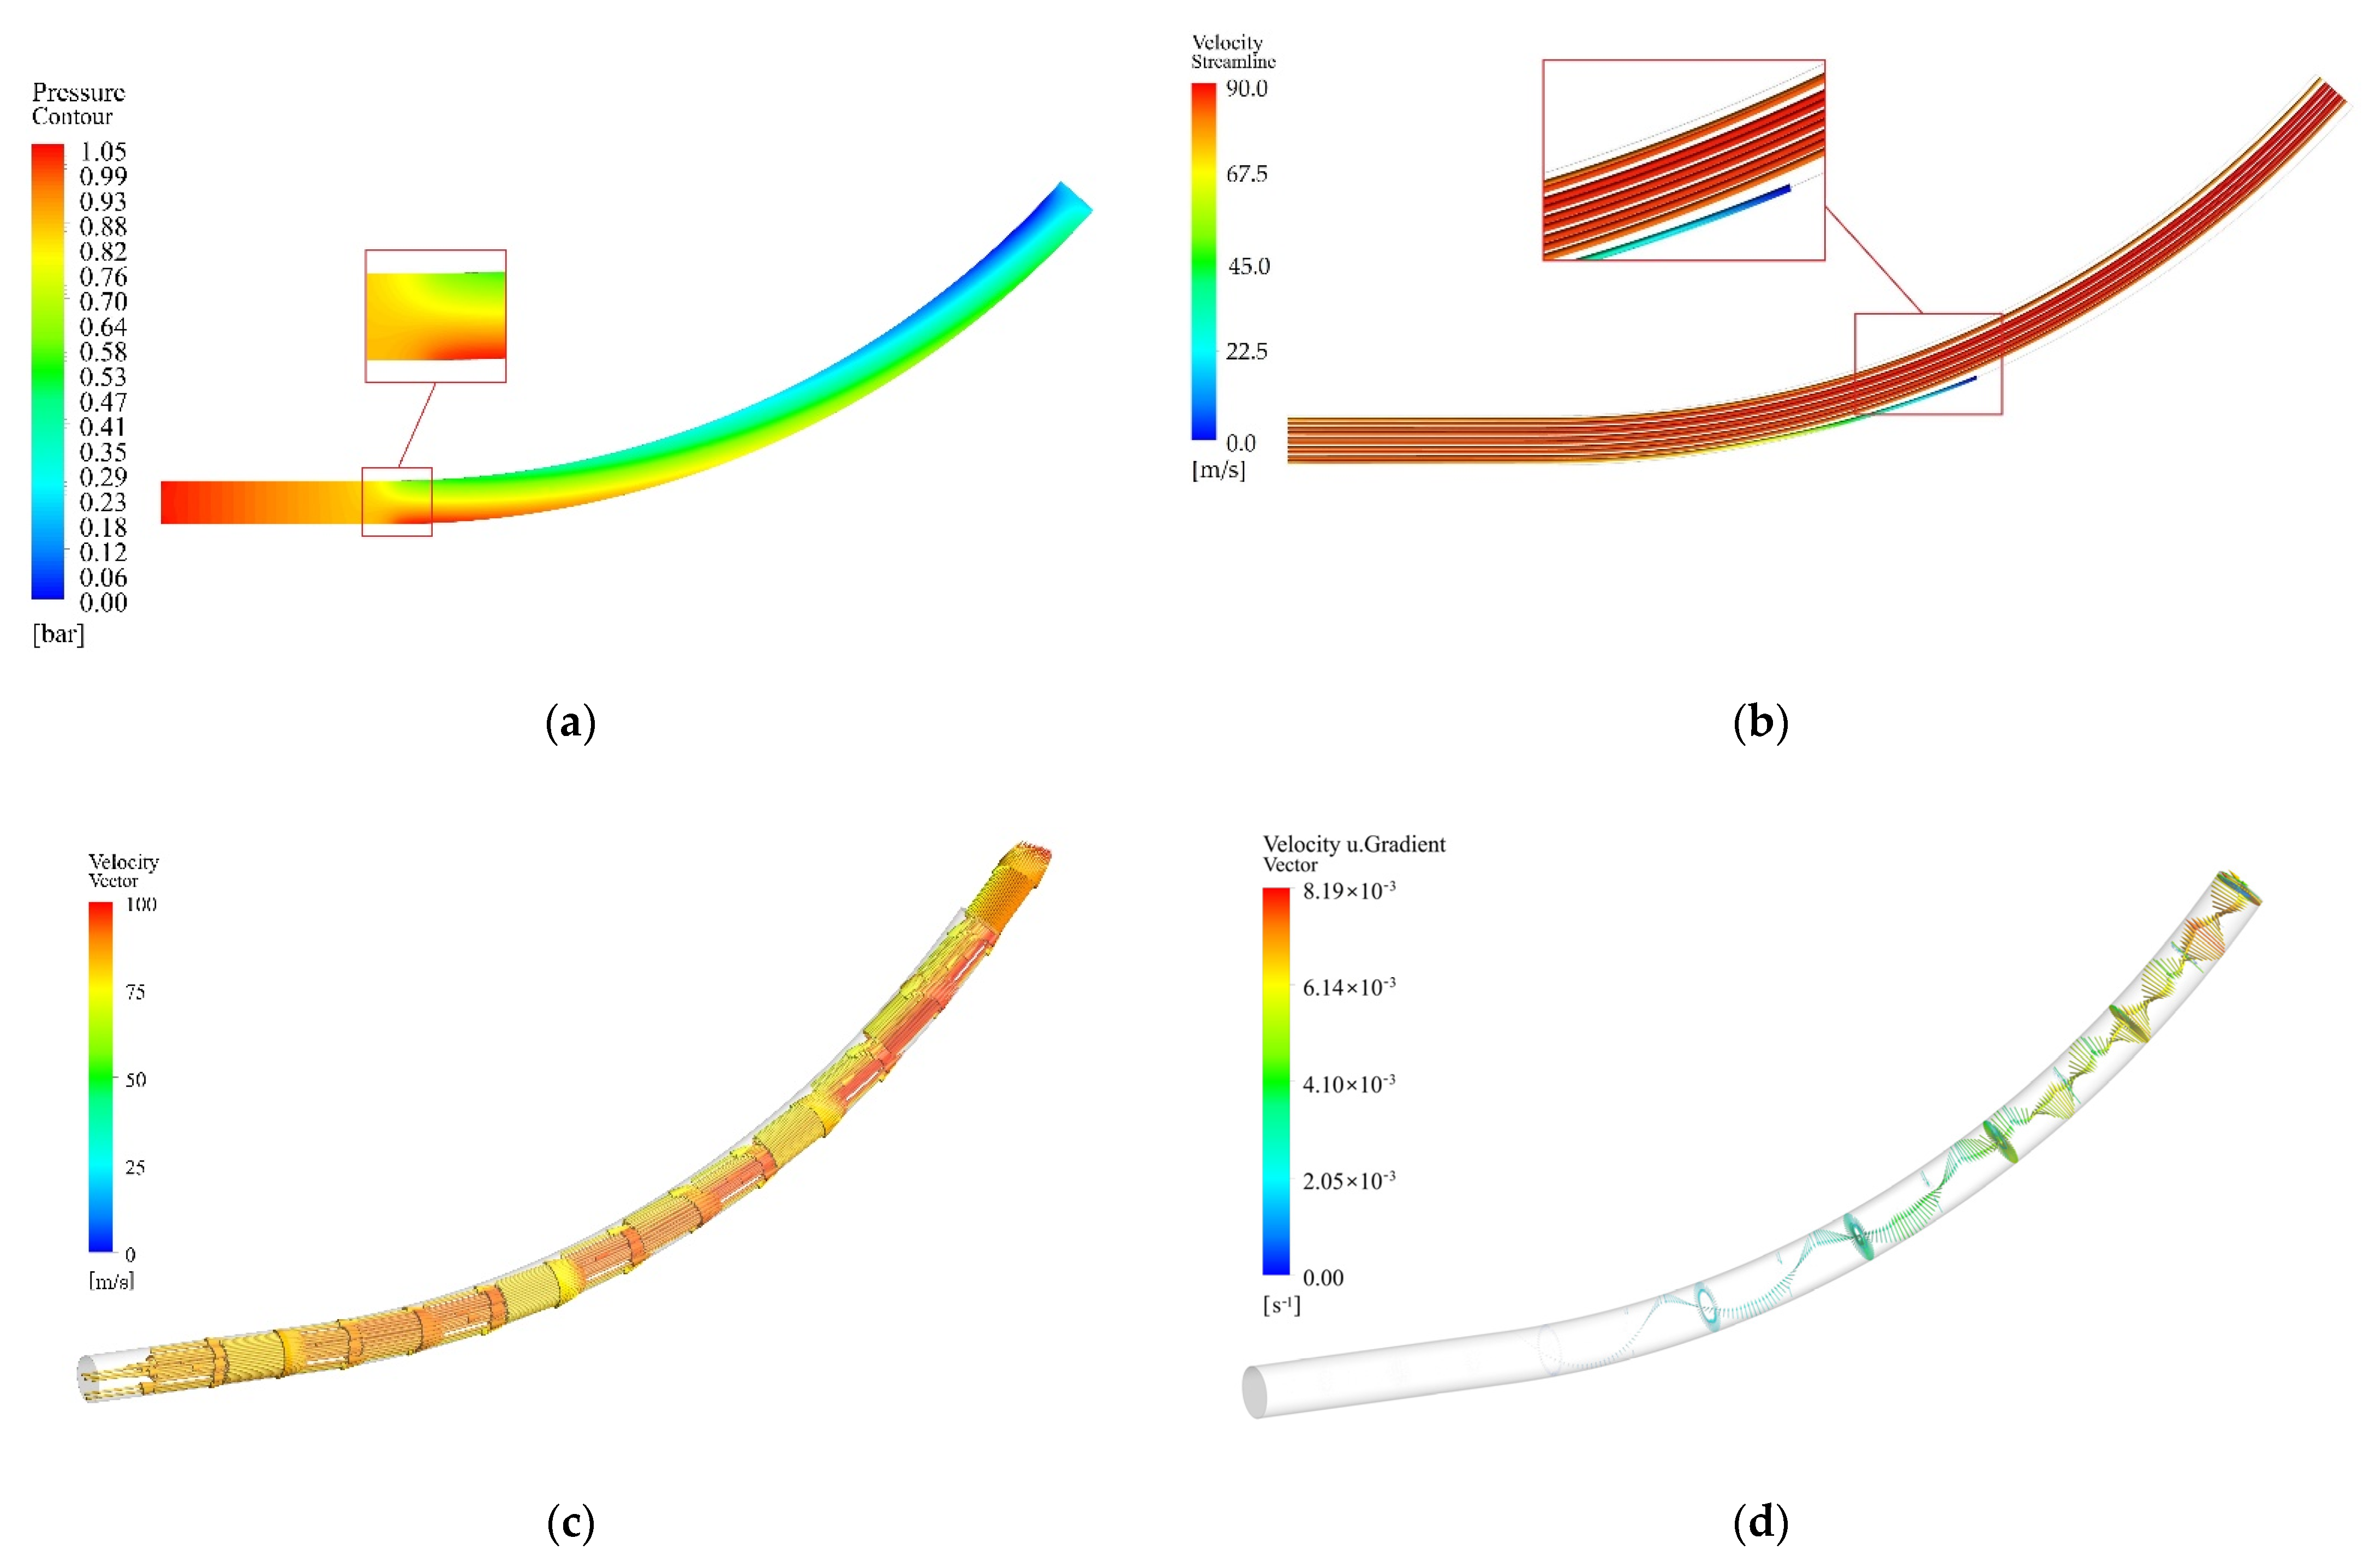
Figure 8 shows the pressure contour (a), streamline (b), velocity vector (c), and velocity u gradient (d) results of the 1D–3D approach numerical analysis for the exhaust system with a bent pipe shape. In the straight part, the pressure contour at the top and bottom of the pipe appeared even, but in the bent part a difference appeared in that the outer side was high. As the gas passed through the bent pipe, the streamline result showed a section where the flow was stagnant, and the velocity vector was different in the top and bottom walls of the bent part of the pipe. The velocity gradient results are used to analyze the velocity distribution in the pressurized pipe [26], and in this study the result of the gradient for the velocity u, which was the direction of the gas flow exiting the exhaust port, was used to analyze the reflected wave continuously generated through the near wall. The reflected wave generated from the near wall at the beginning of the bent part increased in frequency of occurrence toward the open-end boundary of the bent pipe. Figure 9 shows the pressure contour (a), streamline (b), velocity vector (c), and velocity u gradient (d) results of the 1D–3D approach numerical analysis in the structure consisting of tapered pipes modeling the expansion duct of SCR applied to the exhaust system. If the back pressure was formed due to the SCR installed in the diesel engine and the exhaust gas cannot escape smoothly, the engine performance was adversely affected. The pressure contour showed that the pressure inside the expansion duct was higher than the pressure of the exhaust pipe. In this case, back pressure is formed in the exhaust gas of the diesel engine. The capacity of the SCR installed in a diesel engine is determined by the engine specifications, and it is advantageous to have a low differential pressure between the expansion duct of the SCR and the exhaust pipe [27]. The velocity vector inside the expansion duct was lower than that of the exhaust pipe, and as a result of the velocity u gradient, the reflected wave generated from the near wall of the narrowing part of the tapered pipe continued to affect the exhaust pipe after the expansion duct to the open-end boundary. One-dimensional–three-dimensional approach numerical analysis was expected to be used to predict performance for SCR selection.
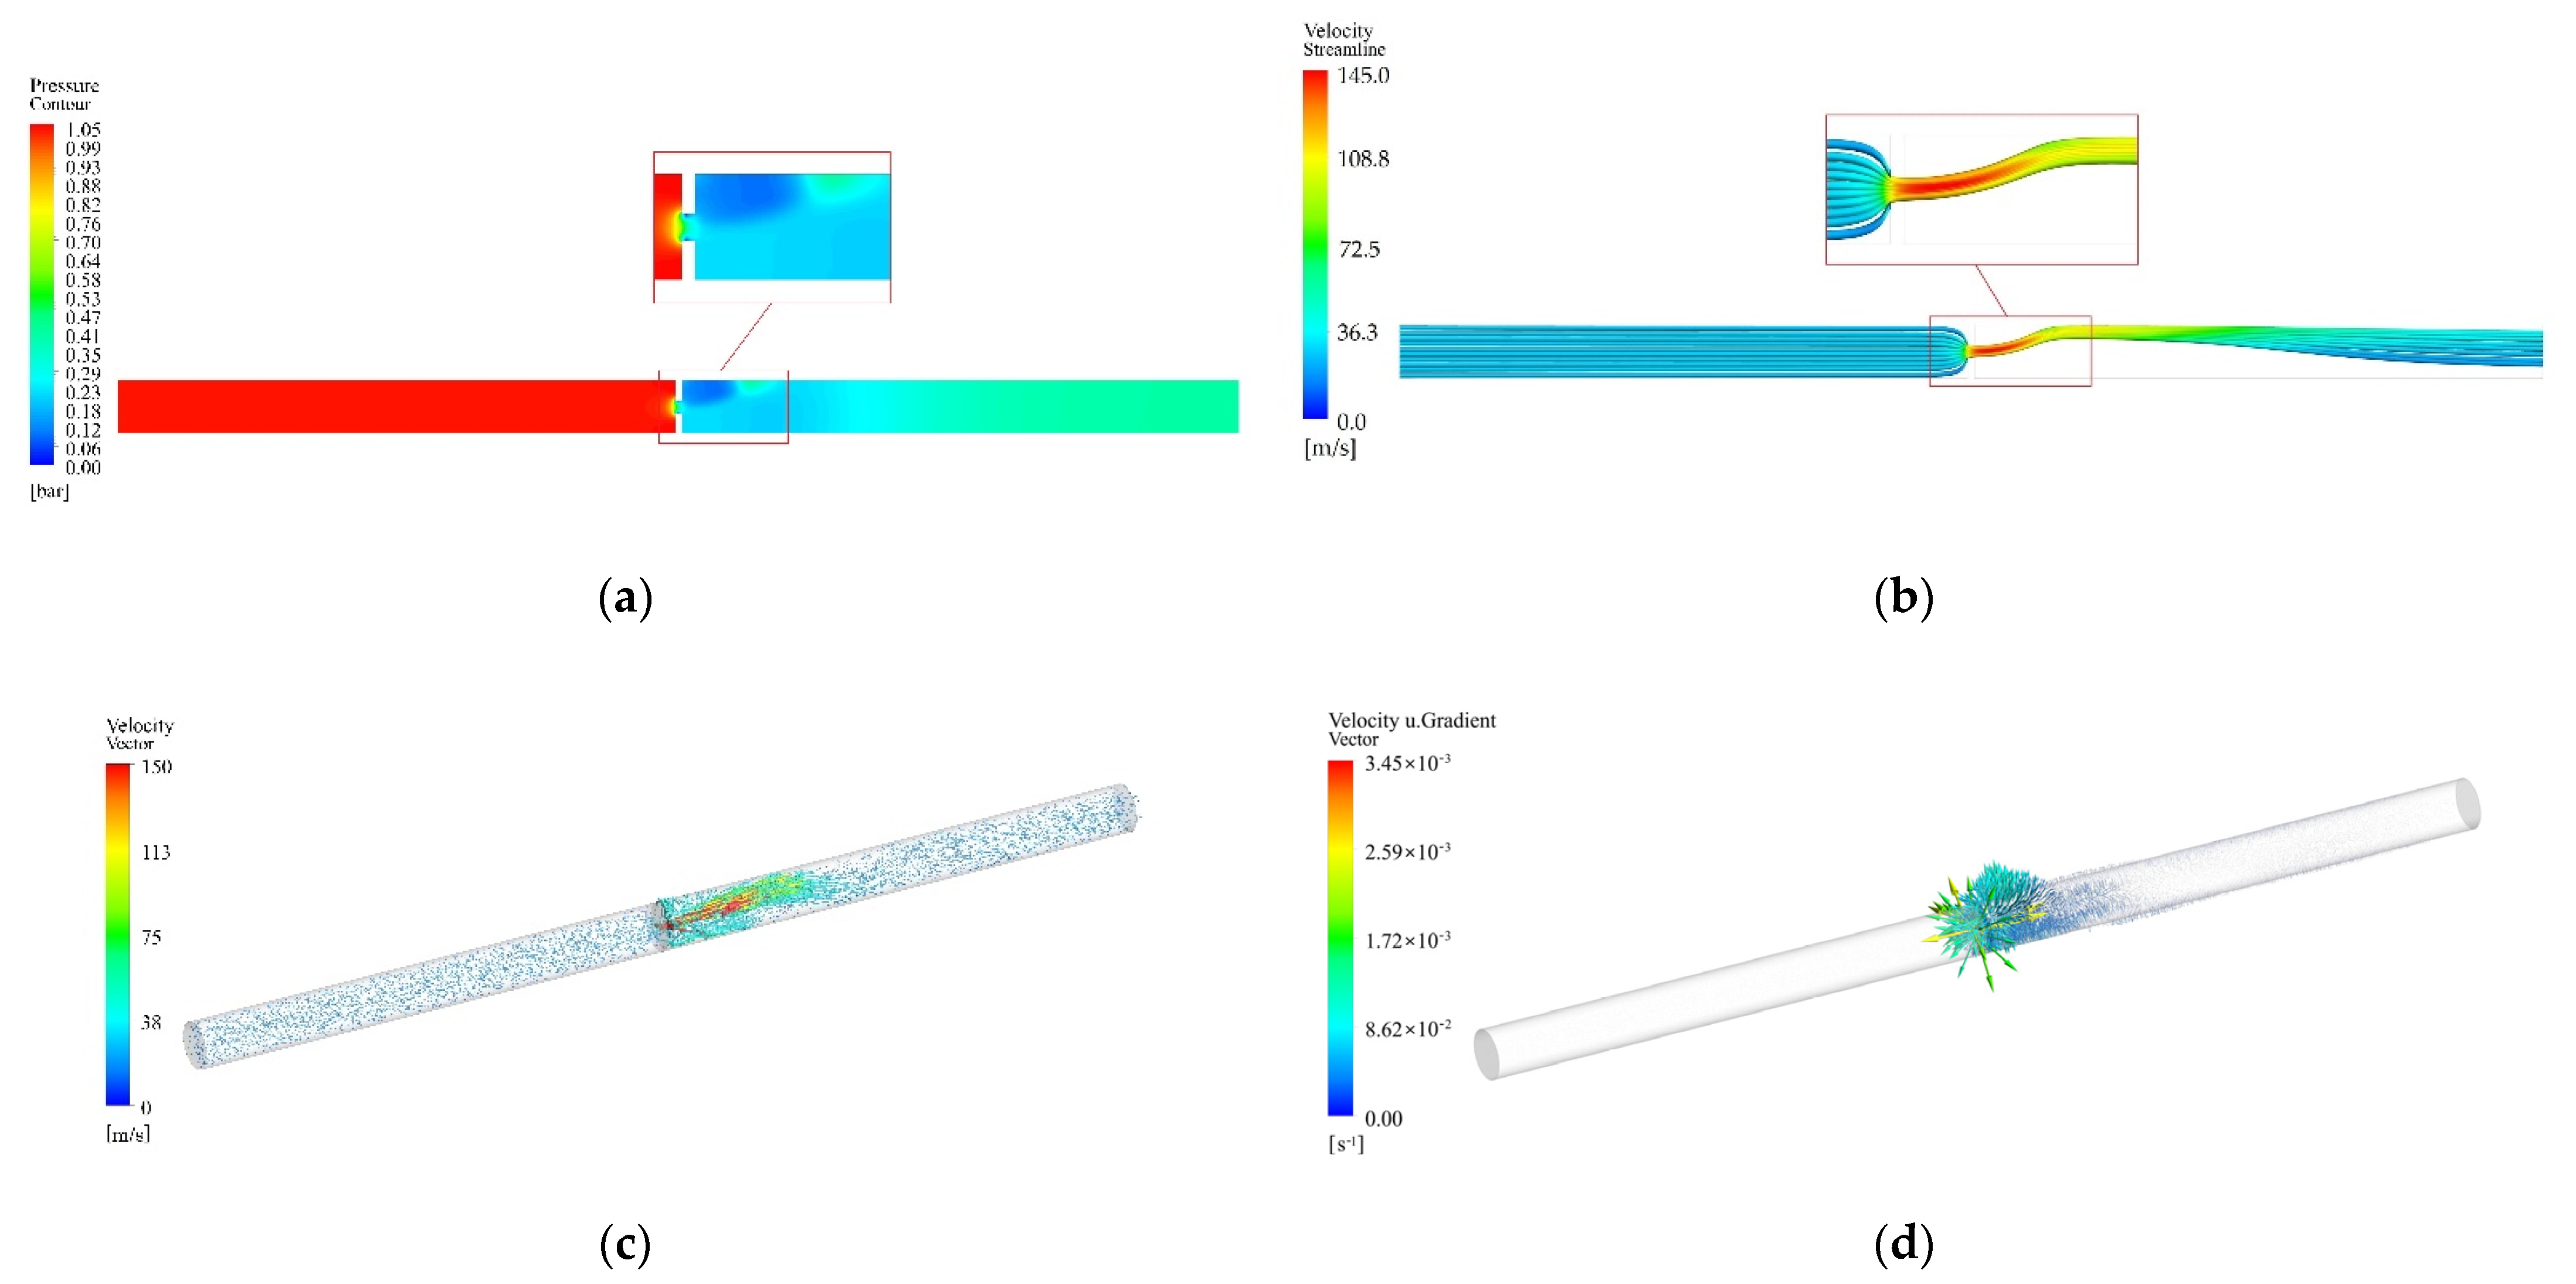
Figure 10 showed the pressure contour (a), streamline (b), velocity vector (c), and velocity u gradient (d) results of the 1D–3D approach numerical analysis of the gas flow passing through the orifice installed in the center of the exhaust pipe. In order to turbocharger match for a diesel engine, it is necessary to calculate the kinetic energy of the exhaust gas acting on the turbine [28], and a method of mimicking the gas flow of a turbocharger using an orifice is currently being used [21]. A low pressure appeared on the upper side of the exhaust pipe after the orifice, and the direction of the streamline was directed upward. The velocity vector increased rapidly as the gas flow passed through the orifice, and as a result of the velocity u gradient, the most reflected wave was generated at the orifice. The cylinder was located below the exhaust pipe, and it was judged that the pressure wave generated from the cylinder has a large effect as it passed through an orifice with a shape that was suddenly narrowed.

3.3. Computation Time

The advantage of the 1D–3D approach used in this study was that the computation time could be shortened because it did not use many resources for the calculation of the intake/exhaust gas flow of the diesel engine. Table 3 compares the computation time required for numerical analysis of one cycle of the diesel engine for each model to compare the computation speed of the 1D–3D approach. Although the orifice model had a smaller volume than the straight pipe model, the number of meshes was large because the mesh was densely generated in the orifice area. Appendix A presents the mesh modeling for numerical analyses using the 3D and 1D–3D approaches.
The computation time required for numerical analysis using the 3D approach and the 1D–3D approach for the exhaust system in the shape of a straight pipe was compared. In the 3D approach, the motions of the piston and intake/exhaust valves were modeled with the dynamic mesh. It took 30 min to perform the numerical analysis using the 1D–3D approach on a straight-pipe-shaped exhaust system. However, the 3D approach took about 300 times longer, taking 6 days and 8 h. It was judged that the 3D approach was not suitable for use in analyzing the gas flow of the exhaust system, including the intake/exhaust gas flow.
The computation time required for the 1D–3D approach numerical analysis was proportional to the number of meshes in the 3D zone, and all results of the 1D–3D approach could be calculated within an hour. The 1D–3D approach to analyzing the effect of the gas flow in the SCR and the turbocharger on the diesel engine could be computed at high speed, so it could be used to shorten the development process.

4. Conclusions

The gas flow in the diesel engine was numerically analyzed using the 1D–3D approach developed in the author’s previous research. The flow characteristics according to the shape change of the exhaust system were analyzed, and the results of comparing the computation time were summarized as follows.
(1)
To validate the results of the numerical analysis using the 1D–3D approach, the pressures of the cylinder and exhaust pipe measured in the experiment were compared. The error of the cylinder pressure was less than 1.8% and the average error of the exhaust pipe pressure was 2.8%, and accurate results were obtained.
(2)
The shape for analyzing the gas flow of the exhaust system to which an SCR and turbocharger were applied was modeled and numerically analyzed, and the flow characteristics could be confirmed through the pressure contour, streamline, and velocity results.
(3)
The 1D–3D approach was able to be computed about 300 times faster than the 3D approach. In addition, numerical analysis according to the shape change of the exhaust system could be quickly computed within 1 h using the 1D–3D approach.
The 1D–3D approach was suitable for analyzing the unsteady gas flow of the diesel engine, and it was expected that it could be used for research on devices installed in the exhaust system. In addition, it was considered to be a fast numerical analysis method that could be used to analyze the effects of the SCR and the turbocharger on the diesel engine. Numerical analysis using the 1D–3D approach for the diesel engine and its components was expected to be utilized to shorten the development processes.

Funding

This research received no external funding.

Institutional Review Board Statement

Not applicable.

Informed Consent Statement

Not applicable.

Data Availability Statement

Not applicable.

Conflicts of Interest

The author declares no conflict of interest.

Appendix A

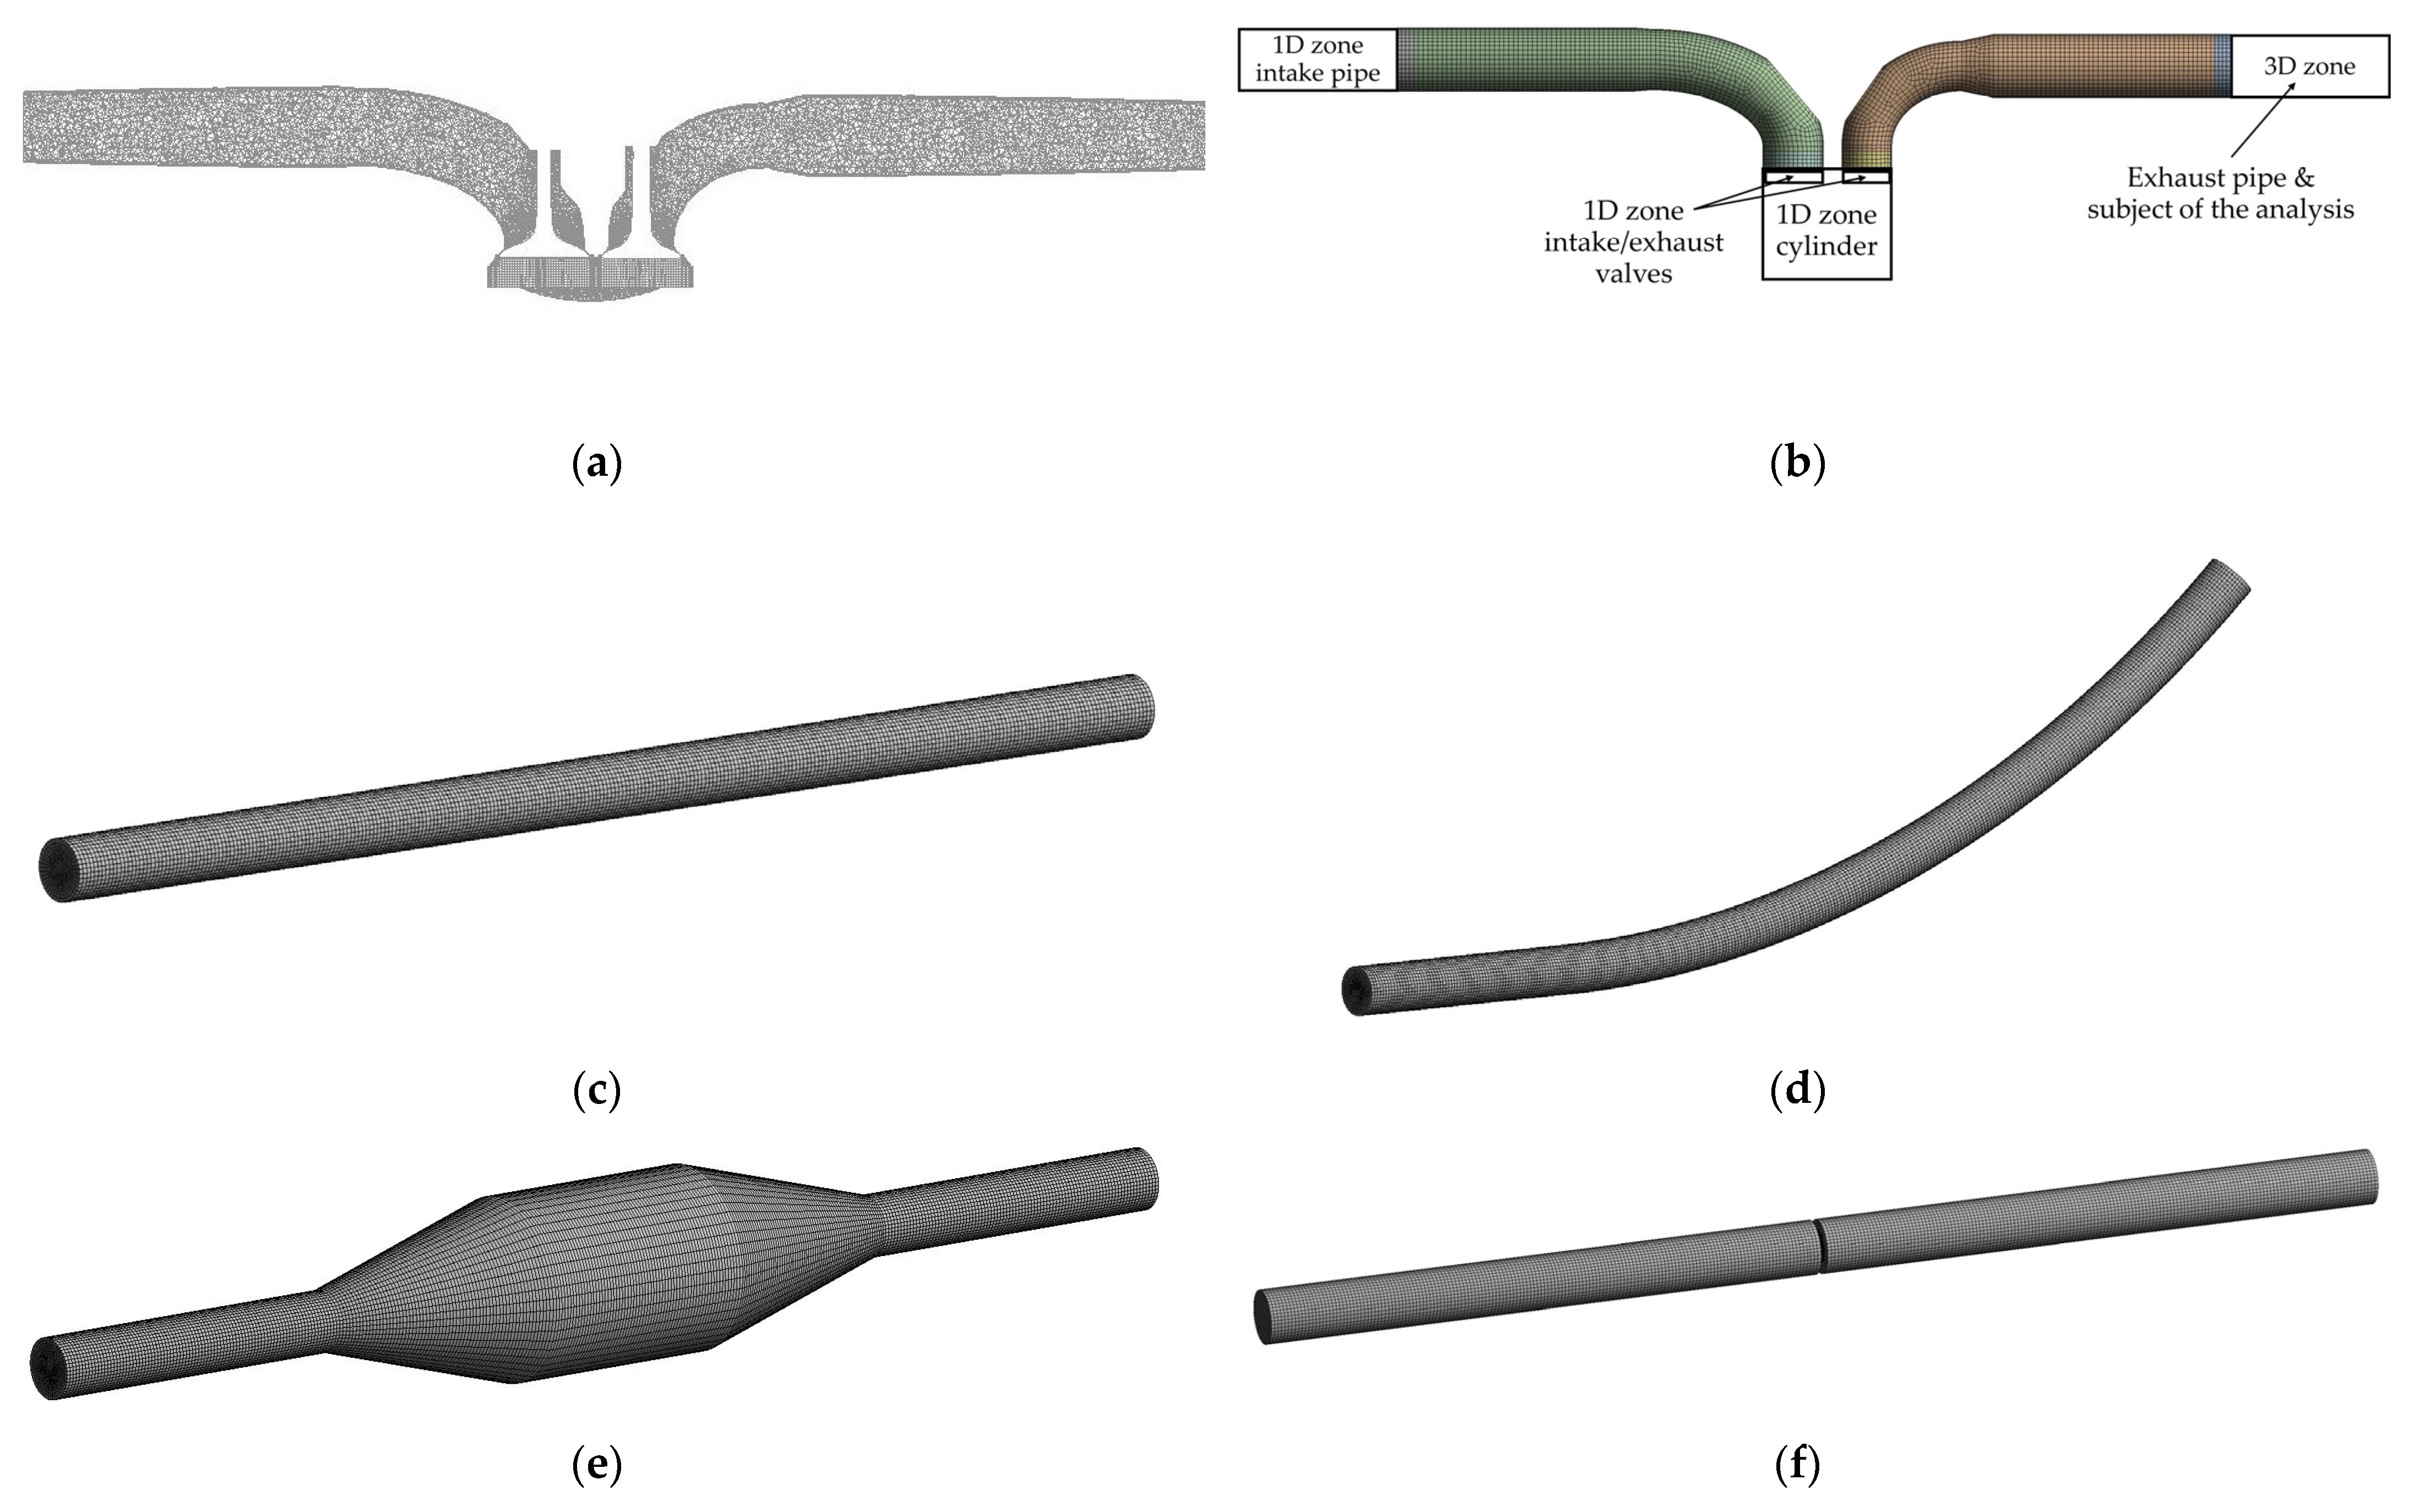
In the following, the mesh modeling for numerical analyses using the 3D and 1D–3D approaches are presented. Figure A1 shows the mesh modeling, and the size of the mesh was determined by the mesh independence study performed as the result of numerical analysis in the steady state. In the 3D approach mesh modeling (a), since the intake/exhaust pipes were long (0.5 m and 1.0 m, respectively), the number of meshes was reduced by increasing the size of the mesh in these parts, and about 1.1 million meshes were generated in which case the position of the piston was at TDC. In the 1D–3D approach, the mesh of the intake/exhaust port (b), which was the 3D zone, was generated in a hexahedral shape to increase the quality, and the interior face was created for using the 1D–3D coupling algorithm. In addition, the mesh of the straight pipe (c), bent pipe (d), tapered pipe (e), and orifice installed in the center of the pipe (f) after the exhaust port were generated in a hexahedral shape.
Figure A1. The mesh modeling for numerical analysis using 3D and 1D–3D approach: (a) 3D approach; (b) intake/exhaust port of the 1D–3D approach; (c) straight pipe; (d) bent pipe; (e) tapered pipe; (f) an orifice installed in the center of the pipe.
Machines 09 00239 g0a1

References

  1. International Maritime Organization (IMO). Guidelines Addressing Additional Aspects of the NOx Technical Code 2008 with Regard to Particular Requirements Related to Marine Diesel Engines Fitted with Selective Catalytic Reduction (SCR) Systems. In Marpol Annex 13 Resolution; MEPC: London, UK, 2017; Volume 291, p. 71. [Google Scholar]
  2. Guidance on the Application of Regulation 13 of MARPOL Annex VI Tier III Requirements to Dual Fuel and Gas-Fuelled Engines. Available online: https://wwwcdn.imo.org/localresources/en/OurWork/Environment/Documents/MEPC%201-Circ%20854.pdf (accessed on 15 September 2021).
  3. Mehdi, G.; Zhou, S.; Zhu, Y.; Shah, A.; Chand, K. Numerical Investigation of SCR Mixer Design Optimization for Improved Performance. Processes 2019, 7, 168. [Google Scholar] [CrossRef] [Green Version]
  4. Zeng, H.; Yuan, J.; Wang, J. Optimal Design of a Tower Type SCR-DeNOx Facility for a 1000 MW Coal-Fired Power Plant Based on CFD Simulation and FMT Validation. Appl. Sci. 2019, 9, 1012. [Google Scholar] [CrossRef] [Green Version]
  5. 2019 Guidelines for Port State Control under MARPOL Annex VI Chapter 3. Available online: https://wwwcdn.imo.org/localresources/en/OurWork/Environment/Documents/MEPC.321(74).pdf (accessed on 15 September 2021).
  6. Lebedevas, S.; Norkevičius, L.; Zhou, P. Investigation of Effect on Environmental Performance of Using LNG as Fuel for Engines in Seaport Tugboats. JMSE 2021, 9, 123. [Google Scholar] [CrossRef]
  7. Kornfeld, M.; Lindner-Silwester, T.; Hummel, E.; Streibl, B. Numerical Modelling of Explosion Protection. MTZ Ind. 2014, 4, 30–37. [Google Scholar] [CrossRef]
  8. Liu, R.; Zhang, Z.; Dong, S.; Zhou, G. High-Altitude Matching Characteristic of Regulated Two-Stage Turbocharger with Diesel Engine. J. Eng. Gas Turbines Power 2017, 139, 094501. [Google Scholar] [CrossRef]
  9. Kozak, D.; Mazuro, P.; Teodorczyk, A. Numerical Simulation of Two-Stage Variable Geometry Turbine. Energies 2021, 14, 5349. [Google Scholar] [CrossRef]
  10. Meloni, R. Pollutant Emission Validation of a Heavy-Duty Gas Turbine Burner by CFD Modeling. Machines 2013, 1, 81–97. [Google Scholar] [CrossRef] [Green Version]
  11. Cruz-Manzo, S.; Krishnababu, S.; Panov, V.; Bingham, C. Inter-Stage Dynamic Performance of an Axial Compressor of a Twin-Shaft Industrial Gas Turbine. Machines 2020, 8, 83. [Google Scholar] [CrossRef]
  12. De Robbio, R.; Cameretti, M.C.; Mancaruso, E.; Tuccillo, R.; Vaglieco, B.M. CFD Study and Experimental Validation of a Dual Fuel Engine: Effect of Engine Speed. Energies 2021, 14, 4307. [Google Scholar] [CrossRef]
  13. Benson, R.S.; Horlock, J.H.; Winterbone, D.E. The Thermodynamics and Gas Dynamics of Internal-Combustion Engines; Oxford University Press: Oxford, UK, 1982; Volume 1. [Google Scholar]
  14. Kim, K.-H.; Kong, K.-J. One-Dimensional Gas Flow Analysis of the Intake and Exhaust System of a Single Cylinder Diesel Engine. JMSE 2020, 8, 1036. [Google Scholar] [CrossRef]
  15. He, S.; Du, B.-G.; Feng, L.-Y.; Fu, Y.; Cui, J.-C.; Long, W.-Q. A Numerical Study on Combustion and Emission Characteristics of a Medium-Speed Diesel Engine Using In-Cylinder Cleaning Technologies. Energies 2015, 8, 4118–4137. [Google Scholar] [CrossRef] [Green Version]
  16. Millo, F.; Piano, A.; Peiretti Paradisi, B.; Marzano, M.R.; Bianco, A.; Pesce, F.C. Development and Assessment of an Integrated 1D–3D CFD Codes Coupling Methodology for Diesel Engine Combustion Simulation and Optimization. Energies 2020, 13, 1612. [Google Scholar] [CrossRef] [Green Version]
  17. Kim, K.-H.; Kong, K.-J. 1D–3D Coupling for Gas Flow Analysis of the Air-Intake System in a Compression Ignition Engine. JMSE 2021, 9, 553. [Google Scholar] [CrossRef]
  18. Kong, K.-J.; Jung, S.-H.; Jeong, T.-Y.; Koh, D.-K. 1D–3D Coupling Algorithm for Unsteady Gas Flow Analysis in Pipe Systems. J. Mech. Sci. Technol. 2019, 33, 4521–4528. [Google Scholar] [CrossRef]
  19. Kong, K.-J.; Jung, S.-H.; Lee, S.-D.; Koh, D.-K. A numerical analysis of the delivery pressure wave in a 210-kW/cyl fuel injection pump for medium-speed diesel engines. J. Korean Soc. Mar. Eng. 2016, 40, 295–300. [Google Scholar] [CrossRef]
  20. Zhao, C.; Lou, D.; Zhang, Y.; Lu, K.; Liu, S. Application Study on a New Hybrid Canning Structure of After-Treatment System for Diesel Engine. Energies 2020, 13, 734. [Google Scholar] [CrossRef] [Green Version]
  21. Zhao, B.; Zhao, Q.; Zhao, W.; Xiang, X.; Zhou, X. Numerical and Experimental Investigation of Turbocharger Compressor Low-end Performance Improvement Using a Variable Geometry Inlet Orifice. Int. J. Engine Res. 2020, 22, 146808742095109. [Google Scholar] [CrossRef]
  22. Cordiner, S.; Gambino, M.; Iannaccone, S.; Rocco, V.; Scarcelli, R. Numerical and Experimental Analysis of Combustion and Exhaust Emissions in a Dual-Fuel Diesel/Natural Gas Engine. Energy Fuels 2008, 22, 1418–1424. [Google Scholar] [CrossRef]
  23. Heisler, H. Advanced Engine Technology; Butterworth-Heinemann: Oxford, UK, 1995; pp. 274–275. [Google Scholar]
  24. Adams, T.-G. Effect of Exhaust System Design on Engine Performance; SAE Technical Paper 800319; SAE: Warrendale, PA, USA, 1980. [Google Scholar] [CrossRef]
  25. Liu, S.; Xu, J.; Gong, H.; Yu, K. Assessment of Streamline-Based Pressure Reconstruction for PIV Data in Supersonic Flows with Shock Waves. Exp Fluids 2020, 61, 161. [Google Scholar] [CrossRef]
  26. Martins, N.M.C.; Carriço, N.J.G.; Ramos, H.M.; Covas, D.I.C. Velocity-Distribution in Pressurized Pipe Flow Using CFD: Accuracy and Mesh Analysis. Comput. Fluids 2014, 105, 218–230. [Google Scholar] [CrossRef]
  27. Gao, Y.; Liu, Q.; Bian, L. Numerical Simulation and Optimization of Flow Field in the SCR Denitrification System on a 600 MW Capacity Units. Energy Procedia 2012, 14, 370–375. [Google Scholar] [CrossRef] [Green Version]
  28. Shingne, P.; Assanis, D.-N.; Babajimopoulos, A.; Keller, P.; Roth, D.; Becker, M. Turbocharger Matching for a 4-Cylinder Gasoline HCCI Engine Using a 1D Engine Simulation; SAE Technical Paper 2010-01-2143; SAE: Warrendale, PA, USA, 2010. [Google Scholar] [CrossRef]
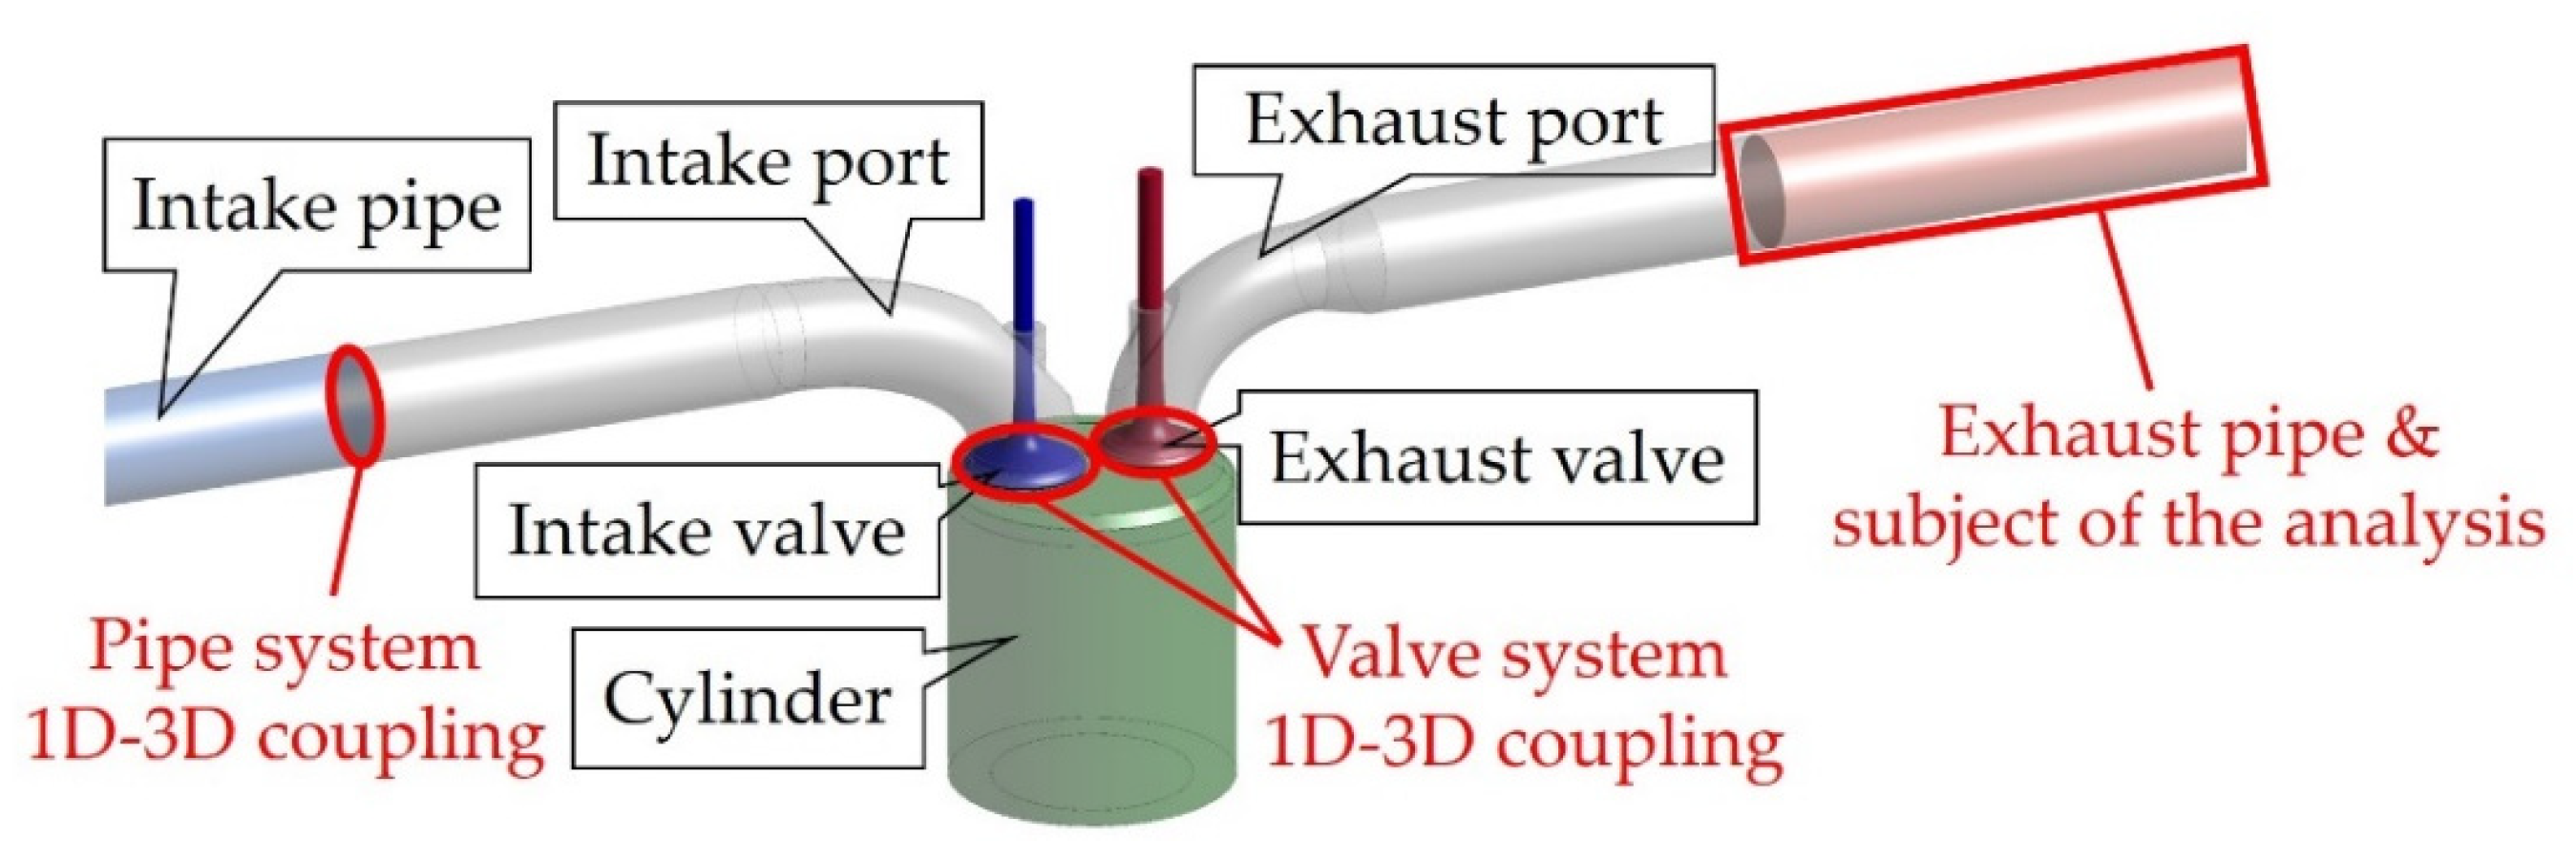
Figure 1. Modeling for numerical analysis of the gas flow in a diesel engine using the 1D–3D approach.
Machines 09 00239 g001
Figure 2. The pressure results of numerical analysis using the 1D–3D approach for the entire intake/exhaust system: (a) when the exhaust valve was fully opened (254 CA°); (b) when the intake valve was fully opened (461 CA°).
Machines 09 00239 g002
Figure 3. Four shapes of the subject of analysis: (a) straight pipe, same shape as the experiment; (b) bent pipe; (c) tapered pipe, shape of the expansion duct of SCR; and (d) an orifice installed in the center of the pipe.
Machines 09 00239 g003
Figure 4. Configuration of the experimental device for validation.
Machines 09 00239 g004
Figure 5. Cylinder pressure results of the experiment and the 1D–3D approach numerical analysis according to the engine speed.
Machines 09 00239 g005
Figure 6. Exhaust pipe pressure of the experiment and the 1D–3D approach numerical analysis.
Machines 09 00239 g006
Figure 7. Flow characteristics results of the 1D–3D approach numerical analysis in the straight pipe shape exhaust system: (a) pressure contour; (b) velocity vector.
Machines 09 00239 g007
Figure 8. Flow characteristics results of the 1D–3D approach numerical analysis for the exhaust system with a bent pipe shape: (a) pressure contour; (b) streamline; (c) velocity vector; and (d) velocity u gradient.
Machines 09 00239 g008
Figure 9. Flow characteristics results of the 1D–3D approach numerical analysis for the tapered pipe shape (expansion duct of SCR): (a) pressure contour; (b) streamline; (c) velocity vector; and (d) velocity u gradient.
Machines 09 00239 g009aMachines 09 00239 g009b
Figure 10. Flow characteristics results of the 1D–3D approach numerical analysis of the exhaust pipe with an orifice installed in the center: (a) pressure contour; (b) streamline; (c) velocity vector; and (d) velocity u gradient.
Machines 09 00239 g010
Table 1. Time step size and the number of time steps according to the gas velocity.
Gas VelocityTime Step Size of the 3D ZoneNumber of Time Steps in the 3D/One Time Step in the 1D
| u | a v e r a g e = 50   m / s 0.0060554 msec4
| u | m a x i m u m = 242   m / s 0.0012512 msec16
| u | = 70   m / s 0.0043253 msec5
Table 2. Maximum cylinder pressure results of the experiment and the 1D–3D approach numerical analysis.
Engine Speed (RPM)Maximum Cylinder Pressure (Bar)Error (%)
Experimental1D–3D Approach
70036.3936.741.0
90038.0038.631.7
110038.3539.041.8
130038.8739.421.4
150039.1639.781.6
Table 3. Comparison of the number of meshes and computation time according to the approach and the shape of the exhaust system.
ApproachShape of the
Exhaust System
Number of MeshesComputation Time
1D3D
3DStraight pipe01,144,0776 days 8 h
1D–3DStraight pipe3895,43730 min
1D–3DBent pipe38103,46533 min
1D–3DTapered (SCR)38162,18155 min
1D–3DOrifice38122,04645 min
Publisher’s Note: MDPI stays neutral with regard to jurisdictional claims in published maps and institutional affiliations.