Abstract
Most industrial parts are instantiated from different parametric templates. The 6DoF (6D) pose estimation tasks are challenging, since some part objects from a known template may be unseen before. This paper releases a new and well-annotated 6D pose estimation dataset for multiple parametric templates in stacked scenarios donated as Multi-Parametric Dataset, where a training set (50K scenes) and a test set (2K scenes) are obtained by automatical labeling techniques. In particular, the test set is further divided into a TEST-L dataset for learning evaluation and a TEST-G dataset for generalization evaluation. Since the part objects from the same template are regarded as a class in the Multi-Parametric Dataset and the number of part objects is infinite, we propose a new 6D pose estimation network as our baseline method, Multi-templates Parametric Pose Network (MPP-Net), aiming to have sufficient generalization ability for parametric part objects in stacked scenarios. To our best knowledge, our dataset and method are the first to jointly achieve 6D pose estimation and parameter values prediction for multiple parametric templates. Many experiments are conducted on the Multi-Parametric Dataset. The mIoU and Overall Accuracy of foreground segmentation and template segmentation on the two test datasets exceed 99.0%. Besides, MPP-Net achieves 92.9% and 90.8% on mAP under the threshold of 0.5cm for translation prediction, achieves 41.9% and 36.8% under the threshold of for rotation prediction, and achieves 51.0% and 6.0% under the threshold of 5% for parameter values prediction, on the two test set, respectively. The results have shown that our dataset has exploratory value for 6D pose estimation and parameter values prediction tasks.
1. Introduction
Parametric techniques have been widely used in the field of industrial design [1]. The assembly of an industrial product usually requires many parametric part objects from different parametric shapes. A parametric shape is a parametric template described by a set of driven parameters, which can be instantiated as many parametric part objects [2,3]. For example, many common industrial products comprise a variety of screw parts and nut parts generated from the screw template and the nut template.
When we disassemble the recyclable part objects from products into the recycling bins, it is common that there is a stacked scene including parametric part objects from multiple templates. Then, the part objects from the same template are sorted into their own bins according to their parameter values. In recent years, robots guided by visual systems are often used to sort the part objects automatically. However, due to the varied templates, the frequent changes of parameter values, heavy occlusion, sensor noise, etc., the accurate 6D pose estimation and parameter values prediction in such stacked scenes are challenging.
Accurate 6D pose estimation, i.e., 3D translation and 3D rotation, is very essential for robotic grasping tasks. Existing 6D pose estimation methods based on deep learning can be roughly classified into instance-level and category-level methods. Some instance-level 6D pose estimation methods [4,5,6,7,8,9,10,11,12] established 2D-3D or 3D-3D correspondence to solve the 6D pose with exact 3D models for each object. However, these methods cannot generalize to the unseen objects from the same category which have no exact 3D models. Category-level 6D pose estimation methods [13,14,15,16,17] regarded the objects from the same category as a class and they had sufficient generalization ability to estimate the unseen objects’ pose. In addition, they also estimated the size of the object, e.g., Refs. [13,14,15] estimated a scale value as the size, which was different from the parameter values in parametric templates. However, since a parametric template is considered as a class in this paper and the parameter values prediction is necessary for the sorting tasks, there are no existing category-level methods to jointly achieve 6D pose estimation and parameter values prediction of part objects from multiple templates in stacked scenarios. Besides, the lack of datasets for such tasks is a barrier for learning-based methods to research further.
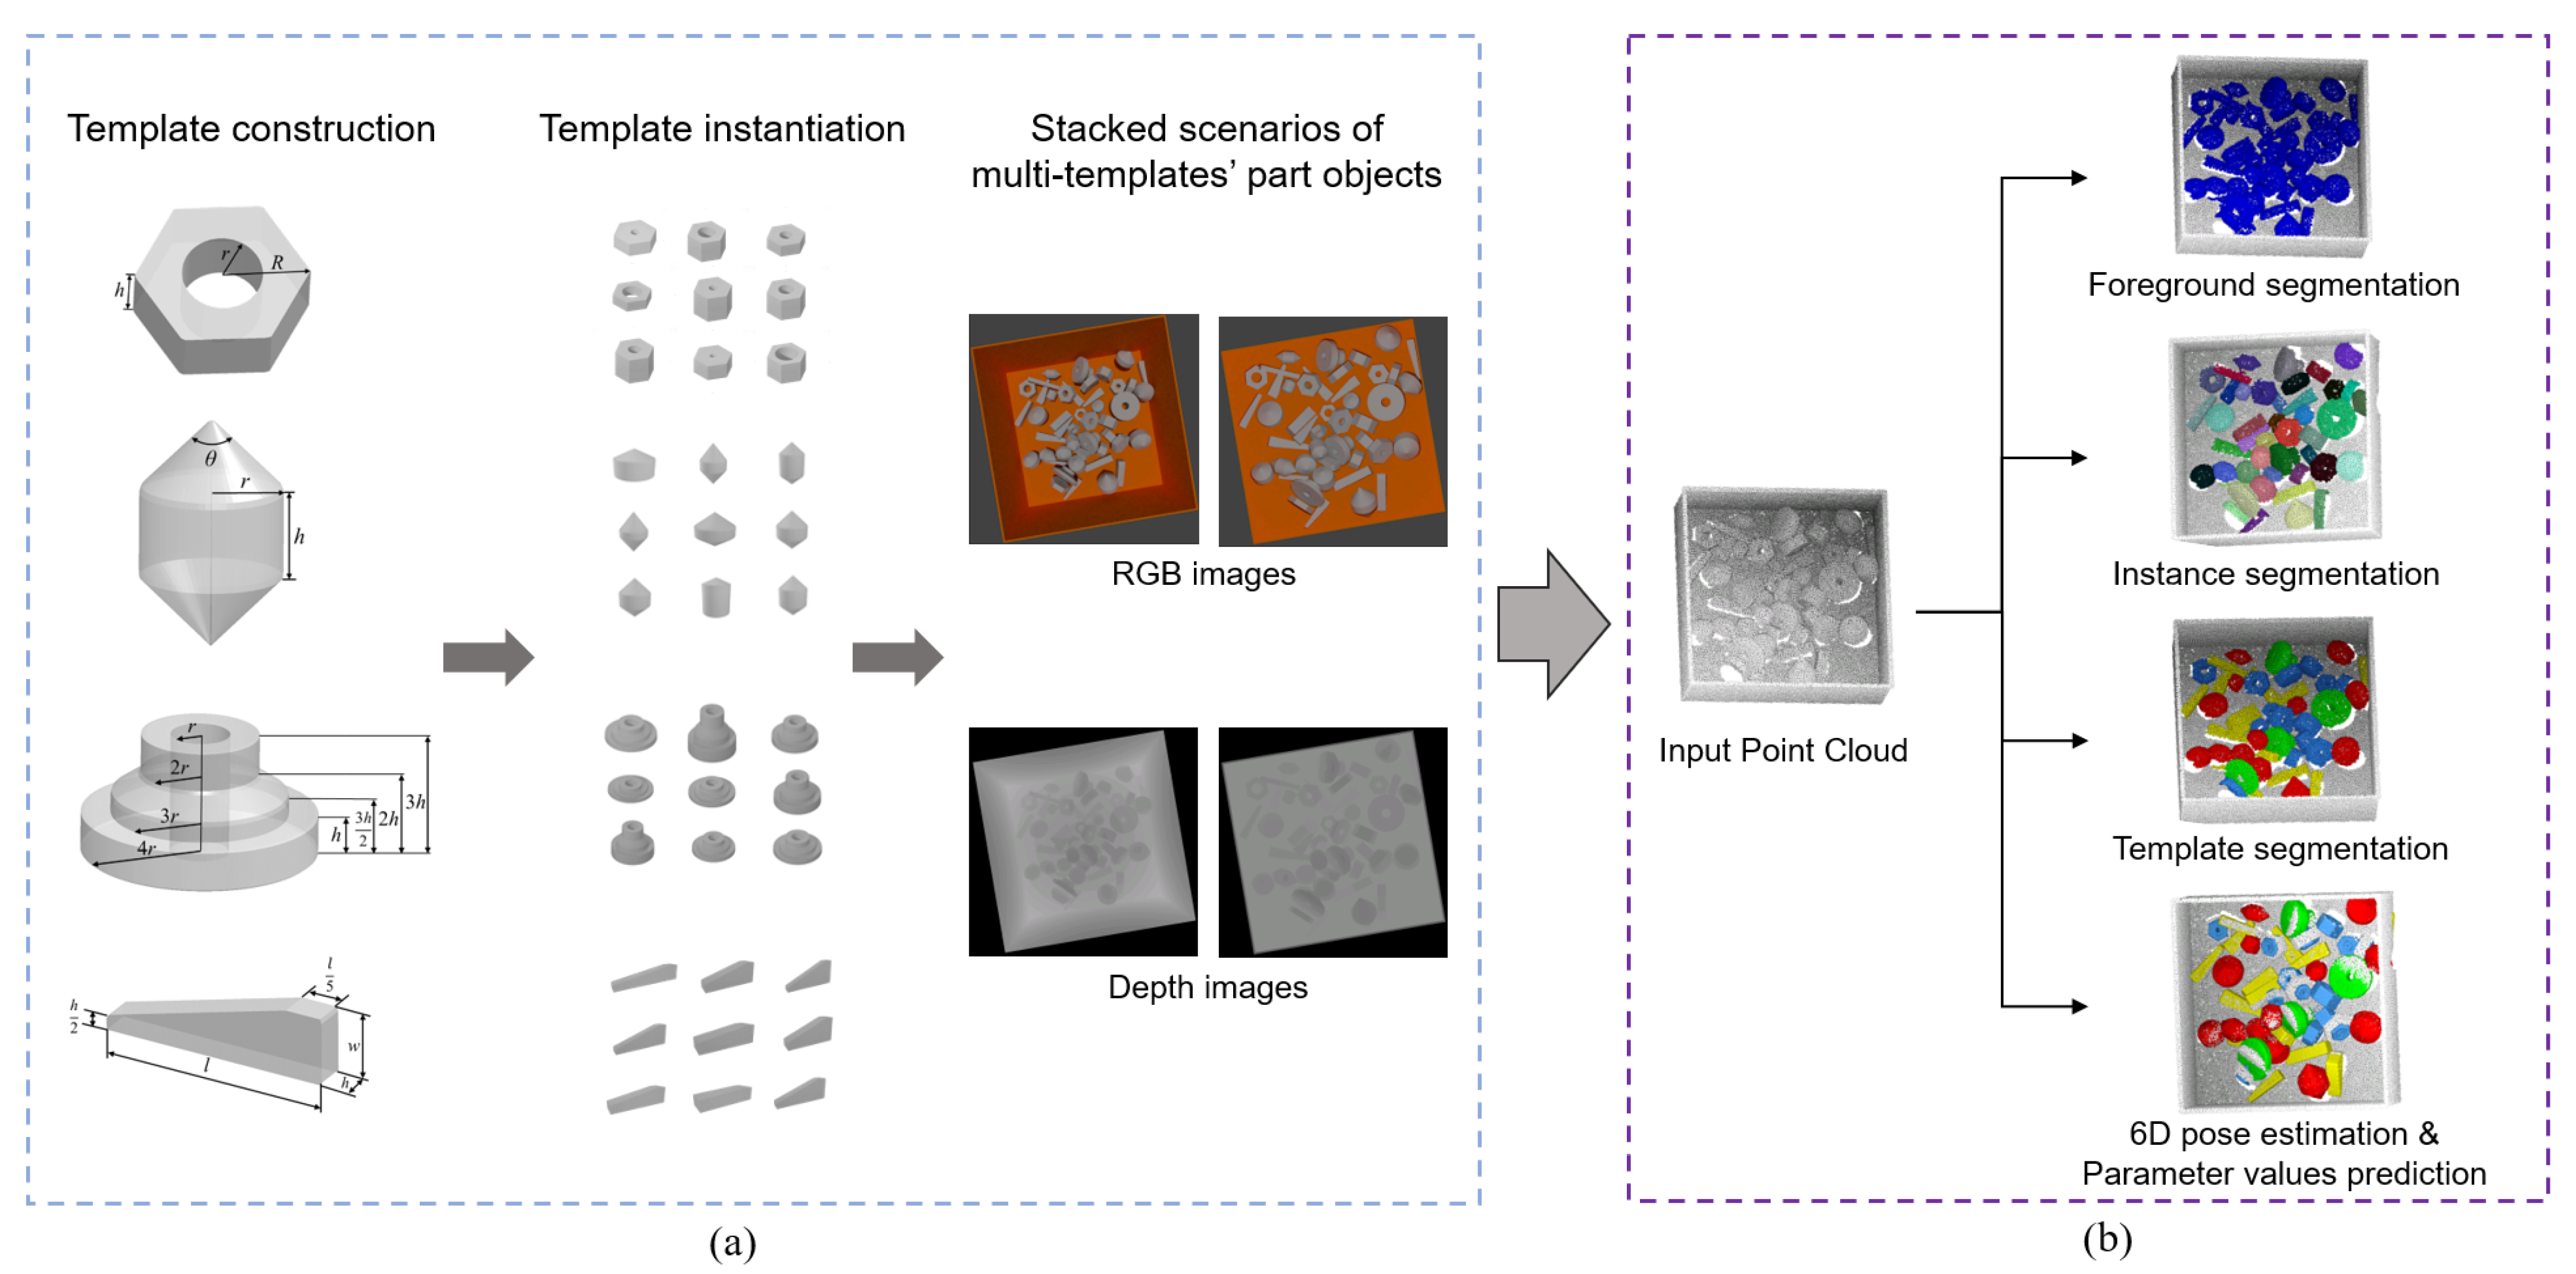
To solve the lack of dataset, we construct a new dataset for stacked scenarios of parametric part objects from multiple templates, donated as Multi-Parametric Dataset. As shown in Figure 1a, we first select four templates from Zeng’s database [1], which well represent the geometric features and rotation types. Then we sample the parameter values to instantiate each template into different part objects, and they are randomly selected to form a stacked scene. Through automatically labeling technique, we generate a large RGB-D dataset (50K training set, 2K test set) with ground truth annotations of each instance in the stacked scenes, including template label, segmentation mask, 6D pose, parameter values, and visibility.

Figure 1.
Pipeline of our dataset and baseline method: (a) Multi-Parametric Dataset, (b) Multi-templates Parametric Pose Network (MPP-Net). The foreground segmentation, instance segmentation and template segmentation shown in figure above are the segmentation results on the raw point cloud. To visualize 6D pose estimation and parameter values prediction, we reconstruct the part objects’ models from the template segmentation results and the parameter values prediction results, and the models are transformed in the scene by the 6D pose estimation results to overlap on the raw point cloud.
To solve the lack of method for stacked scenarios of parametric part objects from multiple templates, we propose a new network with residual modules as our baseline method, Multi-templates Parametric Pose Network, donated as MPP-Net. MPP-Net can jointly achieve foreground segmentation, instance segmentation, template segmentation, 6D pose estimation and parameter values prediction. As shown in Figure 1b, MPP-Net takes unordered point cloud as the input, and first predicts the foreground points in the scene. Then, similar to [3,18,19], we predict point-wise template, parameter values and 6D pose. To improve the accuracy of our method, we also design the residual modules for the prediction of translation, rotation and parameter values. In our experiments, MPP-Net is evaluated on our Multi-Parametric Dataset for the learning and generalization abilities evaluation, respectively.
To the best of our knowledge, compared with existing datasets and methods for 6D pose estimation, we propose the first public RGB-D dataset and the first deep learning network to jointly achieve 6D pose estimation and parameter values prediction. Besides, we set the evaluation metrics and provide the benchmark results for our dataset.
In summary, the main contributions of our work are:
- We construct a new dataset with evaluation metrics for stacked scenarios of parametric part objects from multiple templates.
- We propose a new network to provide benchmark results, which jointly achieves foreground segmentation, instance segmentation, template segmentation, 6D pose estimation and parameter values prediction.
2. Related Works
2.1. Dataset
Recent 6D pose estimation methods based on deep learning become a trend and have shown remarkable performance. Dataset is one of the key factors that determines the performance of deep learning networks. There are many public datasets used for instance-level and category-level 6D pose estimation learning-based methods, as shown in Table 1.

Table 1.
Comparison of public datasets.
Instance-level tasks usually treat each object as a class and they need an exact 3D model for each object. The LINEMOD dataset [20] is designed for the household cluttered scenarios, providing about 18,000 RGB-D images with manual annotations, and it contained 15 texture-less objects. Tejani et al. [21] proposed a dataset (IC-MI dataset) designed for the household cluttered scenarios which contain two textureless and four textured objects with 5000 RGB-D images. The Rutgers APC dataset [22] contains 24 textured objects from the Amazon Picking Challenge 2015 [23] with 10,000 RGB-D images, which is designed for household cluttered scenarios. The YCB-Video dataset [24] is also constructed for the household cluttered scenarios, which provides 133,827 frames observed in 92 videos with manual annotations by using an RGB-D camera. The dataset contains 21 daily life objects with varying textures and shapes chosen from the YCB dataset [25]. The StereOBJ-1M dataset [26] provides 396,000 frames of 18 household objects, which are constructed in 11 different environments to form cluttered scenes. Different from the dataset for the household cluttered scenarios, the dataset for the industrial stacked scenarios has more occlusion and higher pose variability of objects, since the objects are piled into a bin together. The T-LESS dataset [27] is an industrial stacked scenario dataset, which contains 30 textureless industrial objects with strong inter-object similarity and provided 47,762 frames captured by cameras. The Siléane dataset [28] is a typical dataset for the industrial stacked scenarios, including 8 objects and providing 1922 synthetic RGB-D images with noise by using automatic annotating technique and 679 real-world RGB-D images. The Fraunhofer IPA dataset [29] is an extension of the Siléane dataset with extra 2 industrial objects, providing 206,000 synthetic and 520 real-world RGB-D images. These datasets treat an object as a class and the objects in their test set are seen in the training phrase.
Category-level tasks target at generalization for the unseen objects without exact 3D models. There are also many datasets for category-level tasks, which treat the objects from the same category as a class, so their test set with unseen objects focuses on evaluation for the generalization ability. The CAMERA dataset [13] is designed for the household cluttered scenarios, comprising 300,000 real scenes with about 1000 synthetic objects within six daily life categories generated by a new Context-Aware MixEd ReAlity approach. The REAL dataset [13] is also constructed for the household cluttered scenarios, providing 8000 RGB-D frames of 18 real-world scenes, 42 unique objects within 6 daily life categories. For the industrial stacked scenarios, Parametric Dataset [3] is a synthetic dataset consisting of 374,400 depth images, 416 part objects within 4 industrial templates. However, each scene in the Parametric Dataset contains instances of a single part object only and there is a lack of dataset for industrial stacked scenarios of parametric part objects from multiple templates.
2.2. Instance-Level 6D Pose Estimation
Many existing methods are designed for instance-level tasks. Methods [4,5,6,7,8,9] targeted on training their network to learn the 2D–3D correspondence, i.e., the match between the 2D keypoints on RGB image and the 3D keypoints on the 3D model. Then, the object pose was solved by Perspective-n-Point algorithm [30]. However, due to the lack of depth information in RGB images, these methods performance were deteriorated in the stacked scene with heavy occlusion. Recently, He et al. [10,11] and Liu et al. [12] took RGB-D images as the input, predefined the keypoints on the 3D model in different ways and predicted the keypoints of the object in the scene. Then the 6D pose was solved by the least-square fitting algorithm [31] with the 3D-3D correspondence. Although these methods explored the way to fully leverage RGB-D information to achieve a better performance, they cannot be generalized to the category-level unseen objects since the selections of keypoints are based on the known 3D models.
2.3. Category-Level 6D Pose Estimation
Compared with instance-level tasks, category-level tasks are more challenging due to the large number of shape and size variations of objects from the same category. To address the challenges, Wang et al. [13] innovatively proposed a canonical representation, i.e., normalized object coordinate space (NOCS), for all the objects from a category. They directly predicted the 3D coordinates in NOCS for each pixel of the object on the RGB image. Then the Umeyama algorithm [32] was used to solve the 6D pose and size of the objects. However, it is difficult to predict 3D coordinates in NOCS directly from RGB images, and the predicting deviation will make the results worsen. Tian et al. [14] explored the NOCS method by adding a shape prior and RGB-D fusion feature to reconstruct the canonical representation. Wang et al. [15] also adopted the NOCS method and proposed a cascaded relation network to exploit the RGB-D fusion feature and the relation between instance and category features. In addition, a recurrent reconstruction network is designed to refine the canonical shape reconstruction of the objects. Chen et al. [16] consider both geometric and category information to produce dense-fusion features to regress 6D pose and to calculate the size of objects by reconstruction. Chen et al. [17] proposed a network with an online 3D deformation mechanism for data augmentation to increase the generalization ability, which directly regress the 6D pose and size of objects. However, the size predicted by these methods is the 3D bounding box size of the object, or the ratio between the object shape in their unified space and that in the scene. So, there are no suitable methods to predict exact driven parameter values of parametric part objects.
3. Dataset
In this section, we will introduce our new dataset, Multi-Parametric Dataset, targeting 6D pose estimation and parameter values prediction for stacked scenarios of parametric part objects from multiple parametric templates.
3.1. Dataset Description
Our dataset is completely generated automatically by simulation techniques. The synthetic stacked scenes are constructed by the physics engine, and the annotations are obtained by the virtual camera in the rendering engine. As mentioned in [29], the simulation dataset can perform well on the real test set through the domain transfer.
We select four parametric templates in Zeng’s database [1], including TN06, TN16, TN34, and TN42, as shown in Figure 2. They represent the symmetry types commonly existing in industrial scenarios. For a parametric template with p parameters, we sample k () values for each one within a certain range. Then we instantiate it into different part objects to construct a 3D model library where the models are selected to construct our synthetic stacked scenes.
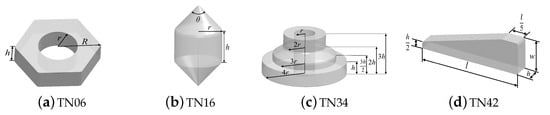
Figure 2.
The selected four templates with commonly existing symmetry types in industrial scenarios: (a) TN06: Finite; (b) TN16: Revolution with rotoreflection invariance; (c) TN34: Revolution without rotoreflection invariance; (d) TN42: None.
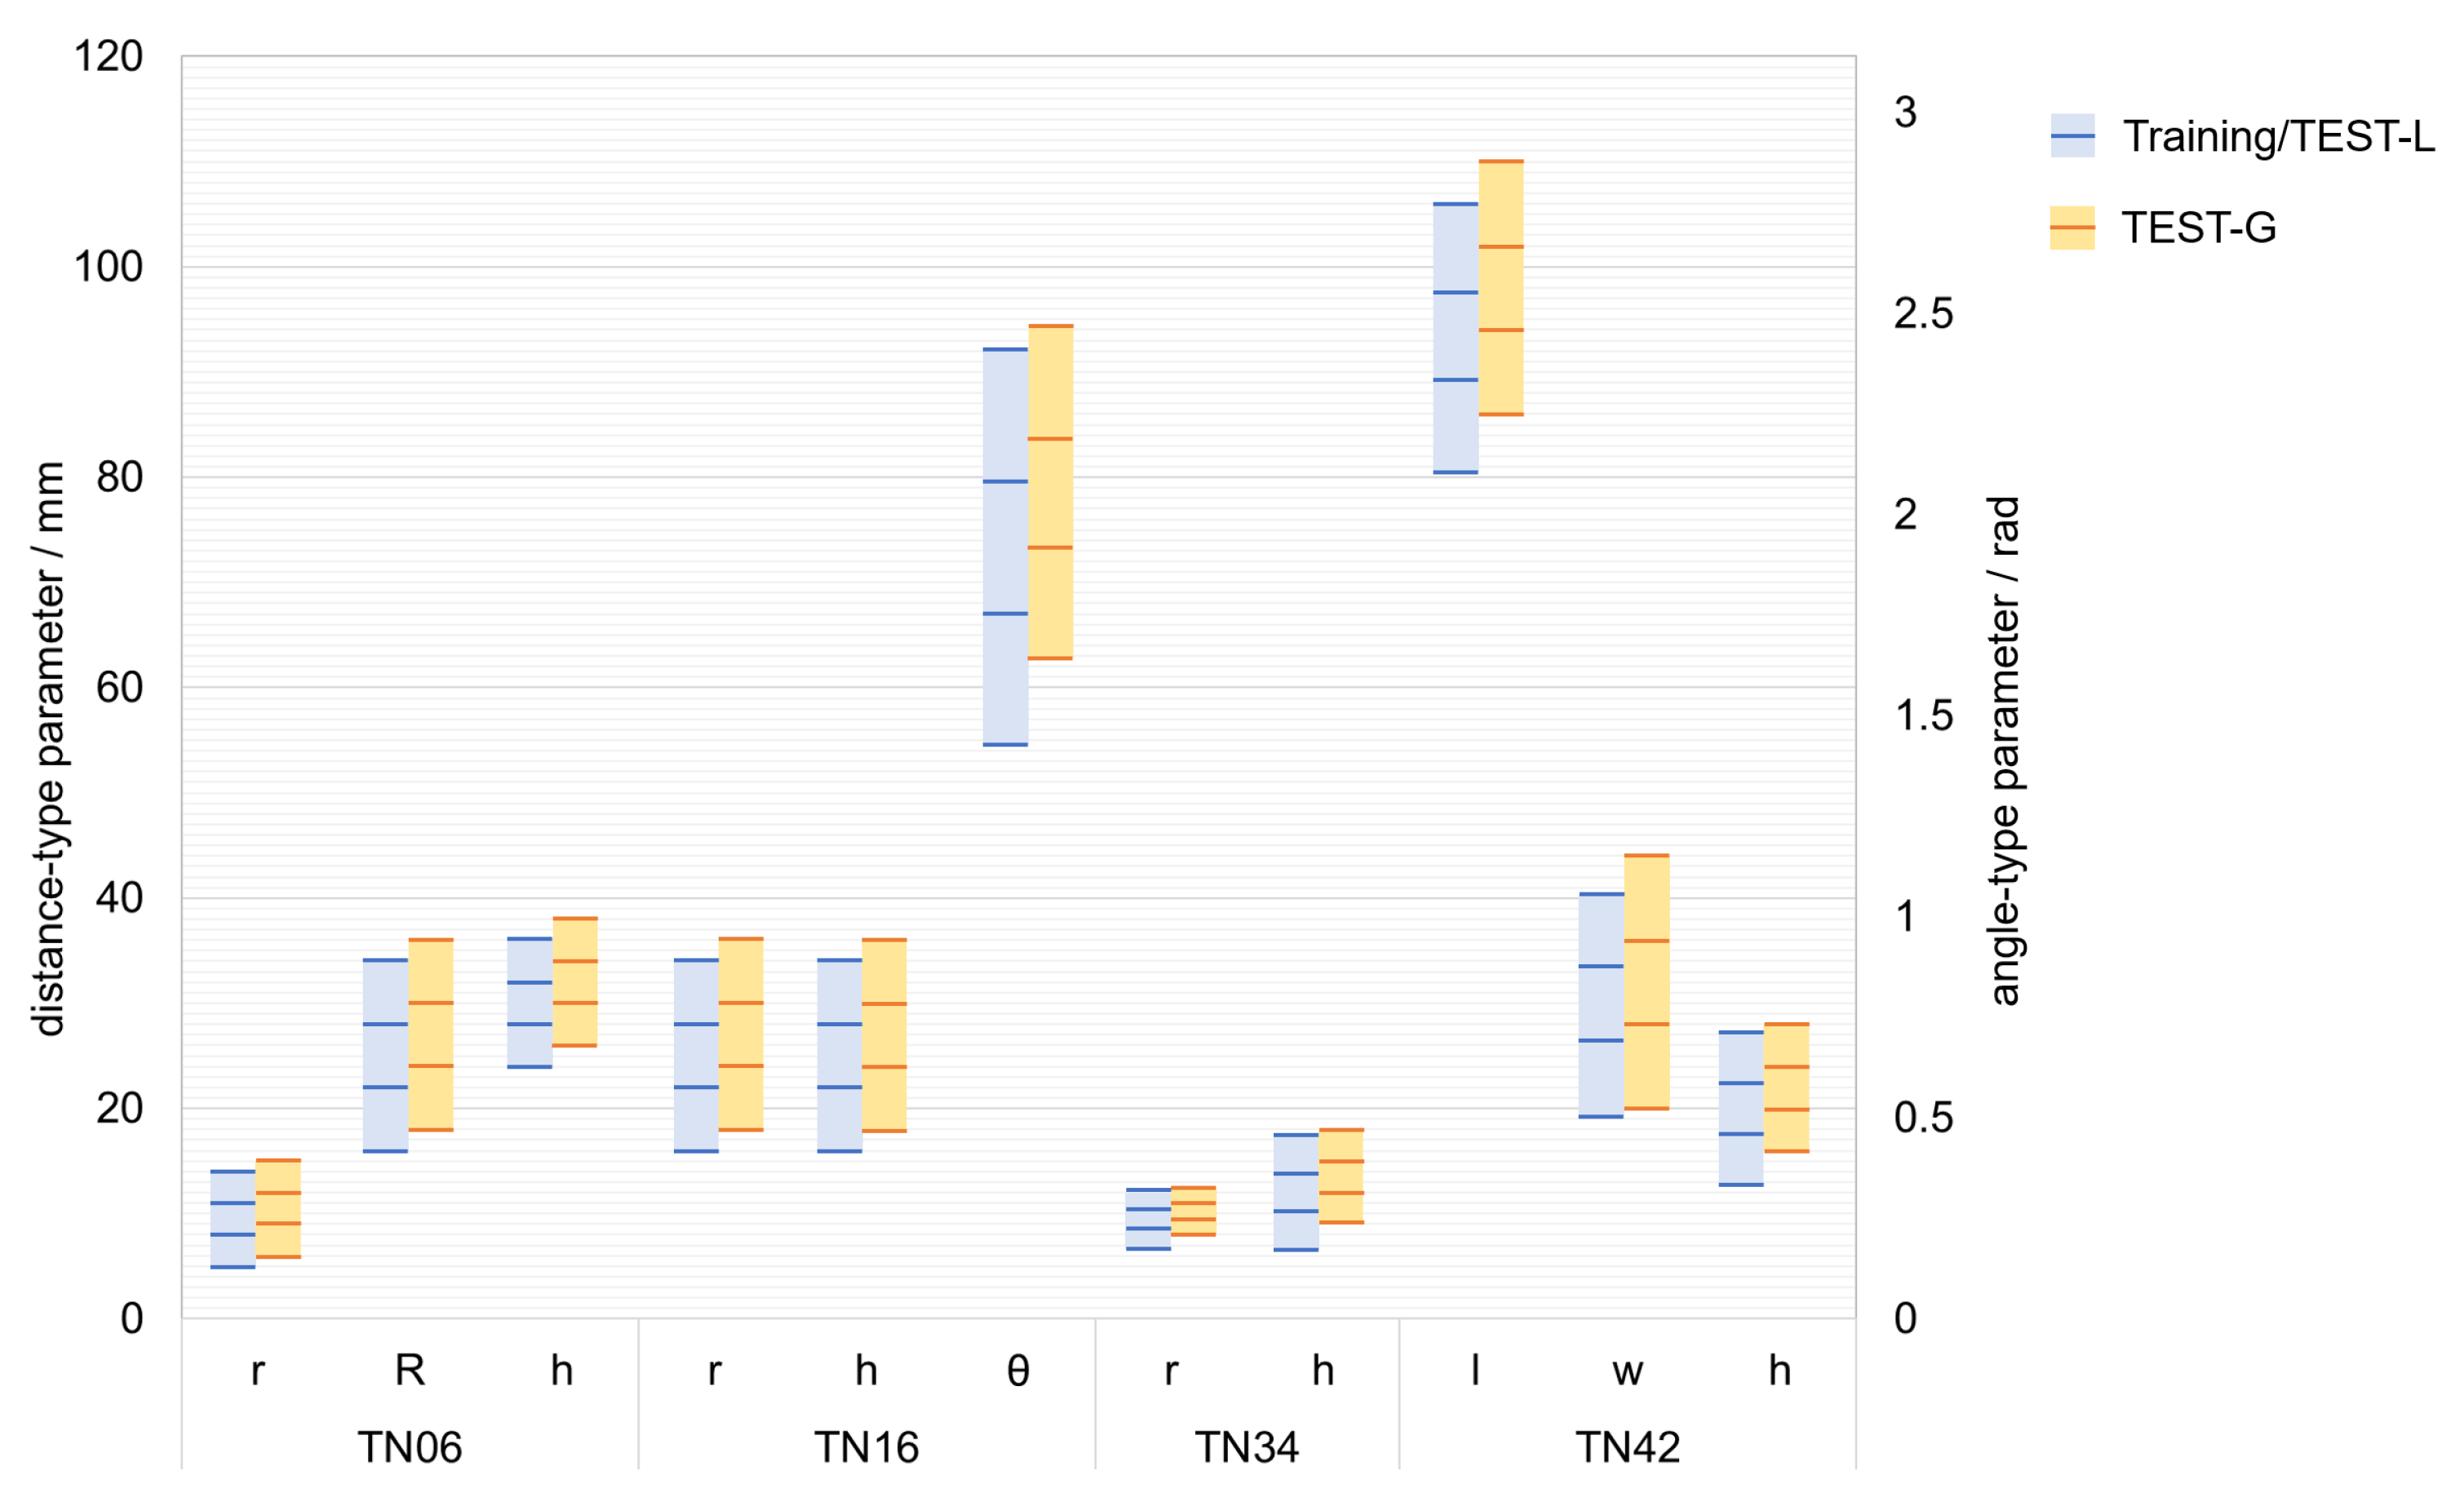
The dataset is divided into a training set (50K scenes) and a test set (2K scenes). The test set comprises TEST-L (1K scenes) where part objects’ parameter values are the same as those of the training set and TEST-G (1K scenes) where part objects’ parameter values are different from those of the training set. The two test datasets are set up to evaluate the learning ability and generalization ability, respectively. The parameter values distribution of part objects in the dataset is shown in Figure 3. The rectangular regions represent the sampling ranges of the parameter values, and the lines represent the sampled parameter values.
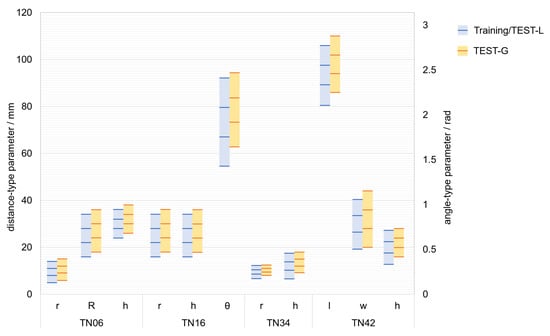
Figure 3.
Overview of parameter value distribution of the part objects, where is angle-type parameter and others are distance-type parameters.
The ground truth annotations comprise template labels, segmentation masks, translation labels and rotation matrix labels relative to the camera frame, visibility labels , and parameter values labels, for each instance in a scene.
3.2. Synthetic Data Generation
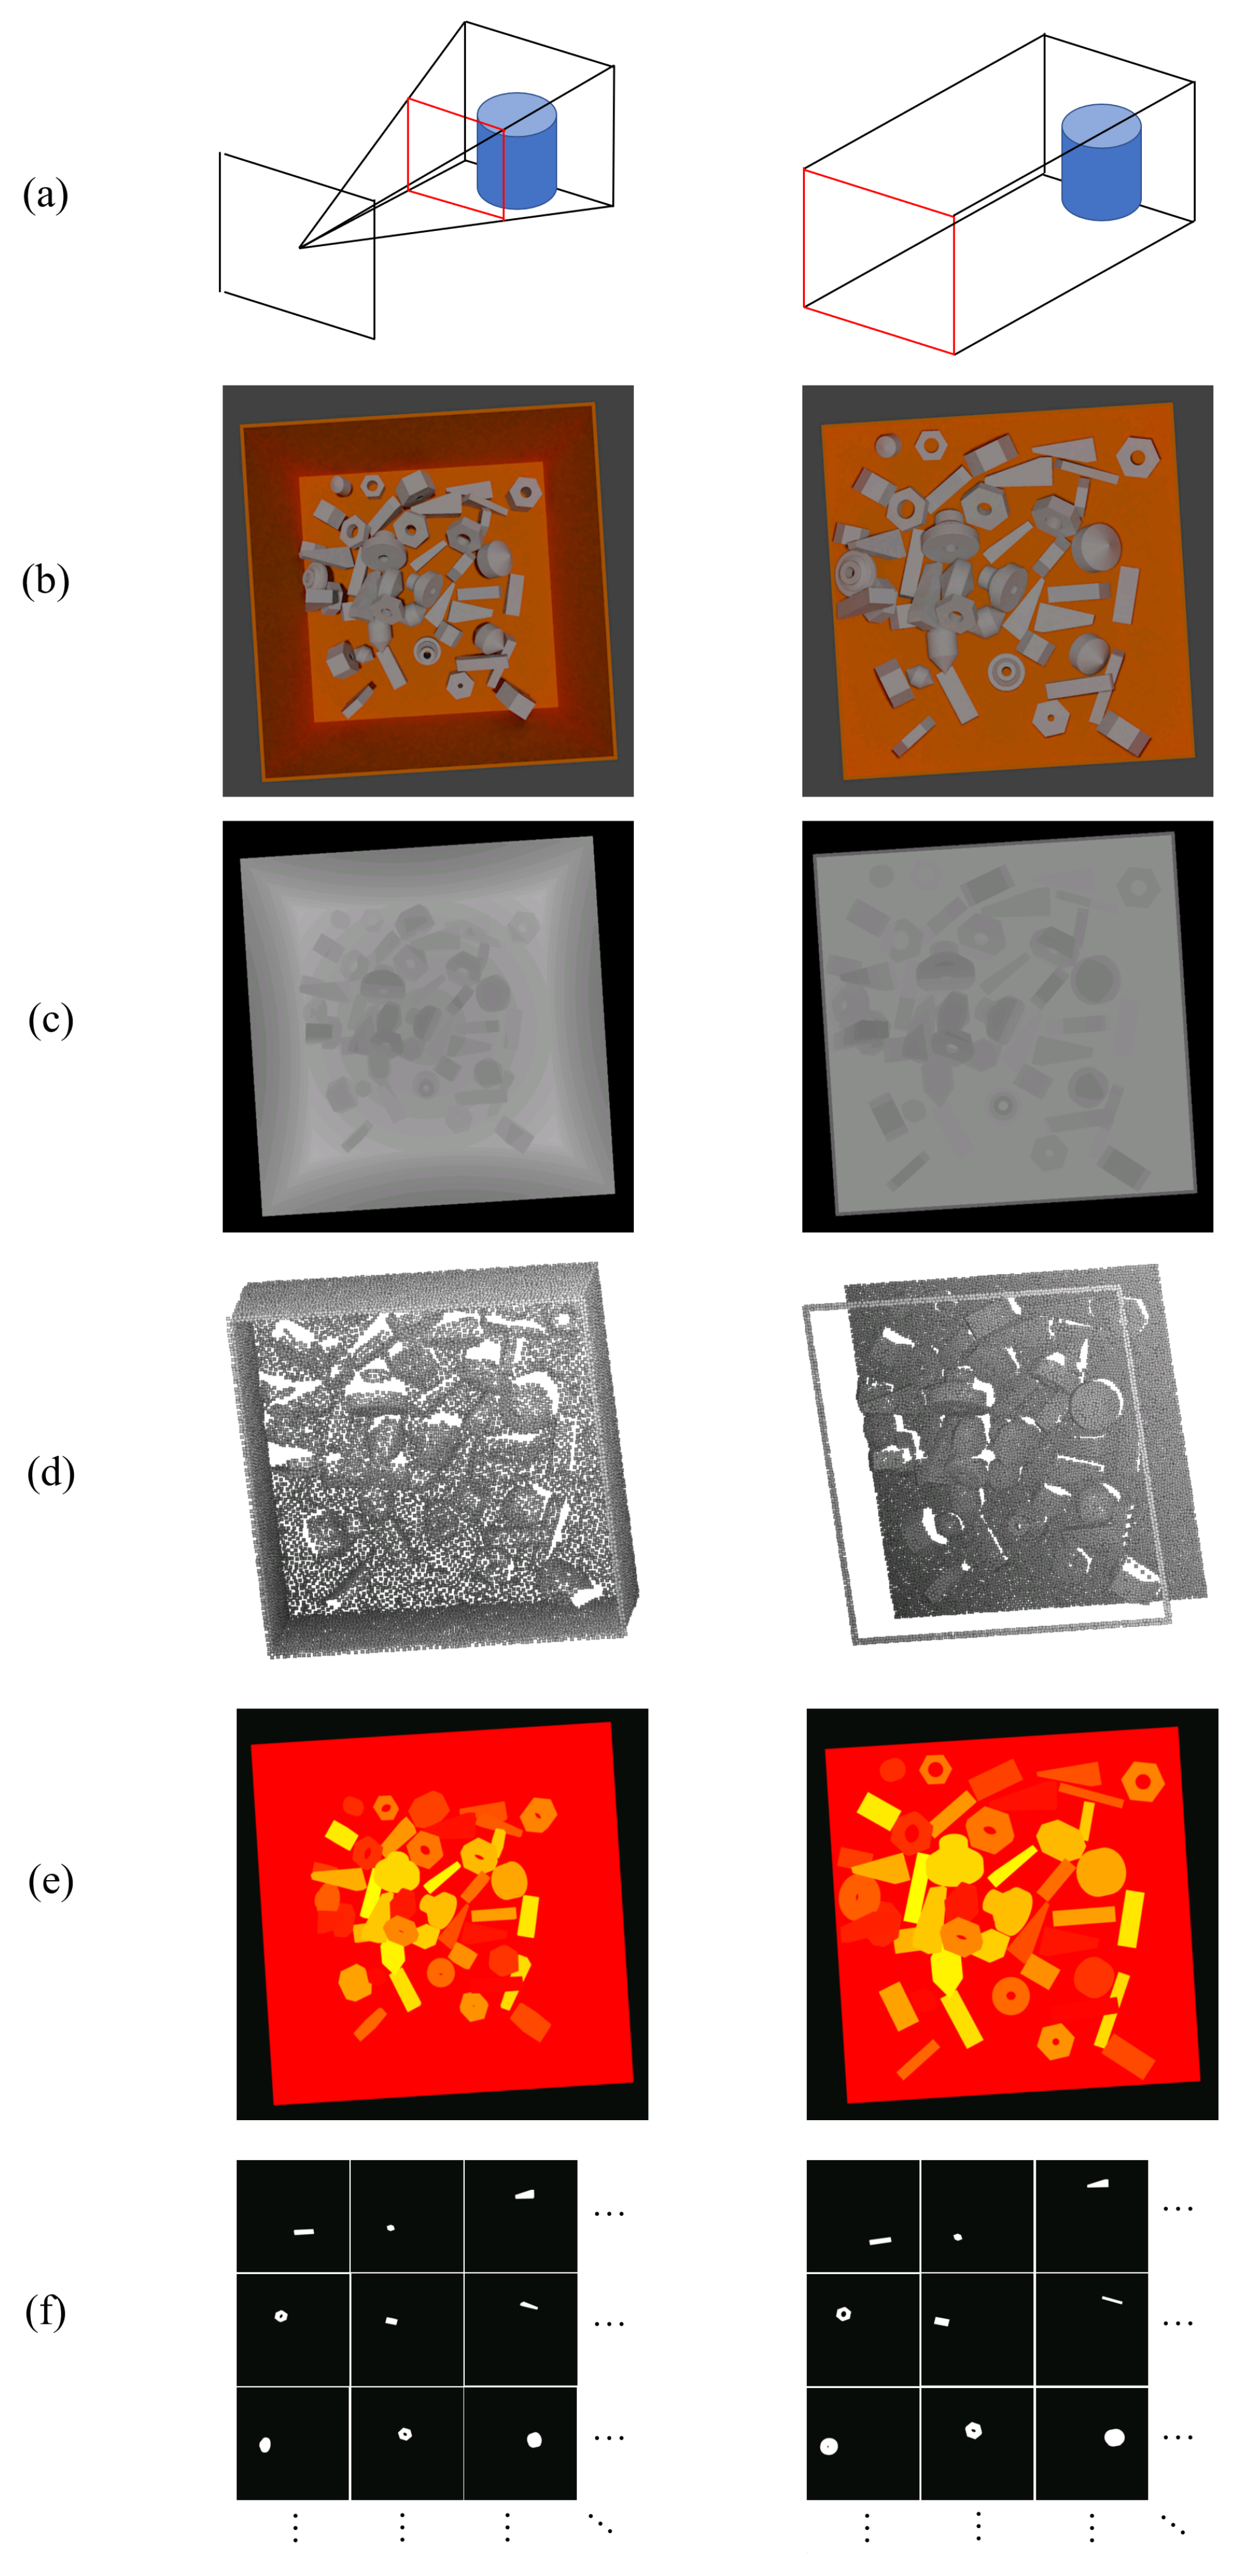
We build a 3D model of the bin with a size of 50 × 50 × 15 cm which is randomly rotated at an angle around the axis perpendicular to the ground in each scene to increase the variety of the dataset. Then we extract randomly one part object from the model library n () times with the place back. So the number of objects in a scene is n and the number of each part object in a scene may be more than one. A physical simulation engine, i.e., Bullet, is used to simulate the free fall motion and collision of the objects to generate a typical stacked scene, where the labels of the bin and part objects are obtained automatically. Repeating the above process, we can generate different synthetic scenes. After rendering each scene through the render engine, i.e., Blender, we obtain an RGB image, a depth image, a segmentation image, and a set of images with each individual object for each scene. All the results are saved for the perspective and orthogonal version, as shown in Figure 4.

Figure 4.
The content of our dataset (Multi-Parametric Dataset). From up to down: (a) perspective or orthogonal view, the left column is perspective view, and the right column is orthogonal view; (b) RGB image; (c) depth image; (d) point cloud; (e) segmentation image; (f) mask images containing individual object only for calculating visibility.
The RGB information of the synthetic scenes is stored in the RGB images. The depth information of each pixel is stored in the depth image as 16 bit unsigned integer format (unit16). The segmentation images store the instance information to its corresponding pixels. In addition, we save a set of mask images for each individual instance without occlusion in a scene to calculate their corresponding pixel number. Intuitively, we regard the degree of visible surface of the ith () instance in the scene as its visibility :
where is the pixel number of the ith instance in the segmentation image, and is the pixel number of the ith instance in its own mask image.
3.3. Evaluation Metrics
Our dataset is designed for the evaluation of foreground segmentation, template segmentation, 6D pose estimation, and parameter values prediction.
For evaluation of foreground segmentation and template segmentation, we use mean Intersection over Union (mIoU) as the evaluation metric, which is calculated by the ratio between the intersection and the union of ground truth and predicted segmentation results. The IoUs are calculated on each class and averaged to get mIoU as follows:
where is the number of the class, is the point which is predicted as jth class and the ground truth is ith class.
For evaluation of 6D pose estimation, we regard the instances as true positive, whose error is less than m cm for translation and for rotation similar to [33,34]. Given the rotation label and translation label , and the predicted rotation and translation , the error of rotation and translation and can be, respectively, computed by:
In particular, for the template with finite symmetry, can be computed by:
where is the set of rotation matrix that has equivalent effect on a object. For the template with revolution symmetry, we assume that the object is symmetric on the z axis of the object’s local frame. So we can abstract it as a unit vector along the z axis, and can be computed by:
For evaluation of parameter values prediction, we regard the instance as true positive whose relative error of all the parameter values are less than . Given the ground truth of the sth parameter , and the predicted sth parameter , the error of the sth parameter can be computed by:
For 6D pose estimation and parameter values prediction, only the poses of objects that are less than 60% occluded are relevant for the retrieval. The metric breaks down the performance of a method to a single scalar value named average precision (AP) by taking the area under the precision-recall curve. Then the mean average precision (mAP) is adopted as the final evaluation metric computed by the average of the APs of all the parametric templates.
4. Baseline Method
In this section, we propose a new network with residual modules, Multi-templates Parametric Pose Network, donated as MPP-Net. This baseline method can jointly achieve foreground segmentation, instance segmentation, template segmentation, 6D pose estimation, and parameter values prediction. The architecture of our network is shown in Figure 5. Firstly, the point-wise features of the point cloud are extracted by a backbone network, e.g., Pointnet [35], Pointnet++ [36], and PointSIFT [37]. The backbone network takes unordered point cloud of the scene with size of as input to produce a point-wise feature with size of . Then foreground segmentation and template segmentation are achieved with and , respectively. Furthermore, the 4 branches which consume the enhanced feature with shared multi-layer perception (MLP) and residual modules, can jointly obtain foreground segmentation result, template segmentation result, translation prediction, rotation prediction, parameter values prediction, and visibility prediction for each point. Thus, the loss function of our network is the sum of each part loss with their own weight:
where , , , , , are the loss of the parts, and , , , , , are the loss weights for different parts.
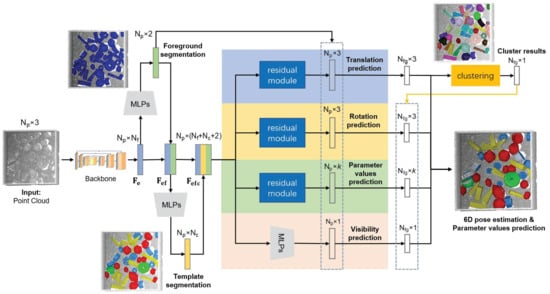
Figure 5.
Architecture of Multi-templates Parametric Pose Network (MPP-Net).
4.1. Foreground Segmentation
For stacked scenes consisting of the bin and part objects, the point cloud in the scene need to be divided into foreground and background, since only the foreground point cloud are what we concern. We feed the embedded feature into MLPs to produce point-wise foreground segmentation result with size of . The elements , are the probability of the ith point belonging to background and foreground, respectively. The loss is the binary cross entropy softmax loss:
where represents foreground segmentation label of the ith point:
4.2. Template Segmentation
It is one of the important tasks for recycling scenarios to distinguish parts belonging to different templates, which is also an important prerequisite for 6D pose estimation and parameter values prediction. Therefore, we design a template segmentation branch to identify templates to which the point belongs. Since the foreground segmentation information might be useful for other tasks, so we concatenate and to produce a feature with size of as the input of the template segmentation branch. Then we feed into MLPs to produce point-wise template segmentation results with size of . The element represents probability of the ith point belonging to the jth template. In order to avoid the influence of background points during training phrase, only the foreground points are considered when applying the cross entropy softmax loss :
where is the number of the foreground points, is the number of the templates, and represents the template label of the ith point:
Due to segmentation information may be beneficial to other tasks, so we concatenate and to produce a feature with size of as the input of the following branches.
4.3. Translation Branch
This branch is used to predict the translation of instances and achieve instance segmentation. Since the local frame origin of the object is its centroid in our dataset, the translation is the centroid coordinate in the scene. We feed into MLPs to regress the point-wise offsets to the centroid of the instance to which each point belongs. Then the predicted centroids with size of is calculated by adding the offsets to the point cloud. The loss considering foreground points only is loss between predicted centroids and centroid labels:
where and are point-wise labels and predicted centroids of the instance to which the ith foreground point belongs. To make the most of the information we extract from the backbone network, we add MLPs which consume to regress the residual between predicted centroids and centroid labels to improve our prediction results. However, in fact, ground truth of the residual is unknown. Similar to [38], we set the optimal target of the residual by online learning and the loss is loss:
Furthermore, the total loss of the translation branch is the sum of two loss:
The residual module comprises two independent MLPs to jointly regress the coarse prediction and the residual prediction to obtain the accurate prediction , as shown in Figure 6.
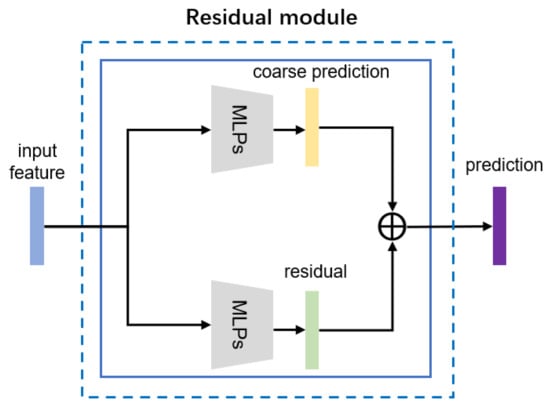
Figure 6.
The architecture of the designed residual module.
Similar to [3,18,19], we believe that if the points belong to the same instance, then the centroid predictions of these points will be close in the centroid space. During inference, we cluster the points in the centroid space into D clusters, i.e., D instances, by the unsupervised learning clustering method. Finally, the final centroid of each instance with the final size of is obtained by Hough voting in each cluster.
4.4. Rotation Branch
Similar to the translation branch, we feed into the residual module to regress the point-wise rotation prediction of the instance to which each point belongs. There are many representations for rotation, such as quaternion, rotation matrix, Euler angles, and axis-angle. Gao et al. [39] proposed that the axis-angle representation is a better choice for rotation, and Dong et al. [18] proved that their point-wise pose regression framework has almost the same results by learning Euler angles and axis-angle. Therefore, Euler angles are chosen to learn which is more intuitive for humans.
The loss function for rotation prediction adopts the pose distance proposed by Romain Brégier et al. [40], which is calculated by the pose vectors with at most 12 dimensions in Euclidean space for different types of object symmetry. Let the set represents the vectors (at most 9 dimensions) of the equivalent poses of the rotation matrix . The distance between two rotation vectors, i.e., , can be represented as follows:
The rotation of the instances are obtained by a residual module which comprises of two MLPs. One MLPs aims to regress point-wise Euler angles , , directly, and then they are converted into the coarse predicted rotation matrix:
Therefore, the loss is the sum of rotation distance of different templates between the coarse predicted rotation and the rotation labels:
where is the number of the foreground points belonging to the jth template. The other one MLPs aims to regress the residual Euler angles , , , and then they are converted into the accurate rotation matrix by adding them to , , :
The loss is the sum of rotation distance of different templates between the accurate predicted rotation and the rotation labels:
Furthermore, the total loss of the rotation branch is the sum of the two loss:
During inference, the foreground point-wise rotation results with size of are divided into D clusters according to the instance segmentation result. Then, the final predicted rotations with size of is obtained by Hough voting in each cluster.
4.5. Parameter Values Branch
When we recycle the parametric part objects, we need to sort them according to the different parameter values. So we need to predict the value of each parameter for each part object. The feature is fed into the residual module to regress k parameter values of the instance to which each point belongs. The two loss considering only the foreground points , are loss and the sum is the total loss of this branch:
where , , are coarse predicted parameter vectors, ground truth parameter vectors, and the residual parameter vectors with k parameter values for the instance to which the ith foreground point belongs. Furthermore, we can obtain the accurate parameter values . During inference, the foreground point-wise parameter values are divided into D clusters in the parameter space according to instance segmentation result. Then, each cluster’s points votes for the final predicted parameter values for each instance with size of .
4.6. Visibility Branch
In typical stacked scenarios, we are not interested in the instances with heavy occlusion since they are difficult for robots to grasp. In addition, severely occluded instances only have very limited local information, which is likely to damage the performance of the network. So we filter out these instances by a visibility threshold . Similar to other branches, we feed into MLPs to regress the visibility result with size of of each point, and divide the foreground point-wise results into D clusters. Then each cluster’s points votes for the final predicted visibility for each instance with size of . The loss for the visibility branch is loss:
where and are the point-wise visibility labels and predicted visibility.
5. Experiments and Results
5.1. Implementation Details
We sampled 16,384 points with only 3D coordinate information in each scene by Furthest Point Sampling. PointSIFT [37] was chosen as our backbone network which is the latest work compared with Pointnet [35] and Pointnet++ [36], and has stronger feature extraction ability. We set , , , , and . We implemented our network by using Tensorflow 1.5 on a GeForce RTX2080Ti. We optimized our network using the Adam optimizer with batch size 6 and initial learning rate 0.001. The learning rate decayed every 200,000 steps by a factor of 0.5. The forward-pass time of MPP-Net for a single scene was about 300 ms.
5.2. Results
For foreground segmentation and template segmentation, we evaluate the learning and generalization ability on TEST-L and TEST-G, as shown in Table 2. Our experiment results show that the segmentation performance of MPP-Net is good enough to meet the segmentation requirements, and the generalization performance is almost the same as the learning performance. Specifically, the background segmentation results on two test datasets exceed 99.9%. Besides, the IoU results of each template on TEST-L exceed 99.5%, while the IoU results of each template on TEST-G exceed 98.5%. The mIoU and Overall Accuracy on the two test datasets exceed 99.0%.
Table 2.
Background (BG) and foreground (FG) segmentation, and template segmentation in predicted foreground points.
Learning and generalization ability evaluation on Multi-Parametric Dataset is shown in Table 3. In general, if we adopt the stricter threshold, the performance of MPP-Net drops. For translation evaluation, we select four thresholds, i.e., 0.5 cm, 1 cm, 2 cm, 5 cm. The mAP evaluated on TEST-G will drop 2.1%, 0.7%, 0.2%, 0.2% under the 4 thresholds, compared with mAP evaluated on TEST-L. For rotation evaluation, we select four thresholds, i.e., . The mAP evaluated on TEST-G will drop 5.1% under the threshold , and increase 0.7%, 1.3%, 1.2% under the other 3 thresholds, compared with mAP evaluated on TEST-L. For parameter values evaluation, we select four thresholds, i.e., 5%, 10%, 15%, 20%. The mAP evaluated on TEST-G will drop 45.0%, 32.5%, 15.3%, 7.6% under the 4 thresholds, compared with mAP evaluated on TEST-L.
Table 3.
Learning and generalization ability evaluation on the Multi-Parametric Dataset.
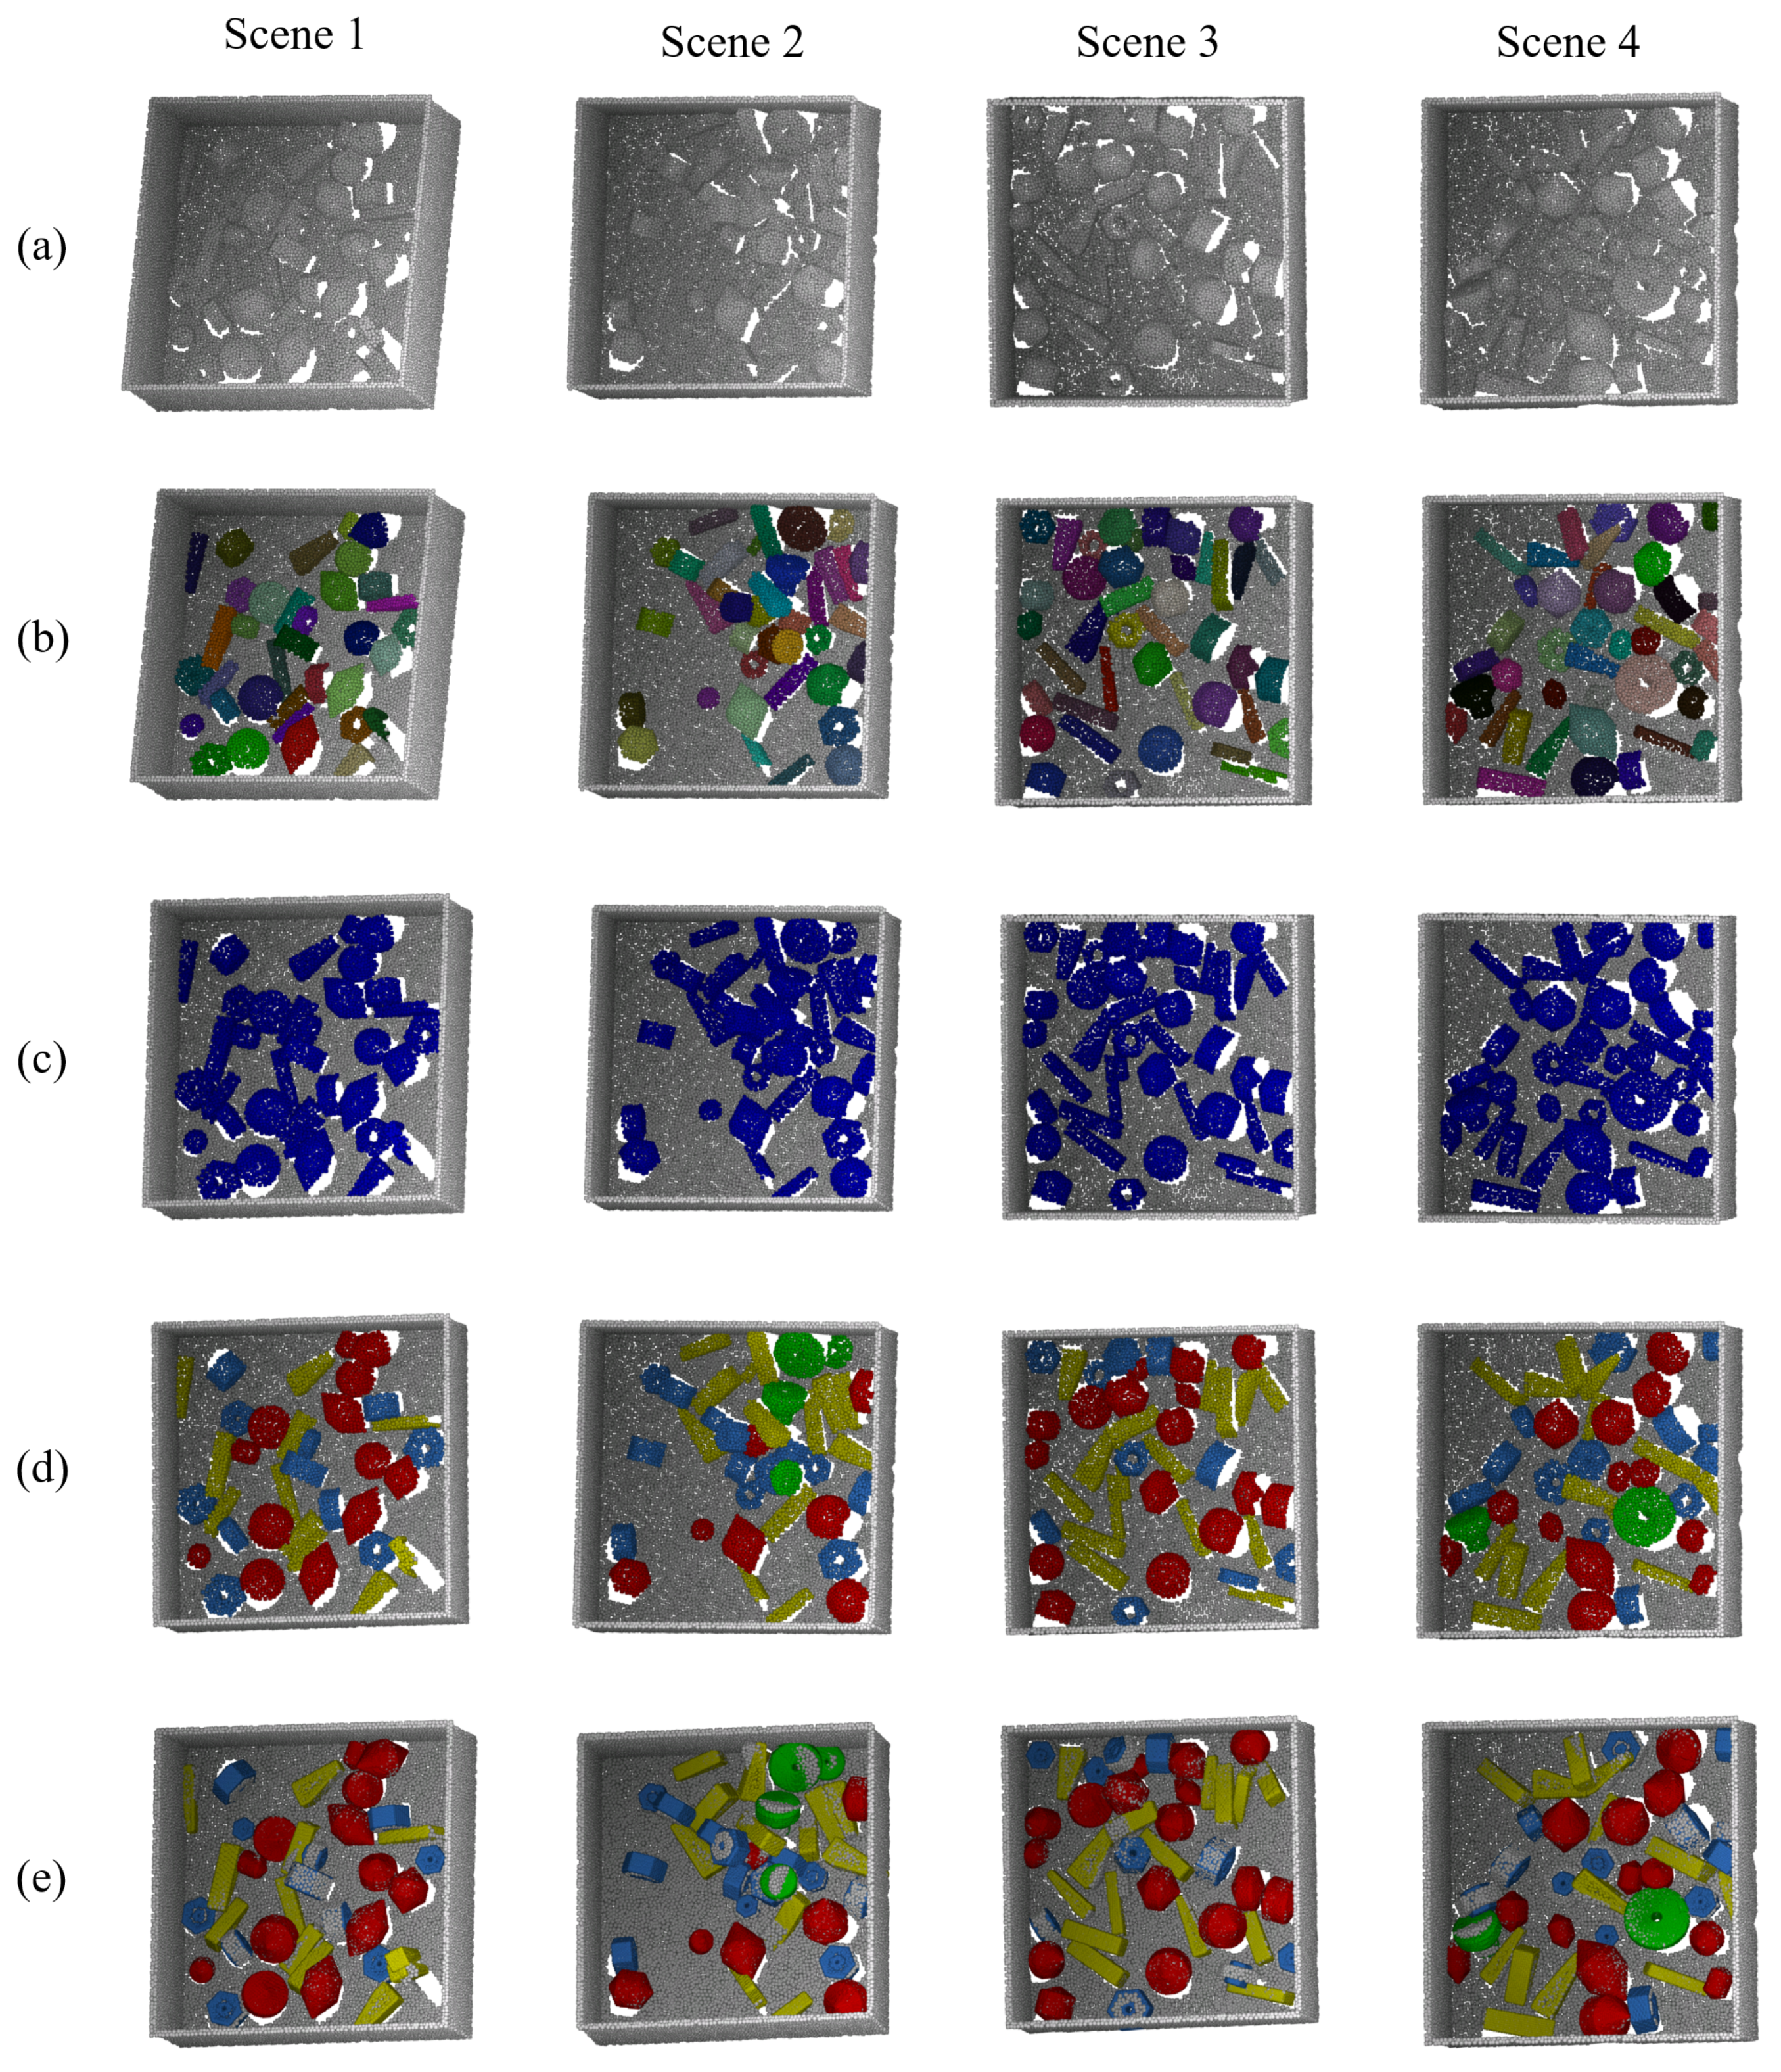
Obviously, MPP-Net has excellent learning and generalization performance for translation prediction. However, learning and generalization performance for rotation prediction are poor. As for the parameter values prediction, its generalization performance is much lower than learning performance, especially if the threshold is strict. So the accurate prediction for rotation and parameter value is very challenging. The visualization for predicted results on our test set is shown in Figure 7.
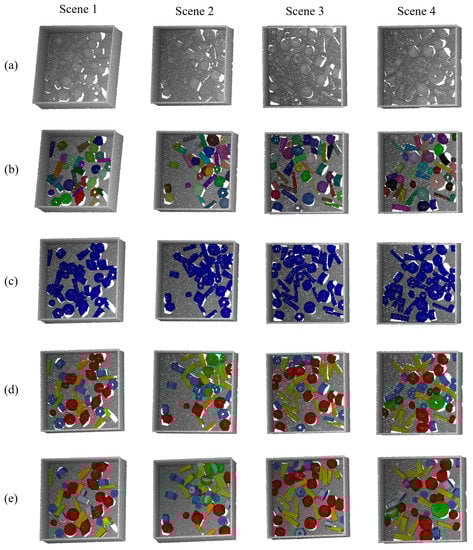
Figure 7.
The visualization for predicted results of four scenes on our test set, (a) input point cloud; (b) instance segmentation; (c) foreground segmentation; (d) template segmentation; (e) 6D pose estimation and parameter values prediction. The foreground segmentation, instance segmentation, and template segmentation shown in the figure above are the segmentation results on the raw point cloud. To visualize 6D pose estimation and parameter values prediction, we reconstruct the part objects’ models from the template segmentation results and the parameter values prediction results, and the models are transformed in the scene by the 6D pose estimation results to overlap on the raw point cloud.
5.3. Ablation Study
In addition, we explore the influence of the residual module of our network. For translation prediction, as shown in Table 4, the residual module has little improvement due to the performance is saturated. As the predicted results converge to the ground truth, it becomes harder for residual learning to improve the performance of translation prediction. For rotation prediction, as shown in Table 5, the residual module can achieve improvements by 5.9%, 8.1%, 8.0%, 9.1% under the four thresholds for learning performance, and 2.7%, 7.8%, 8.1%, 8.8% under the four thresholds for generalization performance. Obviously, it is a large improvement for rotation prediction. When the network cannot directly regress an exact prediction result, the residual module can further explore the information in the embedding features, so as to make an improvement on the performance of rotation prediction. For parameter values prediction, as shown in Table 6, the residual module can achieve improvements by 3.5%, 2.8%, 1.9%, 1.6% under the four thresholds for learning performance, and 1.2%, 2.4%, 1.3%, 3.0% under the four thresholds for generalization performance. It shows that the residual module slightly improves parameter prediction results, due to this it may be difficult to explore the parameter information from the embedding features.
Table 4.
Ablation study on translation prediction (w/o residual: regress the prediction without residual modules).
Table 5.
Ablation study on rotation prediction (w/o residual: regress the prediction without residual modules).
Table 6.
Ablation study on parameter values prediction (w/o residual: regress the prediction without residual modules).
The experiments results show that the residual modules bring great benefits for the rotation prediction, while the performance of parameter values prediction is improved a little.
5.4. Further Discussion
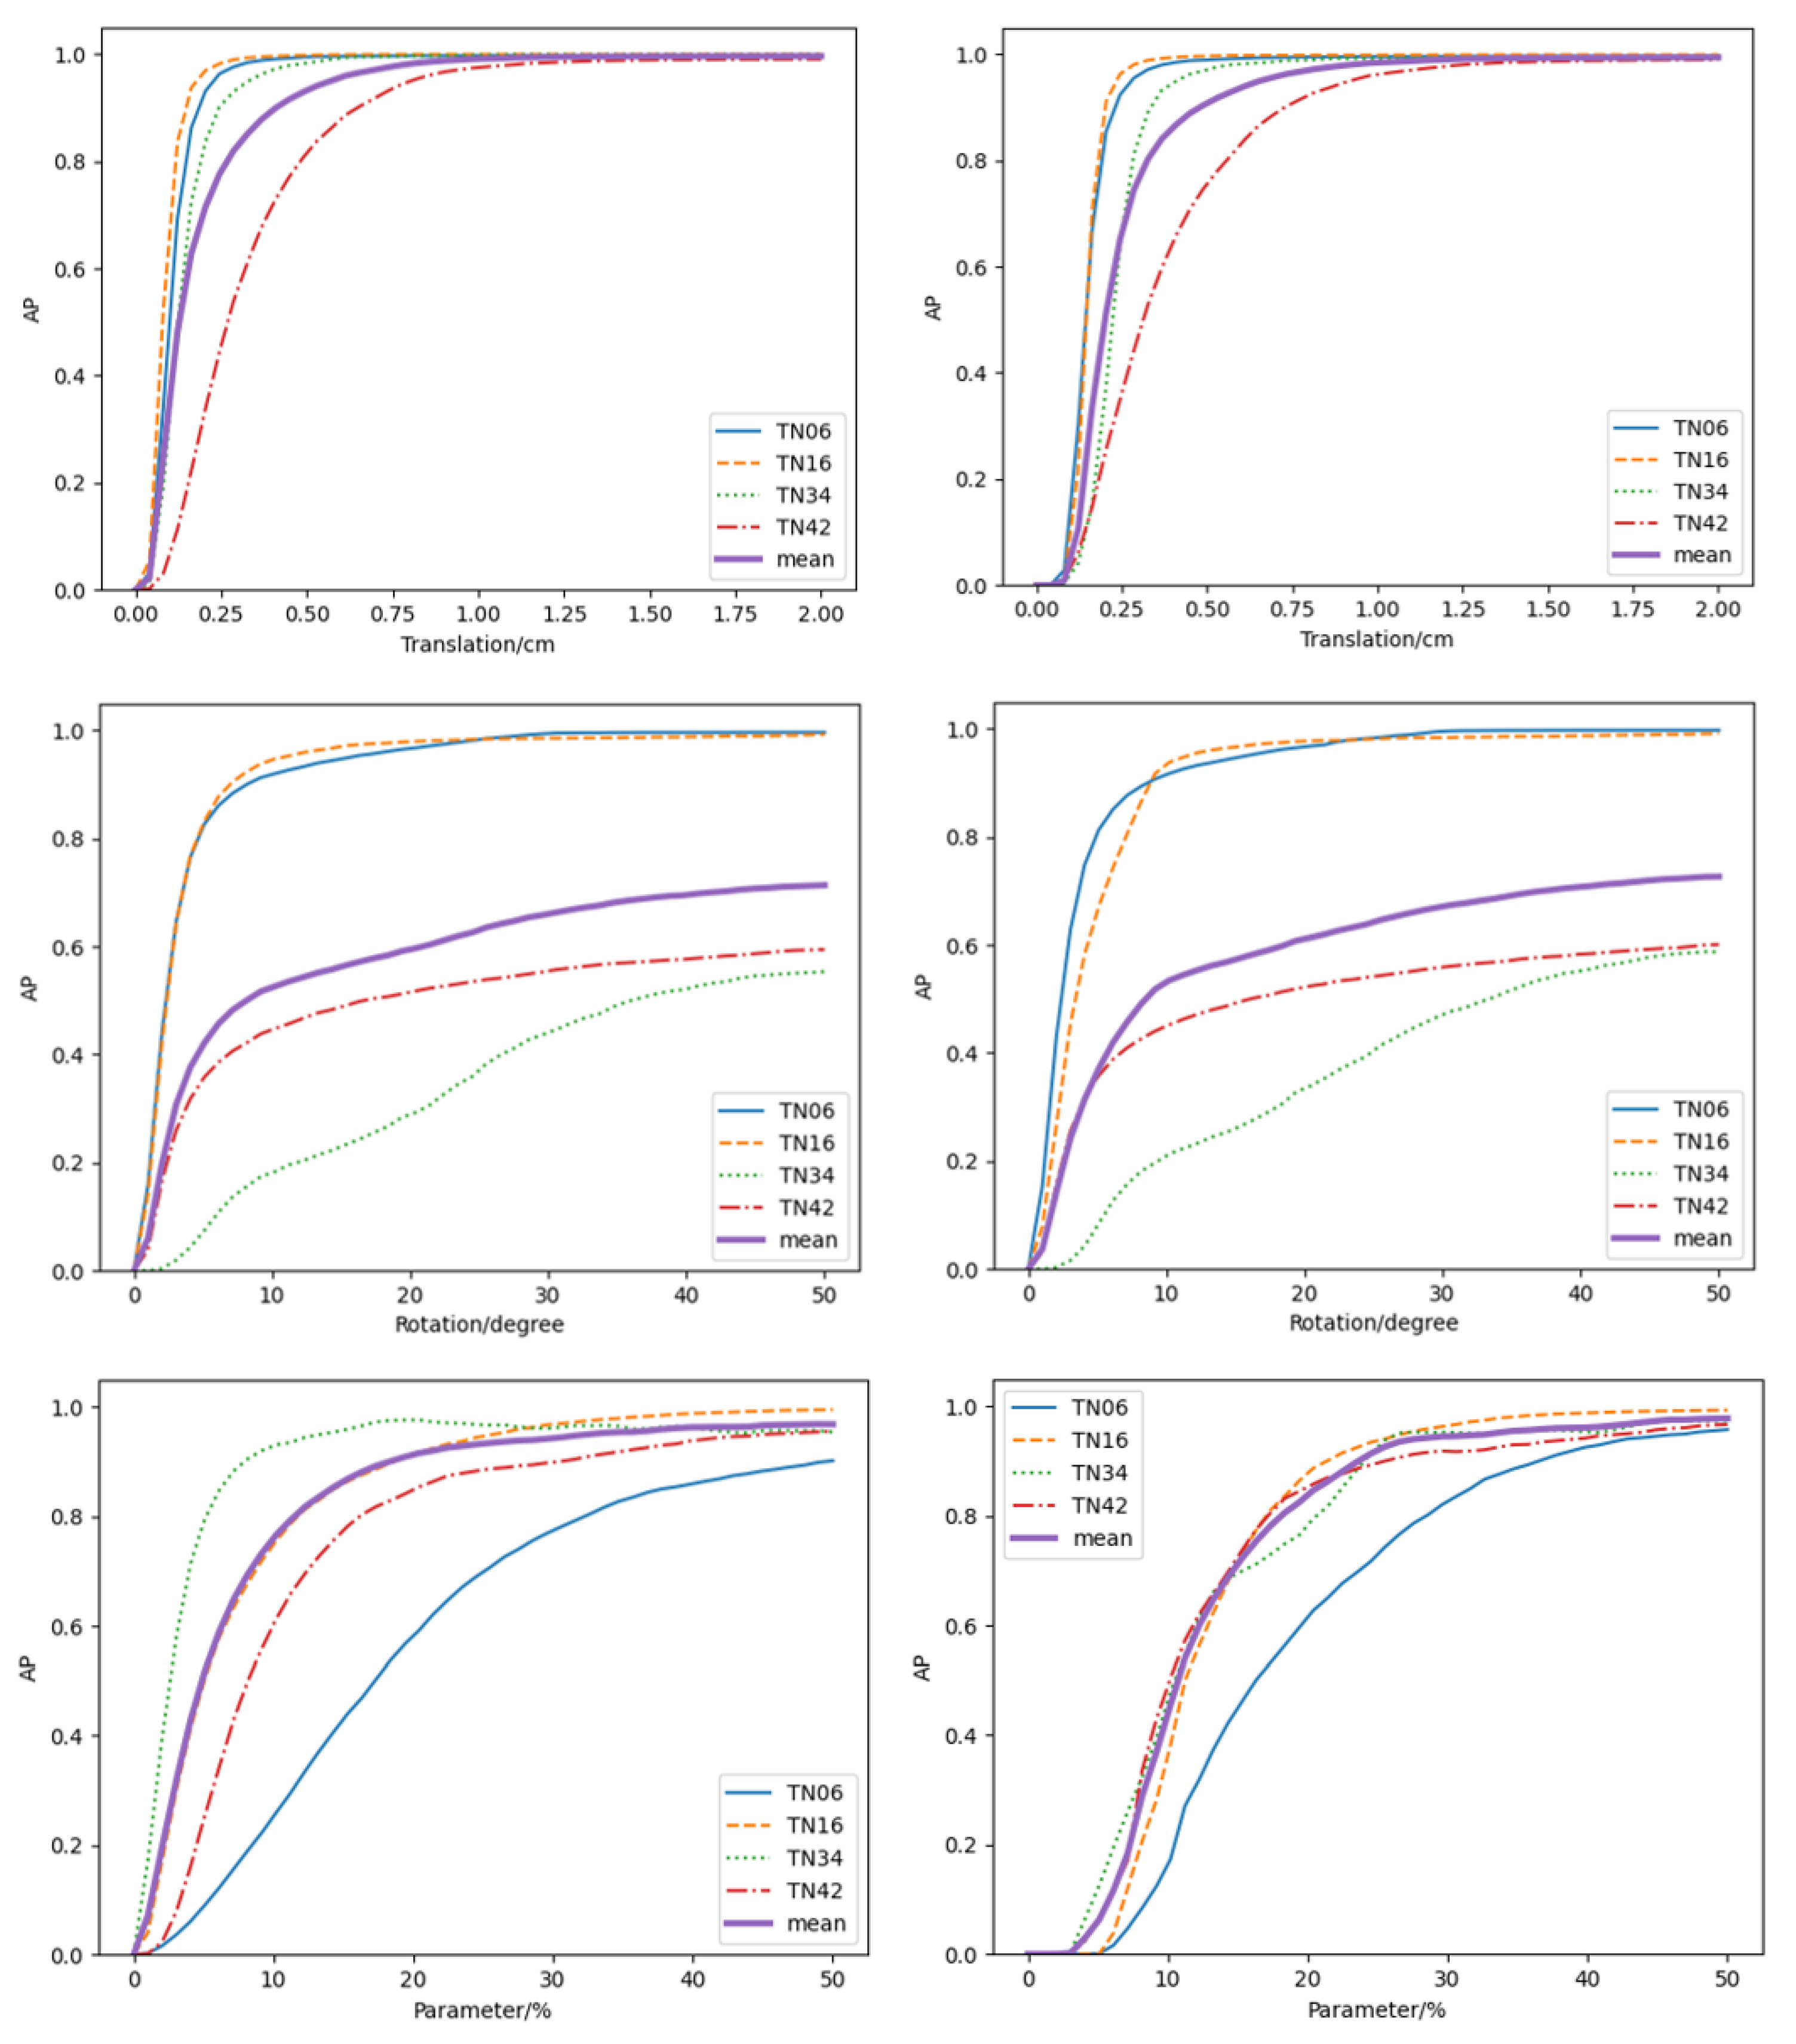
In addition to the above experiments, we explored the learning and generalization performance of each template under more threshold settings to show more analysis and comparison details, as shown in Figure 8. For translation prediction, when the threshold is lower than 1cm, the AP of each template is close to 100%, which means MPP-Net shows excellent performance on TEST-L and TEST-G. For rotation prediction, the performance of the four templates on TEST-L and TEST-G are close. Obviously, TN06 and TN16 perform better, while TN34 and TN42 perform worse. For parameter values prediction, the network generalization performance is much worse than the learning performance, since the main difference between TEST-L and TEST-G lies in parameter values. Among the four templates, TN06 is worse than the others. In the visualization for evaluation, the prediction results of inner diameter r, outer diameter R, and height h of the part objects from the TN06 template are inaccurate. Therefore, we need more research works targeting the improvements of rotation and parameter values prediction for various parametric templates, and our dataset, Multi-Parametric Dataset, has exploratory value for 6D pose estimation methods in the future.
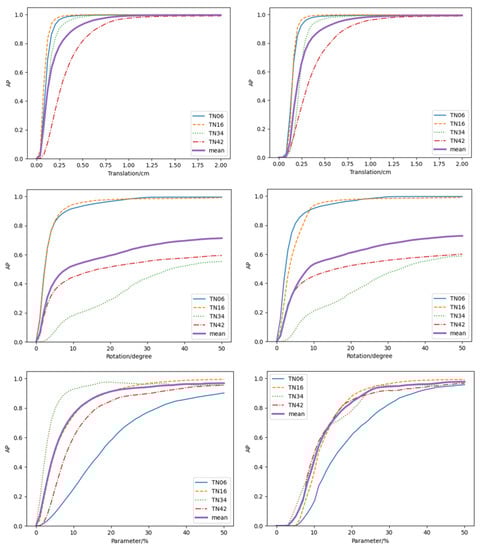
Figure 8.
Further experiment results on the evaluation of translation, rotation, and parameter values prediction. The images in the left column are the results evaluated on TEST-L for learning performance, and the images in the right column are the results evaluated on TEST-G for generalization performance.
6. Conclusions
In this paper, we proposed a new dataset Multi-Parametric Dataset for the lack of recycling stacked scenarios containing parametric part objects from multiple templates. Besides, we designed the evaluation metrics for the evaluation on the Multi-Parametric Dataset. To provide benchmark results, a new 6D pose estimation network, MPP-Net, was designed for such stacked scenarios as a baseline method for the Multi-Parametric Dataset. The experiment results showed that the Multi-Parametric Dataset has exploratory value for 6D pose estimation and parameter values prediction tasks. In the future, our research will focus on improving the generalization performance of different templates on the rotation and parameter values prediction, and exploring more templates in the field of industry.
Author Contributions
Conceptualization, X.Z., W.L. and L.Z.; methodology, X.Z. and W.L.; software, X.Z.; validation, X.Z.; formal analysis, X.Z. and W.L.; investigation, X.Z. and W.L.; resources, X.Z. and W.L.; writing—original draft preparation, X.Z. and W.L.; writing—review and editing, L.Z. All authors have read and agreed to the published version of the manuscript.
Funding
This work is supported by the University stability support program of Shenzhen (WDZC202 00821140447001) and the National Natural Science Foundation of China (Grant No. 61972220, No. 61725204).
Institutional Review Board Statement
Not applicable.
Informed Consent Statement
Not applicable.
Data Availability Statement
Our dataset and code are available at https://github.com/Zxyu20/Multi-Parametric-Dataset (accessed on 2 November 2021).
Acknowledgments
We acknowledge the support provided for this study by Tsinghua University.
Conflicts of Interest
The authors declare no conflict of interest.
References
- Zeng, L.; Dong, Z.; Yu, J.; Hong, J.; Wang, H. Sketch-based retrieval and instantiation of parametric parts. Comput.-Aided Des. 2019, 113, 82–95. [Google Scholar] [CrossRef]
- Shapiro, V.; Vossler, D.L. What is a parametric family of solids? In Proceedings of the Third ACM Symposium on Solid Modeling and Applications, Salt Lake City, UT, USA, 17–19 May 1995; pp. 43–54. [Google Scholar]
- Zeng, L.; Lv, W.; Zhang, X.; Liu, Y. ParametricNet: 6DoF Pose Estimation Network for Parametric Shapes in Stacked Scenarios. In Proceedings of the IEEE International Conference on Robotics and Automation (ICRA), Xi’an, China, 30 May–5 June 2021; pp. 772–778. [Google Scholar]
- Rad, M.; Lepetit, V. BB8: A Scalable, Accurate, Robust to Partial Occlusion Method for Predicting the 3D Poses of Challenging Objects without Using Depth. In Proceedings of the IEEE International Conference on Computer Vision (ICCV), Venice, Italy, 22–29 October 2017; pp. 3848–3856. [Google Scholar]
- Park, K.; Patten, T.; Vincze, M. Pix2pose: Pixel-wise coordinate regression of objects for 6d pose estimation. In Proceedings of the IEEE/CVF International Conference on Computer Vision (ICCV), Seoul, Korea, 27 October–2 November 2019; pp. 7668–7677. [Google Scholar]
- Li, Z.; Wang, G.; Ji, X. Cdpn: Coordinates-based disentangled pose network for real-time rgb-based 6-dof object pose estimation. In Proceedings of the IEEE/CVF International Conference on Computer Vision (ICCV), Seoul, Korea, 27 October–2 November 2019; pp. 7678–7687. [Google Scholar]
- Peng, S.; Liu, Y.; Huang, Q.; Zhou, X.; Bao, H. PVNet: Pixel-Wise Voting Network for 6DoF Pose Estimation. In Proceedings of the 2019 IEEE/CVF Conference on Computer Vision and Pattern Recognition (CVPR), Long Bench, CA, USA, 16–20 June 2019; pp. 4556–4565. [Google Scholar]
- Song, C.; Song, J.; Huang, Q. Hybridpose: 6d object pose estimation under hybrid representations. In Proceedings of the IEEE/CVF Conference on Computer Vision and Pattern Recognition (CVPR), Seattle, WA, USA, 14–19 June 2020; pp. 431–440. [Google Scholar]
- Xiong, F.; Liu, C.; Chen, Q. Region Pixel Voting Network (RPVNet) for 6D Pose Estimation from Monocular Image. Appl. Sci. 2021, 11, 743. [Google Scholar] [CrossRef]
- He, Y.; Sun, W.; Huang, H.; Liu, J.; Fan, H.; Sun, J. Pvn3d: A deep point-wise 3d keypoints voting network for 6dof pose estimation. In Proceedings of the IEEE/CVF Conference on Computer Vision and Pattern Recognition (CVPR), Seattle, WA, USA, 14–19 June 2020; pp. 11632–11641. [Google Scholar]
- He, Y.; Huang, H.; Fan, H.; Chen, Q.; Sun, J. FFB6D: A Full Flow Bidirectional Fusion Network for 6D Pose Estimation. In Proceedings of the IEEE/CVF Conference on Computer Vision and Pattern Recognition (CVPR), Virtual Event, 19–25 June 2021; pp. 3003–3013. [Google Scholar]
- Liu, H.; Liu, G.; Zhang, Y.; Lei, L.; Xie, H.; Li, Y.; Sun, S. A 3D Keypoints Voting Network for 6DoF Pose Estimation in Indoor Scene. Machines 2021, 9, 230. [Google Scholar] [CrossRef]
- Wang, H.; Sridhar, S.; Huang, J.; Valentin, J.; Song, S.; Guibas, L.J. Normalized Object Coordinate Space for Category-Level 6D Object Pose and Size Estimation. In Proceedings of the IEEE/CVF Conference on Computer Vision and Pattern Recognition (CVPR), Long Bench, CA, USA, 16–20 June 2019; pp. 2642–2651. [Google Scholar]
- Tian, M.; Ang, M.H.; Lee, G.H. Shape prior deformation for categorical 6d object pose and size estimation. In Proceedings of the European Conference on Computer Vision (ECCV), Glasgow, UK, 23–28 August 2020; pp. 530–546. [Google Scholar]
- Wang, J.; Chen, K.; Dou, Q. Category-Level 6D Object Pose Estimation via Cascaded Relation and Recurrent Reconstruction Networks. In Proceedings of the IEEE/RSJ International Conference on Intelligent Robots and Systems (IROS), Prague, Czech Republic, 27 September–1 October 2021. [Google Scholar]
- Chen, D.; Li, J.; Wang, Z.; Xu, K. Learning canonical shape space for category-level 6d object pose and size estimation. In Proceedings of the IEEE/CVF Conference on Computer Vision and Pattern Recognition (CVPR), Seattle, WA, USA, 14–19 June 2020; pp. 11973–11982. [Google Scholar]
- Chen, W.; Jia, X.; Chang, H.J.; Duan, J.; Shen, L.; Leonardis, A. FS-Net: Fast Shape-based Network for Category-Level 6D Object Pose Estimation with Decoupled Rotation Mechanism. In Proceedings of the IEEE/CVF Conference on Computer Vision and Pattern Recognition (CVPR), Virtual Event, 19–25 June 2021; pp. 1581–1590. [Google Scholar]
- Dong, Z.; Liu, S.; Zhou, T.; Cheng, H.; Zeng, L.; Yu, X.; Liu, H. PPR-Net: Point-wise pose regression network for instance segmentation and 6d pose estimation in bin-picking scenarios. In Proceedings of the 2019 IEEE/RSJ International Conference on Intelligent Robots and Systems (IROS), Macau, China, 4–8 November 2019; pp. 1773–1780. [Google Scholar]
- Zeng, L.; Lv, W.J.; Dong, Z.K.; Liu, Y.J. PPR-Net++: Accurate 6-D Pose Estimation in Stacked Scenarios. IEEE Trans. Autom. Sci. Eng. 2021. [Google Scholar] [CrossRef]
- Hinterstoisser, S.; Lepetit, V.; Ilic, S.; Holzer, S.; Bradski, G.; Konolige, K.; Navab, N. Model based training, detection and pose estimation of texture-less 3d objects in heavily cluttered scenes. In Proceedings of the Asian Conference on Computer Vision (ACCV), Daejeon, Korea, 5–9 November 2012; pp. 548–562. [Google Scholar]
- Tejani, A.; Tang, D.; Kouskouridas, R.; Kim, T.K. Latent-class hough forests for 3D object detection and pose estimation. In Proceedings of the European Conference on Computer Vision (ECCV), Zurich, Switzerland, 6–12 September 2014; pp. 462–477. [Google Scholar]
- Rennie, C.; Shome, R.; Bekris, K.E.; De Souza, A.F. A dataset for improved RGBD-based object detection and pose estimation for warehouse pick-and-place. IEEE Robot. Autom. Lett. 2016, 1, 1179–1185. [Google Scholar] [CrossRef] [Green Version]
- Eppner, C.; Höfer, S.; Jonschkowski, R.; Martín-Martín, R.; Sieverling, A.; Wall, V.; Brock, O. Lessons from the amazon picking challenge: Four aspects of building robotic systems. In Proceedings of the Robotics: Science and Systems, Ann Arbor, MI, USA, 18–22 June 2016. [Google Scholar]
- Xiang, Y.; Schmidt, T.; Narayanan, V.; Fox, D. PoseCNN: A Convolutional Neural Network for 6D Object Pose Estimation in Cluttered Scenes. In Proceedings of the Robotics: Science and Systems, Pittsburgh, PA, USA, 26–30 June 2018. [Google Scholar]
- Berk, C.; Arjun, S.; Aaron, W.; Siddhartha, S.; Pieter, A.; Aaron, M.D. The YCB object and model set: Towards common benchmarks for manipulation research. In Proceedings of the International Conference on Advanced Robotics (ICAR), Istanbul, Turkey, 27–31 July 2015; pp. 510–517. [Google Scholar]
- Liu, X.; Iwase, S.; Kitani, K.M. StereOBJ-1M: Large-scale Stereo Image Dataset for 6D Object Pose Estimation. In Proceedings of the IEEE/CVF International Conference on Computer Vision (ICCV), Montreal, QC, Canada, 11–17 October 2021; pp. 10870–10879. [Google Scholar]
- Hodan, T.; Haluza, P.; Obdržálek, Š.; Matas, J.; Lourakis, M.; Zabulis, X. T-LESS: An RGB-D dataset for 6D pose estimation of texture-less objects. In Proceedings of the 2017 IEEE Winter Conference on Applications of Computer Vision (WACV), Santa Rosa, CA, USA, 24–31 March 2017; pp. 880–888. [Google Scholar]
- Brégier, R.; Devernay, F.; Leyrit, L.; Crowley, J.L. Symmetry aware evaluation of 3d object detection and pose estimation in scenes of many parts in bulk. In Proceedings of the IEEE International Conference on Computer Vision Workshops (ICCV), Venice, Italy, 22–29 October 2017; pp. 2209–2218. [Google Scholar]
- Kleeberger, K.; Landgraf, C.; Huber, M.F. Large-scale 6d object pose estimation dataset for industrial bin-picking. In Proceedings of the 2019 IEEE/RSJ International Conference on Intelligent Robots and Systems (IROS), Macau, China, 4–8 November 2019; pp. 2573–2578. [Google Scholar]
- Lepetit, V.; Moreno-Noguer, F.; Fua, P. Epnp: An accurate o(n) solution to the pnp problem. Int. J. Comput. Vis. 2009, 81, 155. [Google Scholar] [CrossRef] [Green Version]
- Arun, K.S.; Huang, T.S.; Blostein, S.D. Least-squares fitting of two 3-D point sets. IEEE Trans. Pattern Anal. Mach. Intell. 1987, 5, 698–700. [Google Scholar] [CrossRef] [PubMed] [Green Version]
- Umeyama, S. Least-squares estimation of transformation parameters between two point patterns. IEEE Trans. Pattern Anal. Mach. Intell. 1991, 13, 376–380. [Google Scholar] [CrossRef] [Green Version]
- Shotton, J.; Glocker, B.; Zach, C.; Izadi, S.; Criminisi, A.; Fitzgibbon, A. Scene coordinate regression forests for camera relocalization in RGB-D images. In Proceedings of the IEEE Conference on Computer Vision and Pattern Recognition (CVPR), Portland, OR, USA, 23–28 June 2013; pp. 2930–2937. [Google Scholar]
- Li, Y.; Wang, G.; Ji, X.; Xiang, Y.; Fox, D. Deepim: Deep iterative matching for 6d pose estimation. In Proceedings of the European Conference on Computer Vision (ECCV), Munich, Germany, 8–14 September 2018; pp. 683–698. [Google Scholar]
- Qi, C.R.; Su, H.; Mo, K.; Guibas, L.J. Pointnet: Deep learning on point sets for 3d classification and segmentation. In Proceedings of the IEEE Conference on Computer Vision and Pattern Recognition (CVPR), Honolulu, HI, USA, 21–26 June 2017; pp. 652–660. [Google Scholar]
- Qi, C.R.; Yi, L.; Su, H.; Guibas, L.J. Pointnet++: Deep hierarchical feature learning on point sets in a metric space. arXiv 2017, arXiv:1706.02413. [Google Scholar]
- Jiang, M.; Wu, Y.; Zhao, T.; Zhao, Z.; Lu, C. Pointsift: A sift-like network module for 3d point cloud semantic segmentation. arXiv 2018, arXiv:1807.00652. [Google Scholar]
- Chen, W.; Jia, X.; Chang, H.J.; Duan, J.; Leonardis, A. G2l-net: Global to local network for real-time 6d pose estimation with embedding vector features. In Proceedings of the IEEE/CVF Conference on Computer Vision and Pattern Recognition (CVPR), Seattle, WA, USA, 14–19 June 2020; pp. 4233–4242. [Google Scholar]
- Gao, G.; Lauri, M.; Zhang, J.; Frintrop, S. Occlusion resistant object rotation regression from point cloud segments. In Proceedings of the European Conference on Computer Vision (ECCV) Workshops, Munich, Germany, 8–14 September 2018. [Google Scholar]
- Brégier, R.; Devernay, F.; Leyrit, L.; Crowley, J.L. Defining the pose of any 3d rigid object and an associated distance. Int. J. Comput. Vis. 2018, 126, 571–596. [Google Scholar] [CrossRef] [Green Version]


Publisher’s Note: MDPI stays neutral with regard to jurisdictional claims in published maps and institutional affiliations. |
© 2021 by the authors. Licensee MDPI, Basel, Switzerland. This article is an open access article distributed under the terms and conditions of the Creative Commons Attribution (CC BY) license (https://creativecommons.org/licenses/by/4.0/).