
Activation of the Hippo Pathway in Rana sylvatica: Yapping Stops in Response to Anoxia


Abstract
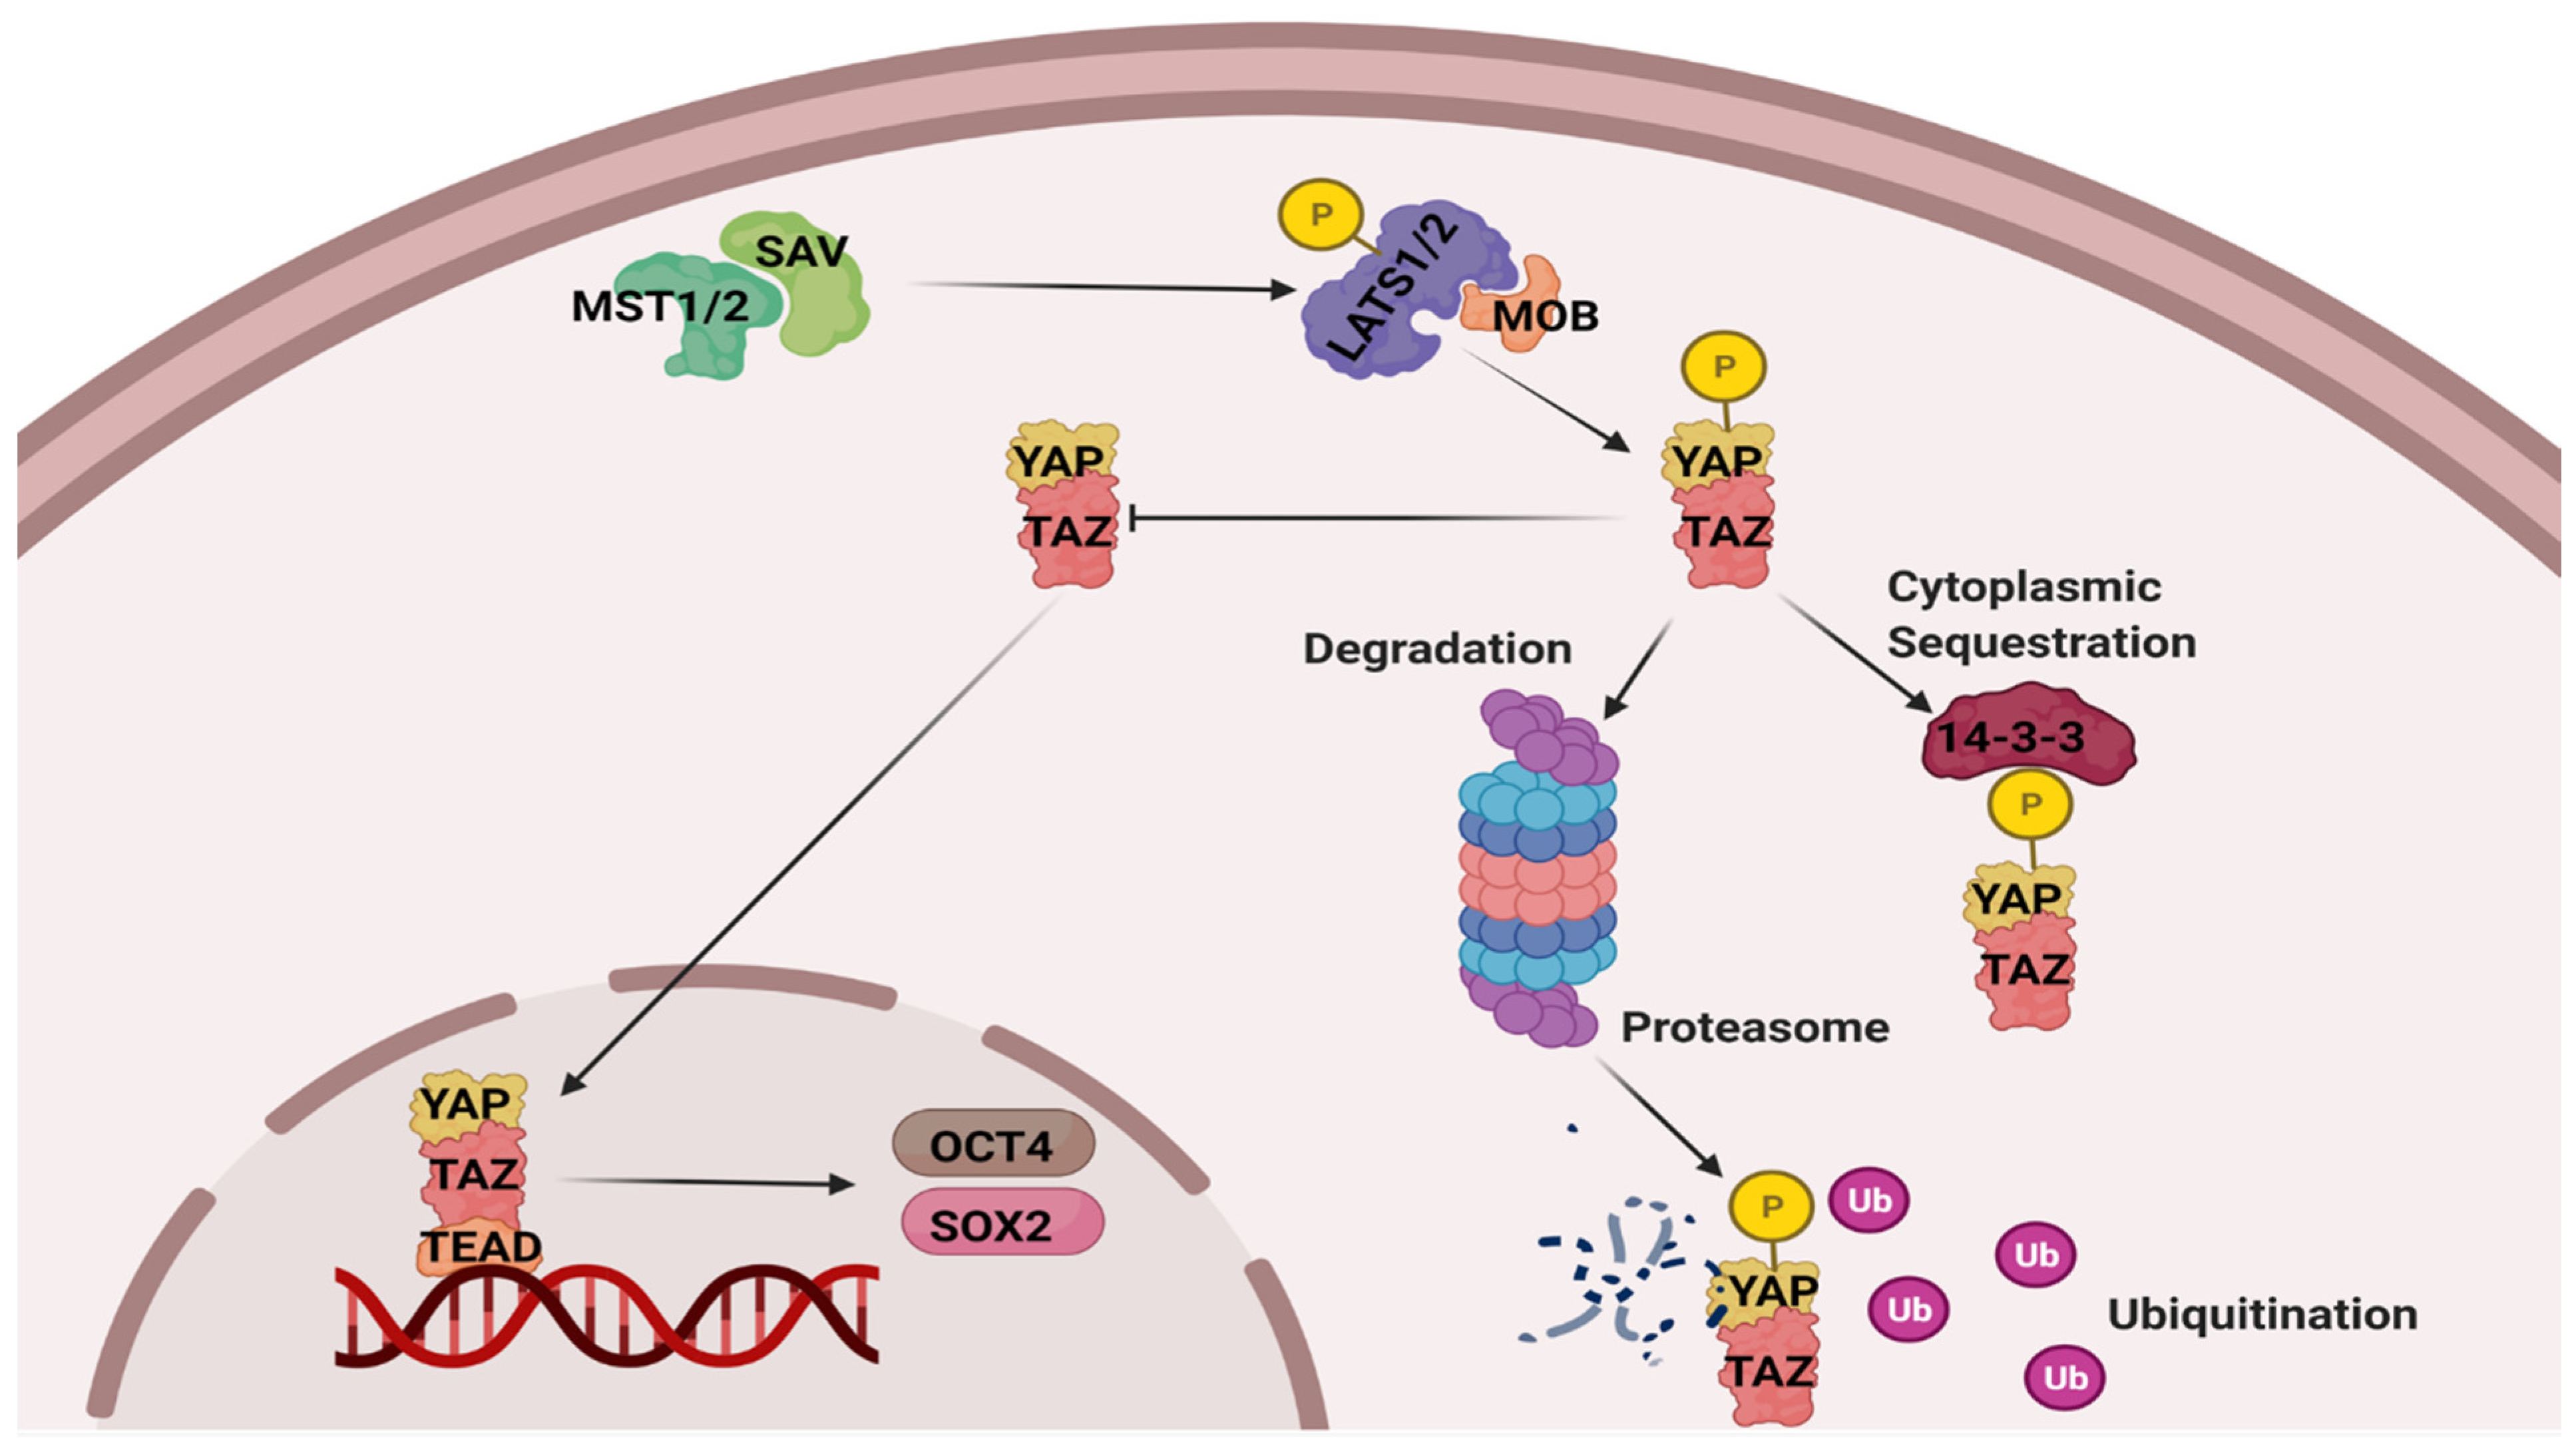
:1. Introduction
2. Materials and Methods
2.1. Animal Treatment
2.2. Total Protein Extractions for Immunoblots
2.3. Nuclear Protein Extractions for Immunoblots
2.4. SDS PAGE and Western Blotting
2.5. Total Protein Extractions for TF ELISA
2.6. DNA-Binding Activity Using TF ELISA
- TEAD (5′Biotin-TGCCTAAATTTGGAATGTTCTGCT 3′)
- TEAD complementary (5′ AGCAGAACATTCCAAATTTAGGCA 3′)
2.7. RNA Isolation and cDNA Synthesis
2.8. Primer Design and qPCR
- mst1:
- Forward 5′ GTTGGGGCATGTGAGGGAGACT 3′Reverse 5′ CTCTGGCGGGCACAATGACAC 3′
- mst2:
- Forward 5′ GAAGGGAAGCCGCCGTATGC 3′Reverse 5′ TGGGTGGTGGATTTGTGGGGA 3′
- sav:
- Forward 5′ GAAAGAGACCTCCCCGCTGCT 3′Reverse 5′ TGGGCAGATATCAGTCCGTCTCG 3′
- taz:
- Forward 5′ GGACACGCCGCTCATCACA 3′Reverse 5′ GTGCAAGTTCCACAGGTGCTTT 3′
- tead:
- Forward 5′ CGTTTGGGAAACAAGTCGTGGAG 3′Reverse 5′ ACATCGGGGAGCGGTTTATCC 3′
- yap:
- Forward 5′ TGCCCATGCGGATGAGGAAAC 3′Reverse 5′ GCTGATCCCCCATCTGTGCTG 3′
- β-actin:
- Forward 5′-AGAAGTCGTGCCAGGCATCA-3′Reverse 5′-AGGAGGAAGCTATCCGTGTT-3′
- β-actin: 95 °C for 3 min and then 40 cycles of (95 °C 20 s, 53.8 °C 30 s, and 72 °C 20 s)
- mst1, mst2, sav, taz, and tead: 95 °C 3 min and then 40 cycles of (95 °C 20 s, 54.3 °C 30 s, and 72 °C 20 s)
- yap: 95 °C 3 min and then 40 cycles of (95 °C 10 s, 52.0 °C 30 s, and 72 °C 20 s)
Statistical Analysis
3. Results
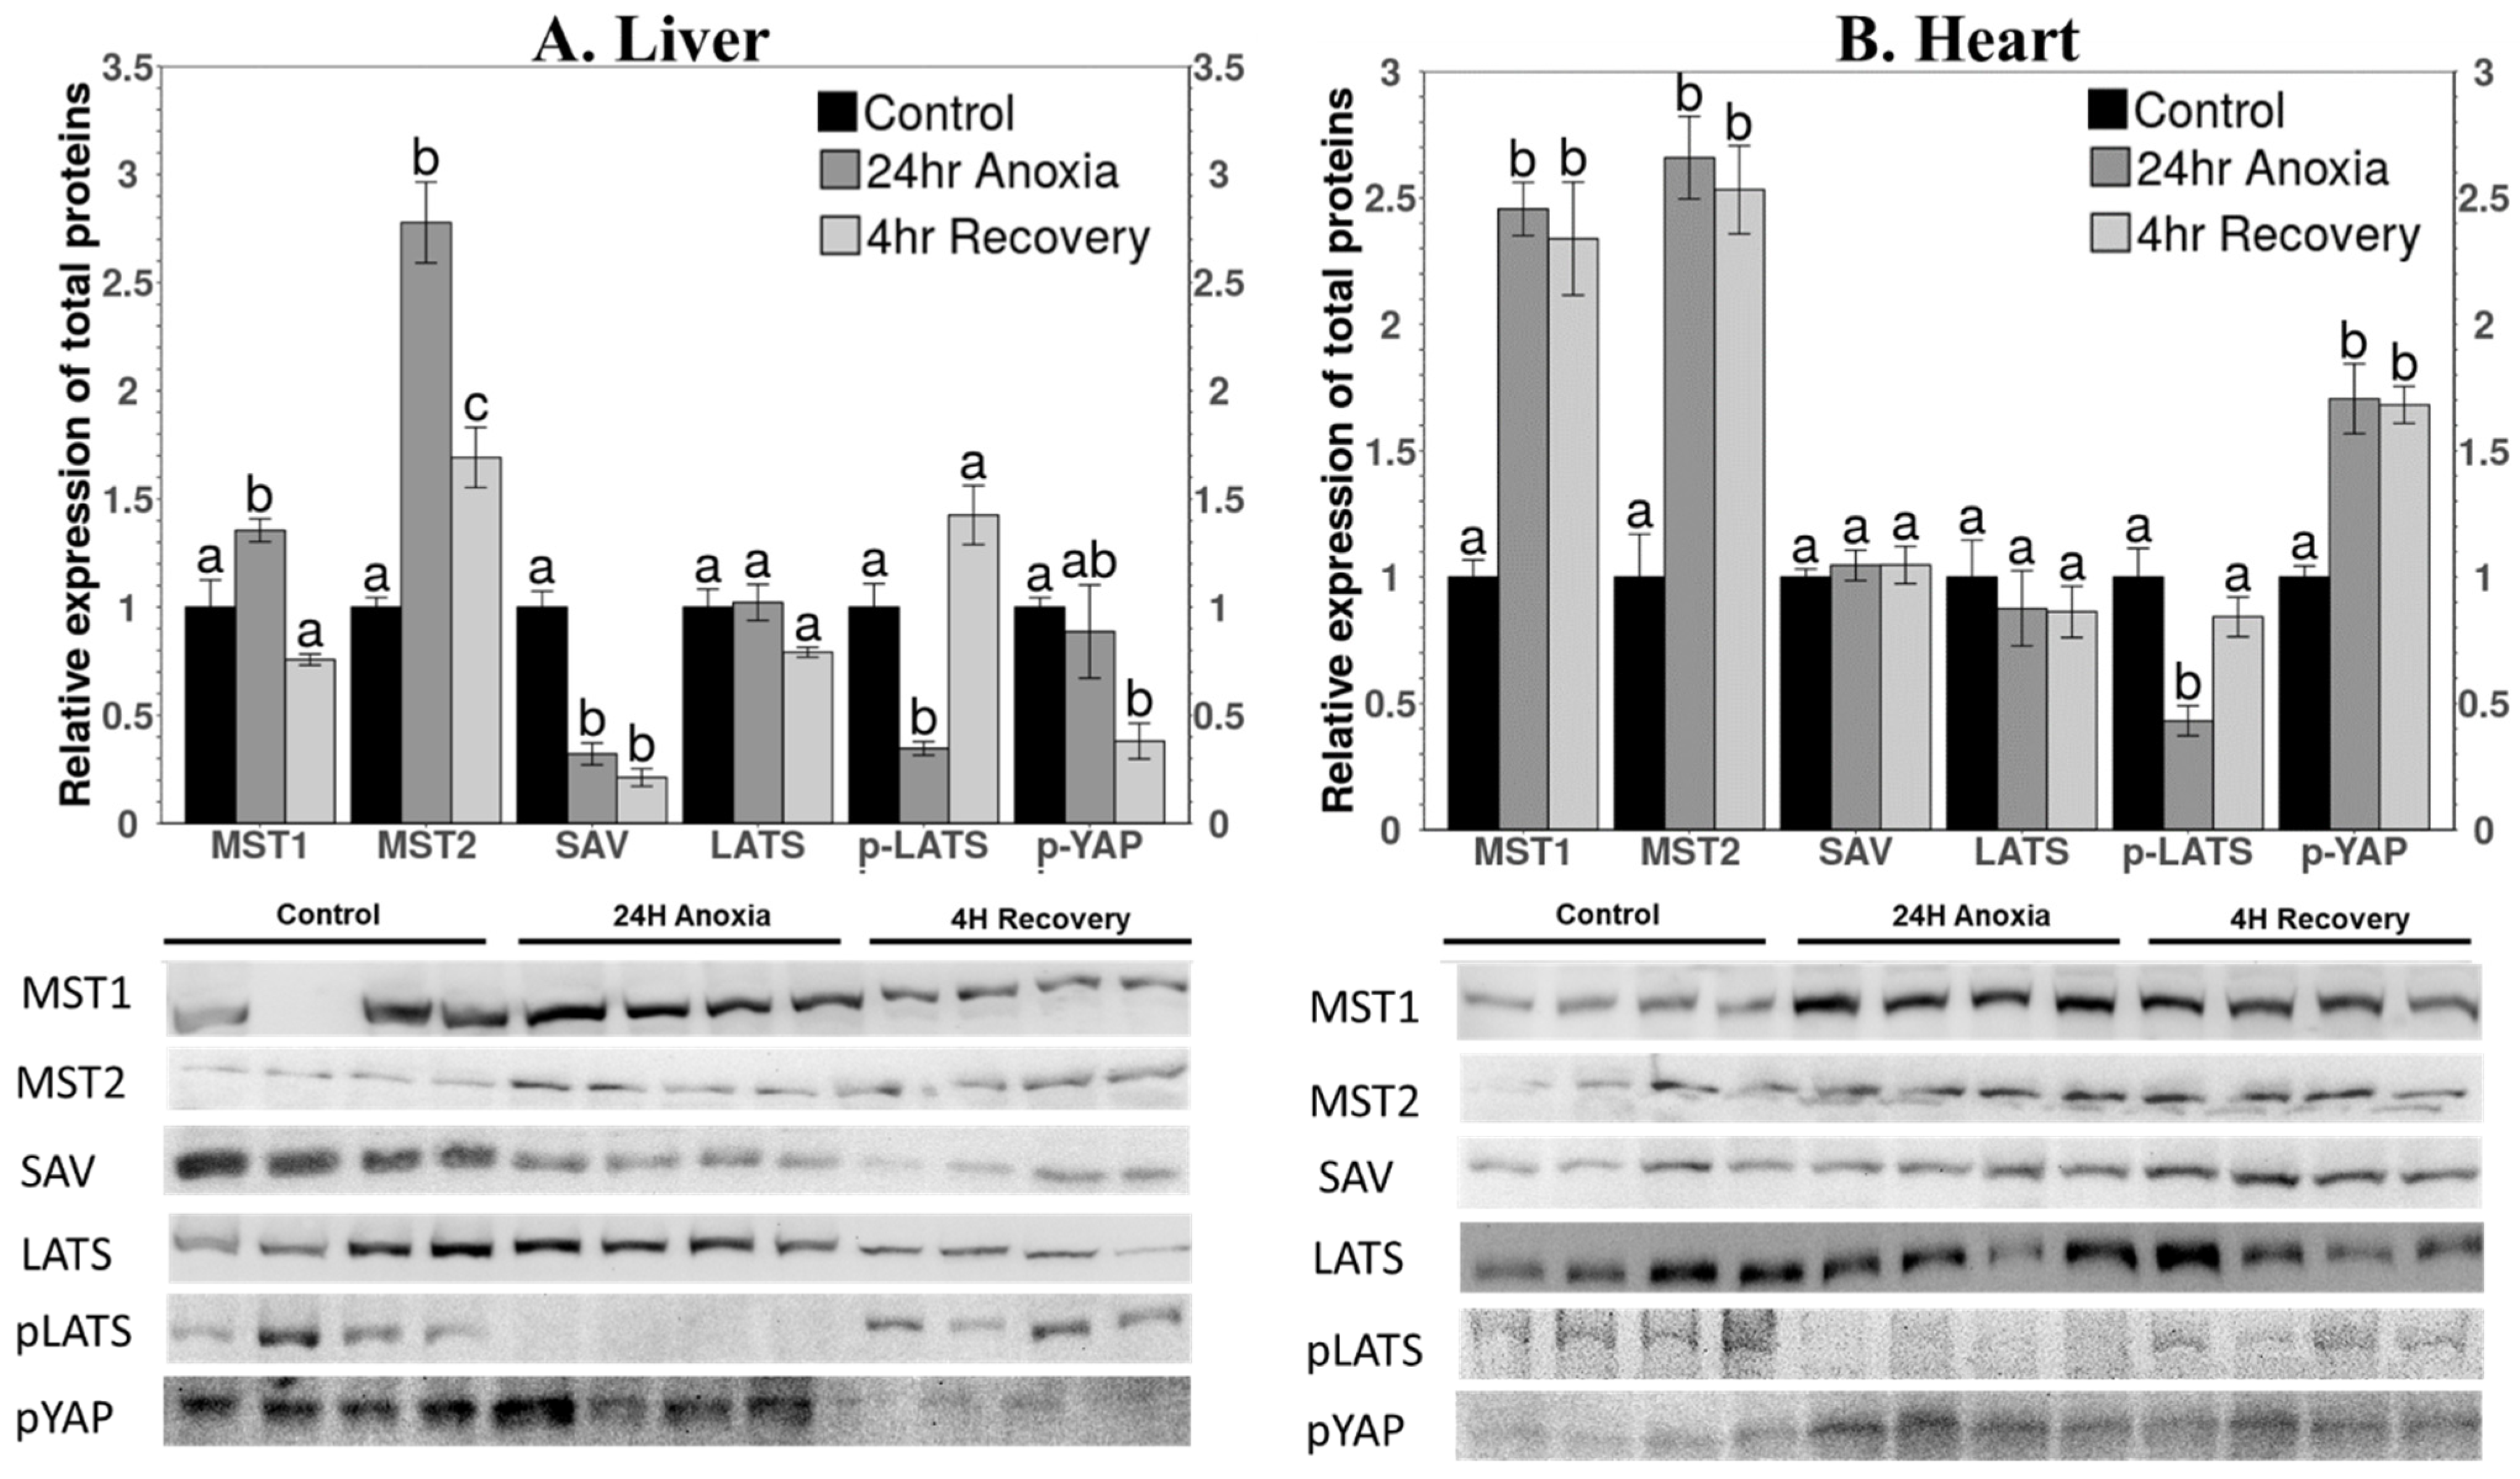
3.1. Protein Levels of Cytoplasmic Components of the Hippo Pathway
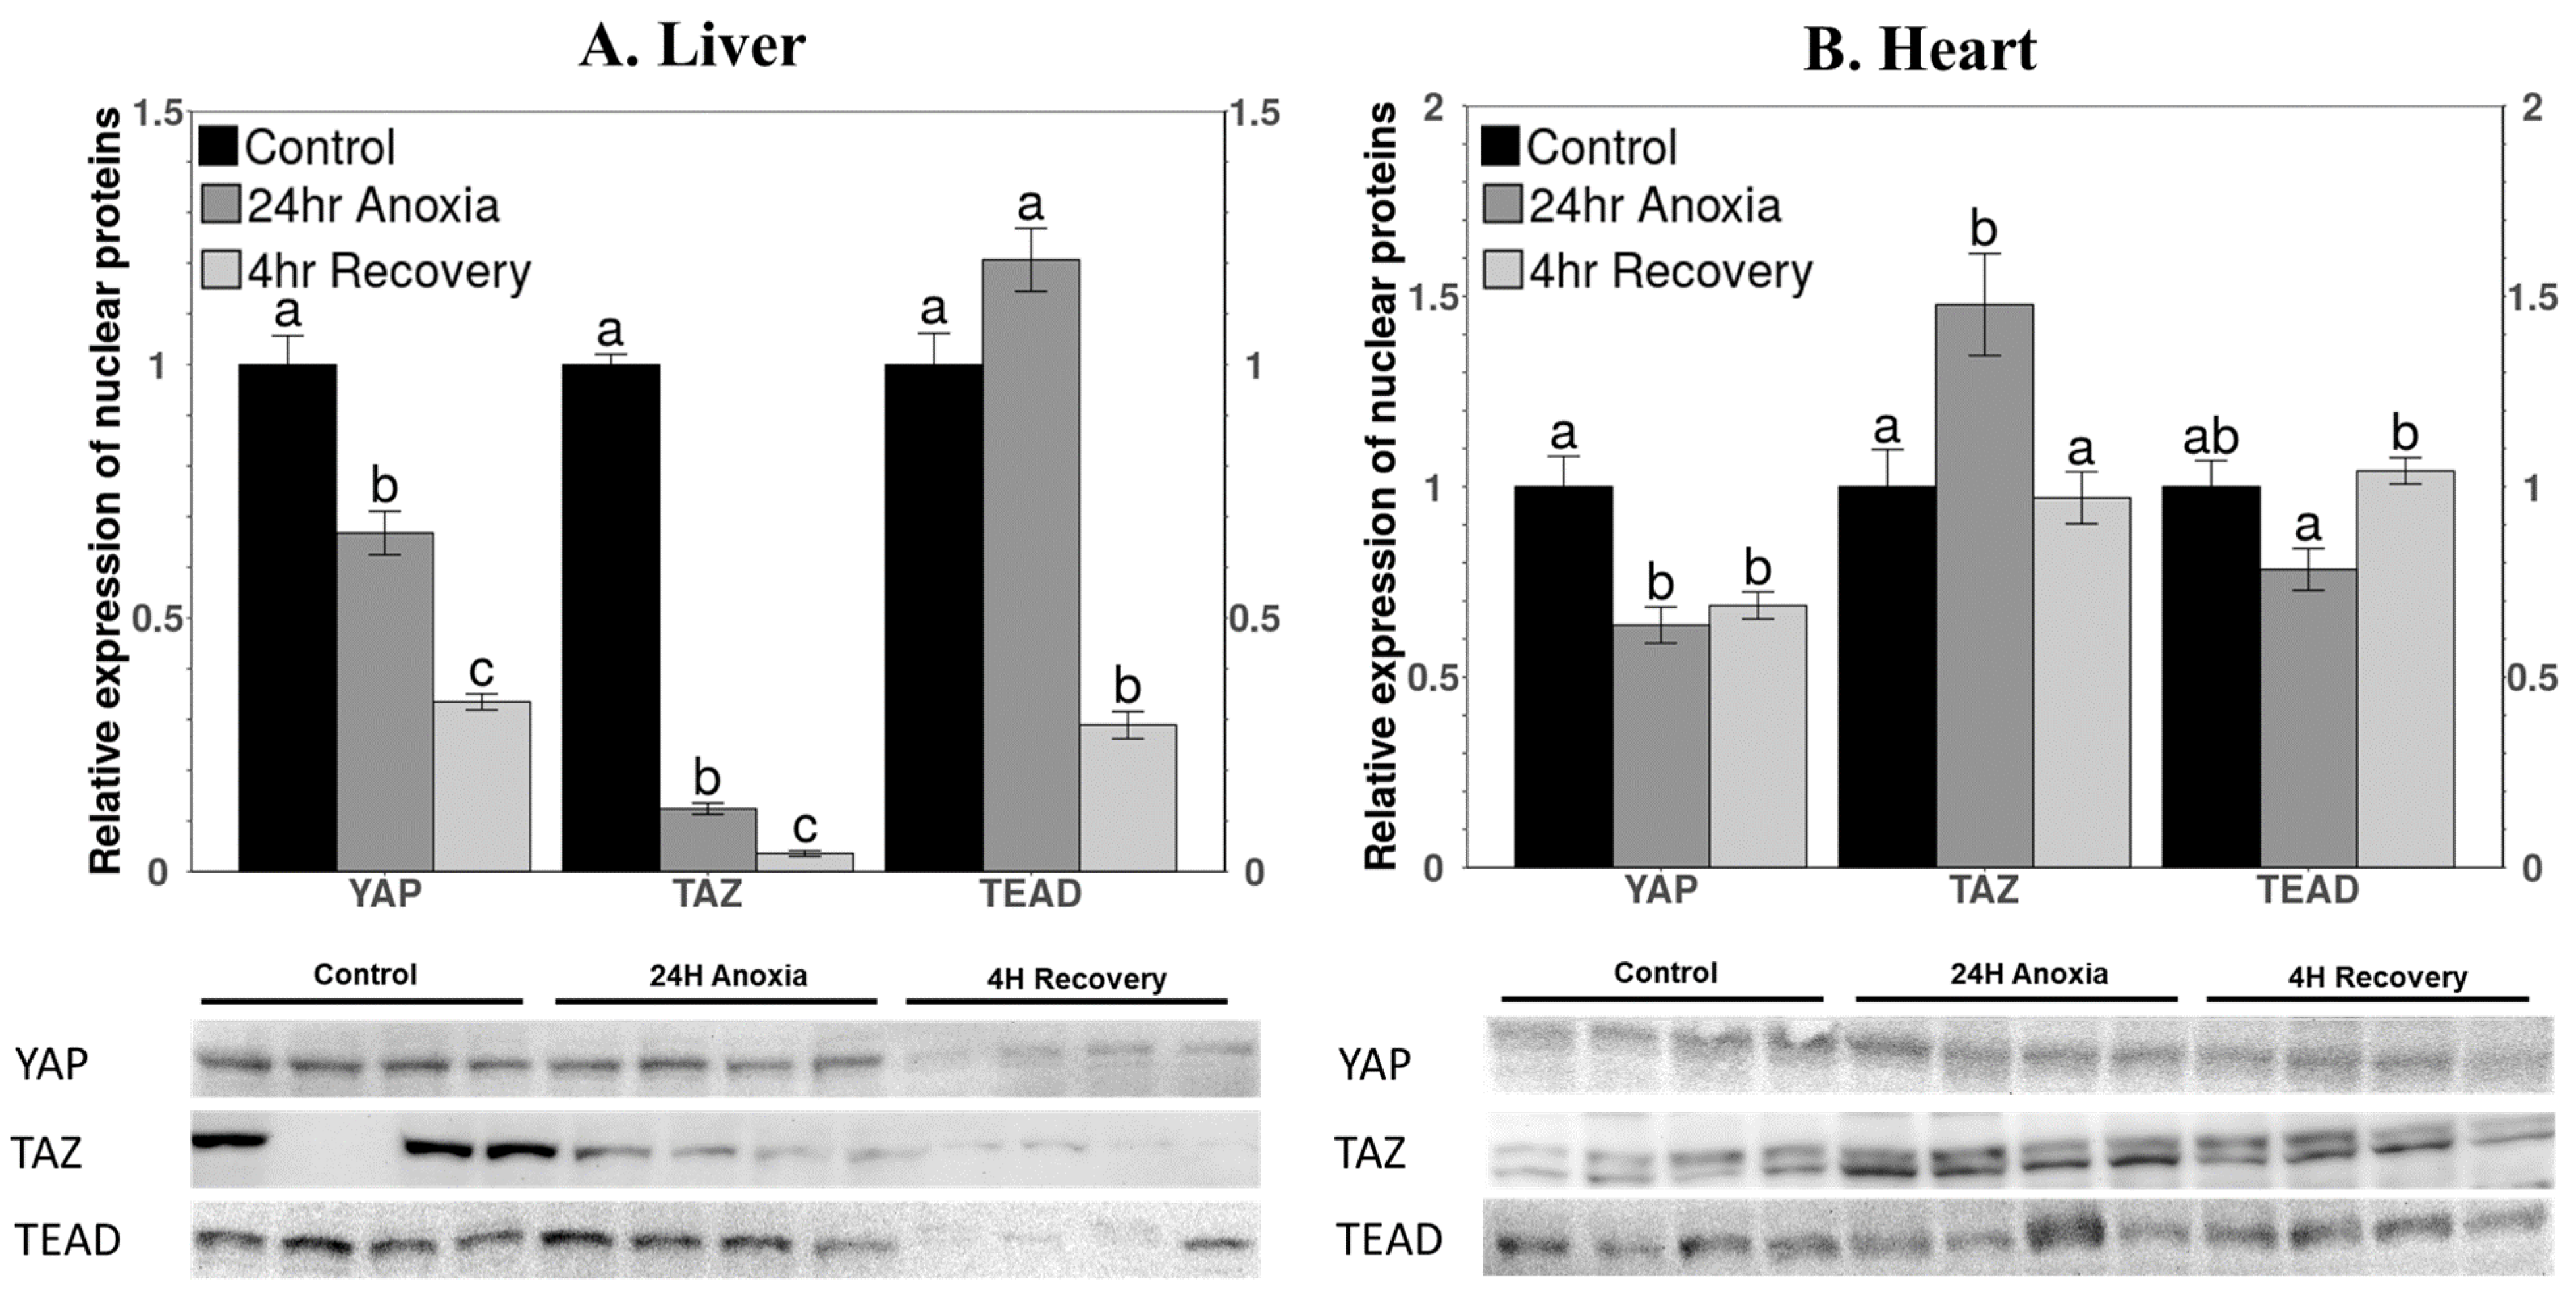
3.2. Protein Levels of Nuclear Components of the Hippo Pathway
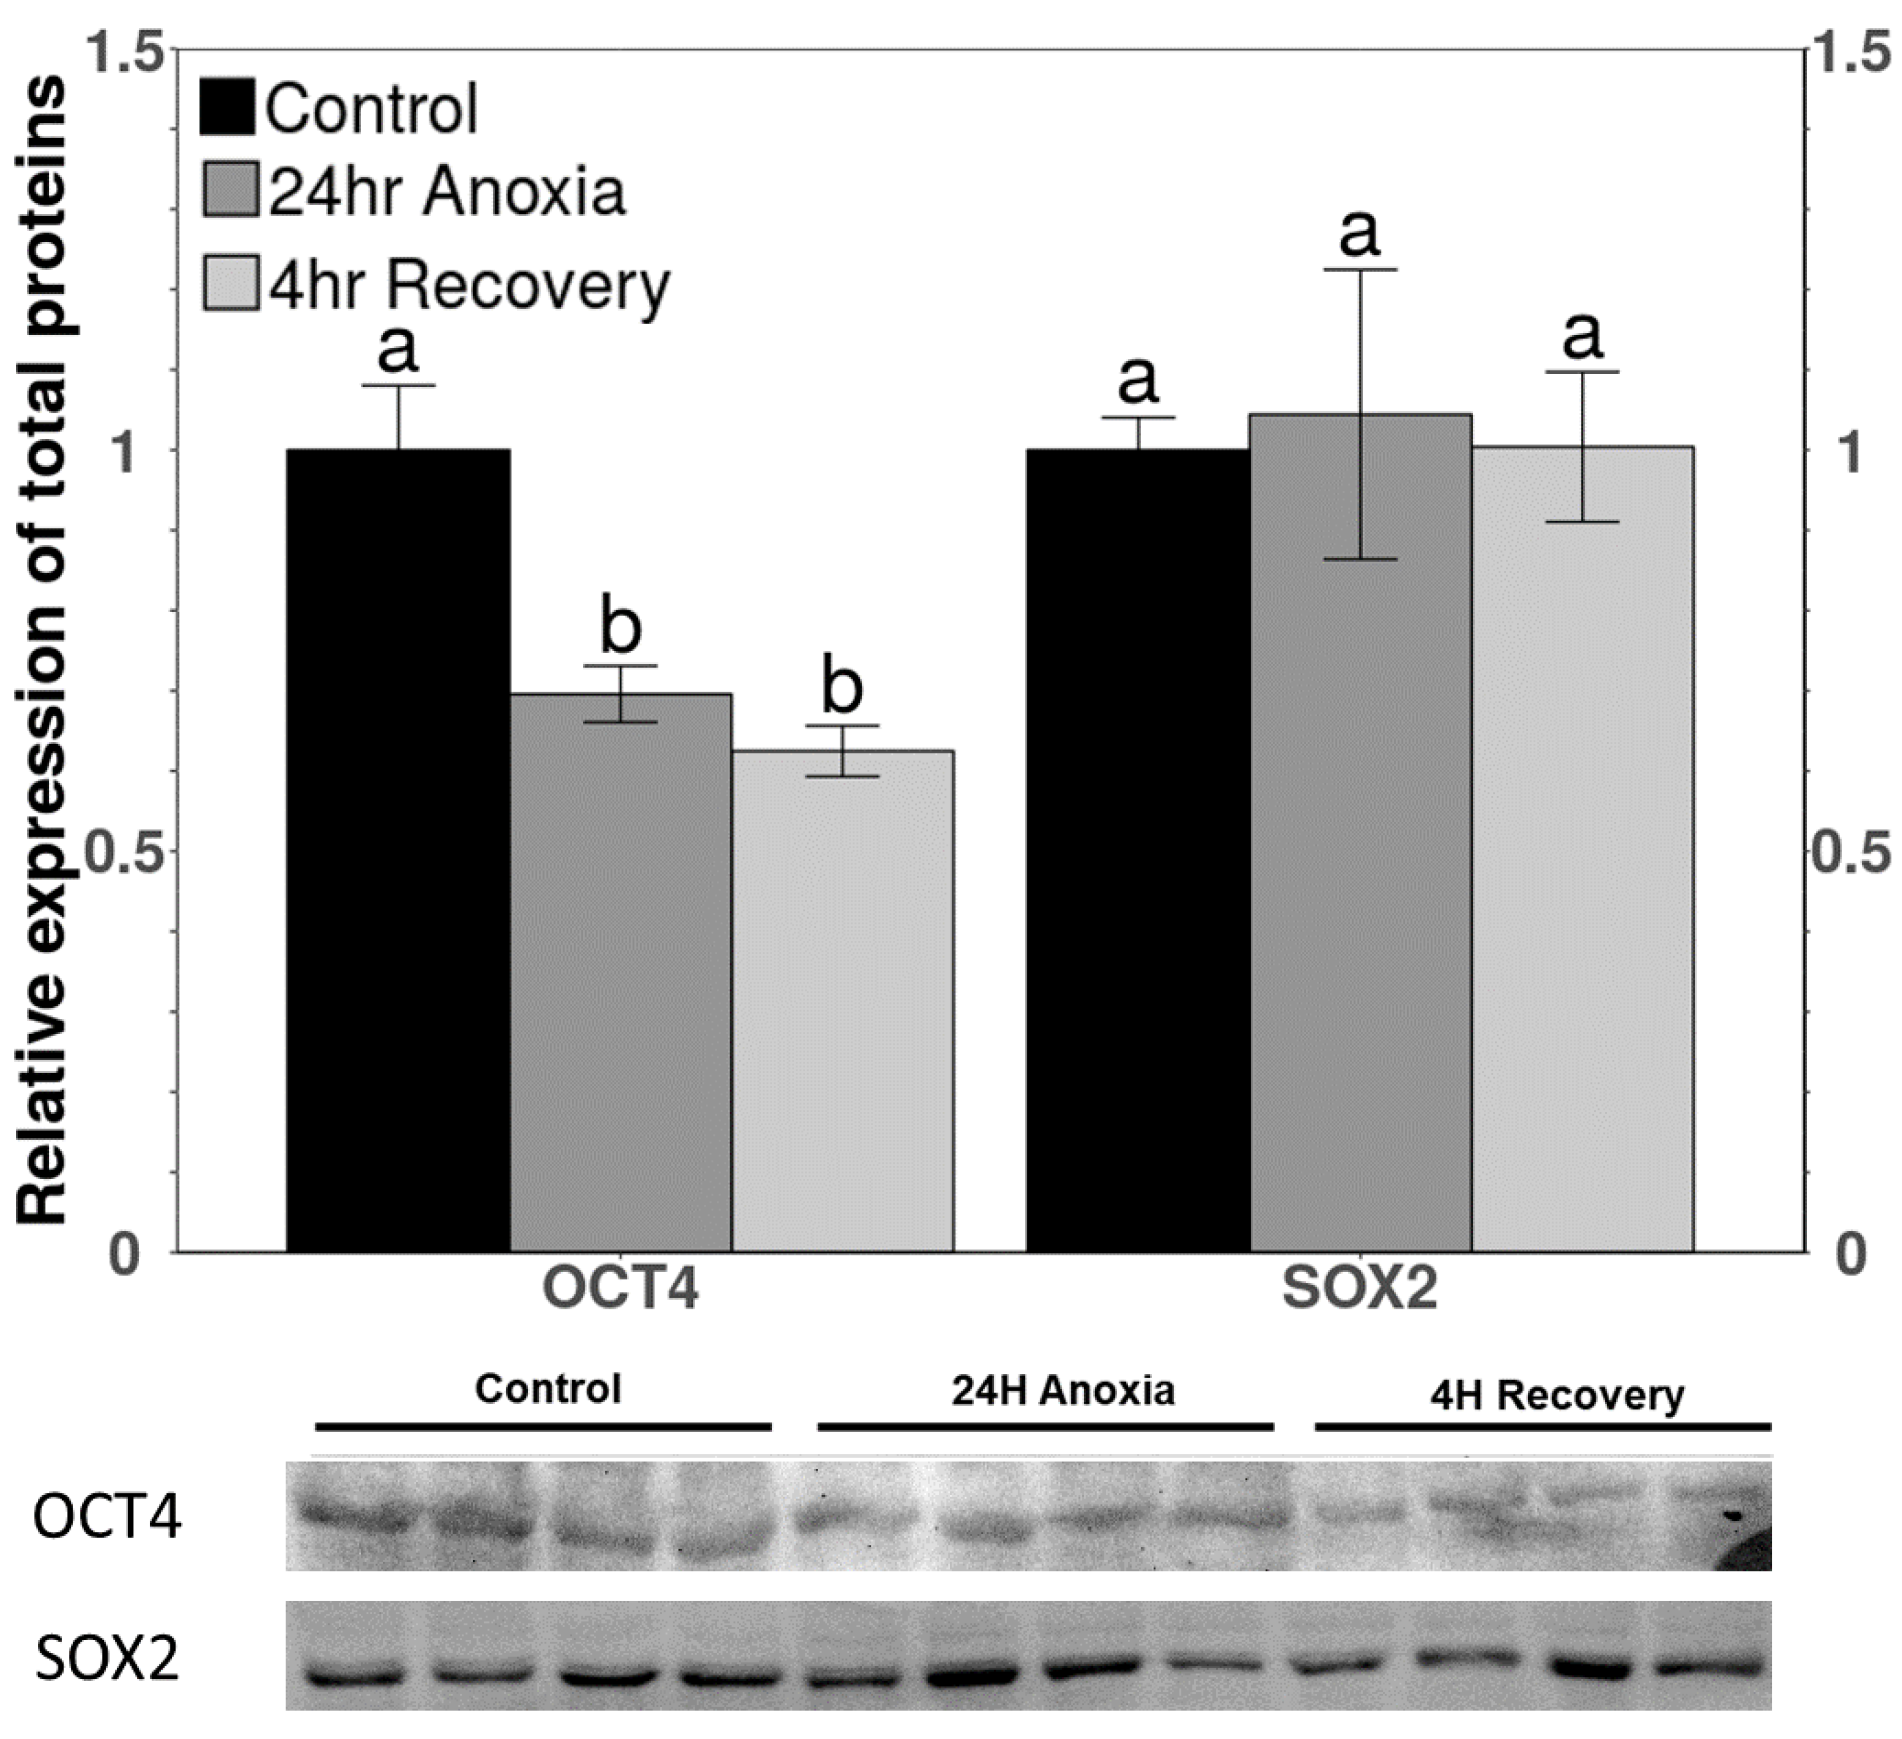
3.3. Protein Levels of OCT4 and SOX2 Downstream Targets
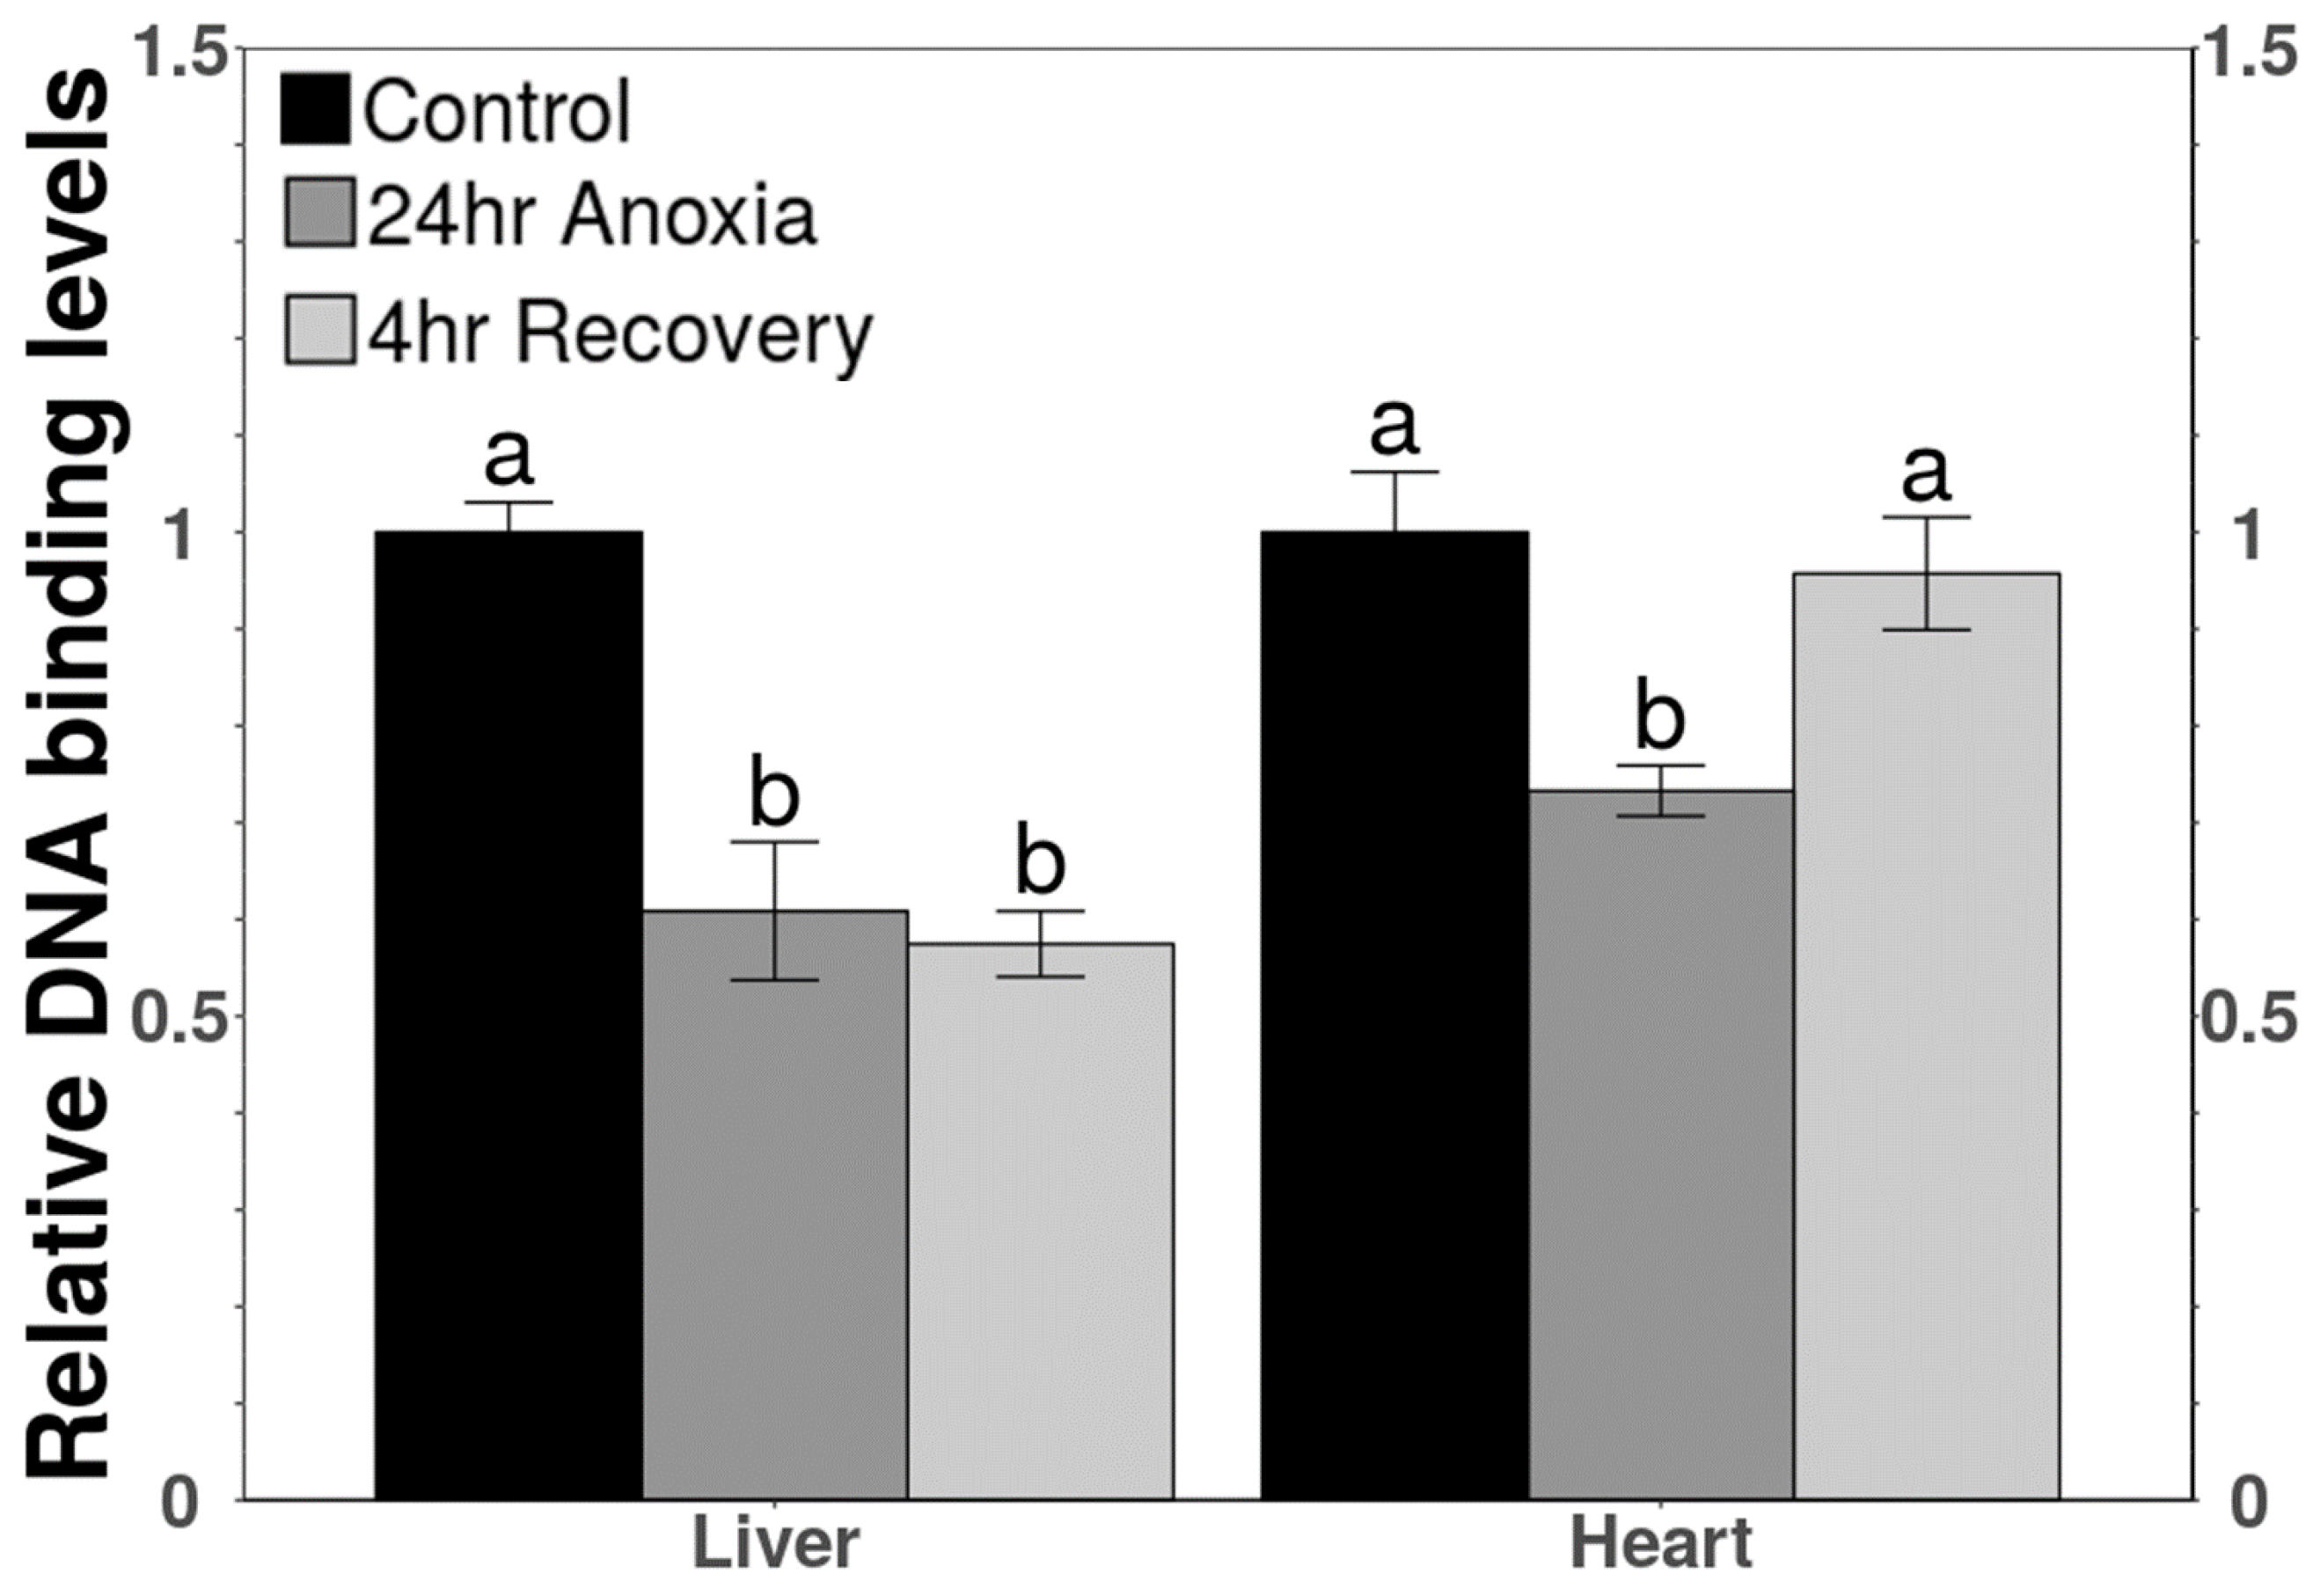
3.4. DNA-Binding Activity of TEAD
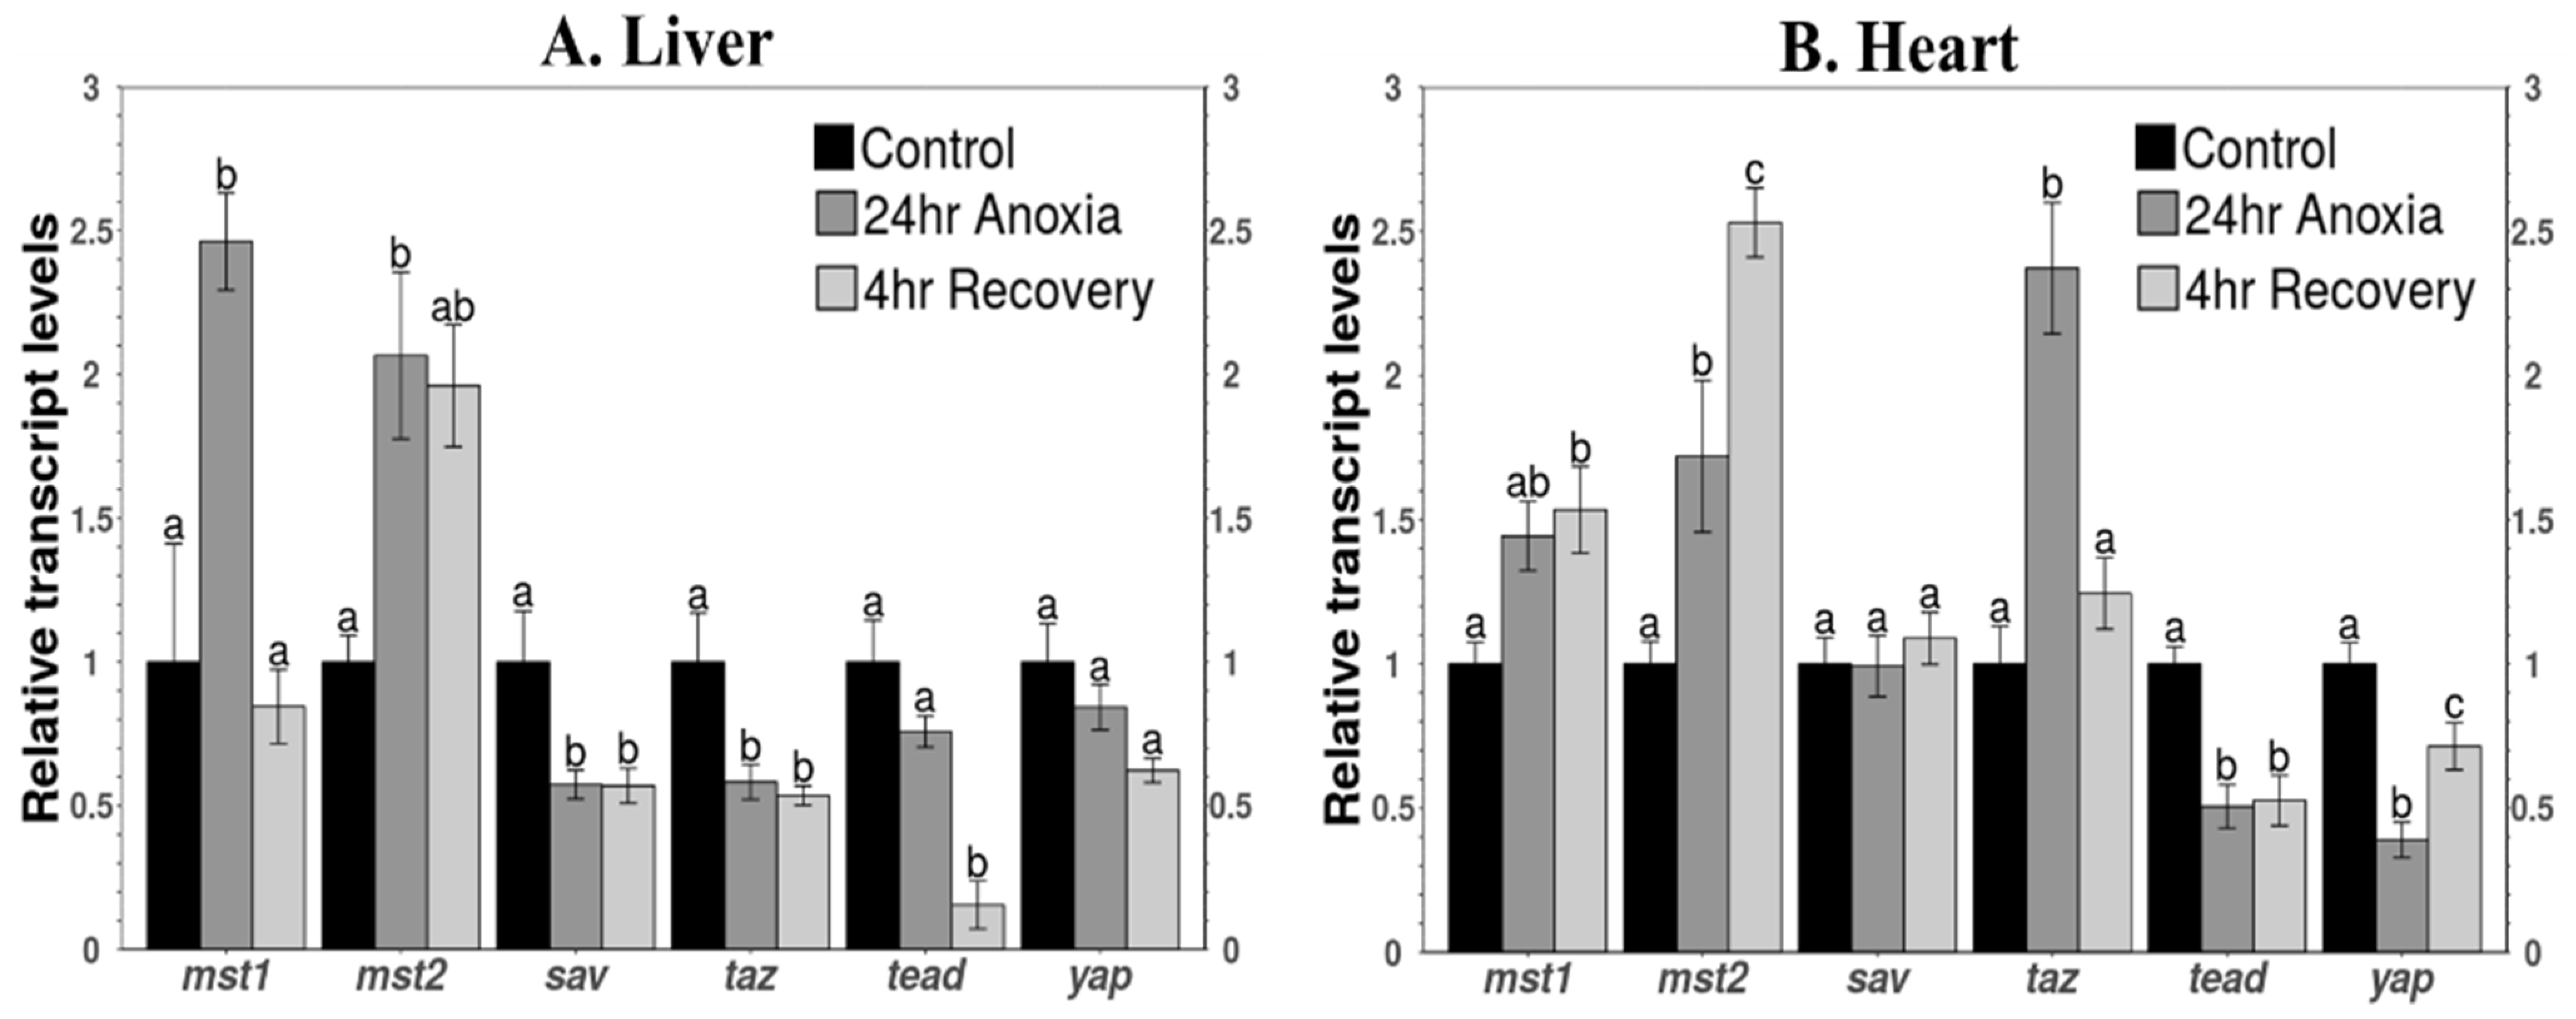
3.5. Transcript Levels of Key Components of the Pathway
4. Discussion
Supplementary Materials
Author Contributions
Funding
Institutional Review Board Statement
Data Availability Statement
Acknowledgments
Conflicts of Interest
References
- Storey, K.B.; Storey, J.M. Molecular physiology of freeze tolerance in vertebrates. Physiol. Rev. 2017, 97, 623–665. [Google Scholar] [CrossRef]
- Storey, K.B.; Storey, J.M. Molecular biology of freezing tolerance. Compr. Physiol. 2013, 3, 1283–1308. [Google Scholar] [CrossRef] [PubMed]
- Storey, K.B. Organ-specific metabolism during freezing and thawing in a freeze-tolerant frog. Am. J. Physiol. 1987, 253, 292–297. [Google Scholar] [CrossRef] [PubMed]
- Storey, K.B.; Storey, J.M. Freeze tolerant frogs: Cryoprotectants and tissue metabolism during freeze–thaw cycles. Can. J. Zool. 1986, 64, 49–56. [Google Scholar] [CrossRef]
- Storey, K.B. Survival under stress: Molecular mechanisms of metabolic rate depression in animals. S. Afr. J. Zool. 1998, 33, 55–64. [Google Scholar] [CrossRef] [Green Version]
- Storey, K.B. Molecular mechanisms of anoxia tolerance. Int. Congr. Ser. 2004, 1275, 47–54. [Google Scholar] [CrossRef]
- Storey, J.M.; Wu, S.; Storey, K.B. Mitochondria and the Frozen Frog. Antioxidants 2021, 10, 543. [Google Scholar] [CrossRef] [PubMed]
- Hermes-Lima, M.; Moreira, D.C.; Rivera-Ingraham, G.A.; Giraud-Billoud, M.; Genaro-Mattos, T.C.; Campos, É.G. Preparation for oxidative stress under hypoxia and metabolic depression: Revisiting the proposal two decades later. Free Radic. Biol. Med. 2015, 89, 1122–1143. [Google Scholar] [CrossRef]
- Shao, D.; Zhai, P.; Del Re, D.P.; Sciarretta, S.; Yabuta, N.; Nojima, H.; Lim, D.-S.; Pan, D.; Sadoshima, J. A functional interaction between Hippo-YAP signalling and FoxO1 mediates the oxidative stress response. Nat. Commun. 2014, 5, 3315. [Google Scholar] [CrossRef] [Green Version]
- Mao, B.; Gao, Y.; Bai, Y.; Yuan, Z. Hippo signaling in stress response and homeostasis maintenance. Acta Biochim. Biophys. Sin. 2015, 47, 2–9. [Google Scholar] [CrossRef] [Green Version]
- Michiue, T.; Yamamoto, T.; Yasuoka, Y.; Goto, T.; Ikeda, T.; Nagura, K.; Nakayama, T.; Taira, M.; Kinoshita, T. High variability of expression profiles of homeologous genes for Wnt, Hh, Notch, and Hippo signaling pathways in Xenopus laevis. Dev. Biol. 2017, 426, 270–290. [Google Scholar] [CrossRef] [PubMed]
- Hayashi, S.; Tamura, K.; Yokoyama, H. Yap1, transcription regulator in the Hippo signaling pathway, is required for Xenopus limb bud regeneration. Dev. Biol. 2014, 388, 57–67. [Google Scholar] [CrossRef] [Green Version]
- Nejigane, S.; Takahashi, S.; Haramoto, Y.; Michiue, T.; Asashima, M. Hippo signaling components, Mst1 and Mst2, act as a switch between self-renewal and differentiation in Xenopus hematopoietic and endothelial progenitors. Int. J. Dev. Biol. 2013, 57, 407–414. [Google Scholar] [CrossRef] [PubMed] [Green Version]
- Nejigane, S.; Haramoto, Y.; Okuno, M.; Takahashi, S.; Asashima, M. The transcriptional coactivators Yap and TAZ are expressed during early Xenopus development. Int. J. Dev. Biol. 2011, 55, 121–126. [Google Scholar] [CrossRef]
- Meng, Z.; Moroishi, T.; Guan, K.-L. Mechanisms of Hippo pathway regulation. Genes Dev. 2016, 30, 1–17. [Google Scholar] [CrossRef] [PubMed] [Green Version]
- Piccolo, S.; Dupont, S.; Cordenonsi, M. The biology of YAP/TAZ: Hippo signaling and beyond. Physiol. Rev. 2014, 94, 1287–1312. [Google Scholar] [CrossRef] [PubMed]
- Cai, W.F.; Wang, L.; Liu, G.S.; Zhu, P.; Paul, C.; Wang, Y. Manipulating the hippo-yap signal cascade in stem cells for heart regeneration. Ann. Palliat. Med. 2016, 5, 125–134. [Google Scholar] [CrossRef]
- Basta, J.; Rauchman, M. The nucleosome remodeling and deacetylase complex in development and disease. Transl. Res. 2015, 165, 36–47. [Google Scholar] [CrossRef] [PubMed] [Green Version]
- Tantin, D. OCT transcription factors in development and stem cells: Insights and mechanisms. Development 2013, 140, 2857–2866. [Google Scholar] [CrossRef] [Green Version]
- Gupta, A.; Storey, K.B. Regulation of antioxidant systems in response to anoxia and reoxygenation in Rana sylvatica. Comp. Biochem. Physiol. Part B Biochem. Mol. Biol. 2020, 243–244, 110436. [Google Scholar] [CrossRef] [PubMed]
- Beyer, T.A.; Weiss, A.; Khomchuk, Y.; Huang, K.; Ogunjimi, A.A.; Varelas, X.; Wrana, J.L. Switch Enhancers Interpret TGF-β and Hippo Signaling to Control Cell Fate in Human Embryonic Stem Cells. Cell Rep. 2013, 5, 1611–1624. [Google Scholar] [CrossRef] [Green Version]
- Kim, W.; Cho, Y.S.; Wang, X.; Park, O.; Ma, X.; Kim, H.; Gan, W.; Jho, E.; Cha, B.; Jeung, Y.; et al. Hippo signaling is intrinsically regulated during cell cycle progression by APC/C Cdh1. Proc. Natl. Acad. Sci. USA 2019, 116, 9423–9432. [Google Scholar] [CrossRef] [PubMed] [Green Version]
- Zhou, D.; Conrad, C.; Xia, F.; Park, J.-S.; Payer, B.; Yin, Y.; Lauwers, G.Y.; Thasler, W.; Lee, J.T.; Avruch, J.; et al. Mst1 and Mst2 Maintain Hepatocyte Quiescence and Suppress Hepatocellular Carcinoma Development through Inactivation of the Yap1 Oncogene. Cancer Cell 2009, 16, 425–438. [Google Scholar] [CrossRef] [PubMed] [Green Version]
- Zhou, D.; Zhang, Y.; Wu, H.; Barry, E.; Yin, Y.; Lawrence, E.; Dawson, D.; Willis, J.E.; Markowitz, S.D.; Camargo, F.D.; et al. Mst1 and Mst2 protein kinases restrain intestinal stem cell proliferation and colonic tumorigenesis by inhibition of Yes-associated protein (Yap) overabundance. Proc. Natl. Acad. Sci. USA 2011, 108, E1312–E1320. [Google Scholar] [CrossRef] [PubMed] [Green Version]
- Xin, M.; Kim, Y.; Sutherland, L.B.; Murakami, M.; Qi, X.; McAnally, J.; Porrello, E.R.; Mahmoud, A.I.; Tan, W.; Shelton, J.M.; et al. Hippo pathway effector Yap promotes cardiac regeneration. Proc. Natl. Acad. Sci. USA 2013, 110, 13839–13844. [Google Scholar] [CrossRef] [Green Version]
- Fallahi, E.; O’Driscoll, N.A.; Matallanas, D. The MST/Hippo pathway and cell death: A non-canonical affair. Genes 2016, 7, 28. [Google Scholar] [CrossRef]
- Misra, J.R.; Irvine, K.D. The Hippo Signaling Network and Its Biological Functions. Annu. Rev. Genet. 2018, 52, 65–87. [Google Scholar] [CrossRef] [PubMed]
- Halder, G.; Johnson, R.L. Hippo signaling: Growth control and beyond. Development 2011, 138, 9–22. [Google Scholar] [CrossRef] [PubMed] [Green Version]
- Gerber, V.E.M.; Wijenayake, S.; Storey, K.B. Anti-apoptotic response during anoxia and recovery in a freeze-tolerant wood frog (Rana sylvatica). PeerJ 2016, 4, e1834. [Google Scholar] [CrossRef] [Green Version]
- Gupta, A.; Storey, K.B. Coordinated expression of Jumonji and AHCY under OCT transcription factor control to regulate gene methylation in wood frogs during anoxia. Gene 2021, 788, 145671. [Google Scholar] [CrossRef]
- Zhang, J.; Storey, K.B. Akt signaling and freezing survival in the wood frog, Rana sylvatica. Biochim. Biophys. Acta-Gen. Subj. 2013, 1830, 4828–4837. [Google Scholar] [CrossRef]
- Pellissier, F.; Glogowski, C.M.; Heinemann, S.F.; Ballivet, M.; Ossipow, V. Lab assembly of a low-cost, robust SYBR green buffer system for quantitative real-time polymerase chain reaction. Anal. Biochem. 2006, 350, 310–312. [Google Scholar] [CrossRef] [PubMed]
- Bustin, S.A.; Benes, V.; Garson, J.A.; Hellemans, J.; Huggett, J.; Kubista, M.; Mueller, R.; Nolan, T.; Pfaffl, M.W.; Shipley, G.L.; et al. The MIQE Guidelines: Minimum Information for Publication of Quantitative Real-Time PCR Experiments. Clin. Chem. 2009, 55, 611–622. [Google Scholar] [CrossRef] [PubMed] [Green Version]
- Schmittgen, T.D.; Zakrajsek, B.A. Effect of experimental treatment on housekeeping gene expression: Validation by real-time, quantitative RT-PCR. J. Biochem. Biophys. Methods 2000, 46, 69–81. [Google Scholar] [CrossRef]
- Eaton, S.L.; Roche, S.L.; Llavero Hurtado, M.; Oldknow, K.J.; Farquharson, C.; Gillingwater, T.H.; Wishart, T.M. Total protein analysis as a reliable loading control for quantitative fluorescent western blotting. PLoS ONE 2013, 8, e72457. [Google Scholar] [CrossRef] [PubMed]
- Taylor, S.C.; Nadeau, K.; Abbasi, M.; Lachance, C.; Nguyen, M.; Fenrich, J. The Ultimate qPCR Experiment: Producing Publication Quality, Reproducible Data the First Time. Trends Biotechnol. 2019, 37, 761–774. [Google Scholar] [CrossRef] [Green Version]
- Zhang, J.; Storey, K.B. RBioplot: An easy-to-use R pipeline for automated statistical analysis and data visualization in molecular biology and biochemistry. PeerJ 2016, 4, e2436. [Google Scholar] [CrossRef] [PubMed]
- Kenneth, N.S.; Rocha, S. Regulation of gene expression by hypoxia. Biochem. J. 2008, 414, 19–29. [Google Scholar] [CrossRef] [PubMed] [Green Version]
- Lehtinen, M.K.; Yuan, Z.; Boag, P.R.; Yang, Y.; Villén, J.; Becker, E.B.E.; DiBacco, S.; de la Iglesia, N.; Gygi, S.; Blackwell, T.K.; et al. A Conserved MST-FOXO Signaling Pathway Mediates Oxidative-Stress Responses and Extends Life Span. Cell 2006, 125, 987–1001. [Google Scholar] [CrossRef] [Green Version]
- Goldstein, D.S.; Kopin, I.J. Evolution of concepts of stress. Stress 2007, 10, 109–120. [Google Scholar] [CrossRef]
- Del Re, D.P.; Yang, Y.; Nakano, N.; Cho, J.; Zhai, P.; Yamamoto, T.; Zhang, N.; Yabuta, N.; Nojima, H.; Pan, D.; et al. Yes-associated Protein Isoform 1 (Yap1) Promotes Cardiomyocyte Survival and Growth to Protect against Myocardial Ischemic Injury. J. Biol. Chem. 2013, 288, 3977–3988. [Google Scholar] [CrossRef] [PubMed] [Green Version]
- Bae, S.J.; Luo, X. Activation mechanisms of the Hippo kinase signaling cascade. Biosci. Rep. 2018, 38. [Google Scholar] [CrossRef] [PubMed] [Green Version]
- Jewhurst, K.; McLaughlin, K.A. Recovery of the Xenopus laevis heart from ROS-induced stress utilizes conserved pathways of cardiac regeneration. Dev. Growth Differ. 2019, 61, 212–227. [Google Scholar] [CrossRef]
- Giordano, F.J. Oxygen, oxidative stress, hypoxia, and heart failure. J. Clin. Investig. 2005, 115, 500–508. [Google Scholar] [CrossRef]
- Zhao, B.; Li, L.; Tumaneng, K.; Wang, C.-Y.; Guan, K.-L. A coordinated phosphorylation by Lats and CK1 regulates YAP stability through SCF -TRCP. Genes Dev. 2010, 24, 72–85. [Google Scholar] [CrossRef] [Green Version]
- Zhao, B.; Wei, X.; Li, W.; Udan, R.S.; Yang, Q.; Kim, J.; Xie, J.; Ikenoue, T.; Yu, J.; Li, L.; et al. Inactivation of YAP oncoprotein by the Hippo pathway is involved in cell contact inhibition and tissue growth control. Genes Dev. 2007, 21, 2747–2761. [Google Scholar] [CrossRef] [PubMed] [Green Version]
- Song, H.; Mak, K.K.; Topol, L.; Yun, K.; Hu, J.; Garrett, L.; Chen, Y.; Park, O.; Chang, J.; Simpson, R.M.; et al. Mammalian Mst1 and Mst2 kinases play essential roles in organ size control and tumor suppression. Proc. Natl. Acad. Sci. USA 2010, 107, 1431–1436. [Google Scholar] [CrossRef] [PubMed] [Green Version]
- Nakatani, K.; Maehama, T.; Nishio, M.; Goto, H.; Kato, W.; Omori, H.; Miyachi, Y.; Togashi, H.; Shimono, Y.; Suzuki, A. Targeting the Hippo signalling pathway for cancer treatment. J. Biochem. 2016, 161, 237–244. [Google Scholar] [CrossRef] [PubMed] [Green Version]
- Wang, W.; Xiao, Z.-D.; Li, X.; Aziz, K.E.; Gan, B.; Johnson, R.L.; Chen, J. AMPK modulates Hippo pathway activity to regulate energy homeostasis. Nat. Cell Biol. 2015, 17, 490–499. [Google Scholar] [CrossRef] [PubMed] [Green Version]
- Rider, M.H.; Hussain, N.; Horman, S.; Dilworth, S.M.; Storey, K.B. Stress-induced activation of the AMP-activated protein kinase in the freeze-tolerant frog Rana sylvatica. Cryobiology 2006, 53, 297–309. [Google Scholar] [CrossRef]
- Bartrons, M.; Ortega, E.; Obach, M.; Calvo, M.N.; Navarro-Sabaté, À.; Bartrons, R. Activation of AMP-dependent protein kinase by hypoxia and hypothermia in the liver of frog Rana perezi. Cryobiology 2004, 49, 190–194. [Google Scholar] [CrossRef] [PubMed]
- Hong, M.; Li, N.; Li, J.; Li, W.; Liang, L.; Li, Q.; Wang, R.; Shi, H.; Storey, K.B.; Ding, L. Adenosine Monophosphate-Activated Protein Kinase Signaling Regulates Lipid Metabolism in Response to Salinity Stress in the Red-Eared Slider Turtle Trachemys scripta elegans. Front. Physiol. 2019, 10, 962. [Google Scholar] [CrossRef] [Green Version]
- Malik, A.I.; Storey, K.B. Activation of extracellular signal-regulated kinases during dehydration in the African clawed frog, Xenopus laevis. J. Exp. Biol. 2009, 212, 2595–2603. [Google Scholar] [CrossRef] [PubMed] [Green Version]
- Rider, M.H. Role of AMP-activated protein kinase in metabolic depression in animals. J. Comp. Physiol. B 2016, 186, 1–16. [Google Scholar] [CrossRef] [PubMed]
- Vassilev, A. TEAD/TEF transcription factors utilize the activation domain of YAP65, a Src/Yes-associated protein localized in the cytoplasm. Genes Dev. 2001, 15, 1229–1241. [Google Scholar] [CrossRef] [PubMed] [Green Version]
- Zheng, Y.; Pan, D. The Hippo Signaling Pathway in Development and Disease. Dev. Cell 2019, 50, 264–282. [Google Scholar] [CrossRef]
- Covello, K.L. HIF-2 regulates Oct-4: Effects of hypoxia on stem cell function, embryonic development, and tumor growth. Genes Dev. 2006, 20, 557–570. [Google Scholar] [CrossRef] [Green Version]
- Lee, J.; Cho, Y.S.; Jung, H.; Choi, I. Pharmacological regulation of oxidative stress in stem cells. Oxid. Med. Cell. Longev. 2018, 2018, 1–13. [Google Scholar] [CrossRef]
- Chang, Y.K.; Hwang, J.S.; Chung, T.-Y.; Shin, Y.J. SOX2 Activation Using CRISPR/dCas9 Promotes Wound Healing in Corneal Endothelial Cells. Stem Cells 2018, 36, 1851–1862. [Google Scholar] [CrossRef] [PubMed] [Green Version]
- Bani-Yaghoub, M.; Tremblay, R.G.; Lei, J.X.; Zhang, D.; Zurakowski, B.; Sandhu, J.K.; Smith, B.; Ribecco-Lutkiewicz, M.; Kennedy, J.; Walker, P.R.; et al. Role of Sox2 in the development of the mouse neocortex. Dev. Biol. 2006, 295, 52–66. [Google Scholar] [CrossRef] [Green Version]
- Cui, C.B.; Cooper, L.F.; Yang, X.; Karsenty, G.; Aukhil, I. Transcriptional Coactivation of Bone-Specific Transcription Factor Cbfa1 by TAZ. Mol. Cell. Biol. 2003, 23, 1004–1013. [Google Scholar] [CrossRef] [Green Version]
- Hong, J.-H. TAZ, a Transcriptional Modulator of Mesenchymal Stem Cell Differentiation. Science 2005, 309, 1074–1078. [Google Scholar] [CrossRef] [Green Version]
- Murakami, M.; Nakagawa, M.; Olson, E.N.; Nakagawa, O. A WW domain protein TAZ is a critical coactivator for TBX5, a transcription factor implicated in Holt-Oram syndrome. Proc. Natl. Acad. Sci. USA 2005, 102, 18034–18039. [Google Scholar] [CrossRef] [Green Version]
- Varelas, X.; Sakuma, R.; Samavarchi-Tehrani, P.; Peerani, R.; Rao, B.M.; Dembowy, J.; Yaffe, M.B.; Zandstra, P.W.; Wrana, J.L. TAZ controls Smad nucleocytoplasmic shuttling and regulates human embryonic stem-cell self-renewal. Nat. Cell Biol. 2008, 10, 837–848. [Google Scholar] [CrossRef] [PubMed]
- Jeong, H.; Bae, S.; An, S.Y.; Byun, M.R.; Hwang, J.; Yaffe, M.B.; Hong, J.; Hwang, E.S. TAZ as a novel enhancer of MyoD-mediated myogenic differentiation. FASEB J. 2010, 24, 3310–3320. [Google Scholar] [CrossRef]
- Le Grand, F.; Rudnicki, M.A. Skeletal muscle satellite cells and adult myogenesis. Curr. Opin. Cell Biol. 2007, 19, 628–633. [Google Scholar] [CrossRef] [Green Version]
- Hernández-Hernández, J.M.; García-González, E.G.; Brun, C.E.; Rudnicki, M.A. The myogenic regulatory factors, determinants of muscle development, cell identity and regeneration. Semin. Cell Dev. Biol. 2017, 72, 10–18. [Google Scholar] [CrossRef] [PubMed]
- Lemley, J.M.; Meneely, G.R. Effects of Anoxia on Metabolism of Myocardial Tissue. Am. J. Physiol. Content 1952, 169, 66–73. [Google Scholar] [CrossRef] [PubMed]
- Allen, D.G.; Orchard, C.H. Myocardial contractile function during ischemia and hypoxia. Circ. Res. 1987, 60, 153–168. [Google Scholar] [CrossRef] [PubMed] [Green Version]
- Chaillou, T.; Koulmann, N.; Meunier, A.; Chapot, R.; Serrurier, B.; Beaudry, M.; Bigard, X. Effect of hypoxia exposure on the recovery of skeletal muscle phenotype during regeneration. Mol. Cell. Biochem. 2014, 390, 31–40. [Google Scholar] [CrossRef] [PubMed]
- Favier, F.B.; Britto, F.A.; Freyssenet, D.G.; Bigard, X.A.; Benoit, H. HIF-1-driven skeletal muscle adaptations to chronic hypoxia: Molecular insights into muscle physiology. Cell. Mol. Life Sci. 2015, 72, 4681–4696. [Google Scholar] [CrossRef] [PubMed]
- Chaillou1, T.; Lanner, J.T. Regulation of myogenesis and skeletal muscle regeneration: Effects of oxygen levels on satellite cell activity. FASEB J. 2016, 30, 3929–3941. [Google Scholar] [CrossRef] [PubMed] [Green Version]
Publisher’s Note: MDPI stays neutral with regard to jurisdictional claims in published maps and institutional affiliations. |
© 2021 by the authors. Licensee MDPI, Basel, Switzerland. This article is an open access article distributed under the terms and conditions of the Creative Commons Attribution (CC BY) license (https://creativecommons.org/licenses/by/4.0/).
Share and Cite
Gupta, A.; Storey, K.B. Activation of the Hippo Pathway in Rana sylvatica: Yapping Stops in Response to Anoxia. Life 2021, 11, 1422. https://doi.org/10.3390/life11121422
Gupta A, Storey KB. Activation of the Hippo Pathway in Rana sylvatica: Yapping Stops in Response to Anoxia. Life. 2021; 11(12):1422. https://doi.org/10.3390/life11121422
Chicago/Turabian StyleGupta, Aakriti, and Kenneth B. Storey. 2021. "Activation of the Hippo Pathway in Rana sylvatica: Yapping Stops in Response to Anoxia" Life 11, no. 12: 1422. https://doi.org/10.3390/life11121422