Abstract
Reduction in activity links to the development and progression of non-alcoholic fatty liver disease (NAFLD). Brain-derived neurotrophic factor (BDNF) is known to regulate an activity. We aimed to investigate the association between reduction in activity and BDNF in patients with NAFLD using data-mining analysis. We enrolled 48 NAFLD patients. Patients were classified into reduced (n = 21) or normal activity groups (n = 27) based on the activity score of the Chronic Liver Disease Questionnaire-NAFLD/non-alcoholic steatohepatitis. Circulating BDNF levels were measured using an enzyme-linked immunoassay. Factors associated with reduced activity were analyzed using decision-tree and random forest analyses. A reduction in activity was seen in 43.8% of patients. Hemoglobin A1c and BDNF were identified as negative independent factors for reduced activity (hemoglobin A1c, OR 0.012, p = 0.012; BDNF, OR 0.041, p = 0.039). Decision-tree analysis showed that “BDNF levels ≥ 19.1 ng/mL” was the most important classifier for reduced activity. In random forest analysis, serum BDNF level was the highest-ranked variable for distinguishing between the reduced and normal activity groups (158 valuable importance). Reduced activity was commonly seen in patients with NAFLD. Data-mining analyses revealed that BNDF was the most important independent factor corresponding with the reduction in activity. BDNF may be an important target for the prevention and treatment of NAFLD.
1. Introduction
Non-alcoholic fatty liver disease (NAFLD) is a major health problem worldwide [1]. NAFLD is a risk factor for liver cirrhosis, liver cancer, extrahepatic malignancies, and cardiovascular diseases [1]. A sedentary lifestyle is a well-known risk factor for NAFLD [2], and lifestyle modification, including maintaining physical activity, is the first-line therapy for NAFLD [3]. In fact, exercise improves insulin sensitivity, lipid metabolism, hepatic steatosis, and hepatic fibrosis in patients with NAFLD [4,5]. Moreover, maintaining physical activity is related to increased survival rates in patients with NAFLD [6,7]. Accordingly, activity assessment is important for the prevention and management of NAFLD.
Various methods are used to assess activity. The recently developed Chronic Liver Disease Questionnaire (CLDQ)-NAFLD/non-alcoholic steatohepatitis (NASH) is a useful, disease-specific, patient-reported outcome measure for patients with NAFLD [8,9]. In this context, the CLDQ-NAFLD/NASH has been sufficiently validated and widely used in international clinical trials [10,11]. The CLDQ-NAFLD/NASH includes 36 questions grouped into 6 domains of health-related quality of life, such as fatigue, systemic symptoms, emotional health, worry, abdominal symptoms, and activity. The lower score of the activity domain is associated with obesity, and the activity domain is able to capture physical function in patients with NAFLD [11].
Physical function is regulated by various factors. Metabolic disorders, including diabetes mellitus, are well-known factors associated with reduced physical function [12]. A meta-analysis showed that diabetes mellitus is associated with the risk of disabilities related to mobility and activities of daily living [13]. Sarcopenia is also a risk factor for reduced physical function and is induced by the disturbance of various inflammatory and anti-inflammatory cytokines, including interleukin (IL)-6, IL-1, IL-10, and IL-15 [14,15].
Moreover, mental health is known to regulate physical function [16]. A decrease in the levels of brain-derived neurotrophic factor (BDNF), a neurotrophic protein, is linked to neuronal atrophy, leading to depressive symptoms [17]. On the other hand, an increase in the BDNF level promotes neuronal differentiation and neuronal transmission [17]. BDNF is released from the brain during exercise [18]. BDNF is a myokine that increases in the muscles in response to exercise, and it promotes fatty acid oxidation [19,20]. BDNF is thought to play a role in physical performance via this mechanism. The circulating BDNF level is positively associated with the intensity of physical activity in patients who are overweight/obese [21]. However, the association between activity and BDNF levels remains unclear in patients with NAFLD.
Physical function is regulated by diverse factors. A data-mining analysis is an artificial intelligence approach to reveal factors, even if no a priori hypothesis has been imposed [22]. This approach allows us to discover hidden factors that cannot be identified by logistic regression analysis [23]. Decision tree analysis is a data-mining technique and identifies factors with priorities. Thus, decision tree analysis is useful to discover the most impacting factor associated with physical function. Random forest analysis is also a data-mining technique used to identify factors that distinguish between case and control groups by random sampling. A feature of random forest analysis is a high level of predictive accuracy with an estimation of the relative importance for each factor [24]. Recently, these data-mining techniques have been used to identify individuals at an increased risk of developing NAFLD [25] and prognostic algorithms for patients with NAFLD-related hepatocellular carcinoma [26]. However, these unique statistical techniques have never been used to investigate the factor associated with physical function.
Therefore, the aim of this study was to investigate the association between physical activity and BDNF levels in patients with NAFLD using data-mining analysis.
2. Results
2.1. Prevalence of Reduction in Activity in Patients with NAFLD
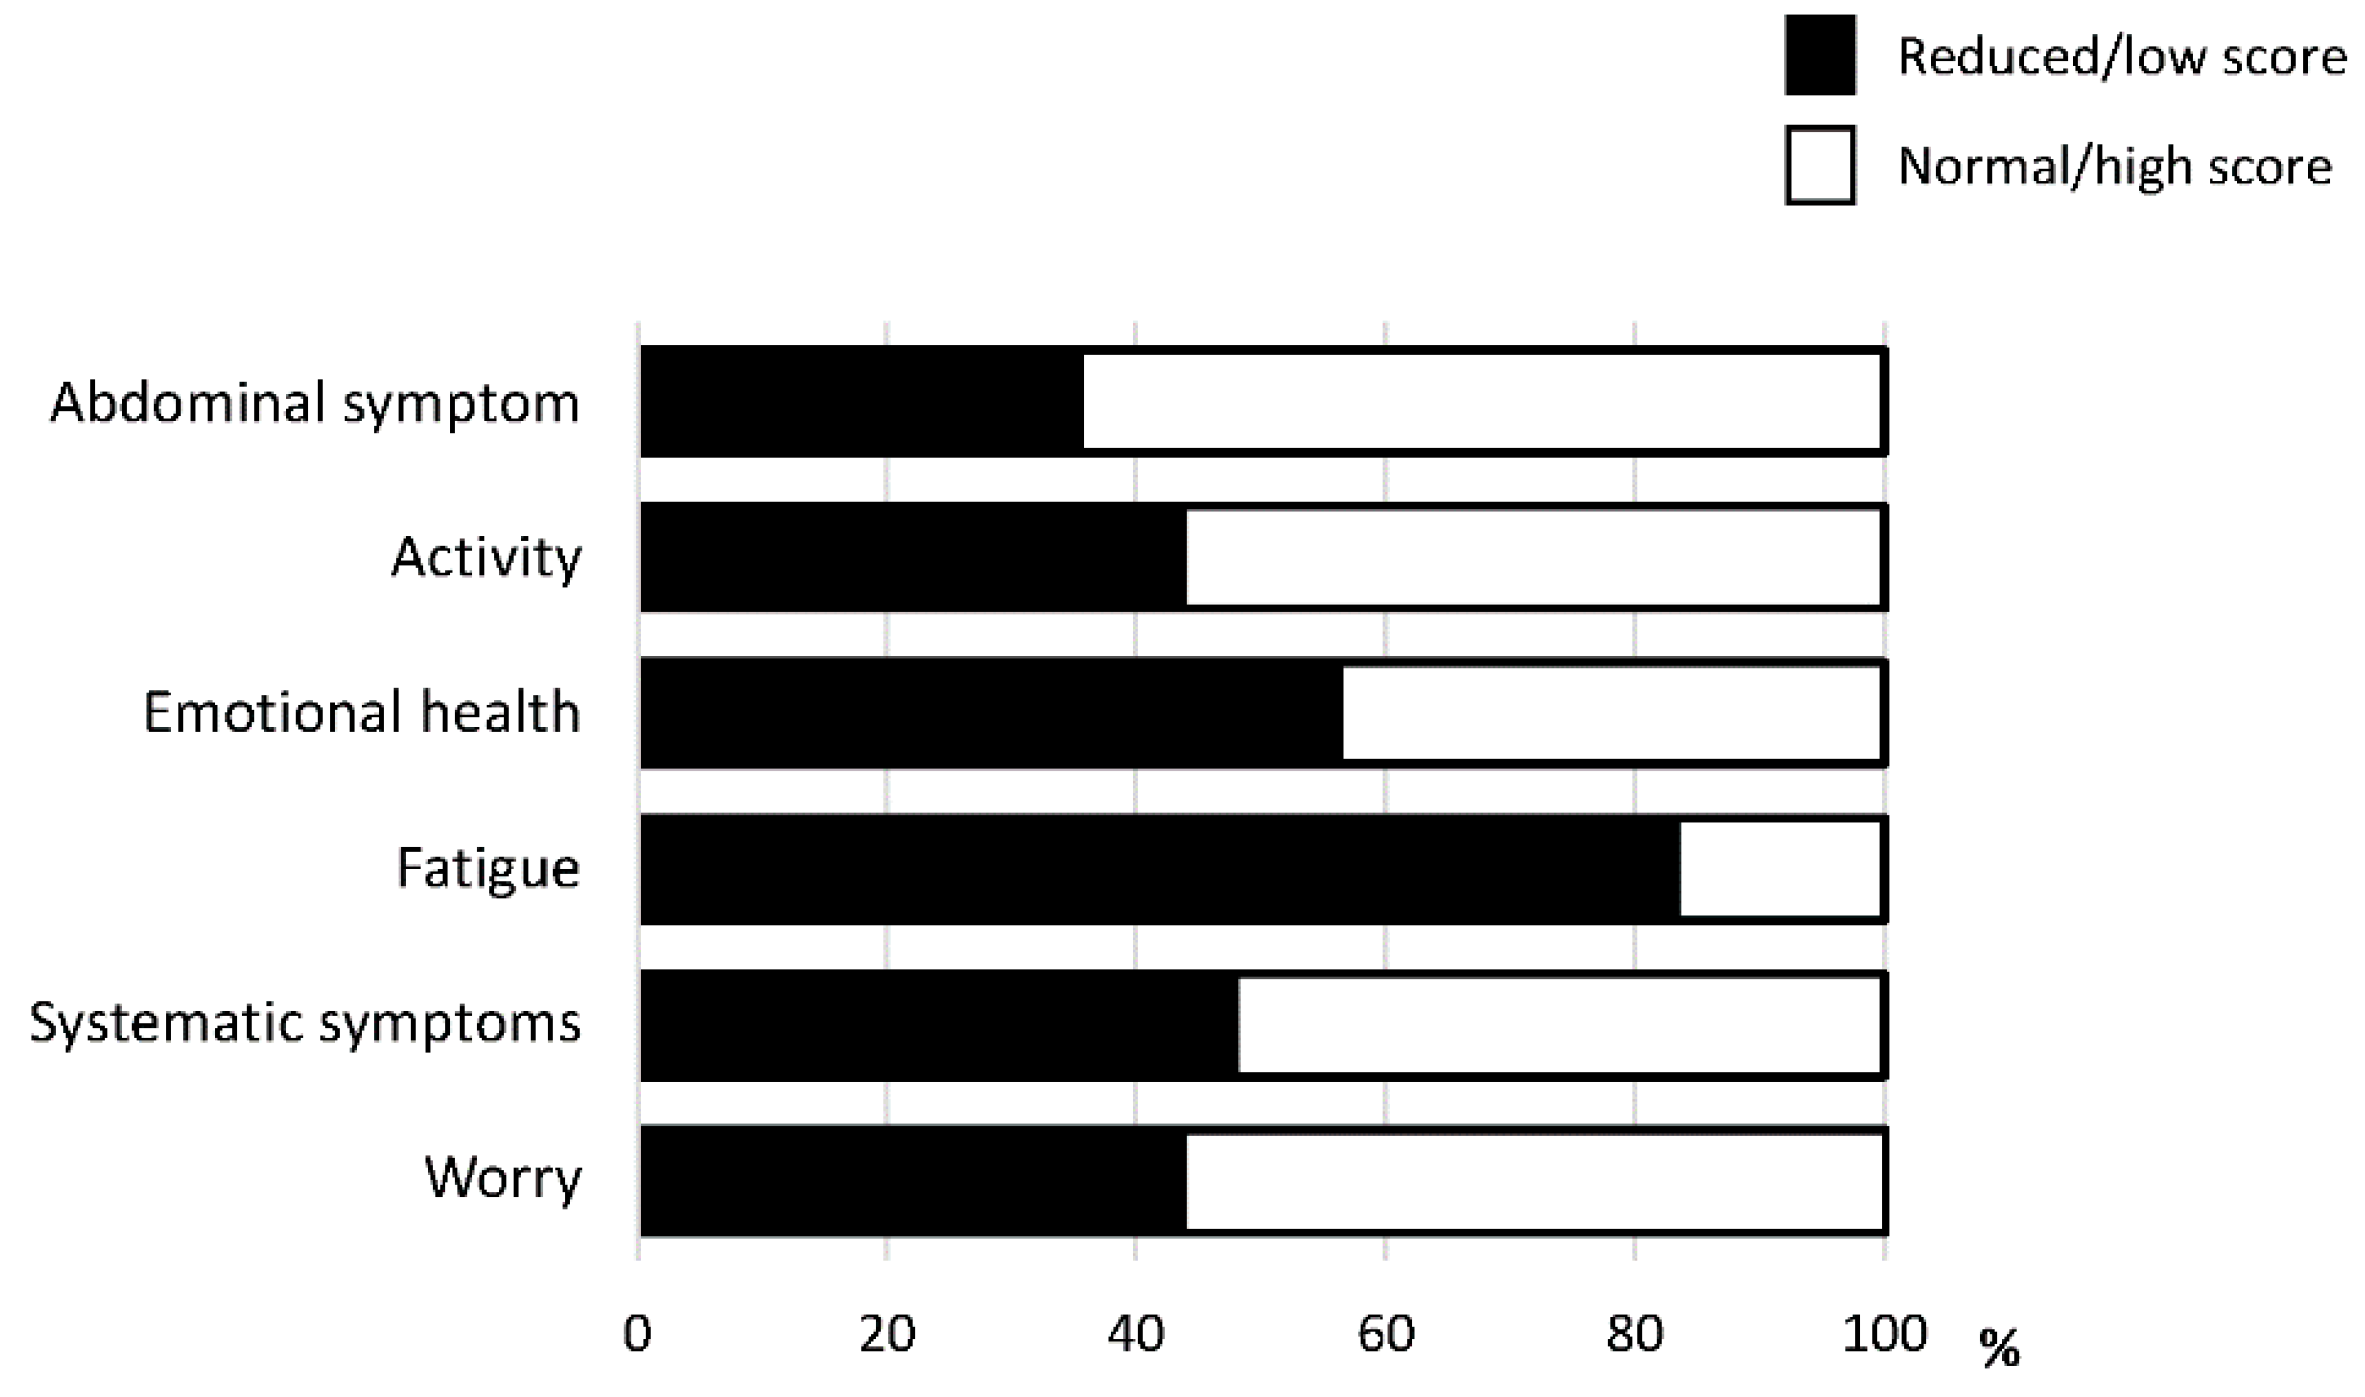
Among the six domains of CLDQ-NAFLD/NASH, fatigue was the most impacted domain. The activity was also an impacted domain. A reduction in activity was seen in 43.8% of patients with NAFLD (Figure 1).

Figure 1.
The prevalence of reduction in each domain of the Chronic Liver Disease Questionnaire-non-alcoholic fatty liver disease/non-alcoholic steatohepatitis (CLDQ-NAFLD/NASH).
2.2. Patient Characteristics
Patient characteristics are summarized in Table 1. There was no significant difference in age or BMI between the reduced and normal activity groups. Although the prevalence of women was significantly higher in the reduced activity group than in the normal activity group, no significant difference was seen in the liver frailty index, the prevalence of type 2 diabetes mellitus, or liver stiffness between the two groups (Table 1).

Table 1.
Comparison of patients’ characteristics between the patients with no impairment and impairment groups.
There was no significant difference in hemoglobin level, hepatic and renal function tests, or hemoglobin A1c (HbA1c) levels between the two groups. No significant difference was observed in serum levels of C-reactive protein, BDNF, myostatin, or inflammatory cytokines, such as IL-1, IL-6, IL-10, and IL-15, between the two groups (Table 1).
2.3. Independent Factors Associated with the Reduction in Activity in Patients with NAFLD
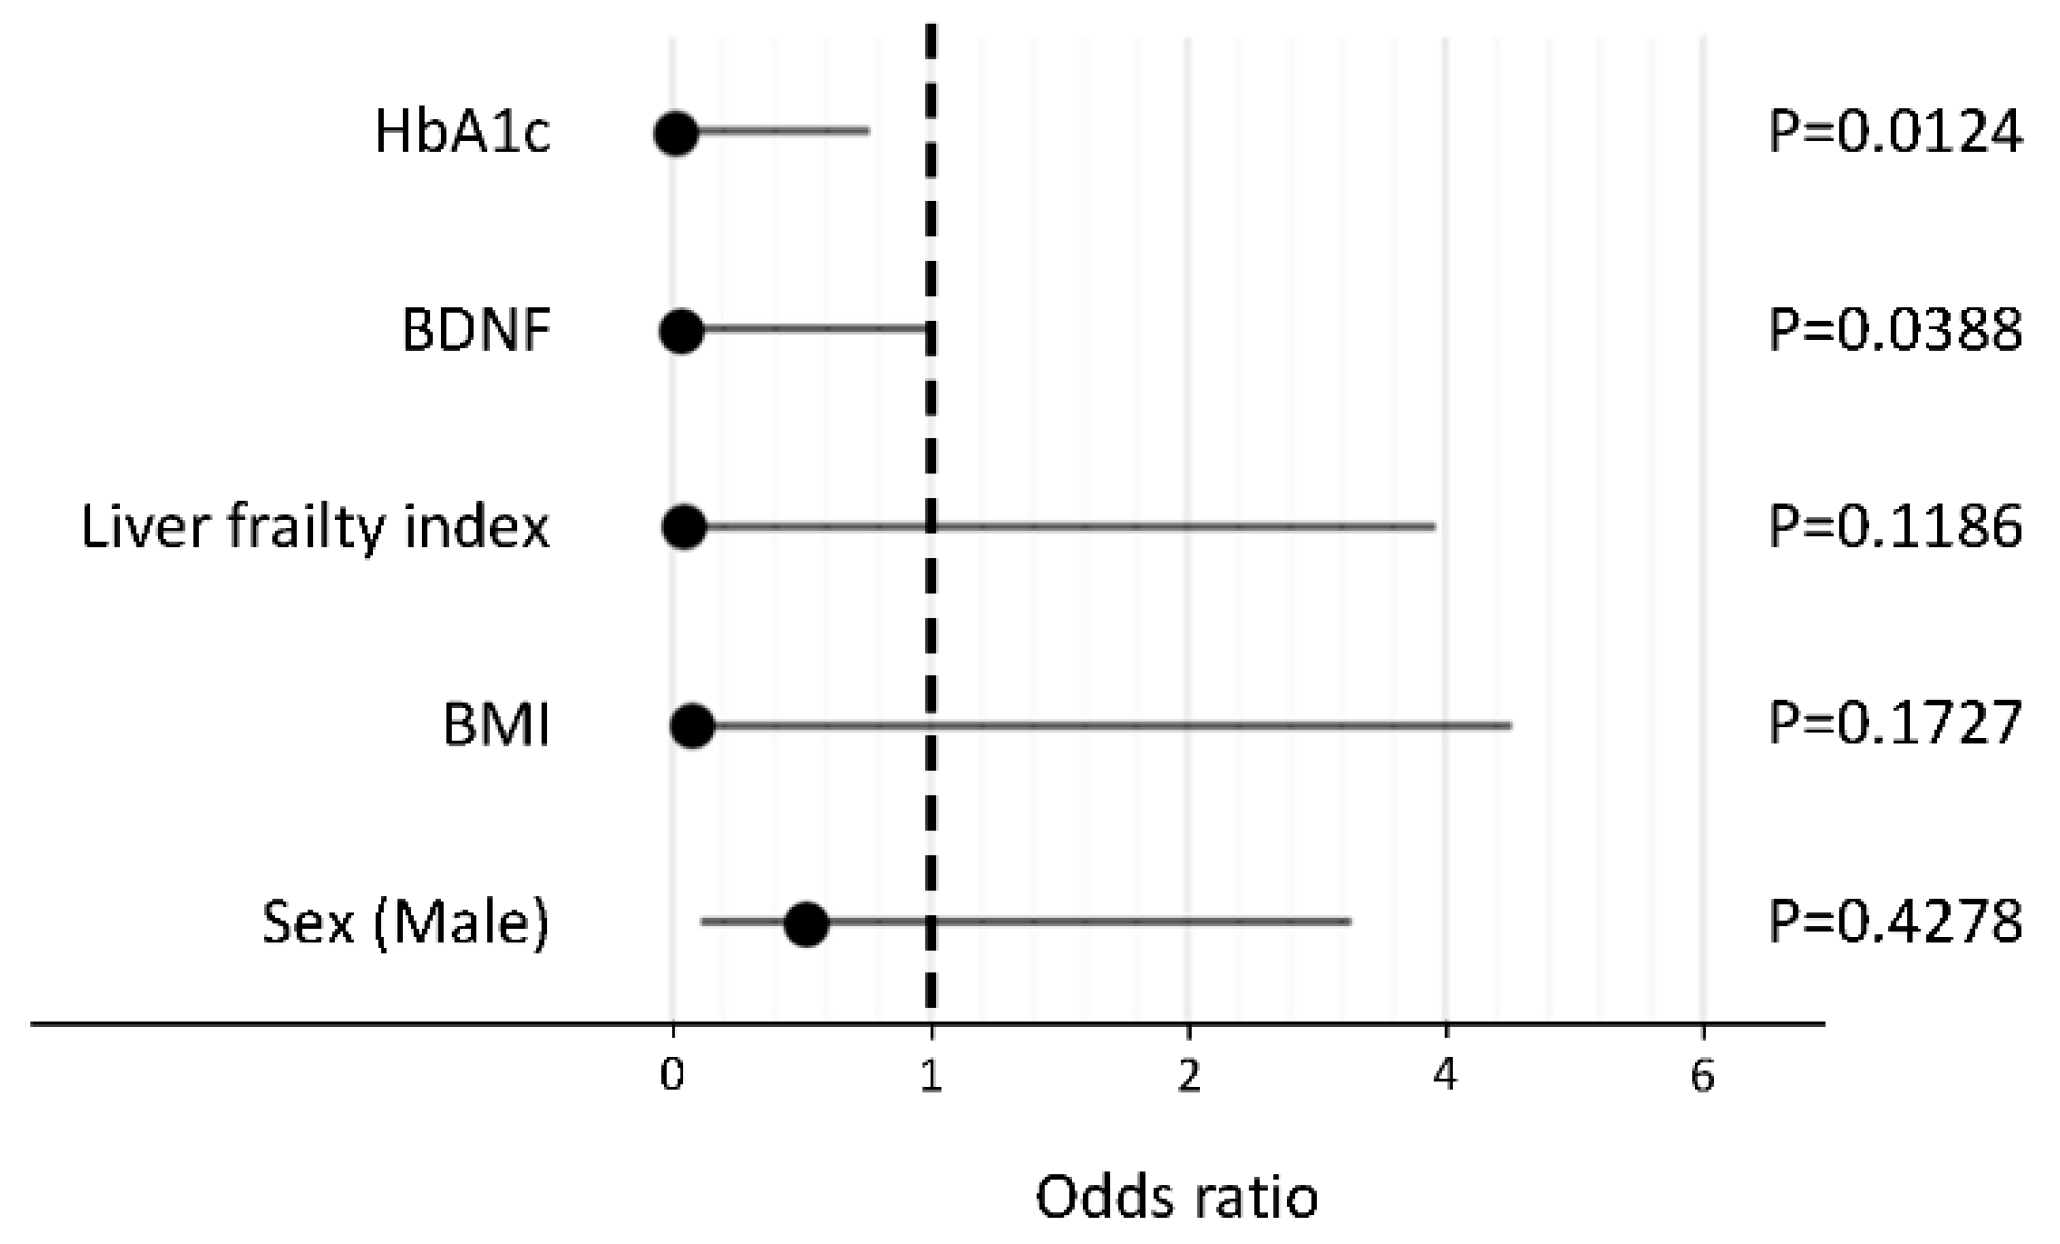
In a stepwise procedure, the following five factors were selected as explanatory variables: HbA1c, BDNF, liver frailty index, BMI, and sex. In a logistic regression analysis, HbA1c and BDNF levels were identified as independent negative factors associated with the reduction in activity in patients with NAFLD (Figure 2).
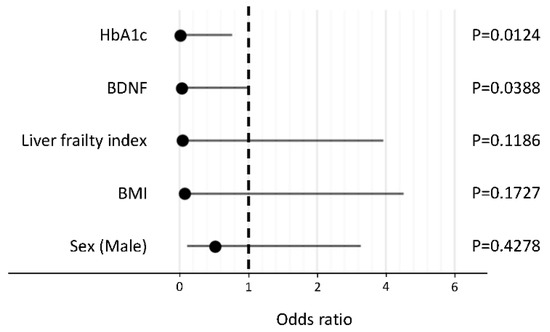
Figure 2.
Independent factors associated with the reduction in activity in patients with non-alcoholic fatty liver disease. Abbreviations: HbA1c, hemoglobin A1c; BDNF, brain-derived neurotrophic factor; BMI, body mass index.
2.4. Decision-Tree Analysis for the Reduction in Activity
A decision-tree algorithm was created by using two variables to classify three groups of subjects for the reduction in activity (Figure 3). BDNF was selected as the most important classifier with an optimal cut-off of 19.1 ng/mL. In patients with BDNF levels < 19.1 ng/mL, all patients showed normal activity. On the other hand, in patients with BDNF levels ≥ 19.1 ng/mL, 53.6% of patients showed a reduction in activity. In such patients, HbA1c was selected as the second classifier with an optimal cut-off of 7.1%. Reduction in activity was seen in all patients with BDNF levels ≥ 19.1 ng/mL and HbA1c > 7.1%.
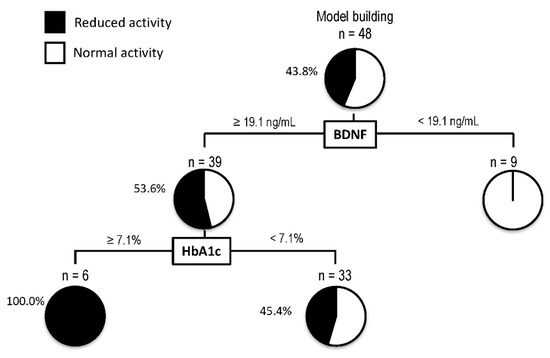
Figure 3.
Decision-tree analysis for the reduction in activity in patients with non-alcoholic fatty liver disease. The subjects were classified according to the indicated cut-off values of the variables. The pie graphs indicate the proportion of patients with reduced activity (black) and normal activity (white). Abbreviations: HbA1c, hemoglobin A1c; BDNF, brain-derived neurotrophic factor.
2.5. Random Forest Analysis for Distinguishing between Reduced and Normal Activity Groups
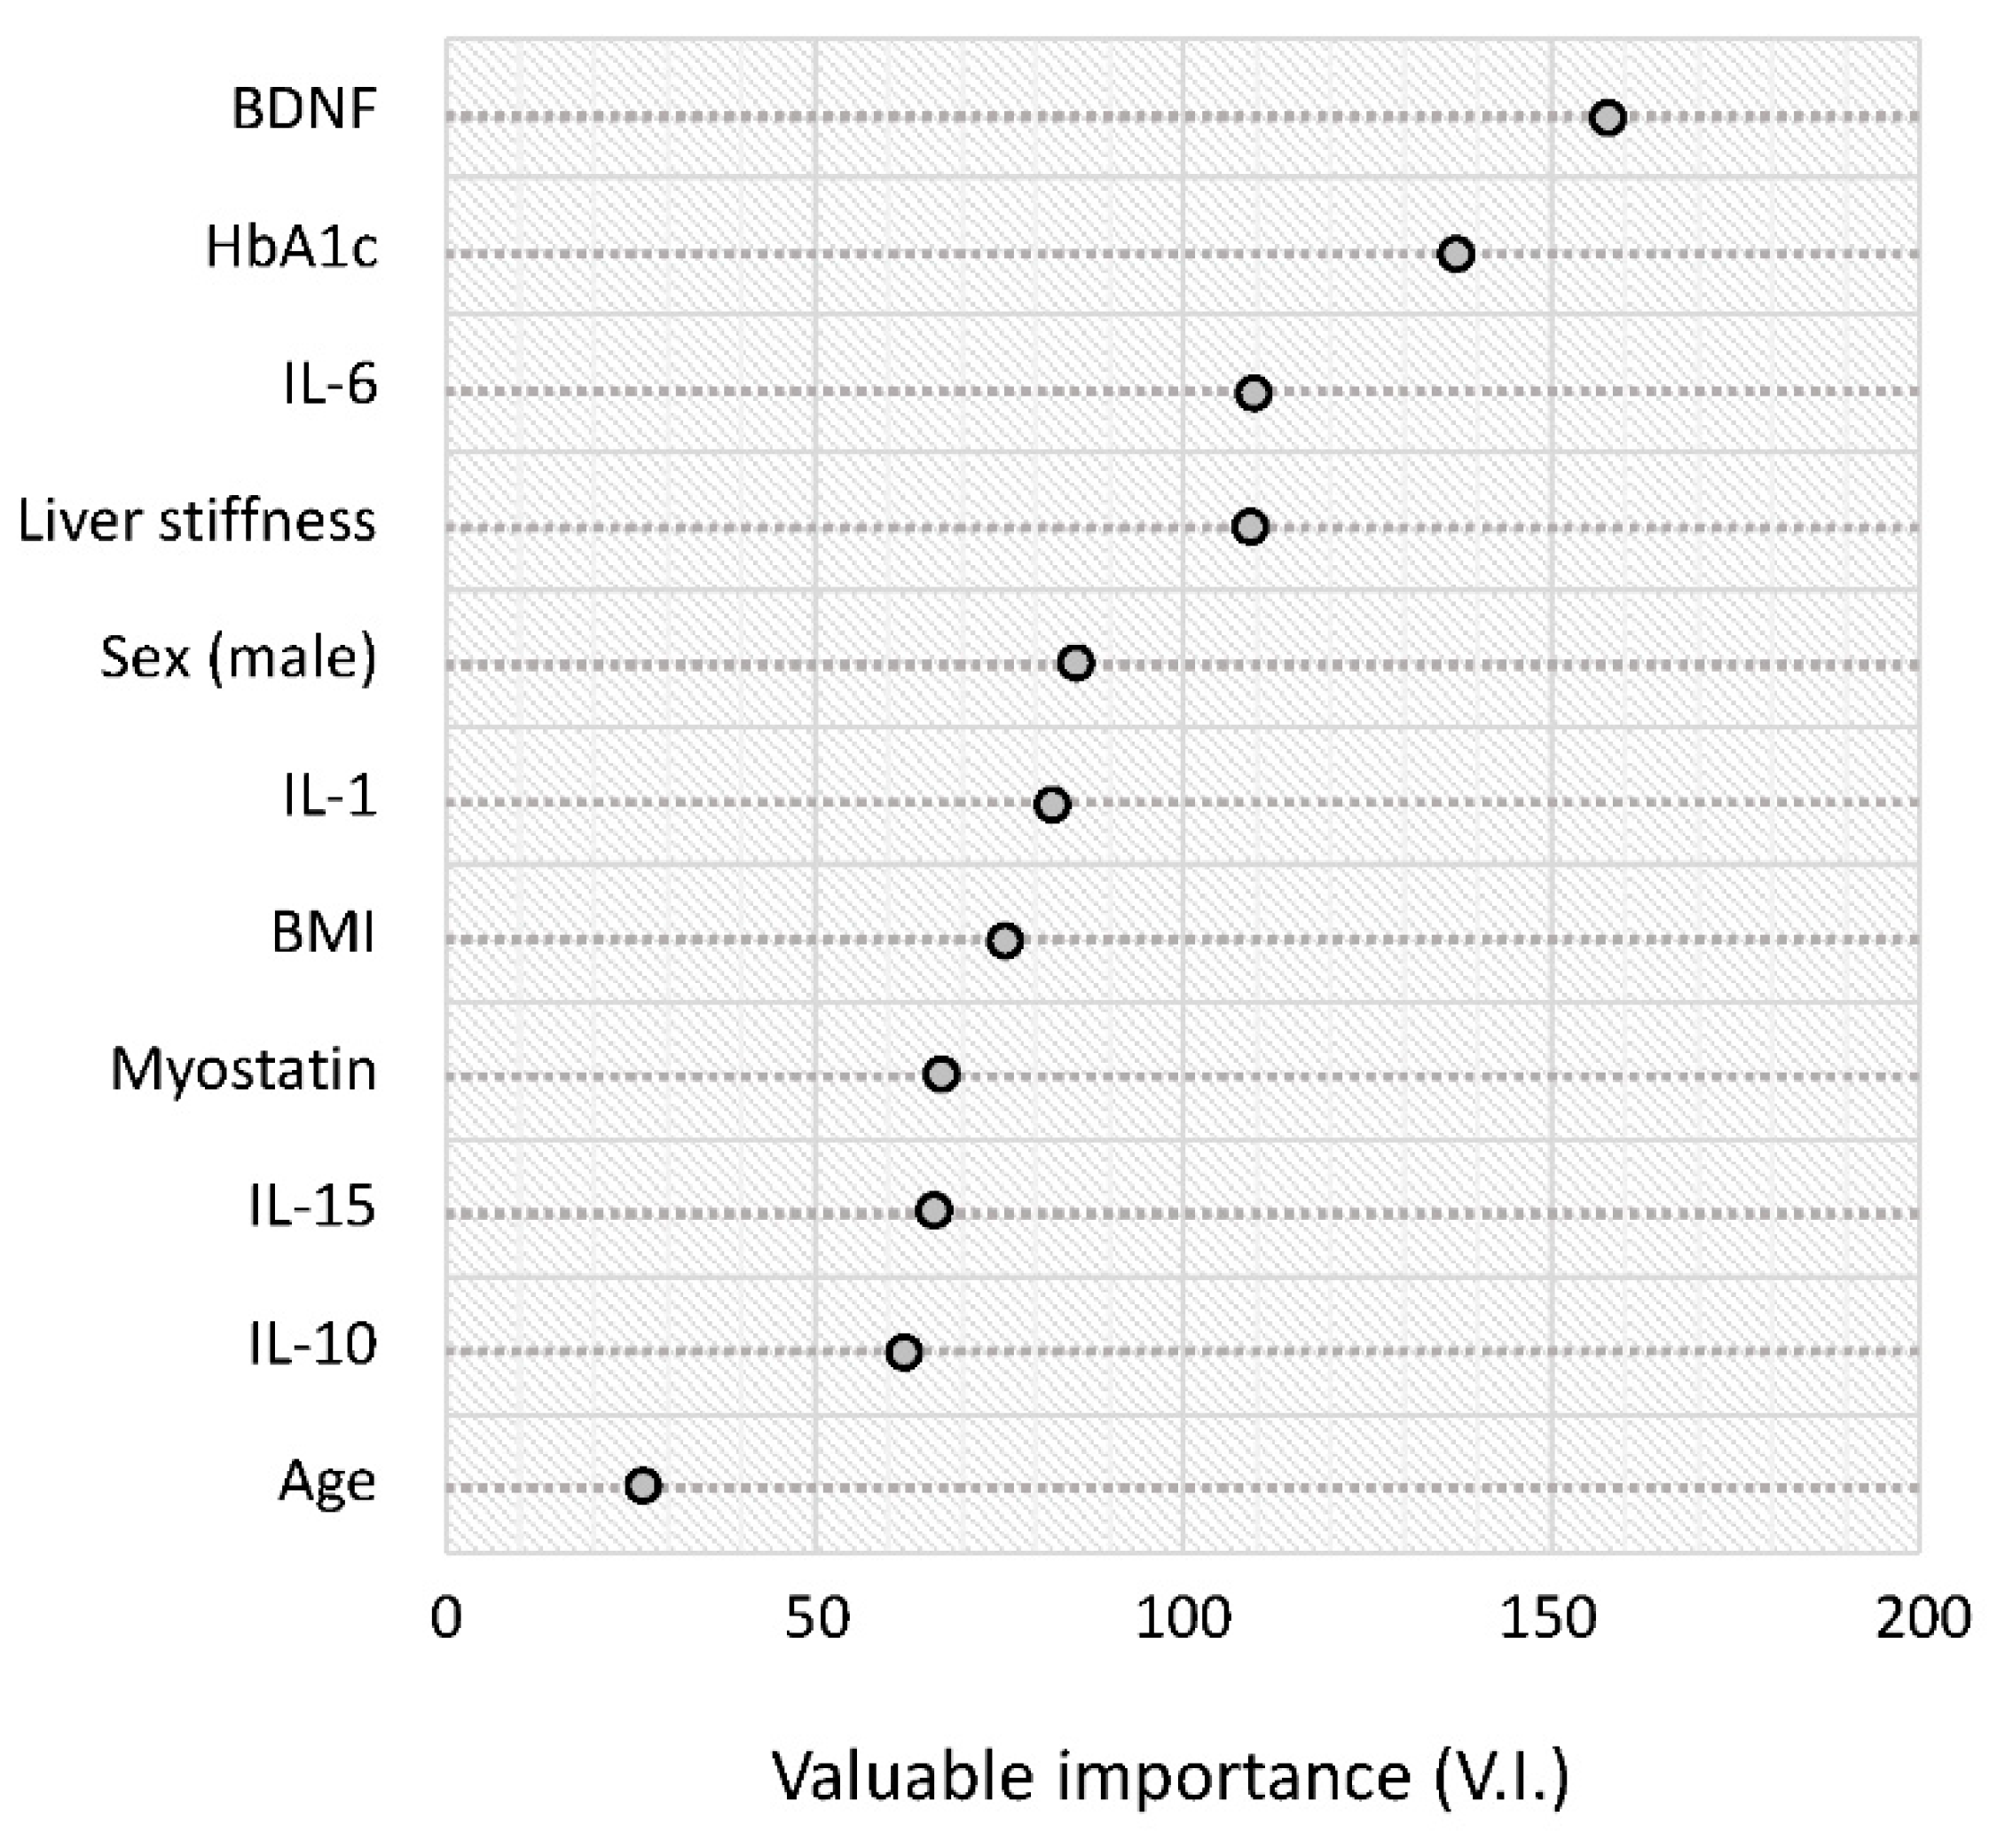
The results of the random forest analysis are summarized in rank order in Figure 4. The serum BDNF level was the highest-ranked variable for distinguishing between the reduced and normal activity groups. This was followed by HbA1c, IL-6, and liver stiffness (Figure 4).
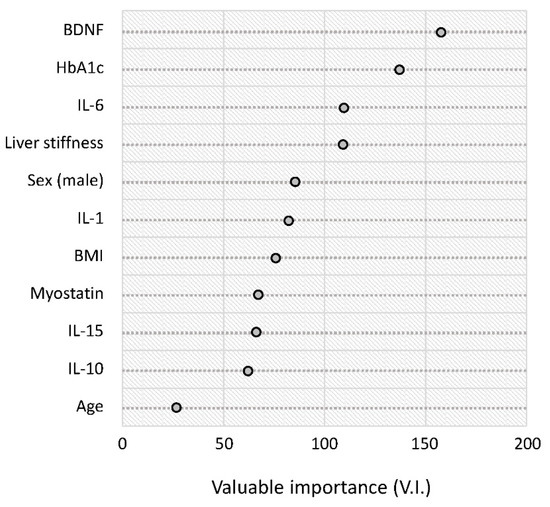
Figure 4.
Random forest analysis for distinguishing between the reduced and normal activity groups. Variable importance is a general measure of the contribution of each variable in distinguishing the classes. Abbreviations: HbA1c, hemoglobin A1c; BDNF, brain-derived neurotrophic factor; IL, interleukin; BMI, body mass index.
3. Discussion
In this study, we demonstrated that reduction in the activity domain of CLDQ-NAFLD/NASH was seen in 43.8% of patients with NAFLD. In addition, we found that BDNF and HbA1c were independent negative factors for the reduction in activity. The data-mining analysis also revealed that the BNDF was the most important classifier for the reduction in activity. A higher serum level of BDNF was associated with a reduction in activity in patients with NAFLD.
The male-to-female ratio was significantly higher in the reduced activity group than in the normal activity group in this study. Sex was not an independent factor for reduced activity; this may be related to the low statistical power. However, Cohen et al. recently investigated gender differences in physical activity of general subjects and demonstrated that physical activity level is significantly higher in men than in women [27]. Moreover, in decision-tree analysis, sex was not identified as a classifier with the reduced activity. Furthermore, in random forest analysis, sex was the fifth-ranked variable for distinguishing between the reduced and normal activity groups in patients with NAFLD. Thus, in patients with NAFLD, the impact of sex on physical activity may be different from the general population and may have less impact on physical activity level.
In this study, we investigated factors associated with the reduced activity using various factors, including age, sex, BMI, HbA1c, liver stiffness, and inflammatory and anti-inflammatory cytokines, including IL-6, IL-1, IL-10, and IL-15. However, none of these inflammatory cytokines was identified as an independent factor for reduced activity. Taken together, our findings suggest that activity may be mainly regulated by factors other than hepatic fibrosis and inflammatory cytokines in patients with NAFLD.
We employed exploratory analyses to eliminate possible bias and found that BDNF and HbA1c were independent factors associated with the reduction in activity among patients with NAFLD. The data-mining analysis further revealed that HbA1c was the second classifier for reduced activity in this study. Although there was no significant difference in HbA1c value and BDNF levels at the baseline between the normal and reduced activity groups, the difference in the results between univariate and multivariate analyses can be explained by confounding factors [28]. Serum BDNF levels are known to be modulated by various factors, including age [29] and sex [30], and the presence of hypertension [31]. A previous study has also reported that type 2 diabetes mellitus is associated with unhealthy behaviors, including reduced physical activity and increased sedentary behaviors [32]. In patients with NAFLD, type 2 diabetes mellitus has been reported to be associated with a reduction in activity, which was evaluated by the CLDQ-NAFLD/NASH [8]. Thus, our findings were in good agreement with previous reports. Although the causal relationship between HbA1c and reduction in activity remains unclear, the following are possible explanations. Physical inactivity may cause a reduction in energy consumption, leading to a reduction in glucose metabolism [33]. Alternatively, an association between HbA1c and reduction in activity may be affected by confounding factors, such as sarcopenia and depression [34,35].
BDNF is reported to be a regulator of physical activity [19]. Previous animal studies have demonstrated a positive association between brain BDNF levels and physical activity in rats [36,37]. These findings led us to hypothesize a positive association between serum BDNF levels and activity in patients with NAFLD. However, serum BDNF levels were negatively associated with the activity level of patients with NAFLD in our study. We also investigated the correlation of serum BNDF levels and FIB-4 index, M2BPGi levels, and liver stiffness values. However, no strong correlation was seen between serum BNDF levels and these hepatic fibrosis markers (data not shown). Chan et al. previously reported that the serum BDNF level is higher in healthy subjects with sedentary behaviors, such as watching television [38]. Huang et al. reported that higher serum BDNF levels were associated with lower physical activity levels in adolescents [39]. Moreover, Suwa et al. reported that serum BDNF levels were high in patients who are obese and have type 2 diabetes mellitus [40]. Levinger et al. also reported that serum BDNF levels were positively correlated with serum triglyceride levels, insulin resistance, and the number of metabolic risk factors [41]. Furthermore, de Avila et al. reported that, in patients with hepatitis C virus infection, BDNF was negatively correlated with SF-36 physical functioning [42], which is significantly associated with the activity domain of the CLDQ-NAFLD/NASH [8].
We could not examine the causal relationship between BNDF level and reduction in activity in patients with NAFLD in this study. Although the biological significance of BNDF in the reduction in activity remains unclear, BDNF has been reported to be modulated by various factors, including race [43], depressive symptoms [44], cognitive function [45], and genetic polymorphism [46,47]. These factors might be involved in the negative association between serum BDNF levels and activity in this study. In addition, BDNF has been reported to directly affect various metabolic pathways. BDNF reduces appetite through the regulation of serotonergic neurons in animal models [48,49]. BDNF also improves insulin resistance and lipid metabolism through the upregulation of energy metabolism in a mouse model of diabetes mellitus [50]. Taken together, BDNF may have been upregulated in this study as a compensatory mechanism to improve metabolic dysfunction and insulin resistance in patients with NAFLD who have a reduction in activity.
We employed a data mining analysis, an artificial intelligence approach, and revealed that “BDNF level ≥ 19.1 ng/mL and HbA1c ≥ 7.1%” is a profile for the high prevalence of reduced activity in patients with NAFLD. Since a reduction in activity is a risk factor for disease progression and mortality of patients with NAFLD [6,7], patients with such a profile may be an important target for the prevention and treatment of NAFLD.
This study has several limitations. First, this was a single-center study with small sample size. Second, this was a nested case-control study lacking a healthy subjects group and time-course changes in BDNF level. Third, we stratified subjects into two groups. Fourth, activity was evaluated by the CLDQ-NAFLD/NASH alone and not by other questionnaires or activity monitoring, including the International Physical Activity Questionnaire or an accelerometer. Thus, further multicenter prospective studies with healthy control, multiple questionnaires, and activity monitoring are required to elucidate the association between BDNF and reduction in activity in patients with NAFLD.
In this study, we showed that a reduction in activity was seen in 43.8% of patients with NAFLD. Furthermore, data-mining analyses revealed that BDNF was the most important negative factor associated with the reduction in activity in patients with NAFLD. Since a reduction in activity is involved in the development and progression of NAFLD, BDNF may be an important target for the prevention and treatment of NAFLD.
4. Materials and Methods
4.1. Study Design and Ethics
We conducted a single-center, nested case-control study in Japan. The protocol conformed to the ethical guidelines of the 1975 Declaration of Helsinki, as reflected by prior approval from the institutional review board of the Kurume University School of Medicine (approval number 20226). This research was performed under the relevant guidelines and regulations. An opt-out approach was used to obtain informed consent from patients, and personal information was protected during data collection.
4.2. Subjects
We enrolled 48 consecutive outpatients with NAFLD who visited Kurume University Hospital between May 2019 and April 2020. The inclusion criteria were as follows: (1) age > 18 years, (2) answered the CLDQ-NAFLD/NASH, and (3) underwent liver stiffness measurement. Exclusion criteria were as follows: (1) complications of other major diseases that might bias their activity, including congestive heart failure, renal failure, respiratory disease, cancer, and orthopedic disease, and (2) any condition that could interfere with answering survey queries, including psychiatric or emotional problems, language, or cognitive difficulties.
4.3. Diagnosis of NAFLD
The diagnosis of NAFLD was established according to the Clinical Practice Guidelines for NAFLD/NASH [3,51,52]: (1) hepatic steatosis evaluated by liver biopsy, ultrasonography, computed tomography, or magnetic resonance imaging; (2) ethanol intake <20 g/day in women or <30 g/day in men; and (3) exclusion of other liver diseases, including hepatitis B virus, hepatitis C virus, autoimmune hepatitis, drug-induced liver disease, primary biliary cholangitis, primary sclerosing cholangitis, biliary obstruction, Wilson’s disease, and hemochromatosis.
4.4. Data Collection
All data were collected prospectively at the patients’ regular visits. The following information was obtained using a self-reported questionnaire: age, sex, and amount of daily alcohol intake. In the clinical review, we obtained the following data: body mass index (BMI), waist circumference, presence/absence of type 2 diabetes mellitus, hypertension, and dyslipidemia; these were diagnosed according to standard criteria [53]. We also assessed physical frailty using the liver frailty index, as previously reported [54].
4.5. Disease-Specific Patient-Reported Outcome Measure for Patients with NAFLD
The CLDQ-NAFLD/NASH is a disease-specific questionnaire that consists of 36 items grouped into 6 domains: fatigue, systemic symptoms, emotional health, worry, abdominal symptoms, and activity [8,10,11]. All participants were asked to complete the Japanese version of the CLDQ-NAFLD, which has previously been validated in Japan [9]. The questions were closed-ended, and the answers were provided using a Likert scale ranging from 1 (all the time) to 7 (none of the time), representing the frequency of clinical symptoms and emotional problems. The average score was calculated for each domain, and higher scores indicated a minimal frequency of symptoms and, consequently, a better health-related quality of life.
4.6. Assessment of Activity and Definition for Reduction in Activity
Activity was assessed by the activity domain of the CLDQ-NAFLD/NASH. Patients with activity domain scores < 6 were classified into the reduced activity group. Patients with activity domain scores ≥ 6 were classified into the normal activity group.
4.7. Biochemical Examination, Serum Levels of BDNF, and Serum Levels of Inflammatory Cytokines and Myokine
Blood samples were collected after overnight fasting. The following biochemical tests were performed: complete blood cell count, aspartate aminotransferase, alanine aminotransferase, alkaline phosphatase, γ-glutamyl transpeptidase, albumin, total bilirubin, total cholesterol, low-density lipoprotein cholesterol, triglycerides, fasting glucose, HbA1c, blood urea nitrogen, creatinine, estimated glomerular filtration rate, C-reactive protein, Mac-2 binding protein glycosylation isomer, alpha-fetoprotein, and des-gamma-carboxy prothrombin.
Serum levels of BDNF were measured using a Human BDNF enzyme-linked immunoassay (ELISA) kit according to the manufacturer’s instructions (R&D Systems, Inc., Minneapolis, MN, USA).
Serum levels of IL-1, IL-6, IL-10, IL-15, and myostatin were measured using a Human IL-1 ELISA Kit, a Human IL-6 ELISA Kit, a Human IL-10 ELISA Kit, a Human IL-15 ELISA Kit, or a Myostatin Quantikine ELISA Kit from R&D Systems, Inc. (Minneapolis, MN, USA), according to the manufacturer’s instructions.
4.8. Measurement for Liver Stiffness and Controlled and Hepatic Steatosis
Liver stiffness and hepatic steatosis were evaluated under fasting conditions for more than 4 h by vibration-controlled transient elastography and controlled attenuation parameters using FibroScan® (Echosens, Paris, France), respectively. The median value of 10 valid measurements was calculated, and the results of elasticity and controlled attenuation parameters were expressed in kiloPascals (kPa) and dB/m, respectively. A valid result included at least 10 valid measurements with an interquartile range (IQR)/median value of <30%, as previously described [55].
4.9. Statistical Analysis
Data are expressed as median (interquartile range), range, or number. The differences between the reduction and no reduction in activity groups were analyzed using Wilcoxon rank-sum tests. Factors associated with the reduction in activity were analyzed using logistic regression analysis and data mining techniques. The statistical methods are described in detail below.
Independent factors associated with reduced activity levels were analyzed using logistic regression analysis, as previously described. Explanatory variables were selected in a stepwise manner, minimizing the Bayesian information criterion, as previously described [26]. Data were expressed as odds ratios and 95% confidence intervals.
A decision-tree algorithm was constructed to reveal profiles associated with reduced activity, as previously described [26]. The initial classifier was the most important factor associated with reduced activity. Subjects were classified according to the cut-off values indicated for each variable. The cut-off value was determined by the decision-tree analysis, which gives the best split of valuables [56,57].
A random forest analysis was used to identify factors distinguishing between the reduced and normal activity groups on an ordinal scale, as previously described [23]. The variable importance value, which reflects the relative contribution of each variable to the model, was estimated by randomly permuting its values and recalculating the predictive accuracy of the model.
All statistical analyses were performed using JMP Pro® 15 (SAS Institute Inc., Cary, NC, USA). All p values were 2-tailed, and a value < 0.05 was considered statistically significant.
Author Contributions
Conceptualization, R.H., D.N., S.Y., T.K. and H.T.; methodology, R.H., D.N., S.Y. and T.K.; software, T.T. (Tsubasa Tsutsumi); validation, T.T. (Tsubasa Tsutsumi) and H.M.; formal analysis, R.H. and T.K.; investigation, D.N. and S.Y.; resources, T.K.; data curation, D.N., S.Y., H.M. and H.T.; writing—original draft preparation, R.H., D.N., S.Y. and T.K.; writing—review and editing, T.T. (Tsubasa Tsutsumi), H.M., H.T., L.G., Z.M.Y. and T.T. (Takuji Torimura); visualization, T.K., L.G., Z.M.Y. and T.T. (Takuji Torimura); supervision, L.G., Z.M.Y. and T.T. (Takuji Torimura); project administration, T.K.; funding acquisition, T.K. All authors have read and agreed to the published version of the manuscript.
Funding
This research was supported by the Japan Society for the Promotion of Science (JSPS) Grant-in-Aid for Scientific Research (C) JP20K08395.
Institutional Review Board Statement
This study conformed to the ethical guidelines of the Declaration of Helsinki as reflected by prior approval from the institutional review board of the Kurume University School of Medicine (approval number 20226).
Informed Consent Statement
An opt-out approach was used to obtain informed consent from patients, and personal information was protected during data collection.
Data Availability Statement
Data are available upon reasonable request.
Acknowledgments
We thank Masako Hayakawa for technical assistance with the measurement of cytokines.
Conflicts of Interest
Takumi Kawaguchi received lecture fees from Mitsubishi Tanabe Pharma Corporation and Otsuka Pharmaceutical Co., Ltd. The other authors have no conflicts of interest to declare.
References
- Younossi, Z.M. Non-alcoholic fatty liver disease—A global public health perspective. J. Hepatol. 2019, 70, 531–544. [Google Scholar] [CrossRef] [Green Version]
- Zhang, X.; Goh, G.B.; Chan, W.K.; Wong, G.L.; Fan, J.G.; Seto, W.K.; Huang, Y.H.; Lin, H.C.; Lee, I.C.; Lee, H.W.; et al. Unhealthy lifestyle habits and physical inactivity among Asian patients with non-alcoholic fatty liver disease. Liver Int. 2020, 40, 2719–2731. [Google Scholar] [CrossRef]
- Chalasani, N.; Younossi, Z.; Lavine, J.E.; Charlton, M.; Cusi, K.; Rinella, M.; Harrison, S.A.; Brunt, E.M.; Sanyal, A.J. The diagnosis and management of nonalcoholic fatty liver disease: Practice guidance from the American Association for the Study of Liver Diseases. Hepatology 2018, 67, 328–357. [Google Scholar] [CrossRef]
- Kawaguchi, T.; Shiba, N.; Maeda, T.; Matsugaki, T.; Takano, Y.; Itou, M.; Sakata, M.; Taniguchi, E.; Nagata, K.; Sata, M. Hybrid training of voluntary and electrical muscle contractions reduces steatosis, insulin resistance, and IL-6 levels in patients with NAFLD: A pilot study. J. Gastroenterol. 2011, 46, 746–757. [Google Scholar] [CrossRef]
- Hashida, R.; Kawaguchi, T.; Bekki, M.; Omoto, M.; Matsuse, H.; Nago, T.; Takano, Y.; Ueno, T.; Koga, H.; George, J.; et al. Aerobic vs. resistance exercise in non-alcoholic fatty liver disease: A systematic review. J. Hepatol. 2017, 66, 142–152. [Google Scholar] [CrossRef]
- Romero-Gomez, M.; Zelber-Sagi, S.; Trenell, M. Treatment of NAFLD with diet, physical activity and exercise. J. Hepatol. 2017, 67, 829–846. [Google Scholar] [CrossRef] [Green Version]
- Golabi, P.; Gerber, L.; Paik, J.M.; Deshpande, R.; de Avila, L.; Younossi, Z.M. Contribution of sarcopenia and physical inactivity to mortality in people with non-alcoholic fatty liver disease. JHEP Rep. 2020, 2, 100171. [Google Scholar] [CrossRef] [PubMed]
- Younossi, Z.M.; Stepanova, M.; Henry, L.; Racila, A.; Lam, B.; Pham, H.T.; Hunt, S. A disease-specific quality of life instrument for non-alcoholic fatty liver disease and non-alcoholic steatohepatitis: CLDQ-NAFLD. Liver Int. 2017, 37, 1209–1218. [Google Scholar] [CrossRef] [PubMed]
- Yamamura, S.; Nakano, D.; Hashida, R.; Tsutsumi, T.; Kawaguchi, T.; Okada, M.; Isoda, H.; Takahashi, H.; Matsuse, H.; Eguchi, Y.; et al. Patient-reported outcomes in patients with non-alcoholic fatty liver disease: A narrative review of Chronic Liver Disease Questionnaire-non-alcoholic fatty liver disease/non-alcoholic steatohepatitis. J. Gastroenterol. Hepatol. 2020, 36, 629–636. [Google Scholar] [CrossRef] [PubMed]
- Younossi, Z.M.; Stepanova, M.; Younossi, I.; Racila, A. Validation of Chronic Liver Disease Questionnaire for Nonalcoholic Steatohepatitis in Patients With Biopsy-Proven Nonalcoholic Steatohepatitis. Clin. Gastroenterol. Hepatol. 2019, 17, 2093–2100. [Google Scholar] [CrossRef] [PubMed]
- Younossi, Z.M.; Stepanova, M.; Anstee, Q.M.; Lawitz, E.J.; Wai-Sun Wong, V.; Romero-Gomez, M.; Kersey, K.; Li, G.; Subramanian, G.M.; Myers, R.P.; et al. Reduced Patient-Reported Outcome Scores Associate With Level of Fibrosis in Patients With Nonalcoholic Steatohepatitis. Clin. Gastroenterol. Hepatol. 2019, 17, 2552–2560. [Google Scholar] [CrossRef] [Green Version]
- Sinclair, A.J.; Conroy, S.P.; Bayer, A.J. Impact of diabetes on physical function in older people. Diabetes Care 2008, 31, 233–235. [Google Scholar] [CrossRef] [PubMed] [Green Version]
- Wong, E.; Backholer, K.; Gearon, E.; Harding, J.; Freak-Poli, R.; Stevenson, C.; Peeters, A. Diabetes and risk of physical disability in adults: A systematic review and meta-analysis. Lancet Diabetes Endocrinol. 2013, 1, 106–114. [Google Scholar] [CrossRef] [Green Version]
- Rong, Y.D.; Bian, A.L.; Hu, H.Y.; Ma, Y.; Zhou, X.Z. Study on relationship between elderly sarcopenia and inflammatory cytokine IL-6, anti-inflammatory cytokine IL-10. BMC Geriatr. 2018, 18, 308. [Google Scholar] [CrossRef] [Green Version]
- Yalcin, A.; Silay, K.; Balik, A.R.; Avcioglu, G.; Aydin, A.S. The relationship between plasma interleukin-15 levels and sarcopenia in outpatient older people. Aging Clin. Exp. Res. 2018, 30, 783–790. [Google Scholar] [CrossRef]
- Fidai, M.S.; Tramer, J.S.; Meldau, J.; Khalil, L.S.; Patel, R.B.; Moutzouros, V.; Makhni, E.C. Mental Health and Tobacco Use Are Correlated With Physical Function Outcomes in Patients With Knee Pain and Injury. Arthroscopy 2019, 35, 3295–3301. [Google Scholar] [CrossRef]
- Carniel, B.P.; da Rocha, N.S. Brain-derived neurotrophic factor (BDNF) and inflammatory markers: Perspectives for the management of depression. Prog. Neuropsychopharmacol. Biol. Psychiatry 2020, 108, 110151. [Google Scholar] [CrossRef]
- Rasmussen, P.; Brassard, P.; Adser, H.; Pedersen, M.V.; Leick, L.; Hart, E.; Secher, N.H.; Pedersen, B.K.; Pilegaard, H. Evidence for a release of brain-derived neurotrophic factor from the brain during exercise. Exp. Physiol. 2009, 94, 1062–1069. [Google Scholar] [CrossRef] [PubMed]
- Pedersen, B.K. Physical activity and muscle-brain crosstalk. Nat. Rev. Endocrinol. 2019, 15, 383–392. [Google Scholar] [CrossRef]
- Matthews, V.B.; Astrom, M.B.; Chan, M.H.; Bruce, C.R.; Krabbe, K.S.; Prelovsek, O.; Akerstrom, T.; Yfanti, C.; Broholm, C.; Mortensen, O.H.; et al. Brain-derived neurotrophic factor is produced by skeletal muscle cells in response to contraction and enhances fat oxidation via activation of AMP-activated protein kinase. Diabetologia 2009, 52, 1409–1418. [Google Scholar] [CrossRef] [PubMed] [Green Version]
- Mora-Gonzalez, J.; Migueles, J.H.; Esteban-Cornejo, I.; Cadenas-Sanchez, C.; Pastor-Villaescusa, B.; Molina-Garcia, P.; Rodriguez-Ayllon, M.; Rico, M.C.; Gil, A.; Aguilera, C.M.; et al. Sedentarism, Physical Activity, Steps, and Neurotrophic Factors in Obese Children. Med. Sci. Sports Exerc. 2019, 51, 2325–2333. [Google Scholar] [CrossRef]
- Bellazzi, R.; Zupan, B. Predictive data mining in clinical medicine: Current issues and guidelines. Int. J. Med. Inform. 2008, 77, 81–97. [Google Scholar] [CrossRef] [Green Version]
- Yamada, S.; Kawaguchi, A.; Kawaguchi, T.; Fukushima, N.; Kuromatsu, R.; Sumie, S.; Takata, A.; Nakano, M.; Satani, M.; Tonan, T.; et al. Serum albumin level is a notable profiling factor for non-B, non-C hepatitis virus-related hepatocellular carcinoma: A data-mining analysis. Hepatol. Res. 2014, 44, 837–845. [Google Scholar] [CrossRef]
- Touw, W.G.; Bayjanov, J.R.; Overmars, L.; Backus, L.; Boekhorst, J.; Wels, M.; van Hijum, S.A. Data mining in the Life Sciences with Random Forest: A walk in the park or lost in the jungle? Brief. Bioinform. 2013, 14, 315–326. [Google Scholar] [CrossRef] [PubMed] [Green Version]
- Perveen, S.; Shahbaz, M.; Keshavjee, K.; Guergachi, A. A Systematic Machine Learning Based Approach for the Diagnosis of Non-Alcoholic Fatty Liver Disease Risk and Progression. Sci. Rep. 2018, 8, 2112. [Google Scholar] [CrossRef] [Green Version]
- Kawaguchi, T.; Tokushige, K.; Hyogo, H.; Aikata, H.; Nakajima, T.; Ono, M.; Kawanaka, M.; Sawada, K.; Imajo, K.; Honda, K.; et al. A Data Mining-based Prognostic Algorithm for NAFLD-related Hepatoma Patients: A Nationwide Study by the Japan Study Group of NAFLD. Sci. Rep. 2018, 8, 10434. [Google Scholar] [CrossRef] [PubMed]
- Cohen, D.A.; Williamson, S.; Han, B. Gender Differences in Physical Activity Associated with Urban Neighborhood Parks: Findings from the National Study of Neighborhood Parks. Womens Health Issues 2020, 31, 236–244. [Google Scholar] [CrossRef] [PubMed]
- Skelly, A.C.; Dettori, J.R.; Brodt, E.D. Assessing bias: The importance of considering confounding. Evid. Based Spine Care J. 2012, 3, 9–12. [Google Scholar] [CrossRef] [PubMed] [Green Version]
- Erickson, K.I.; Prakash, R.S.; Voss, M.W.; Chaddock, L.; Heo, S.; McLaren, M.; Pence, B.D.; Martin, S.A.; Vieira, V.J.; Woods, J.A.; et al. Brain-derived neurotrophic factor is associated with age-related decline in hippocampal volume. J. Neurosci. 2010, 30, 5368–5375. [Google Scholar] [CrossRef] [PubMed] [Green Version]
- Chan, C.B.; Ye, K. Sex differences in brain-derived neurotrophic factor signaling and functions. J. Neurosci. Res. 2017, 95, 328–335. [Google Scholar] [CrossRef] [Green Version]
- Amoureux, S.; Lorgis, L.; Sicard, P.; Girard, C.; Rochette, L.; Vergely, C. Vascular BDNF expression and oxidative stress during aging and the development of chronic hypertension. Fundam. Clin. Pharmacol. 2012, 26, 227–234. [Google Scholar] [CrossRef]
- Carbone, S.; Del Buono, M.G.; Ozemek, C.; Lavie, C.J. Obesity, risk of diabetes and role of physical activity, exercise training and cardiorespiratory fitness. Prog. Cardiovasc. Dis. 2019, 62, 327–333. [Google Scholar] [CrossRef] [PubMed]
- Kallio, P.; Pahkala, K.; Heinonen, O.J.; Tammelin, T.; Hirvensalo, M.; Telama, R.; Juonala, M.; Magnussen, C.G.; Rovio, S.; Helajarvi, H.; et al. Physical Inactivity from Youth to Adulthood and Risk of Impaired Glucose Metabolism. Med. Sci. Sports Exerc. 2018, 50, 1192–1198. [Google Scholar] [CrossRef] [PubMed]
- Hagedoorn, I.J.M.; den Braber, N.; Oosterwijk, M.M.; Gant, C.M.; Navis, G.; Vollenbroek-Hutten, M.M.R.; van Beijnum, B.F.; Bakker, S.J.L.; Laverman, G.D. Low Physical Activity in Patients with Complicated Type 2 Diabetes Mellitus Is Associated with Low Muscle Mass and Low Protein Intake. J. Clin. Med. 2020, 9, 3104. [Google Scholar] [CrossRef]
- Yates, T.; Gray, L.J.; Henson, J.; Edwardson, C.L.; Khunti, K.; Davies, M.J. Impact of Depression and Anxiety on Change to Physical Activity Following a Pragmatic Diabetes Prevention Program Within Primary Care: Pooled Analysis From Two Randomized Controlled Trials. Diabetes Care 2019, 42, 1847–1853. [Google Scholar] [CrossRef]
- Neeper, S.A.; Gomez-Pinilla, F.; Choi, J.; Cotman, C.W. Physical activity increases mRNA for brain-derived neurotrophic factor and nerve growth factor in rat brain. Brain Res. 1996, 726, 49–56. [Google Scholar] [CrossRef]
- Garcia, C.; Chen, M.J.; Garza, A.A.; Cotman, C.W.; Russo-Neustadt, A. The influence of specific noradrenergic and serotonergic lesions on the expression of hippocampal brain-derived neurotrophic factor transcripts following voluntary physical activity. Neuroscience 2003, 119, 721–732. [Google Scholar] [CrossRef]
- Chan, K.L.; Tong, K.Y.; Yip, S.P. Relationship of serum brain-derived neurotrophic factor (BDNF) and health-related lifestyle in healthy human subjects. Neurosci. Lett. 2008, 447, 124–128. [Google Scholar] [CrossRef]
- Huang, T.; Gejl, A.K.; Tarp, J.; Andersen, L.B.; Peijs, L.; Bugge, A. Cross-sectional associations of objectively measured physical activity with brain-derived neurotrophic factor in adolescents. Physiol. Behav. 2017, 171, 87–91. [Google Scholar] [CrossRef] [PubMed] [Green Version]
- Suwa, M.; Kishimoto, H.; Nofuji, Y.; Nakano, H.; Sasaki, H.; Radak, Z.; Kumagai, S. Serum brain-derived neurotrophic factor level is increased and associated with obesity in newly diagnosed female patients with type 2 diabetes mellitus. Metabolism 2006, 55, 852–857. [Google Scholar] [CrossRef]
- Levinger, I.; Goodman, C.; Matthews, V.; Hare, D.L.; Jerums, G.; Garnham, A.; Selig, S. BDNF, metabolic risk factors, and resistance training in middle-aged individuals. Med. Sci. Sports Exerc. 2008, 40, 535–541. [Google Scholar] [CrossRef]
- de Avila, L.; Weinstein, A.A.; Estep, J.M.; Curry, M.P.; Golabi, P.; Escheik, C.; Birerdinc, A.; Stepanova, M.; Gerber, L.; Younossi, Z.M. Cytokine balance is restored as patient-reported outcomes improve in patients recovering from chronic hepatitis C. Liver Int. 2019, 39, 1631–1640. [Google Scholar] [CrossRef] [PubMed]
- Hashimoto, K. Ethnic differences in the serum levels of proBDNF, a precursor of brain-derived neurotrophic factor (BDNF), in mood disorders. Eur. Arch. Psychiatry Clin. Neurosci. 2016, 266, 285–287. [Google Scholar] [CrossRef]
- Wu, C.; Lu, J.; Lu, S.; Huang, M.; Xu, Y. Increased ratio of mature BDNF to precursor-BDNF in patients with major depressive disorder with severe anhedonia. J. Psychiatr. Res. 2020, 126, 92–97. [Google Scholar] [CrossRef]
- Siuda, J.; Patalong-Ogiewa, M.; Zmuda, W.; Targosz-Gajniak, M.; Niewiadomska, E.; Matuszek, I.; Jedrzejowska-Szypulka, H.; Lewin-Kowalik, J.; Rudzinska-Bar, M. Cognitive impairment and BDNF serum levels. Neurol. Neurochir. Pol. 2017, 51, 24–32. [Google Scholar] [CrossRef] [PubMed]
- Roy, N.; Barry, R.J.; Fernandez, F.E.; Lim, C.K.; Al-Dabbas, M.A.; Karamacoska, D.; Broyd, S.J.; Solowij, N.; Chiu, C.L.; Steiner, G.Z. Electrophysiological correlates of the brain-derived neurotrophic factor (BDNF) Val66Met polymorphism. Sci. Rep. 2020, 10, 17915. [Google Scholar] [CrossRef] [PubMed]
- Fischer, D.L.; Auinger, P.; Goudreau, J.L.; Cole-Strauss, A.; Kieburtz, K.; Elm, J.J.; Hacker, M.L.; Charles, P.D.; Lipton, J.W.; Pickut, B.A.; et al. BDNF rs6265 Variant Alters Outcomes with Levodopa in Early-Stage Parkinson's Disease. Neurotherapeutics 2020, 17, 1785–1795. [Google Scholar] [CrossRef] [PubMed]
- Kernie, S.G.; Liebl, D.J.; Parada, L.F. BDNF regulates eating behavior and locomotor activity in mice. EMBO J. 2000, 19, 1290–1300. [Google Scholar] [CrossRef] [Green Version]
- Lyons, W.E.; Mamounas, L.A.; Ricaurte, G.A.; Coppola, V.; Reid, S.W.; Bora, S.H.; Wihler, C.; Koliatsos, V.E.; Tessarollo, L. Brain-derived neurotrophic factor-deficient mice develop aggressiveness and hyperphagia in conjunction with brain serotonergic abnormalities. Proc. Natl. Acad. Sci. USA 1999, 96, 15239–15244. [Google Scholar] [CrossRef] [Green Version]
- Nakagawa, T.; Tsuchida, A.; Itakura, Y.; Nonomura, T.; Ono, M.; Hirota, F.; Inoue, T.; Nakayama, C.; Taiji, M.; Noguchi, H. Brain-derived neurotrophic factor regulates glucose metabolism by modulating energy balance in diabetic mice. Diabetes 2000, 49, 436–444. [Google Scholar] [CrossRef] [Green Version]
- Watanabe, S.; Hashimoto, E.; Ikejima, K.; Uto, H.; Ono, M.; Sumida, Y.; Seike, M.; Takei, Y.; Takehara, T.; Tokushige, K.; et al. Evidence-based clinical practice guidelines for nonalcoholic fatty liver disease/nonalcoholic steatohepatitis. Hepatol. Res. 2015, 45, 363–377. [Google Scholar] [CrossRef]
- European Association for the Study of the Liver (EASL); European Association for the Study of Diabetes (EASD); European Association for the Study of Obesity (EASO). EASL-EASD-EASO Clinical Practice Guidelines for the management of non-alcoholic fatty liver disease. J. Hepatol. 2016, 64, 1388–1402. [Google Scholar] [CrossRef] [Green Version]
- Yamamura, S.; Eslam, M.; Kawaguchi, T.; Tsutsumi, T.; Nakano, D.; Yoshinaga, S.; Takahashi, H.; Anzai, K.; George, J.; Torimura, T. MAFLD identifies patients with significant hepatic fibrosis better than NAFLD. Liver Int. 2020, 40, 3018–3030. [Google Scholar] [CrossRef] [PubMed]
- Hirota, K.; Kawaguchi, T.; Koya, S.; Nagamatsu, A.; Tomita, M.; Hashida, R.; Nakano, D.; Niizeki, T.; Matsuse, H.; Shiba, N.; et al. Clinical utility of the Liver Frailty Index for predicting muscle atrophy in chronic liver disease patients with hepatocellular carcinoma. Hepatol. Res. 2020, 50, 330–341. [Google Scholar] [CrossRef]
- Zeng, Q.; Song, Z.; Zhao, Y.; Wu, J.; Wang, L.; Ye, H.; Wang, Y.; Wu, T.; Yuan, S.; Yuan, H. Controlled attenuation parameter by vibration-controlled transient elastography for steatosis assessment in members of the public undergoing regular health checkups with reference to magnetic resonance imaging-based proton density fat fraction. Hepatol. Res. 2020, 50, 578–587. [Google Scholar] [CrossRef] [PubMed]
- Che, D.; Liu, Q.; Rasheed, K.; Tao, X. Decision tree and ensemble learning algorithms with their applications in bioinformatics. Adv. Exp. Med. Biol. 2011, 696, 191–199. [Google Scholar]
- Weber, R.M.; Fajen, B.R. Decision-tree analysis of control strategies. Psychon. Bull. Rev. 2015, 22, 653–672. [Google Scholar] [CrossRef] [PubMed]

Publisher’s Note: MDPI stays neutral with regard to jurisdictional claims in published maps and institutional affiliations. |
© 2021 by the authors. Licensee MDPI, Basel, Switzerland. This article is an open access article distributed under the terms and conditions of the Creative Commons Attribution (CC BY) license (https://creativecommons.org/licenses/by/4.0/).