
Small Mammal Diversity Changes in a Baltic Country, 1975–2021: A Review


Abstract
:Simple Summary
Abstract
1. Introduction
2. Materials and Methods
2.1. Collection of the Published Material
2.2. Dataset
2.3. Data Analysis
3. Results
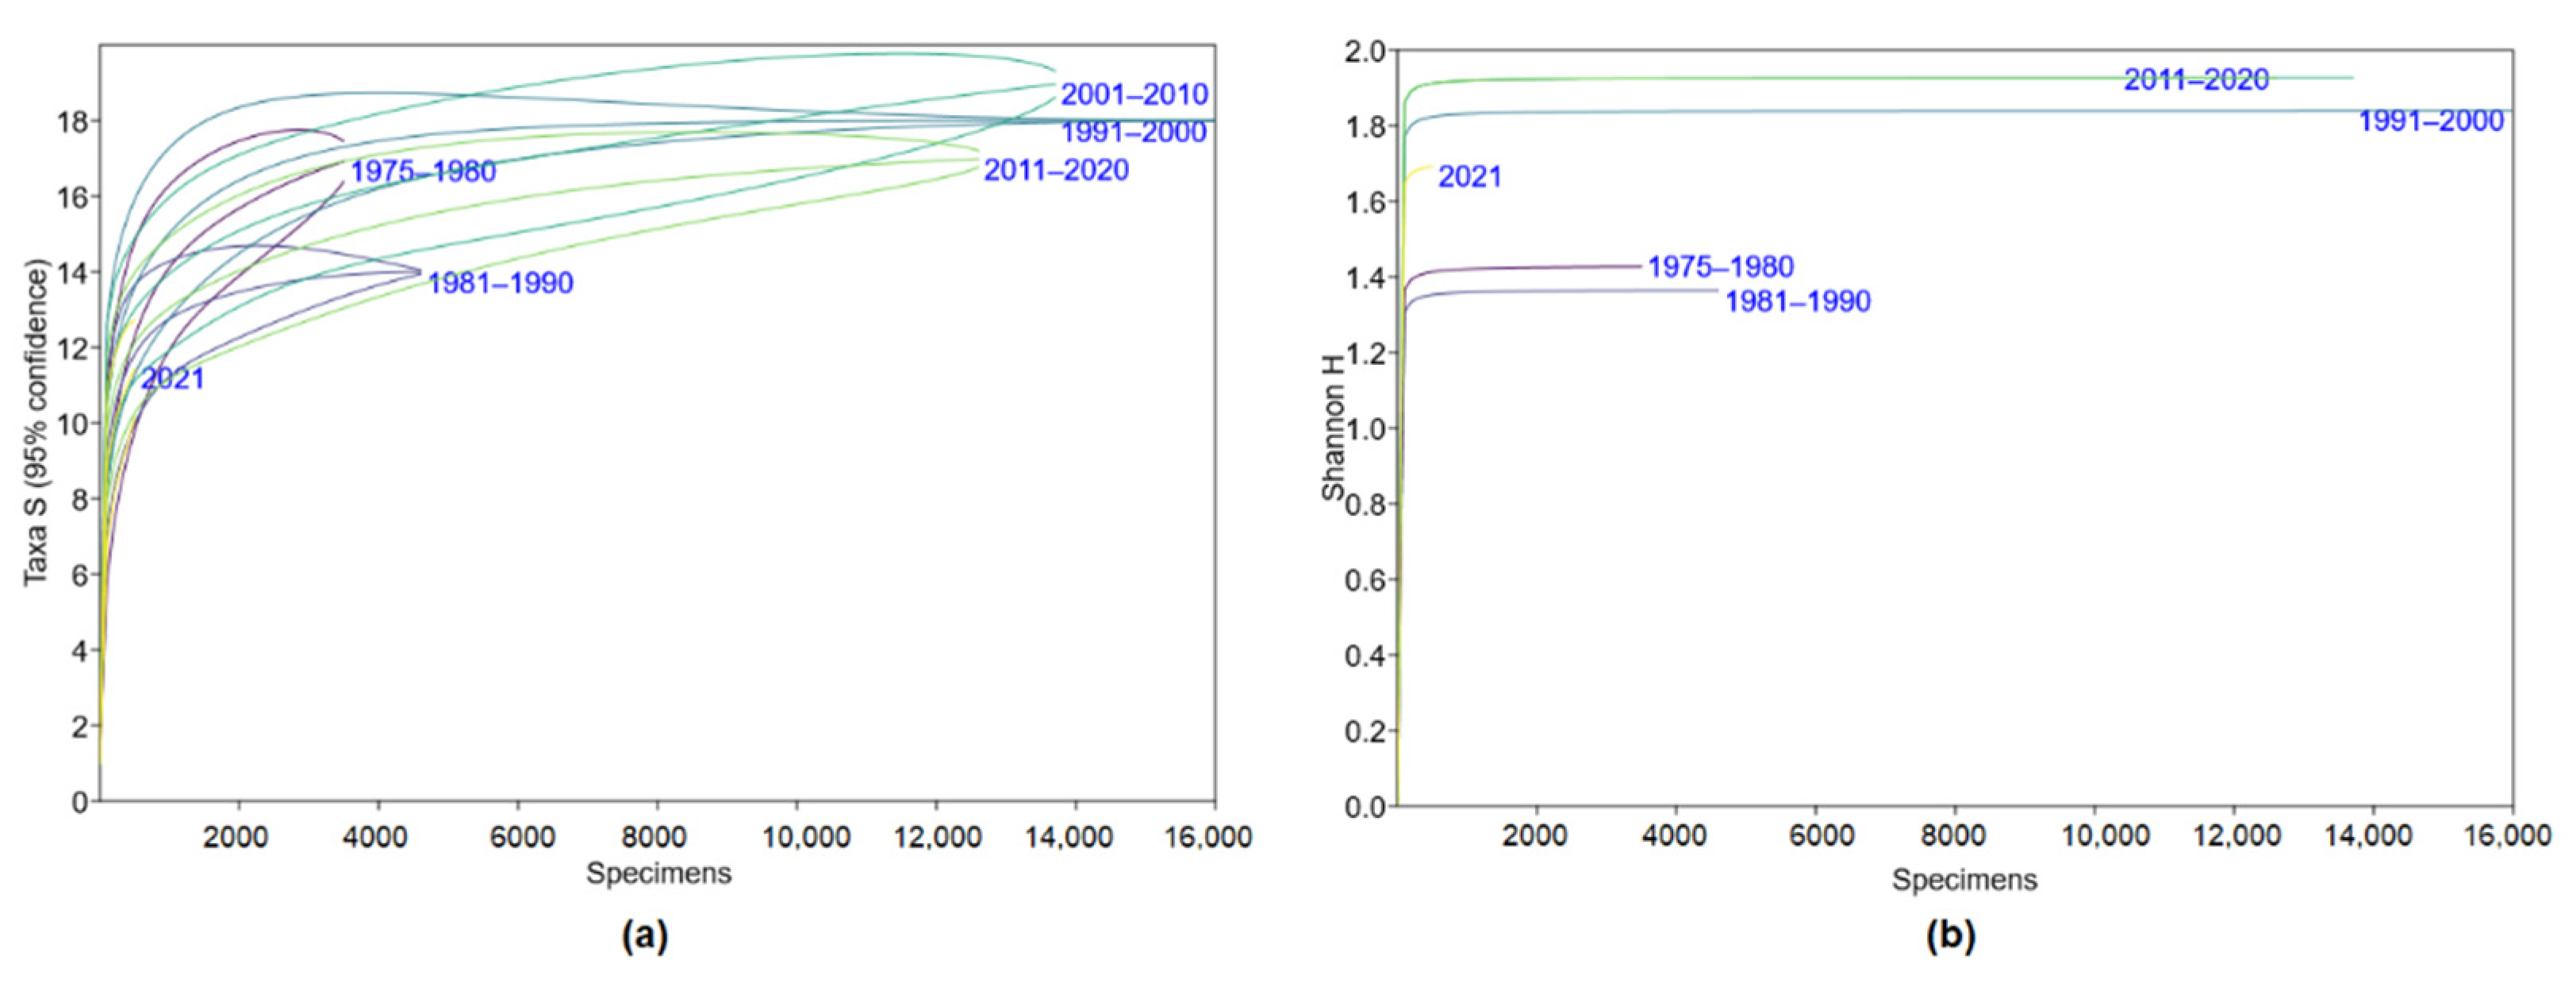
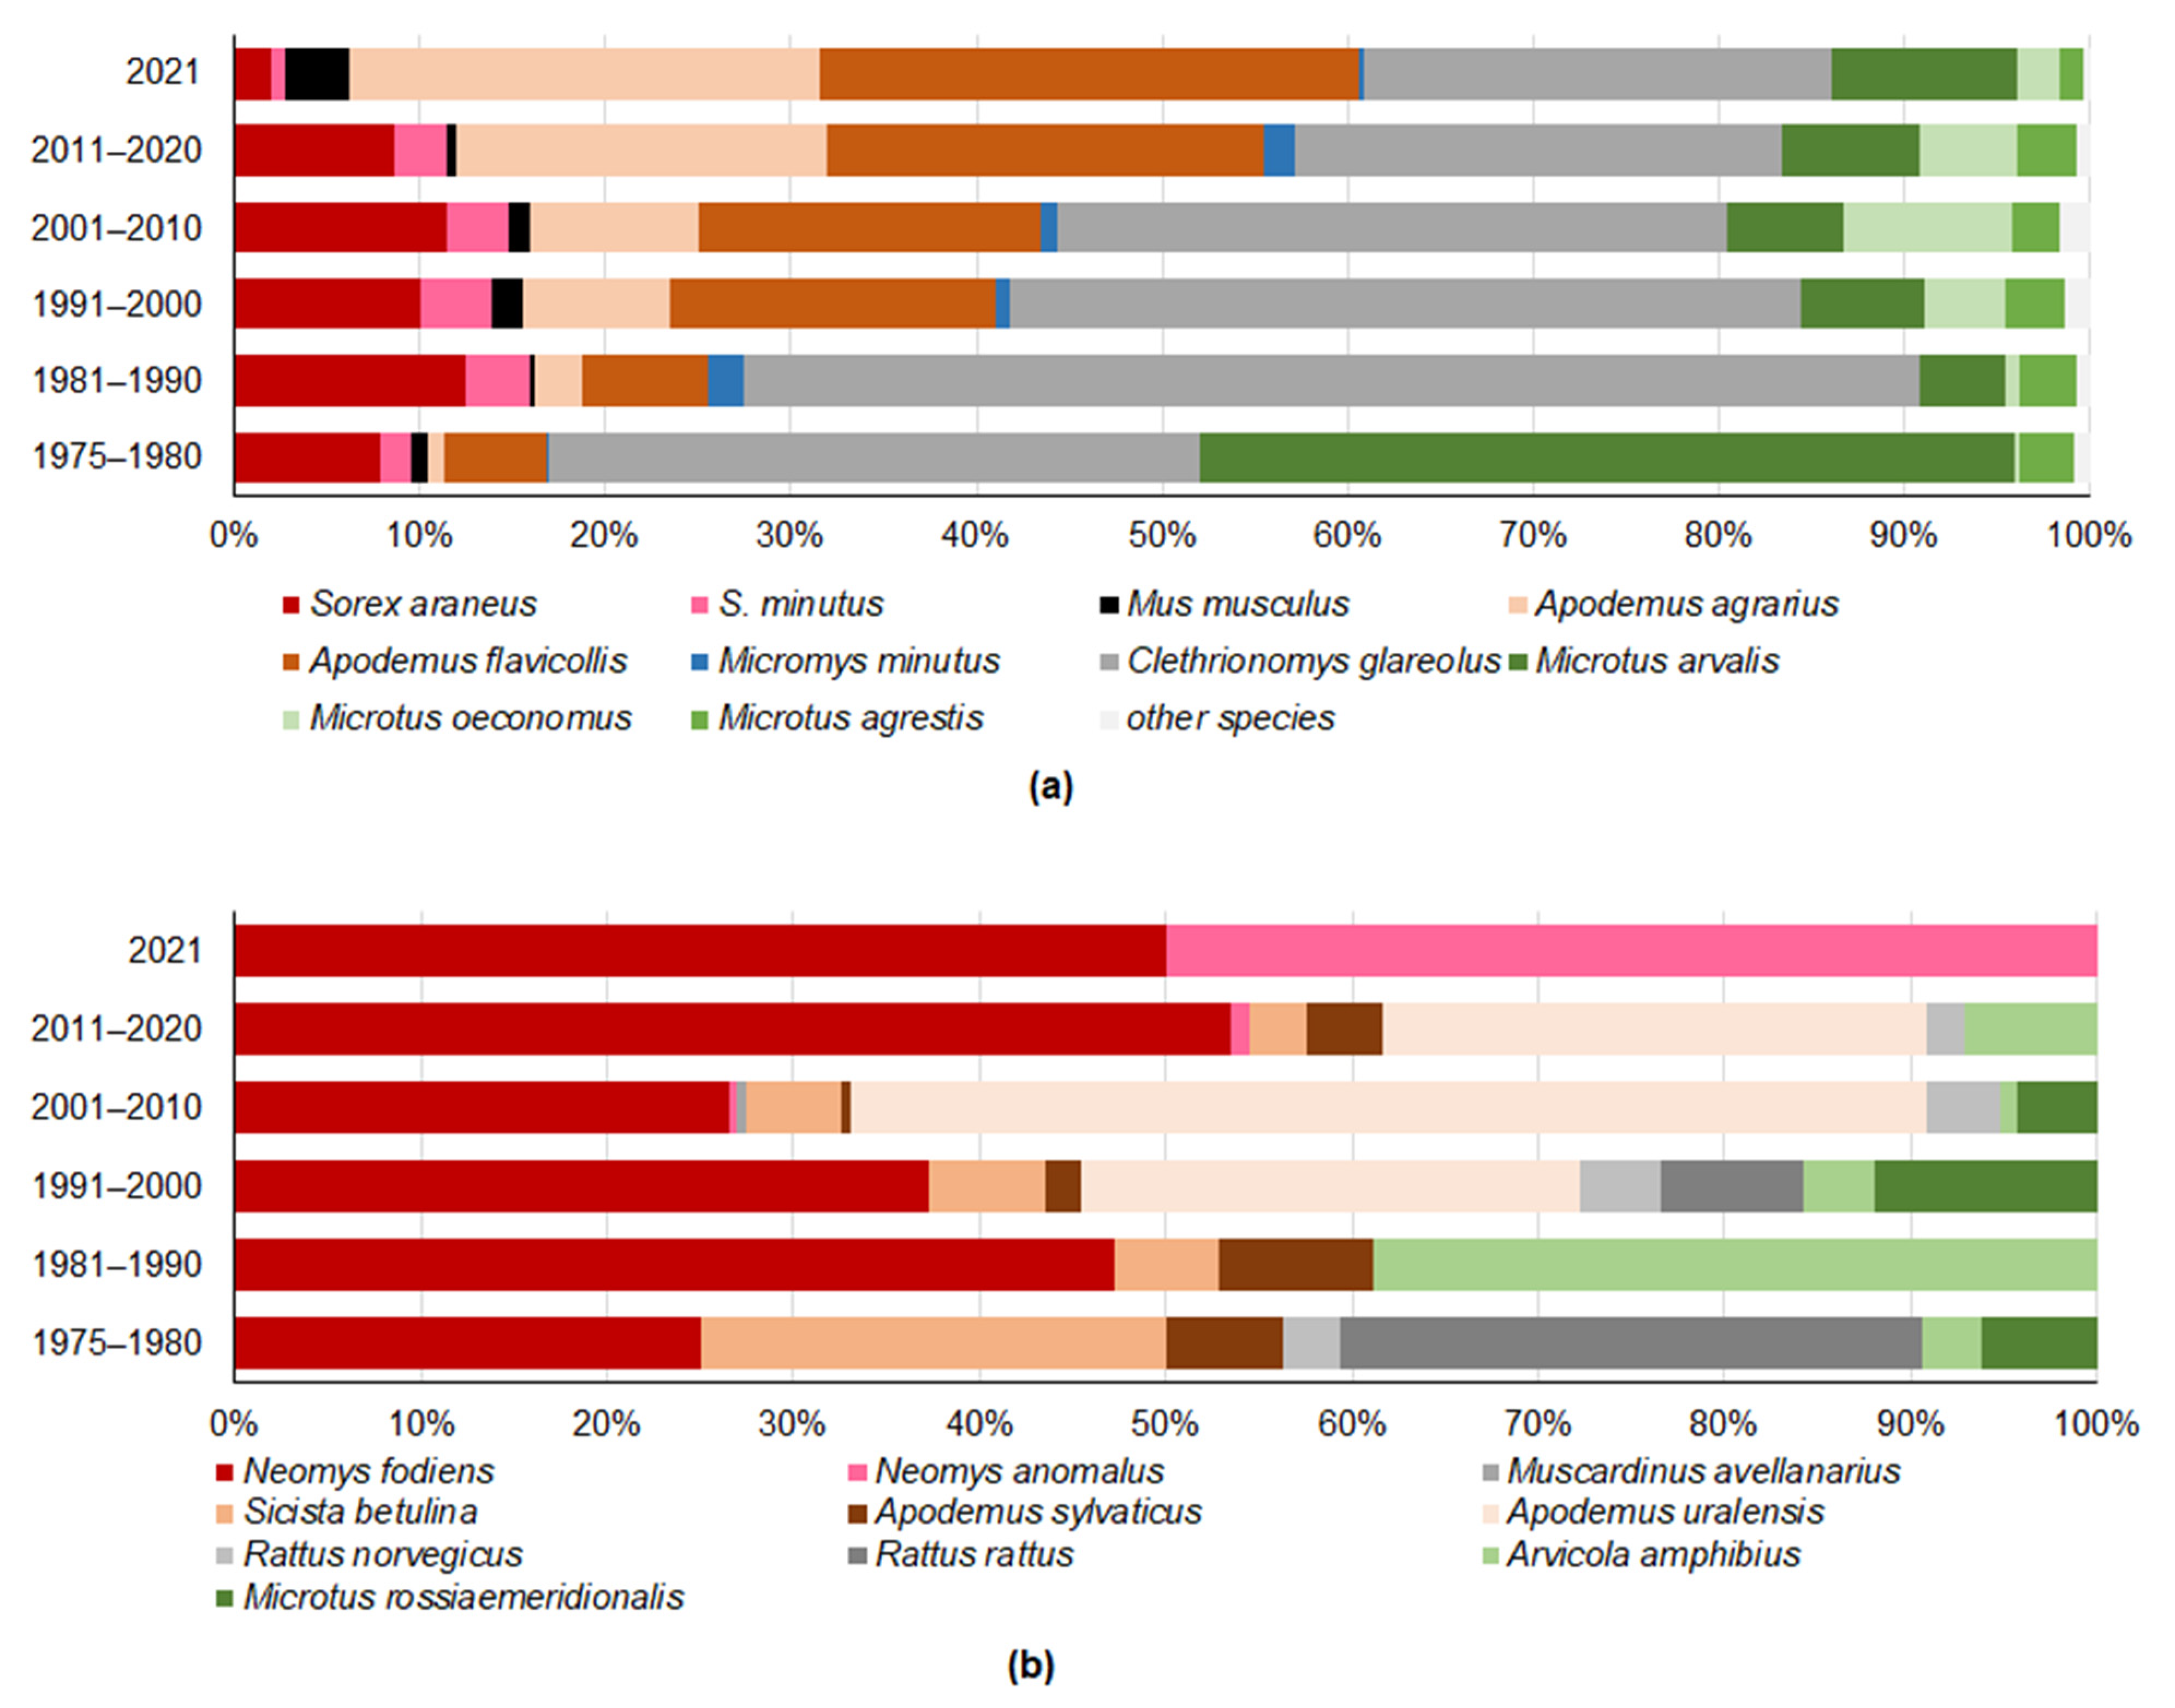
3.1. Changes in Trapped Small Mammal Diversity and Species Richness in Lithuania, 1975–2021
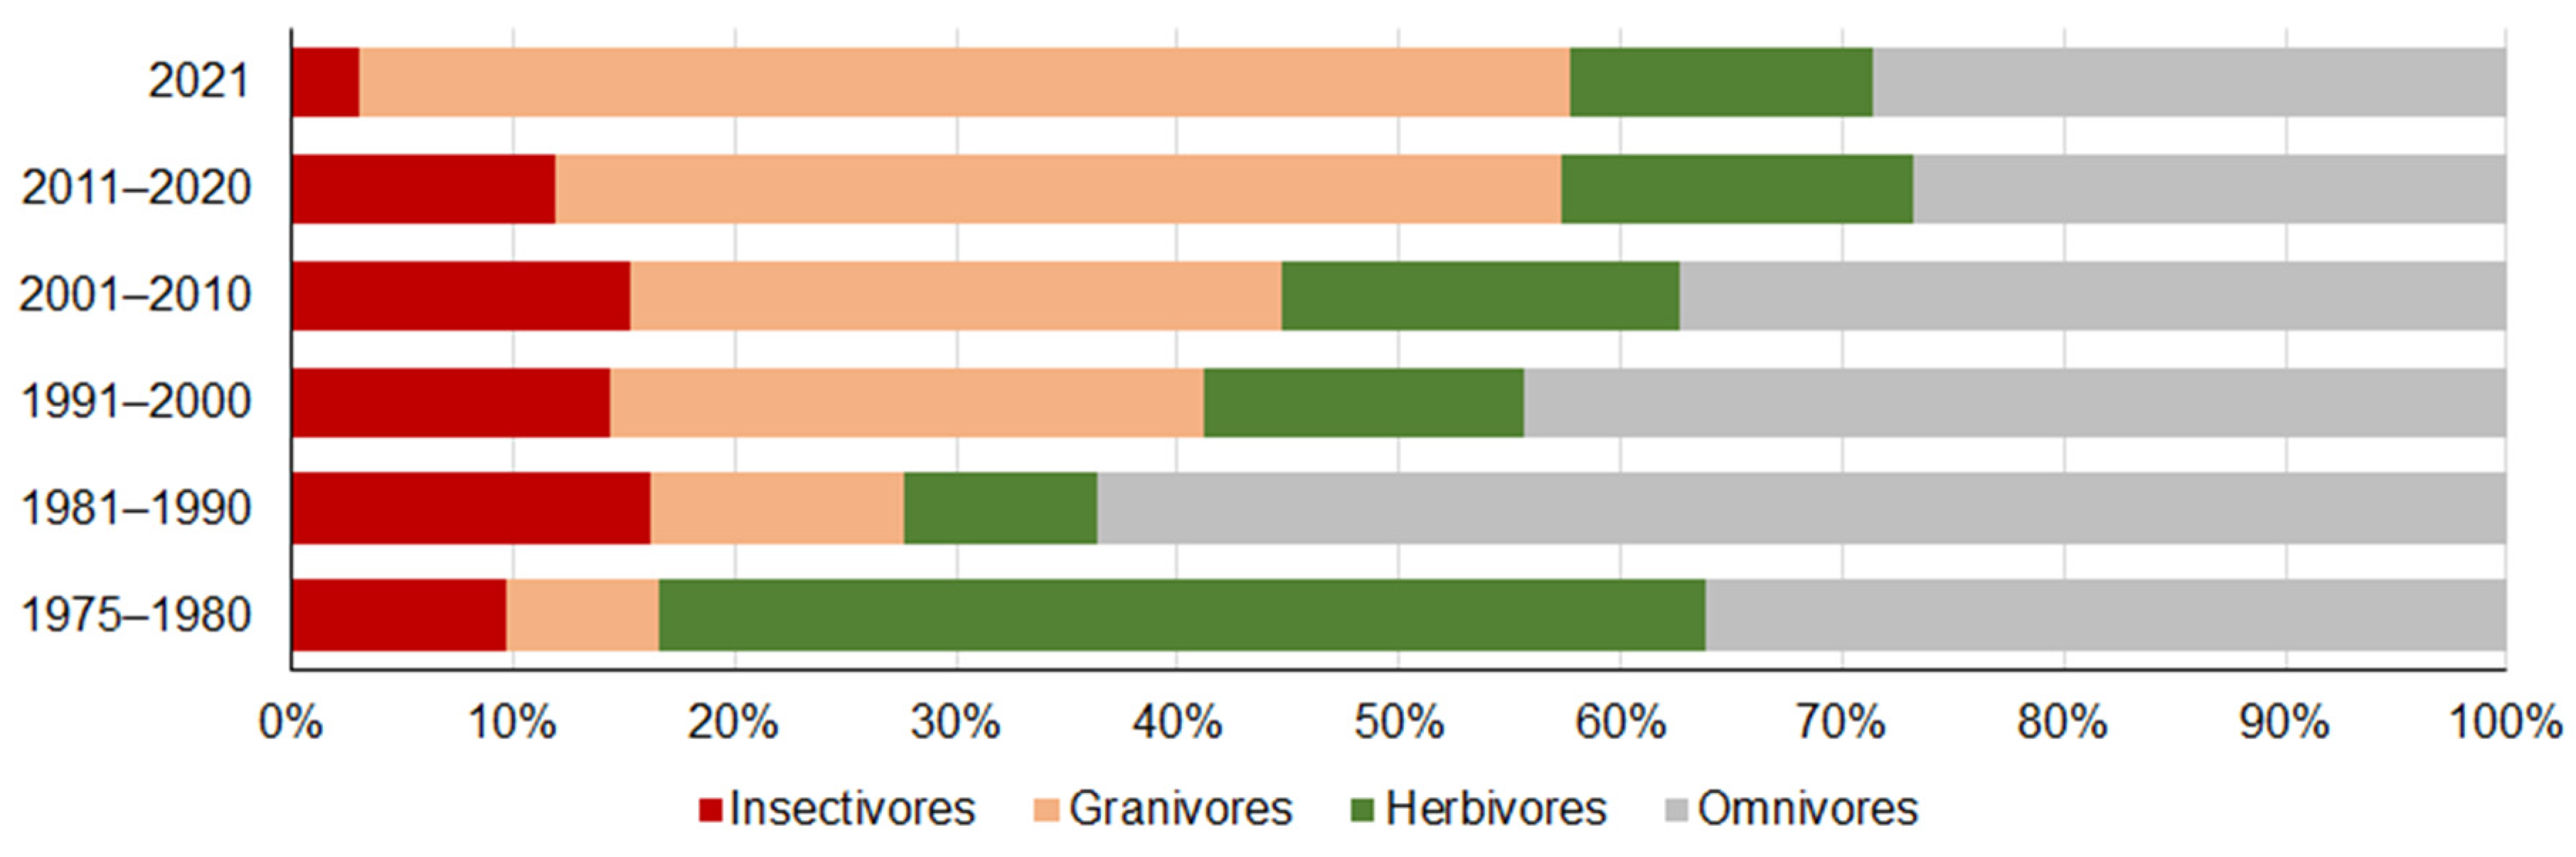
3.2. Changes in the Proportions of Trapped Small Mammal Trophic Groups
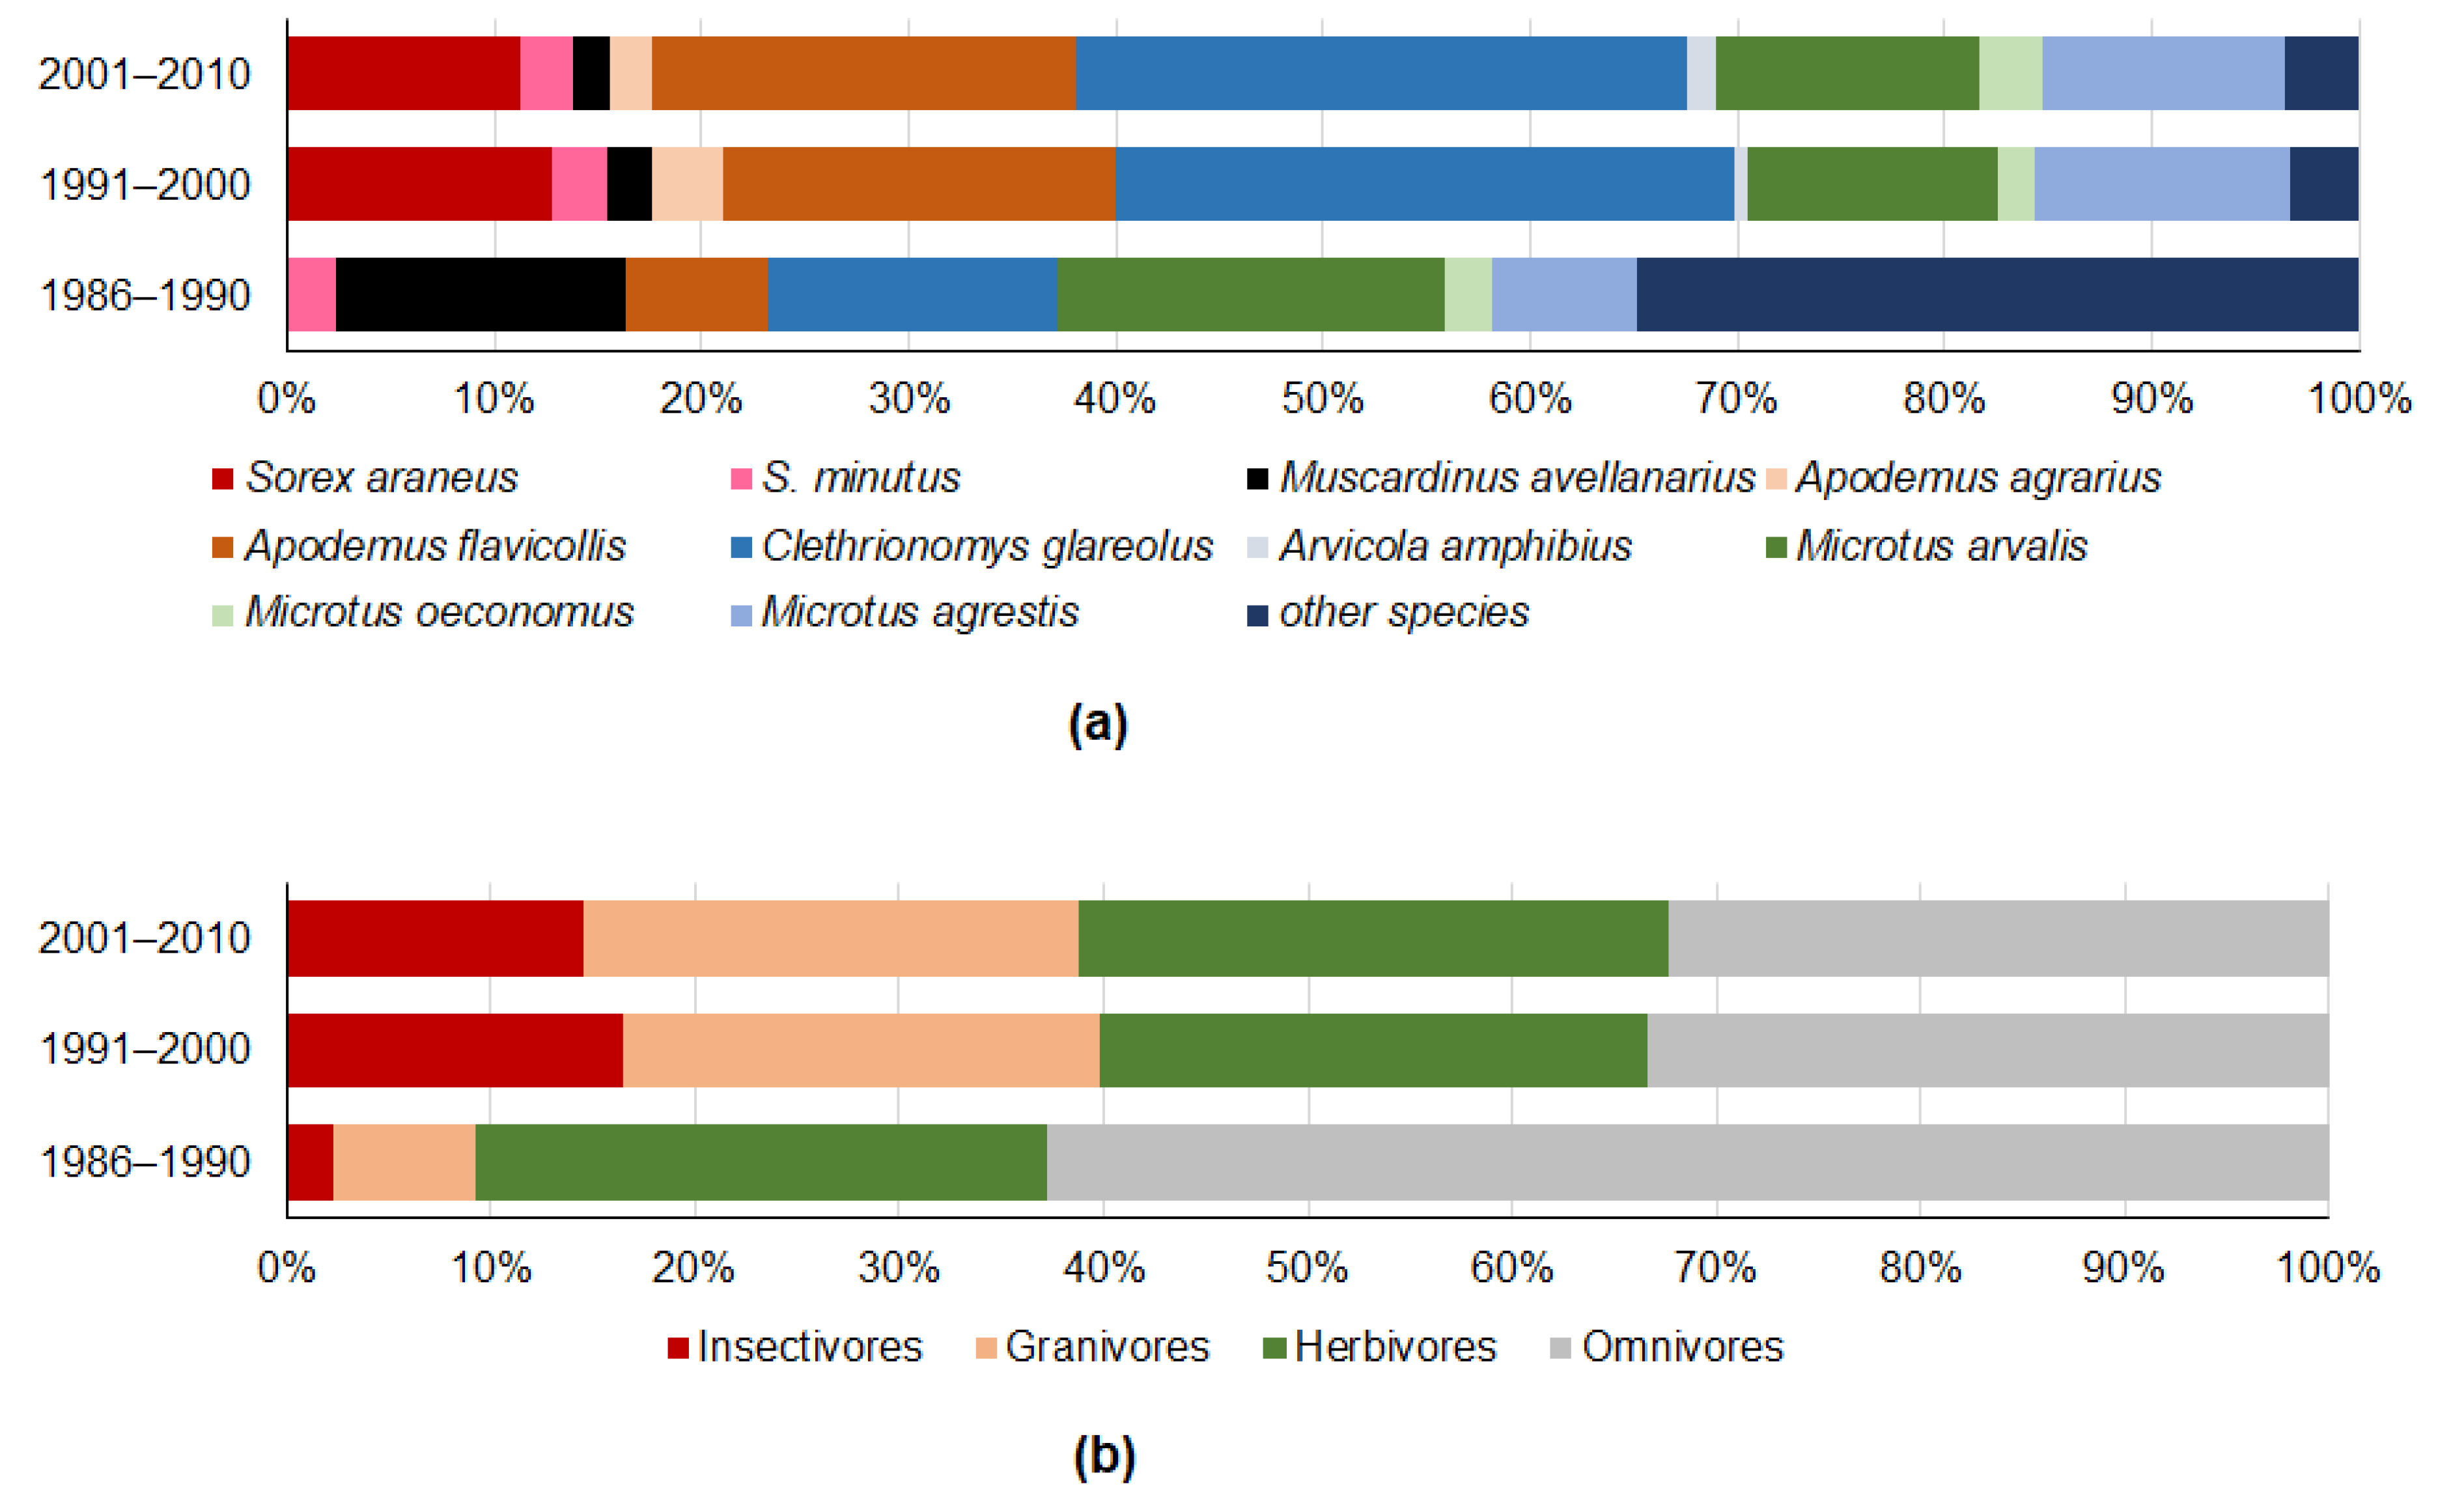
3.3. Diversity of Small Mammals Recovered from Owl Pellets
4. Discussion
5. Conclusions
Author Contributions
Funding
Institutional Review Board Statement
Data Availability Statement
Acknowledgments
Conflicts of Interest
References
- Santoro, S.; Sanchez-Suarez, C.; Rouco, C.; Palomo, L.J.; Fernández, M.C.; Kufner, M.B.; Moreno, S. Long-term data from a small mammal community reveal loss of diversity and potential effects of local climate change. Curr. Zool. 2017, 63, 515–523. [Google Scholar] [CrossRef] [PubMed] [Green Version]
- Swihart, R.K.; Slade, N.A. Long-term dynamics of an early successional small mammal community. Am. Midl. Nat. 1990, 123, 372–382. [Google Scholar] [CrossRef]
- Balčiauskas, L.; Balčiauskienė, L. Long-term changes in a small mammal community in a temperate zone meadow subject to seasonal floods and habitat transformation. Integr. Zool. 2022, 17, 443–455. [Google Scholar] [CrossRef] [PubMed]
- Battisti, C.; Dodaro, G.; Di Bagno, E.; Amori, G. Small mammal assemblages in land-reclaimed areas: Do historical soil use changes and recent anthropisation affect their dominance structure? Ethol. Ecol. Evol. 2019, 32, 282–288. [Google Scholar] [CrossRef]
- Ferrari, G.; Delucchi, L.; Tagliapietra, V.; Urbano, F.; Devineau, O.; Cagnacci, F. EuroSmallMammals: A network for collaborative science in small mammal ecology. Hystrix 2022, 33 (Suppl.), 76. [Google Scholar]
- Fryxell, J.M.; Falls, J.B.; Falls, E.A.; Brooks, R.J. Long-term dynamics of small-mammal populations in Ontario. Ecology 1998, 79, 213–225. [Google Scholar] [CrossRef]
- de la Peña, N.M.; Butet, A.; Delettre, Y.; Paillat, G.; Morant, P.; Le Du, L.; Burel, F. Response of the small mammal community to changes in western French agricultural landscapes. Landscape Ecol. 2003, 18, 265–278. [Google Scholar] [CrossRef]
- Milana, G.; Luiselli, L.; Amori, G. Forty years of dietary studies on barn owl (Tyto alba) reveal long term trends in diversity metrics of small mammal prey. Anim. Biol. 2018, 68, 129–146. [Google Scholar] [CrossRef]
- Rowe, R.J.; Terry, R.C. Small mammal responses to environmental change: Integrating past and present dynamics. J. Mammal. 2014, 95, 1157–1174. [Google Scholar] [CrossRef] [Green Version]
- Bonecker, S.T.; Portugal, L.G.; Costa-Neto, S.F.; Gentile, R. A long term study of small mammal populations in a Brazilian agricultural landscape. Mamm. Biol. 2009, 74, 467–477. [Google Scholar] [CrossRef]
- Krebs, C.J.; Boonstra, R.; Gilbert, B.S.; Kenney, A.J.; Boutin, S. Impact of climate change on the small mammal community of the Yukon boreal forest. Integr. Zool. 2019, 14, 528–541. [Google Scholar] [CrossRef] [PubMed]
- Schweiger, E.W.; Diffendorfer, J.E.; Holt, R.D.; Pierotti, R.; Gaines, M.S. The interaction of habitat fragmentation, plant, and small mammal succession in an old field. Ecol. Monogr. 2000, 70, 383–400. [Google Scholar] [CrossRef]
- Kozakiewicz, M.; Kozakiewicz, A. Long-term dynamics and biodiversity changes in small mammal communities in a mosaic of agricultural and forest habitats. Ann. Zool. Fenn. 2008, 45, 263–269. [Google Scholar] [CrossRef]
- Zárybnická, M.; Riegert, J.; Bejček, V.; Sedláček, F.; Šťastný, K.; Šindelář, J.; Heroldová, M.; Vilímová, J.; Zima, J. Long-term changes of small mammal communities in heterogenous landscapes of Central Europe. Eur. J. Wildl. Res. 2017, 63, 89. [Google Scholar] [CrossRef]
- Fuentes-Montemayor, E.; Ferryman, M.; Watts, K.; Macgregor, N.A.; Hambly, N.; Brennan, S.; Coxon, R.; Langridge, H.; Park, K.J. Small mammal responses to long-term large-scale woodland creation: The influence of local and landscape-level attributes. Ecol. Appl. 2019, 30, e02028. [Google Scholar] [CrossRef] [PubMed] [Green Version]
- Balčiauskas, L.; Čepukienė, A.; Balčiauskienė, L. Small mammal community response to early meadow–forest succession. For. Ecosyst. 2017, 4, 11. [Google Scholar] [CrossRef]
- Iriarte, J.A.; Contreras, L.C.; Jaksi, F.M. A Long-Term Study of a Small-Mammal Assemblage in the Central Chilean Matorral. J. Mammal. 1989, 70, 79–87. [Google Scholar] [CrossRef]
- Recher, H.F.; Lunney, D.; Matthews, A. Small mammal populations in a eucalypt forest affected by fire and drought. I. Long-term patterns in an era of climate change. Wildl. Res. 2009, 36, 143–158. [Google Scholar] [CrossRef]
- Thibault, K.M.; Ernest, S.K.M.; White, E.P.; Brown, J.H.; Goheen, J.R. Long-term insights into the influence of precipitation on community dynamics in desert rodents. J. Mammal. 2010, 91, 787–797. [Google Scholar] [CrossRef] [Green Version]
- Shenbrot, G.; Krasnov, B.; Burdelov, S. Long-term study of population dynamics and habitat selection of rodents in the Negev Desert. J. Mammal. 2010, 91, 776–786. [Google Scholar] [CrossRef] [Green Version]
- Myers, P.; Lundrigan, B.L.; Hoffman, S.M.G.; Haraminac, A.P.; Seto, S.H. Climate-induced changes in the small mammal communities of the Northern Great Lakes Region. Glob. Chang. Biol. 2009, 15, 1434–1454. [Google Scholar] [CrossRef]
- Kausrud, K.L.; Mysterud, A.; Steen, H.; Vik, J.O.; Østbye, E.; Cazelles, B.; Framstad, E.; Eikeset, A.M.; Mysterud, I.; Solhøy, T.; et al. Linking climate change to lemming cycles. Nature 2008, 456, 93–97. [Google Scholar] [CrossRef] [PubMed]
- Mitchell, D.; Snelling, E.P.; Hetem, R.S.; Maloney, S.K.; Strauss, W.M.; Fuller, A. Revisiting concepts of thermal physiology: Predicting responses of mammals to climate change. J. Anim. Ecol. 2018, 87, 956–973. [Google Scholar] [CrossRef] [PubMed]
- Pacifici, M.; Visconti, P.; Rondinini, C. A framework for the identification of hotspots of climate change risk for mammals. Glob. Chang. Biol. 2018, 24, 1626–1636. [Google Scholar] [CrossRef] [Green Version]
- Rugiero, L.; Milana, G.; Capula, M.; Amori, G.; Luiselli, L. Long term variations in small mammal composition of a snake diet do not mirror climate change trends. Acta Oecol. 2012, 43, 158–164. [Google Scholar] [CrossRef]
- Solonen, T. Are vole-eating owls affected by mild winters in southern Finland? Ornis Fenn. 2004, 81, 65–74. [Google Scholar]
- Gryz, J.; Chojnacka-Ożga, L.; Krauze-Gryz, D. Long-term stability of tawny owl (Strix aluco) population despite varying environmental conditions–a case study from Central Poland. Pol. J. Ecol. 2019, 67, 75–83. [Google Scholar] [CrossRef] [Green Version]
- Kouba, M.; Bartoš, L.; Bartošová, J.; Hongisto, K.; Korpimäki, E. Interactive influences of fluctuations of main food resources and climate change on long-term population decline of Tengmalm’s owls in the boreal forest. Sci. Rep. 2020, 10, 20429. [Google Scholar] [CrossRef]
- Balestrieri, A.; Gazzola, A.; Formenton, G.; Canova, L. Long-term impact of agricultural practices on the diversity of small mammal communities: A case study based on owl pellets. Environ. Monit. Assess. 2019, 191, 725. [Google Scholar] [CrossRef]
- Prūsaitė, J.; Maldžiūnaitė, S.; Likevičienė, N. Mammals (Mammalia) of the reservation of Žuvintas. In The Reservation of Žuvintas; Zajančkauskas, P., Šivickis, P., Eds.; Mintis: Vilnius, Lithuania, 1968; pp. 377–388. [Google Scholar]
- Arnastauskienė, T.; Kazlauskas, J.; Maldžiūnaitė, S. On the natural groupings of the intestinal parasites of mouse rodents of the preserve of Kamsa and their dependence on host biotope, species and its population structure. Acta Parasitol. Litu. 1978, 16, 15–32. [Google Scholar]
- Maldžiūnaitė, S. Small mammals in Žagarė reserve. In Žagarės Forest; Lekavičius, A., Jankevičienė, R., Tučienė, A., Eds.; Mokslas: Vilnius, Lithuania, 1980; pp. 48–50. [Google Scholar]
- Maldžiūnaitė, S.; Mažeikytė, R.; Gruodis, S. Small mammalia on cultivated pastures in the Middle Lithuania (1. Species composition of small mammalia in non-irrigated cultivated pastures). Liet. TSR Moksl. Akad. Darb. 1981, 4, 71–78. [Google Scholar]
- Balčiauskas, L.; Juškaitis, R. Diversity of small mammal communities in Lithuania (1. A review). Acta Zool. Litu. 1997, 7, 29–45. [Google Scholar] [CrossRef]
- Juškaitis, R.; Baranauskas, K. Diversity of small mammals in the northwestern Lithuania (Mažeikiai district). Acta Zool. Litu. 2001, 11, 343–348. [Google Scholar] [CrossRef]
- Juškaitis, R. Metelių regioninio parko smulkieji žinduoliai. Theriol. Litu. 2002, 2, 47–57. [Google Scholar]
- Juškaitis, R.; Ulevičius, A. Kuršių Nerijos nacionalinio parko smulkieji žinduoliai. Theriol. Litu. 2002, 2, 34–46. [Google Scholar]
- Mačiulis, M. Kamanų rezervato ir apsauginės zonos žinduoliai. Theriol. Litu. 2002, 2, 21–33. [Google Scholar]
- Mažeikytė, R. Kanio raisto botaninio-zoologinio draustinio smulkieji žinduoliai. Theriol. Litu. 2002, 2, 58–69. [Google Scholar]
- Ulevičius, A.; Juškaitis, R.; Pauža, D.; Balčiauskas, L.; Ostasevičius, V. Žemaitijos nacionalinio parko žinduoliai. Theriol. Litu. 2002, 2, 1–20. [Google Scholar]
- Atkočaitis, O. Sodybos pastatuose sugauti smulkieji žinduoliai. Theriol. Litu. 2003, 3, 57–61. [Google Scholar]
- Juškaitis, R.; Ulevičius, A. Smulkiųjų žinduolių rūšinė sudėtis Vilkaviškio ir Šakių rajonuose. Theriol. Litu. 2003, 3, 39–44. [Google Scholar]
- Mažeikytė, R. Baranavos botaninio zoologinio draustinio smulkieji žinduoliai. Theriol. Litu. 2003, 3, 45–56. [Google Scholar]
- Ulevičius, A.; Juškaitis, R. Dzūkijos nacionalinio parko žinduoliai (išskyrus šikšnosparnius). Theriol. Litu. 2003, 3, 11–29. [Google Scholar]
- Juškaitis, R.; Ulevičius, A. Small mammals in the environs of Piktupėnai and Natkiškiai (Šilutė district). Theriol. Litu. 2004, 4, 67–68. [Google Scholar]
- Pakeltytė, G.; Andriuškevičius, A. Smulkiųjų žinduolių bendrijos rūšių įvairovė ir gausumas Nevėžio kraštovaizdžio draustinio monitoringo vietose. Theriol. Litu. 2004, 4, 43–52. [Google Scholar]
- Atkočaitis, O. Sodybos pastatuose sugauti smulkieji žinduoliai: Nauji duomenys. Theriol. Litu. 2005, 5, 76–77. [Google Scholar]
- Balčiauskas, L. Results of the long-term monitoring of small mammal communities in the Ignalina Nuclear Power Plant Region (Drūkšiai LTER site). Acta Zool. Litu. 2005, 15, 79–84. [Google Scholar] [CrossRef]
- Balčiauskienė, L. Analysis of Tawny Owl (Strix aluco) food remains as a tool for long-term monitoring of small mammals. Acta Zool. Litu. 2005, 15, 85–89. [Google Scholar] [CrossRef]
- Balčiauskienė, L.; Juškaitis, R.; Atkočaitis, O. The Diet of the Tawny Owl (Strix aluco) in South-Western Lithuania during the Breeding Period. Acta Zool. Litu. 2005, 15, 13–20. [Google Scholar] [CrossRef]
- Balčiauskienė, L.; Petraška, A. Prey of the Long-Eared Owl, Asio otus, in Central Lithuania. Young Res. Work. 2005, 2, 133–138. [Google Scholar]
- Juškaitis, R.; Dementavičius, D. Būdos miško pakraštyje (Kaišiadorių rajonas) sugauti smulkieji žinduoliai. Theriol. Litu. 2005, 5, 77–78. [Google Scholar]
- Juškaitis, R.; Uselis, V. Viešvilės rezervato smulkieji žinduoliai. Theriol. Litu. 2005, 5, 40–50. [Google Scholar]
- Zalunskaitė, S.; Lopeta, V. Smulkieji žinduoliai Kurtuvėnų regioninio parko šiaurinėje dalyje. Theriol. Litu. 2005, 5, 51–57. [Google Scholar]
- Balčiauskas, L.; Gudaitė, A. Diversity of Small Mammals in Winter Season in North East Lithuania. Acta Zool. Litu. 2006, 16, 137–142. [Google Scholar] [CrossRef]
- Balčiauskienė, L.; Dementavičius, D. Habitat determination of tawny owl (Strix aluco) prey composition during breeding period. Acta Biol. Univ. Daugavp. 2006, 6, 1–12. [Google Scholar]
- Balčiauskienė, L.; Jovaišas, A.; Naruševičius, V.; Petraška, A.; Skuja, S. Diet of Tawny Owl (Strix aluco) and Long-eared Owl (Asio otus) in Lithuania as found from pellets. Acta Zool. Litu. 2006, 16, 37–45. [Google Scholar] [CrossRef]
- Balčiauskienė, L.; Naruševičius, V. Coincidence of small mammal trapping data with their share in the Tawny Owl diet. Acta Zool. Litu. 2006, 16, 93–101. [Google Scholar] [CrossRef]
- Šinkūnas, R. Smulkiųjų Žinduolių Bendrijos Izoliuotose ir Fragmentuotose Buveinėse. Ph.D. Dissertation, Vilnius University, Vilnius, Lithuania, 2006. [Google Scholar]
- Šinkūnas, R.; Balčiauskas, L. Small mammal communities in the fragmented landscape in Lithuania. Acta Zool. Litu. 2006, 16, 130–136. [Google Scholar] [CrossRef]
- Balčiauskienė, L.; Balčiauskas, L. Common dormouse as a prey item of breeding tawny owls in five districts of Lithuania. Acta Zool. Litu. 2008, 18, 61–65. [Google Scholar] [CrossRef]
- Żmihorski, M.; Balčiauskienė, L.; Romanowski, J. Small mammals in the diet of the Tawny Owl (Strix aluco L.) in Central European Lowland. Pol. J. Ecol. 2008, 56, 693–700. [Google Scholar]
- Alejūnas, P.; Stirkė, V. Small mammals in northern Lithuania: Species diversity and abundance. Ekologija 2010, 56, 110–115. [Google Scholar] [CrossRef]
- Balčiauskas, L.; Alejūnas, P. Small mammal species diversity and abundance in Žagarė Regional Park. Acta Zool. Litu. 2011, 21, 163–172. [Google Scholar] [CrossRef]
- Jasiulionis, M.; Čepukienė, A.; Balčiauskas, L. Small mammal community changes during succession of the planted forest. Acta Zool. Litu. 2011, 21, 293–300. [Google Scholar] [CrossRef]
- Balčiauskas, L.; Balčiauskienė, L.; Janonytė, A. The influence of spring floods on small mammal communities in the Nemunas River Delta, Lithuania. Biologia 2012, 67, 1220–1229. [Google Scholar] [CrossRef] [Green Version]
- Čepukienė, A.; Jasiulionis, M. Small mammal community changes during forest succession (Pakruojis district, north Lithuania). Zool. Ecol. 2012, 22, 144–149. [Google Scholar] [CrossRef]
- Čepukienė, A. Smulkiųjų Žinduolių Bendrijos Pokyčiai Miško Sukcesijos Pradinėse Stadijose. Ph.D. Dissertation, Vilnius University, Vilnius, Lithuania, 2014. [Google Scholar]
- Balčiauskienė, L.; Jasiulionis, M.; Balčiauskas, L. Loss of diversity in a small mammal community in a habitat influenced by a colony of great cormorants. Acta Zool. Bulg. 2014, 66, 229–234. [Google Scholar]
- Balciauskas, L.; Balciauskiene, L.; Jasiulionis, M. Mammals under a colony of great cormorants: Population structure and body condition of yellow-necked mice. Turk. J. Zool. 2015, 39, 941–948. [Google Scholar] [CrossRef]
- Balčiauskas, L.; Skipitytė, R.; Balčiauskienė, L.; Jasiulionis, M. Resource partitioning confirmed by isotopic signatures allows small mammals to share seasonally flooded meadows. Ecol. Evol. 2019, 9, 5479–5489. [Google Scholar] [CrossRef]
- Balčiauskas, L.; Balčiauskienė, L.; Stirkė, V. Mow the grass at the mouse’s peril: Diversity of small Mammals in commercial fruit farms. Animals 2019, 9, 334. [Google Scholar] [CrossRef] [Green Version]
- Jasiulionis, M. Impact of the Colonies of Great Cormorants (Phalacrocorax Carbo Sinensis) on Mammals. Ph.D. Dissertation, Vilnius University, Vilnius, Lithuania, 2020. [Google Scholar]
- Balčiauskas, L.; Balčiauskienė, L.; Garbaras, A.; Stirkė, V. Diversity and Diet Differences of Small Mammals in Commensal Habitats. Diversity 2021, 13, 346. [Google Scholar] [CrossRef]
- Balčiauskas, L.; Skipitytė, R.; Garbaras, A.; Stirkė, V.; Balčiauskienė, L.; Remeikis, V. Isotopic niche of syntopic granivores in commercial orchards and meadows. Animals 2021, 11, 2375. [Google Scholar] [CrossRef]
- Balčiauskas, L.; Skipitytė, R.; Garbaras, A.; Stirkė, V.; Balčiauskienė, L.; Remeikis, V. Stable isotopes reveal the dominant species to have the widest trophic niche of three syntopic Microtus voles. Animals 2021, 11, 1814. [Google Scholar] [CrossRef] [PubMed]
- Stirkė, V.; Balčiauskas, L.; Balčiauskienė, L. Common Vole as a Focal Small Mammal Species in Orchards of the Northern Zone. Diversity 2021, 13, 134. [Google Scholar] [CrossRef]
- Kitrytė, N. Diversity of Small Mammal Parasites and Factors Shaping Their Communities. Ph.D. Dissertation, Vilnius University, Vilnius, Lithuania, 2022. [Google Scholar]
- Fournier, A.M.; White, E.R.; Heard, S.B. Site-selection bias and apparent population declines in long-term studies. Conserv. Biol. 2019, 33, 1370–1379. [Google Scholar] [CrossRef] [PubMed]
- Gotelli, N.J.; Colwell, R.K. Quantifying biodiversity: Procedures and pitfalls in the measurement and comparison of species richness. Ecol. Lett. 2001, 4, 379–391. [Google Scholar] [CrossRef] [Green Version]
- Chao, A.; Gotelli, N.J.; Hsieh, T.C.; Sander, E.L.; Ma, K.H.; Colwell, R.K.; Ellison, A.M. Rarefaction and extrapolation with Hill numbers: A framework for sampling and estimation in species diversity studies. Ecol. Monogr. 2014, 84, 45–67. [Google Scholar] [CrossRef] [Green Version]
- Krebs, C.J. Ecological Methodology; Harper & Row: New York, NY, USA, 1989. [Google Scholar]
- Brown, L.D.; Cat, T.T.; DasGupta, A. Interval Estimation for a proportion. Stat. Sci. 2001, 16, 101–133. [Google Scholar] [CrossRef]
- Dean, A.G.; Sullivan, K.M.; Soe, M.M. OpenEpi: Open Source Epidemiologic Statistics for Public Health. Available online: http://OpenEpi.com (accessed on 19 January 2021).
- G-Test Calculator. Available online: https://elem.com/~btilly/effective-ab-testing/g-test-calculator.html (accessed on 16 March 2021).
- Veteikis, D.; Piškinaitė, E. Geografiniai žemėnaudos kaitos tyrimai Lietuvoje: Raida, kryptys, perspektyvos. Geol. Geogr. 2019, 5, 14–29. [Google Scholar] [CrossRef]
- Mizaras, S.; Doftartė, A.; Lukminė, D.; Šilingienė, R. Sustainability of Small-Scale Forestry and Its Influencing Factors in Lithuania. Forests 2020, 11, 619. [Google Scholar] [CrossRef]
- Senetra, A.; Szczepańska, A.; Veteikis, D.; Wasilewicz-Pszczółkowska, M.; Šimanauskienė, R.; Volungevičius, J. Changes of the land use patterns in the Polish and Lithuanian trans-border rural area. Baltica 2013, 26, 157–168. [Google Scholar] [CrossRef] [Green Version]
- Prishchepov, A.V.; Radeloff, V.C.; Baumann, M.; Kuemmerle, T.; Müller, D. Effects of institutional changes on land use: Agricultural land abandonment during the transition from state-command to market-driven economies in post-Soviet Eastern Europe. Environ. Res. Lett. 2012, 7, 024021. [Google Scholar] [CrossRef]
- Auškalnienė, O.; Pšibišauskienė, G.; Auškalnis, A.; Lazauskas, S.; Povilaitis, V.; Sakalauskienė, S.; Sakalauskaitė, J.; Duchovskis, P.; Raudonius, S. Segetalinės floros pokyčiai Lietuvoje paskutiniaisiais dešimtmečiais. Kaimo Raidos Kryptys Žinių Visuomenėje 2011, 2, 217–222. [Google Scholar]
- Juknelienė, D.; Kazanavičiūtė, V.; Valčiukienė, J.; Atkocevičienė, V.; Mozgeris, G. Spatiotemporal Patterns of Land-Use Changes in Lithuania. Land 2021, 10, 619. [Google Scholar] [CrossRef]
- Sujetovienė, G.; Dabašinskas, G. Interactions between changes in land cover and potential of ecosystem services in Lithuania at temporal and spatial scale. Ecol. Complex. 2022, 49, 100984. [Google Scholar] [CrossRef]
- Grašytė, G. Indicators of Fledging Initiation, Individual and Population Dynamics of the House Owl Strix Aluco, Their Long-Term Variation and Links to Habitat and Climate Change. PhD Thesis, Gamtos Tyrimų Centras, Vilnius, Lithuania, 2017. [Google Scholar]
- Grašytė, G.; Rumbutis, S.; Dagys, M.; Treinys, R. Breeding Performance, Apparent Survival, Nesting Location and Diet in a Local Population of the Tawny Owl Strix aluco in Central Lithuania Over the Long-Term. Acta Ornithol. 2016, 51, 163–174. [Google Scholar] [CrossRef]
- Hurst, Z.M.; McCleery, R.A.; Collier, B.A.; Silvy, N.J.; Taylor, P.J.; Monadjem, A. Linking changes in small mammal communities to ecosystem functions in an agricultural landscape. Mamm. Biol. 2014, 79, 17–23. [Google Scholar] [CrossRef]
- Torre, I.; Gracia-Quintas, L.; Arrizabalaga, A.; Baucells, J.; Díaz, M. Are recent changes in the terrestrial small mammal communities related to land use change? A test using pellet analyses. Ecol. Res. 2015, 30, 813–819. [Google Scholar] [CrossRef] [Green Version]
- Ecke, F.; Angeler, D.G.; Magnusson, M.; Khalil, H.; Hörnfeldt, B. Dampening of population cycles in voles affects small mammal community structure, decreases diversity, and increases prevalence of a zoonotic disease. Ecol. Evol. 2017, 7, 5331–5342. [Google Scholar] [CrossRef]
- Dorigo, L.; Boscutti, F.; Sigura, M. Landscape and microhabitat features determine small mammal abundance in forest patches in agricultural landscapes. PeerJ 2021, 9, e12306. [Google Scholar] [CrossRef]
- Wang, D.; Anderson, D.P.; Li, K.; Guo, Y.; Yang, Z.; Pech, R.P. Predicted population dynamics of an indigenous rodent, Apodemus agrarius, in an agricultural system. Crop Prot. 2021, 147, 105683. [Google Scholar] [CrossRef]
- Holland, G.J.; Bennett, A.F. Differing responses to landscape change: Implications for small mammal assemblages in forest fragments. Biodivers. Conserv. 2009, 18, 2997–3016. [Google Scholar] [CrossRef]
- Graham, S.I.; Kinnaird, M.F.; O’Brien, T.G.; Vågen, T.G.; Winowiecki, L.A.; Young, T.P.; Young, H.S. Effects of land-use change on community diversity and composition are highly variable among functional groups. Ecol. Appl. 2019, 29, e01973. [Google Scholar] [CrossRef] [PubMed]
- Foster, J.; Gaines, M.S. The effects of a successional habitat mosaic on a small mammal community. Ecology 1991, 72, 1358–1373. [Google Scholar] [CrossRef]
- European Environment Agency. Corine Land Cover 1990, Version 2020_20u1. Available online: https://land.copernicus.eu/pan-european/corine-land-cover/clc-1990?tab=metadata (accessed on 1 June 2022).
- Lietuvos Respublikos Aplinkos Ministerija. Miškų Lietuvoje Daugėja. 2020. Available online: https://am.lrv.lt/lt/naujienos/misku-lietuvoje-daugeja (accessed on 1 June 2022).
- Panzacchi, M.; Linnell, J.D.; Melis, C.; Odden, M.; Odden, J.; Gorini, L.; Andersen, R. Effect of land-use on small mammal abundance and diversity in a forest–farmland mosaic landscape in south-eastern Norway. For. Ecol. Manag. 2010, 259, 1536–1545. [Google Scholar] [CrossRef]
- Sullivan, T.P.; Sullivan, D.S.; Lindgren, P.M.F. Small mammals and stand structure in young pine, seed-tree, and old-growth forest, southwest Canada. Ecol. Appl. 2000, 10, 1367–1383. [Google Scholar] [CrossRef]
- Ecke, F.; Löfgren, O.; Sörlin, D. Population dynamics of small mammals in relation to forest age and structural habitat factors in northern Sweden. J. Appl. Ecol. 2002, 39, 781–792. [Google Scholar] [CrossRef]
- Volpert, Y.L.; Shadrina, E.G. Latitude- and climate-associated patterns in small mammal fauna changes of the West Yakutia. Russ. J. Theriol. 2019, 18, 33–40. [Google Scholar] [CrossRef]
- Peters, M.K.; Hemp, A.; Appelhans, T.; Becker, J.N.; Behler, C.; Classen, A.; Detsch, F.; Ensslin, A.; Ferger, S.W.; Frederiksen, S.B.; et al. Climate–land-use interactions shape tropical mountain biodiversity and ecosystem functions. Nature 2019, 568, 88–92. [Google Scholar] [CrossRef]
- Meserve, P.L.; Kelt, D.A.; Previtali, M.A.; Milstead, W.B.; Gutiérrez, J.R. Global climate change and small mammal populations in north-central Chile. J. Mammal. 2011, 92, 1223–1235. [Google Scholar] [CrossRef] [Green Version]
- Mason-Romo, E.D.; Ceballos, G.; Lima, M.; Martínez-Yrízar, A.; Jaramillo, V.J.; Maass, M. Long-term population dynamics of small mammals in tropical dry forests, effects of unusual climate events, and implications for management and conservation. For. Ecol. Manag. 2018, 426, 123–133. [Google Scholar] [CrossRef]
- Mérő, T.O.; Bocz, R.; Polyák, L.; Horváth, G.; Lengyel, S. Local habitat management and landscape-scale restoration influence small-mammal communities in grasslands. Anim. Conserv. 2015, 18, 442–450. [Google Scholar] [CrossRef] [Green Version]
- Mulligan, M.P.; Schooley, R.L.; Ward, M.P. Effects of Connectivity and Regional Dynamics on Restoration of Small Mammal Communities in Midwestern Grasslands. Restor. Ecol. 2013, 21, 678–685. [Google Scholar] [CrossRef]
- Meserve, P.L. Genesis, evolution, and future of a long-term study of small mammals in South America. Mastozoología Neotrop. 2016, 23, 11–16. [Google Scholar]

| Species | Trophic Group | Trapping, Ind. | Pellets, Ind. | Total, Ind. |
|---|---|---|---|---|
| Common shrew (Sorex araneus) | I | 5182 | 676 | 5858 |
| Pygmy shrew (S. minutus) | I | 1695 | 149 | 1844 |
| Water shrew (Neomys fodiens) | I | 218 | 49 | 267 |
| Mediterranean water shrew (N. anomalus) | I | 3 | 0 | 3 |
| Hazel dormouse (Muscardinus avellanarius) | O | 1 | 119 | 120 |
| Northern birch mouse (Sicista betulina) | G | 38 | 53 | 91 |
| House mouse (Mus musculus) | O | 544 | 42 | 586 |
| Striped field mouse (Apodemus agrarius) | G | 5434 | 142 | 5576 |
| Yellow-necked mouse (A. flavicollis) | G | 9079 | 1145 | 10,224 |
| Wood mouse (A. sylvaticus) | G | 14 | 0 | 14 |
| Pygmy field mouse (A. uralensis) | G | 218 | 1 | 219 |
| Harvest mouse (Micromys minutus) | G | 582 | 36 | 618 |
| Brown rat (Rattus norvegicus) | O | 21 | 25 | 46 |
| Black rat (R. rattus) | O | 26 | 0 | 26 |
| Bank vole (Clethrionomys glareolus) | O | 19,673 | 1703 | 21,376 |
| Water vole (Arvicola amphibius) | H | 32 | 63 | 95 |
| Common vole (Microtus arvalis) | H | 4782 | 725 | 5507 |
| Root vole (M. oeconomus) | H | 2693 | 154 | 2847 |
| Short-tailed vole (M. agrestis) | H | 1523 | 683 | 2206 |
| Sibling vole (M. rossiaemeridionalis) | H | 37 | 0 | 37 |
| Total, N | 51,795 | 5775 | 57,570 | |
| Species, S | 20 | 16 | 20 | |
| Diversity, H | 1.90 | 2.03 | 1.93 | |
| Dominance, D | 0.21 | 0.17 | 0.20 |
| Period | Map | Trapping Purpose | Trapping Effort | References | ||
|---|---|---|---|---|---|---|
| TS | TD | By Habitat | ||||
| 1975–1980 | 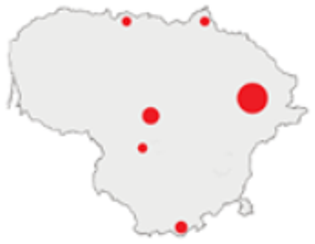 | IM, IPA, M, P | 6 | 16,330 |  | [31,32,33] |
| 1981–1990 |  | INPP, IPA, ODI, P | 4 | 50,250 |  | [34,48,49] |
| 1991–2000 |  | IPA, IBT, IFS, IS, SMM, M, MA, ODI | 69 | 86,165 |  | [35,36,37,38,39,40,41,42,43,44,45,49,50,51] |
| 2001–2010 | 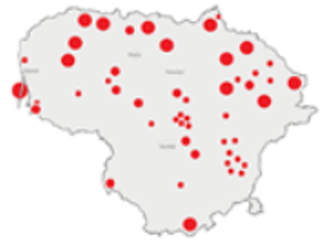 | IFS, IPA; SMM, M, ODI, IFM, IS | 35 | 116,442 |  | [46,47,49,50,51,52,53,54,55,56,57,58,59,60,61,62,63] |
| 2011–2020 | 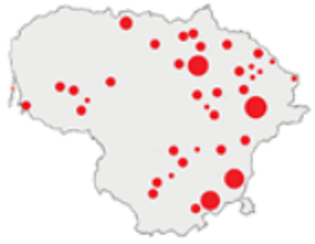 | ICC, ICH, IFM, IO, P, M | 40 | 98,693 |  | [3,16,64,65,66,67,68,69,70,71,72,73,78] |
| 2021 | 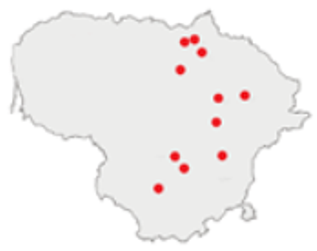 | ICC, ICH, IO, P | 11 | 8908 |  | [74,75,76,77] |
| Index | 1975–1980 | 1981–1990 | 1991–2000 | 2001–2010 | 2011–2020 | 2021 |
|---|---|---|---|---|---|---|
| Individuals, N | 3637 | 4729 | 16,144 | 13,854 | 12,764 | 667 |
| Number of species, S | 17 (17–23) | 14 (14–15) | 18 (18–18) | 19 (19–25) | 17 (17–20) | 12 (12–15) |
| Diversity, H | 1.43 a (1.39–1.46) | 1.36 b (1.33–1.40) | 1.84 c (1.82–1.86) | 1.93 d (1.91–1.94) | 1.93 d (1.91–1.94) | 1.69 e (1.63–1.75) |
| Dominance, D | 0.33 a (0.32–0.34) | 0.43 b (0.41–0.44) | 0.24 c (0.23–0.24) | 0.20 d (0.20–0.20) | 0.18 e (0.18–0.18) | 0.22 c (0.21–0.24) |
| Index | 1981–1990 | 1991–2000 | 2001–2009 |
|---|---|---|---|
| Individuals, N | 43 | 2029 | 3703 |
| Number of species, S | 9 (8–12) a | 16 (16–16) b | 15 (15–15) b |
| Diversity, H | 2.02 a (1.81–2.09) | 2.02 a (1.97–2.05) | 2.03 a (2.00–2.06) |
| Dominance, D | 0.15 a (0.14–0.20) | 0.17 a (0.17–0.18) | 0.17 a (0.17–0.18) |
Publisher’s Note: MDPI stays neutral with regard to jurisdictional claims in published maps and institutional affiliations. |
© 2022 by the authors. Licensee MDPI, Basel, Switzerland. This article is an open access article distributed under the terms and conditions of the Creative Commons Attribution (CC BY) license (https://creativecommons.org/licenses/by/4.0/).
Share and Cite
Balčiauskas, L.; Balčiauskienė, L. Small Mammal Diversity Changes in a Baltic Country, 1975–2021: A Review. Life 2022, 12, 1887. https://doi.org/10.3390/life12111887
Balčiauskas L, Balčiauskienė L. Small Mammal Diversity Changes in a Baltic Country, 1975–2021: A Review. Life. 2022; 12(11):1887. https://doi.org/10.3390/life12111887
Chicago/Turabian StyleBalčiauskas, Linas, and Laima Balčiauskienė. 2022. "Small Mammal Diversity Changes in a Baltic Country, 1975–2021: A Review" Life 12, no. 11: 1887. https://doi.org/10.3390/life12111887