
MegaD: Deep Learning for Rapid and Accurate Disease Status Prediction of Metagenomic Samples


Abstract
:1. Introduction
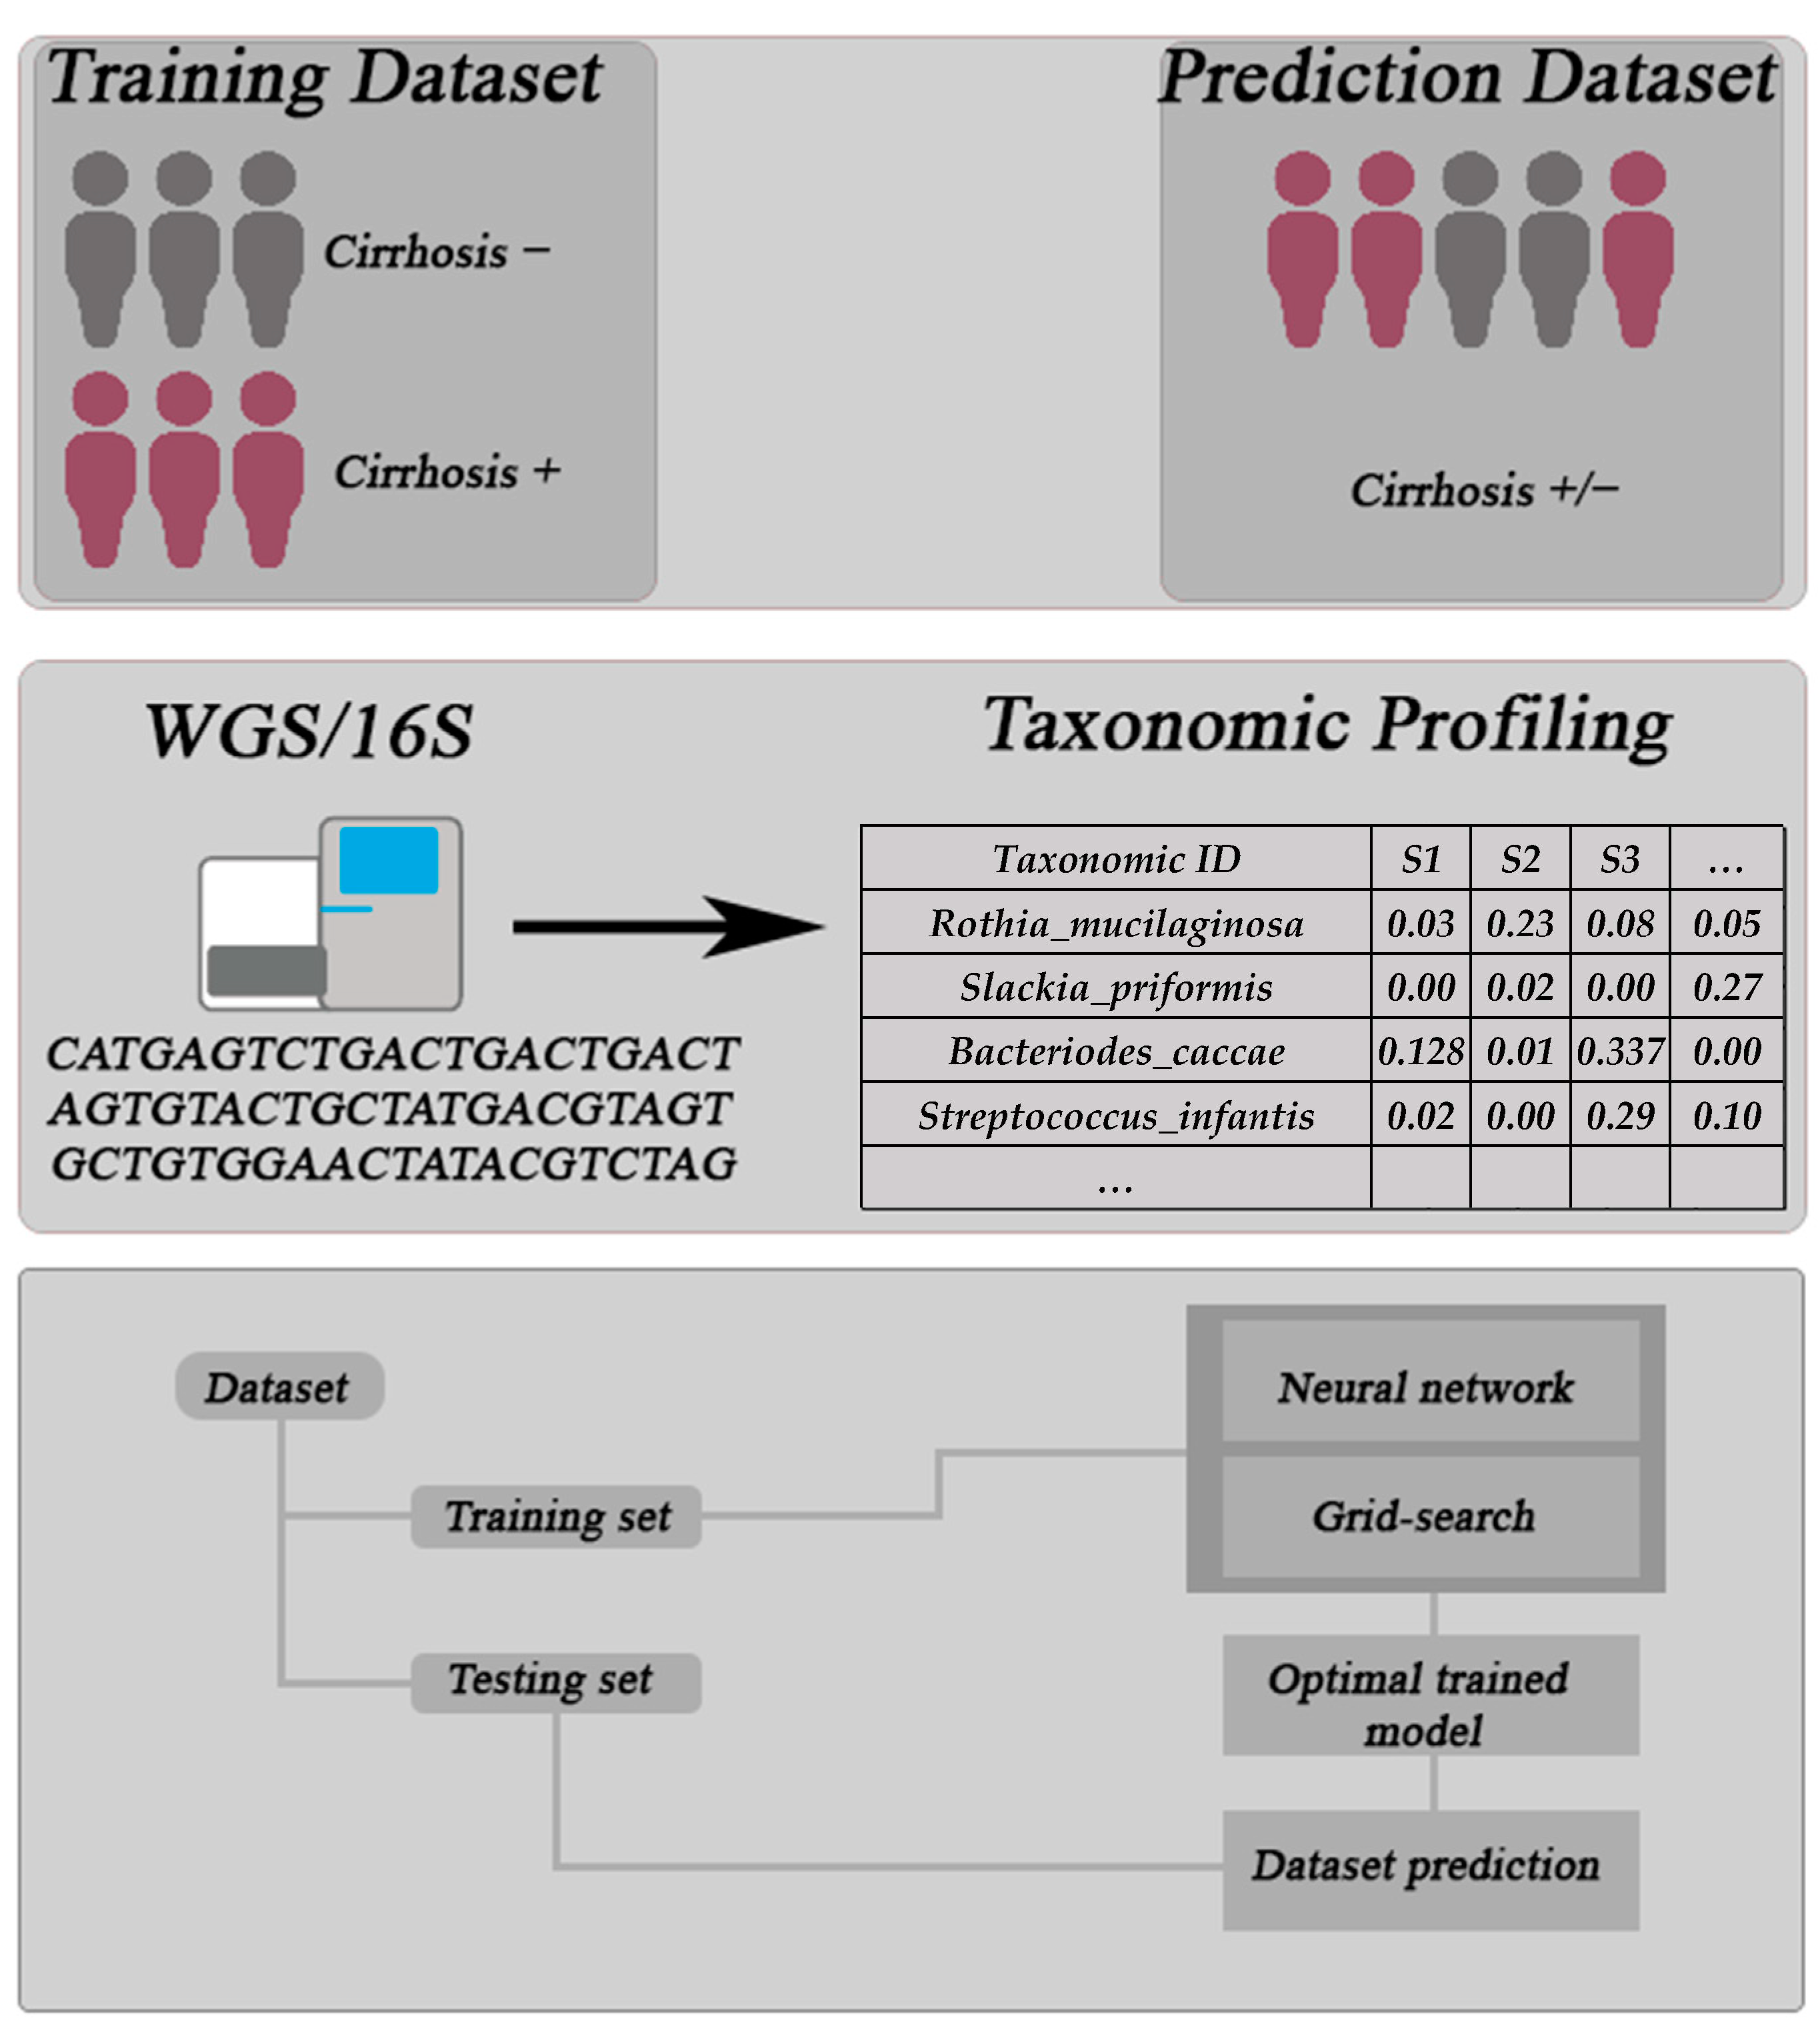
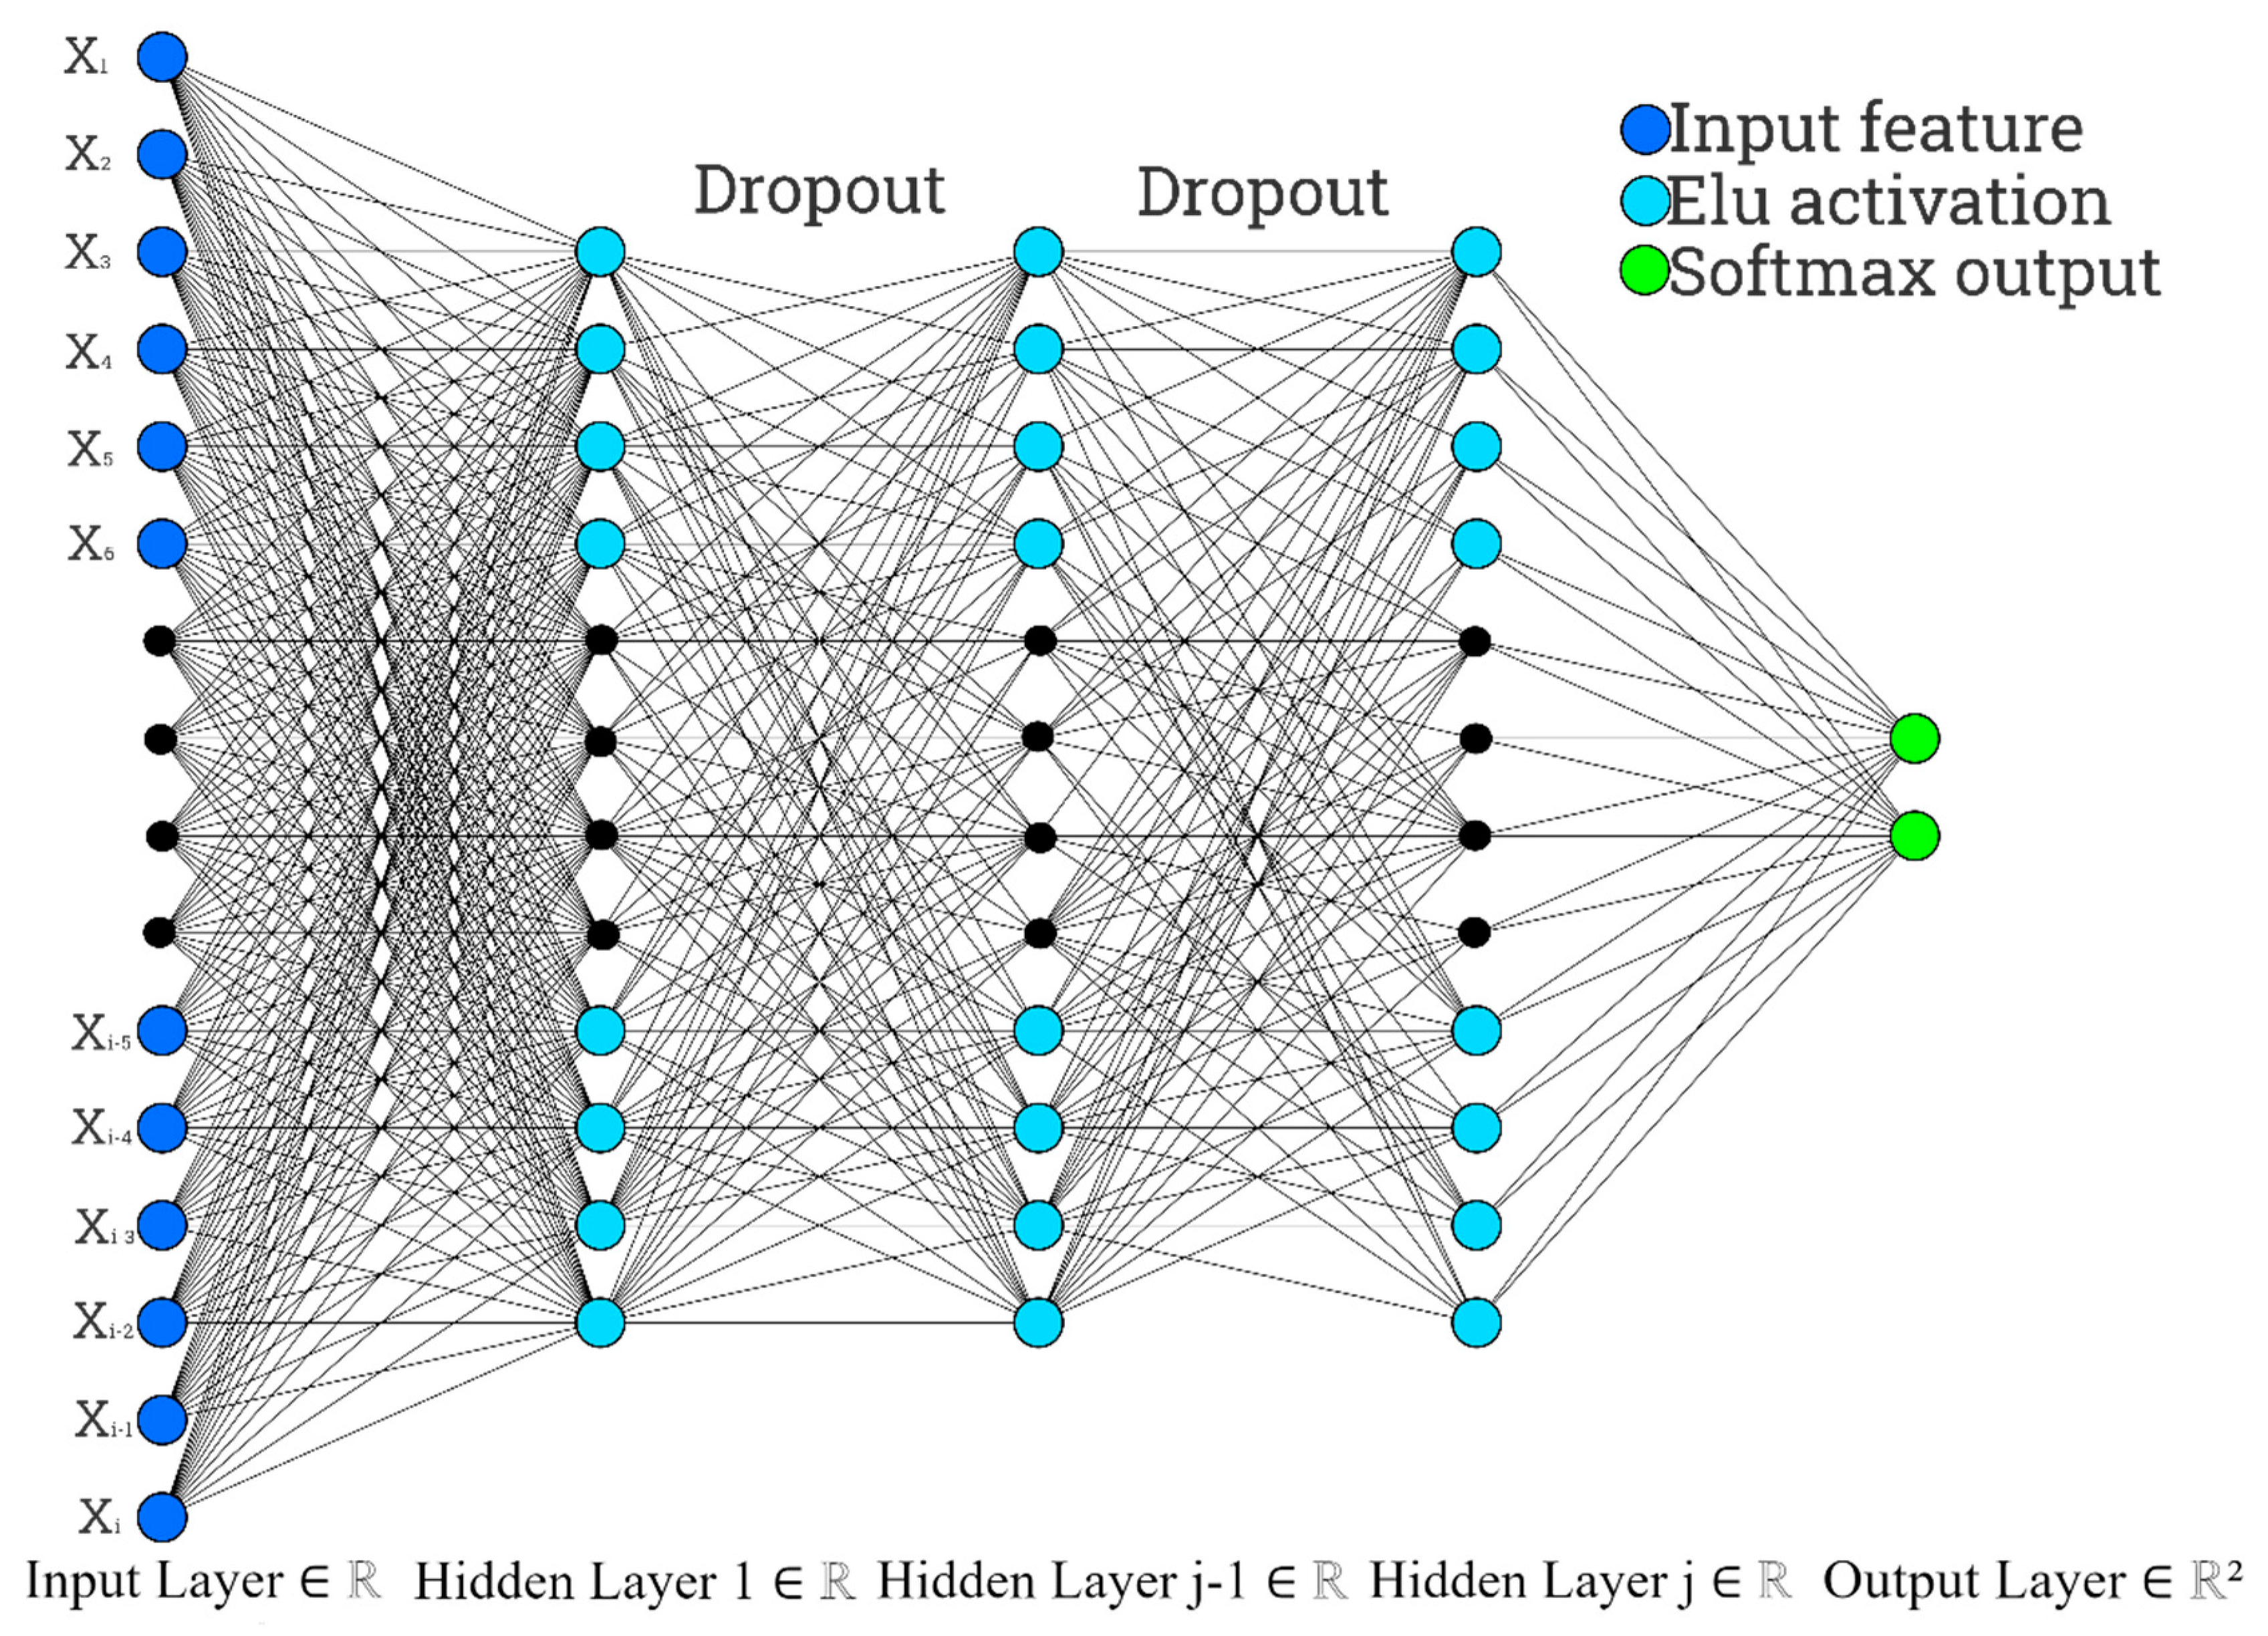
- MegaD is developed based on deep neural networks for phenotypic prediction of unknown metagenomic samples, supporting both 16S rRNA and WGS data;
- MegaD demonstrates the robustness of handling extremely large datasets containing thousands of features and samples;
- MegaD attests rapid computing performance with high precision and accuracy in predicting the phenotype of unknown samples based on the trained model.
2. Datasets
3. Methods
4. Results
5. Discussion
6. Conclusions
Author Contributions
Funding
Institutional Review Board Statement
Informed Consent Statement
Data Availability Statement
Conflicts of Interest
References
- Thomas, T.; Gilbert, J.; Meyer, F. Metagenomics—A guide from sampling to data analysis. Microb. Inform. Exp. 2012, 2, 3. [Google Scholar] [CrossRef] [PubMed] [Green Version]
- Huttenhower, C.; Gevers, D.; Knight, R.; Abubucker, S.; Badger, J.H.; Chinwalla, A.T.; Creasy, H.H.; Earl, A.M.; FitzGerald, M.G.; Fulton, R.S.; et al. Structure, function and diversity of the healthy human microbiome. Nature 2012, 486, 207–214. [Google Scholar] [CrossRef] [Green Version]
- Qin, J.; Li, R.; Raes, J.; Arumugam, M.; Burgdorf, K.S.; Manichanh, C.; Nielsen, T.; Pons, N.; Levenez, F.; Yamada, T.; et al. A human gut microbial gene catalogue established by metagenomic sequencing. Nature 2010, 464, 59–65. [Google Scholar] [CrossRef] [PubMed] [Green Version]
- Sanschagrin, S.; Yergeau, E. Next-generation sequencing of 16S ribosomal RNA gene amplicons. J. Vis. Exp. 2014, 29, 51709. [Google Scholar] [CrossRef] [PubMed] [Green Version]
- Poretsky, R.; Rodriguez-R, L.M.; Luo, C.; Tsementzi, D.; Konstantinidis, K.T. Strengths and Limitations of 16S rRNA Gene Amplicon Sequencing in Revealing Temporal Microbial Community Dynamics. PLoS ONE 2014, 9, e93827. [Google Scholar] [CrossRef] [Green Version]
- Quince, C.; Walker, A.W.; Simpson, J.T.; Loman, N.J.; Segata, N. Shotgun metagenomics, from sampling to analysis. Nat. Biotechnol. 2017, 35, 833–844. [Google Scholar] [CrossRef] [Green Version]
- Jovel, J.; Patterson, J.; Wang, W.; Hotte, N.; O’Keefe, S.; Mitchel, T.; Perry, T.; Kao, D.; Mason, A.L.; Madsen, K.L.; et al. Characterization of the Gut Microbiome Using 16S or Shotgun Metagenomics. Front. Microbiol. 2016, 7, 459. [Google Scholar] [CrossRef] [Green Version]
- Afshinnekoo, E.; Chou, C.; Alexander, N.; Ahsanuddin, S.; Schuetz, A.N.; Mason, C.E. Precision Metagenomics: Rapid Metagenomic Analyses for Infectious Disease Diagnostics and Public Health Surveillance. J. Biomol. Tech. 2017, 28, 40–45. [Google Scholar] [CrossRef] [Green Version]
- Bolyen, E.; Rideout, J.R.; Dillon, M.R.; Bokulich, N.A.; Abnet, C.C.; Al-Ghalith, G.A.; Alexander, H.; Alm, E.J.; Arumugam, M.; Asnicar, F.; et al. Reproducible, interactive, scalable and extensible microbiome data science using QIIME 2. Nat. Biotechnol. 2019, 37, 852–857. [Google Scholar] [CrossRef]
- Liu, B.; Gibbons, T.; Ghodsi, M.; Treangen, T.; Pop, M. Accurate and fast estimation of taxonomic profiles from metagenomic shotgun sequences. BMC Genom. 2011, 12, S4. [Google Scholar] [CrossRef] [Green Version]
- Huson, D.H.; Auch, A.F.; Qi, J.; Schuster, S.C. MEGAN analysis of metagenomic data. Genome Res. 2007, 17, 377–386. [Google Scholar] [CrossRef] [PubMed] [Green Version]
- Ahn, T.H.; Chai, J.; Pan, C. Sigma: Strain-level inference of genomes from metagenomic analysis for biosurveillance. Bioinformatics 2015, 31, 170–177. [Google Scholar] [CrossRef] [PubMed]
- Brady, A.; Salzberg, S. PhymmBL expanded: Confidence scores, custom databases, parallelization and more. Nat. Methods 2011, 8, 367. [Google Scholar] [CrossRef] [PubMed]
- Patil, K.R.; Haider, P.; Pope, P.B.; Turnbaugh, P.J.; Morrison, M.; Scheffer, T.; McHardy, A.C. Taxonomic metagenome sequence assignment with structured output models. Nat. Methods 2011, 8, 191–192. [Google Scholar] [CrossRef]
- Wood, D.E.; Lu, J.; Langmead, B. Improved metagenomic analysis with Kraken 2. Genome Biol. 2019, 20, 257. [Google Scholar] [CrossRef] [Green Version]
- Truong, D.T.; Franzosa, E.A.; Tickle, T.L.; Scholz, M.; Weingart, G.; Pasolli, E.; Tett, A.; Huttenhower, C.; Segata, N. MetaPhlAn2 for enhanced metagenomic taxonomic profiling. Nat. Methods 2015, 12, 902–903. [Google Scholar] [CrossRef]
- Segata, N.; Waldron, L.; Ballarini, A.; Narasimhan, V.; Jousson, O.; Huttenhower, C. Metagenomic microbial community profiling using unique clade-specific marker genes. Nat. Methods 2012, 9, 811–814. [Google Scholar] [CrossRef]
- Yassour, M.; Vatanen, T.; Siljander, H.; Hamalainen, A.M.; Harkonen, T.; Ryhanen, S.J.; Franzosa, E.A.; Vlamakis, H.; Huttenhower, C.; Gevers, D.; et al. Natural history of the infant gut microbiome and impact of antibiotic treatment on bacterial strain diversity and stability. Sci. Transl. Med. 2016, 8, 343ra381. [Google Scholar] [CrossRef] [Green Version]
- Kostic, A.D.; Gevers, D.; Siljander, H.; Vatanen, T.; Hyotylainen, T.; Hamalainen, A.M.; Peet, A.; Tillmann, V.; Poho, P.; Mattila, I.; et al. The dynamics of the human infant gut microbiome in development and in progression toward type 1 diabetes. Cell Host Microbe 2015, 17, 260–273. [Google Scholar] [CrossRef] [Green Version]
- Vatanen, T.; Kostic, A.D.; D’Hennezel, E.; Siljander, H.; Franzosa, E.A.; Yassour, M.; Kolde, R.; Vlamakis, H.; Arthur, T.D.; Hämäläinen, A.-M.; et al. Variation in Microbiome LPS Immunogenicity Contributes to Autoimmunity in Humans. Cell 2016, 165, 1551. [Google Scholar] [CrossRef]
- The MetaSUB International Consortium, The Metagenomics and Metadesign of the Subways and Urban Biomes (MetaSUB) International Consortium inaugural meeting report. Microbiome 2016, 4, 24. [CrossRef] [PubMed] [Green Version]
- Forbes, J.D.; Chen, C.Y.; Knox, N.C.; Marrie, R.A.; El-Gabalawy, H.; de Kievit, T.; Alfa, M.; Bernstein, C.N.; Van Domselaar, G. A comparative study of the gut microbiota in immune-mediated inflammatory diseases-does a common dysbiosis exist? Microbiome 2018, 6, 221. [Google Scholar] [CrossRef] [PubMed]
- Harris, Z.N.; Dhungel, E.; Mosior, M.; Ahn, T.-H. Massive metagenomic data analysis using abundance-based machine learning. Biol. Direct 2019, 14, 12. [Google Scholar] [CrossRef] [PubMed] [Green Version]
- Pasolli, E.; Truong, D.T.; Malik, F.; Waldron, L.; Segata, N. Machine Learning Meta-analysis of Large Metagenomic Datasets: Tools and Biological Insights. PLoS Comput. Biol. 2016, 12, e1004977. [Google Scholar] [CrossRef] [PubMed] [Green Version]
- Luo, D.; Ziebell, S.; An, L. An informative approach on differential abundance analysis for time-course metagenomic sequencing data. Bioinformatics 2017, 33, 1286–1292. [Google Scholar] [CrossRef]
- Dhungel, E.; Mreyoud, Y.; Gwak, H.-J.; Rajeh, A.; Rho, M.; Ahn, T.-H. MegaR: An interactive R package for rapid sample classification and phenotype prediction using metagenome profiles and machine learning. BMC Bioinform. 2021, 22, 25. [Google Scholar] [CrossRef]
- Reiman, D.; Metwally, A.A.; Sun, J.; Dai, Y. PopPhy-CNN: A Phylogenetic Tree Embedded Architecture for Convolutional Neural Networks to Predict Host Phenotype from Metagenomic Data. IEEE J. Biomed. Health Inform. 2020, 24, 2993–3001. [Google Scholar] [CrossRef]
- Oh, M.; Zhang, L. DeepMicro: Deep representation learning for disease prediction based on microbiome data. Sci. Rep. 2020, 10, 6026. [Google Scholar] [CrossRef] [Green Version]
- Rodriguez-Brito, B.; Rohwer, F.; Edwards, R.A. An application of statistics to comparative metagenomics. BMC Bioinform. 2006, 7, 162. [Google Scholar] [CrossRef] [Green Version]
- Bajaj, J.S.; Betrapally, N.S.; Gillevet, P.M. Decompensated cirrhosis and microbiome interpretation. Nature 2015, 525, E1–E2. [Google Scholar] [CrossRef] [Green Version]
- Karlsson, F.H.; Tremaroli, V.; Nookaew, I.; Bergstrom, G.; Behre, C.J.; Fagerberg, B.; Nielsen, J.; Backhed, F. Gut metagenome in European women with normal, impaired and diabetic glucose control. Nature 2013, 498, 99–103. [Google Scholar] [CrossRef] [PubMed]
- Fabian Pedregosa, G.V.; Gramfort, A.; Michel, V.; Thirion, B.; Grisel, O.; Blondel, M.; Prettenhofer, P.; Weiss, R.; Dubourg, V.; Vanderplas, J.; et al. Scikit-learn: Machine Learning in Python. JMLR 2011, 12, 2825–2830. [Google Scholar]
- Mishra, P. Introduction to Neural Networks Using PyTorch; Apress: New York, NY, USA, 2019; pp. 111–126. [Google Scholar]
- Mamoshina, P.; Vieira, A.; Putin, E.; Zhavoronkov, A. Applications of Deep Learning in Biomedicine. Mol. Pharm. 2016, 13, 1445–1454. [Google Scholar] [CrossRef] [PubMed]

| Sample Size | Controls | Diseased | Accession # | |
|---|---|---|---|---|
| Cirrhosis | 232 | 118 | 114 | ERP005860 |
| T2D | 440 | 217 | 223 | SRA045646 SRA050230 ERP002469 |
| Purina | 3096 | 1536 | 1560 | PRJEB20308 |
| Software | Software Available | T2D | Cirrhosis |
|---|---|---|---|
| MegaD (v1.0) | https://github.com/BioHPC/MegaD | 0.700 | 0.833 |
| MegaR (v1.0) | https://github.com/BioHPC/MegaR | 0.670 | 0.885 |
| PopPhy (v1.0) | https://github.com/YDaiLab/PopPhy-CNN | 0.650 | 0.910 |
| MetAML (v1.0) | http://segatalab.cibio.unitn.it/tools/metaml | 0.664 | 0.877 |
| Accuracy | AUC | Precision | F1 Score | |
|---|---|---|---|---|
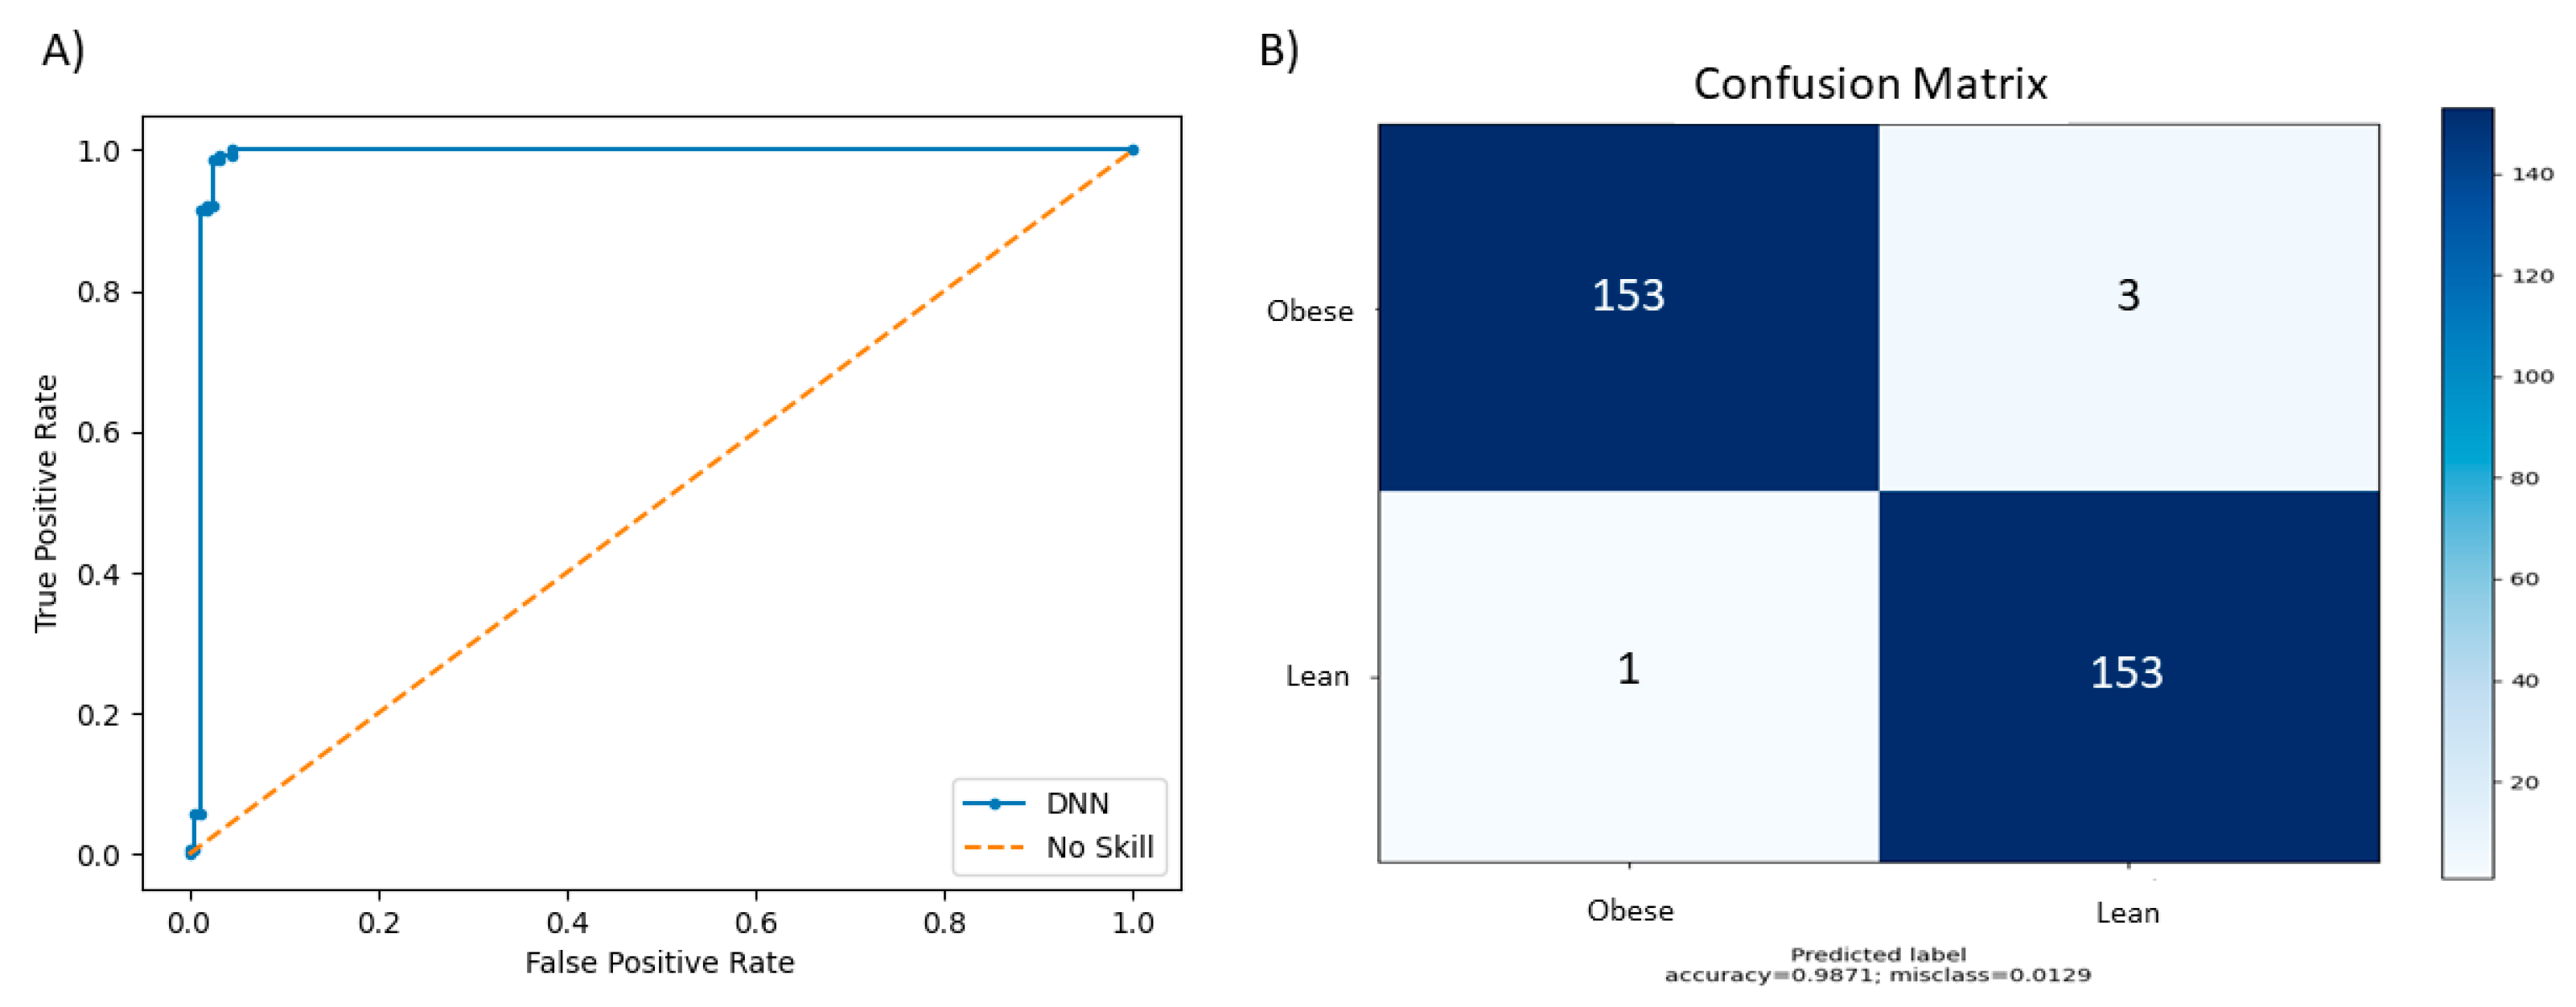
| Default Parameter | 0.941 | 0.959 | 0.9103 | 0.940 |
| Grid search | 0.987 | 0.986 | 0.981 | 0.987 |
Publisher’s Note: MDPI stays neutral with regard to jurisdictional claims in published maps and institutional affiliations. |
© 2022 by the authors. Licensee MDPI, Basel, Switzerland. This article is an open access article distributed under the terms and conditions of the Creative Commons Attribution (CC BY) license (https://creativecommons.org/licenses/by/4.0/).
Share and Cite
Mreyoud, Y.; Song, M.; Lim, J.; Ahn, T.-H. MegaD: Deep Learning for Rapid and Accurate Disease Status Prediction of Metagenomic Samples. Life 2022, 12, 669. https://doi.org/10.3390/life12050669
Mreyoud Y, Song M, Lim J, Ahn T-H. MegaD: Deep Learning for Rapid and Accurate Disease Status Prediction of Metagenomic Samples. Life. 2022; 12(5):669. https://doi.org/10.3390/life12050669
Chicago/Turabian StyleMreyoud, Yassin, Myoungkyu Song, Jihun Lim, and Tae-Hyuk Ahn. 2022. "MegaD: Deep Learning for Rapid and Accurate Disease Status Prediction of Metagenomic Samples" Life 12, no. 5: 669. https://doi.org/10.3390/life12050669