
Correlation between Angiotensin Serum Levels and Very-Low-Frequency Spectral Power of Heart Rate Variability during Hemodialysis

 ,
,  , ,
, ,  ,
,
Abstract
:1. Introduction
2. Materials and Methods
2.1. Patients
2.2. Study Protocol
2.3. Hemodialysis Prescription
2.4. Blood Sampling and Serum Markers Measurement
2.4.1. Angiotensin II and Angiotensin 1–7 Measurement
2.4.2. Nitric Oxide Measurement
2.4.3. Total Antioxidant Capacity Measurement
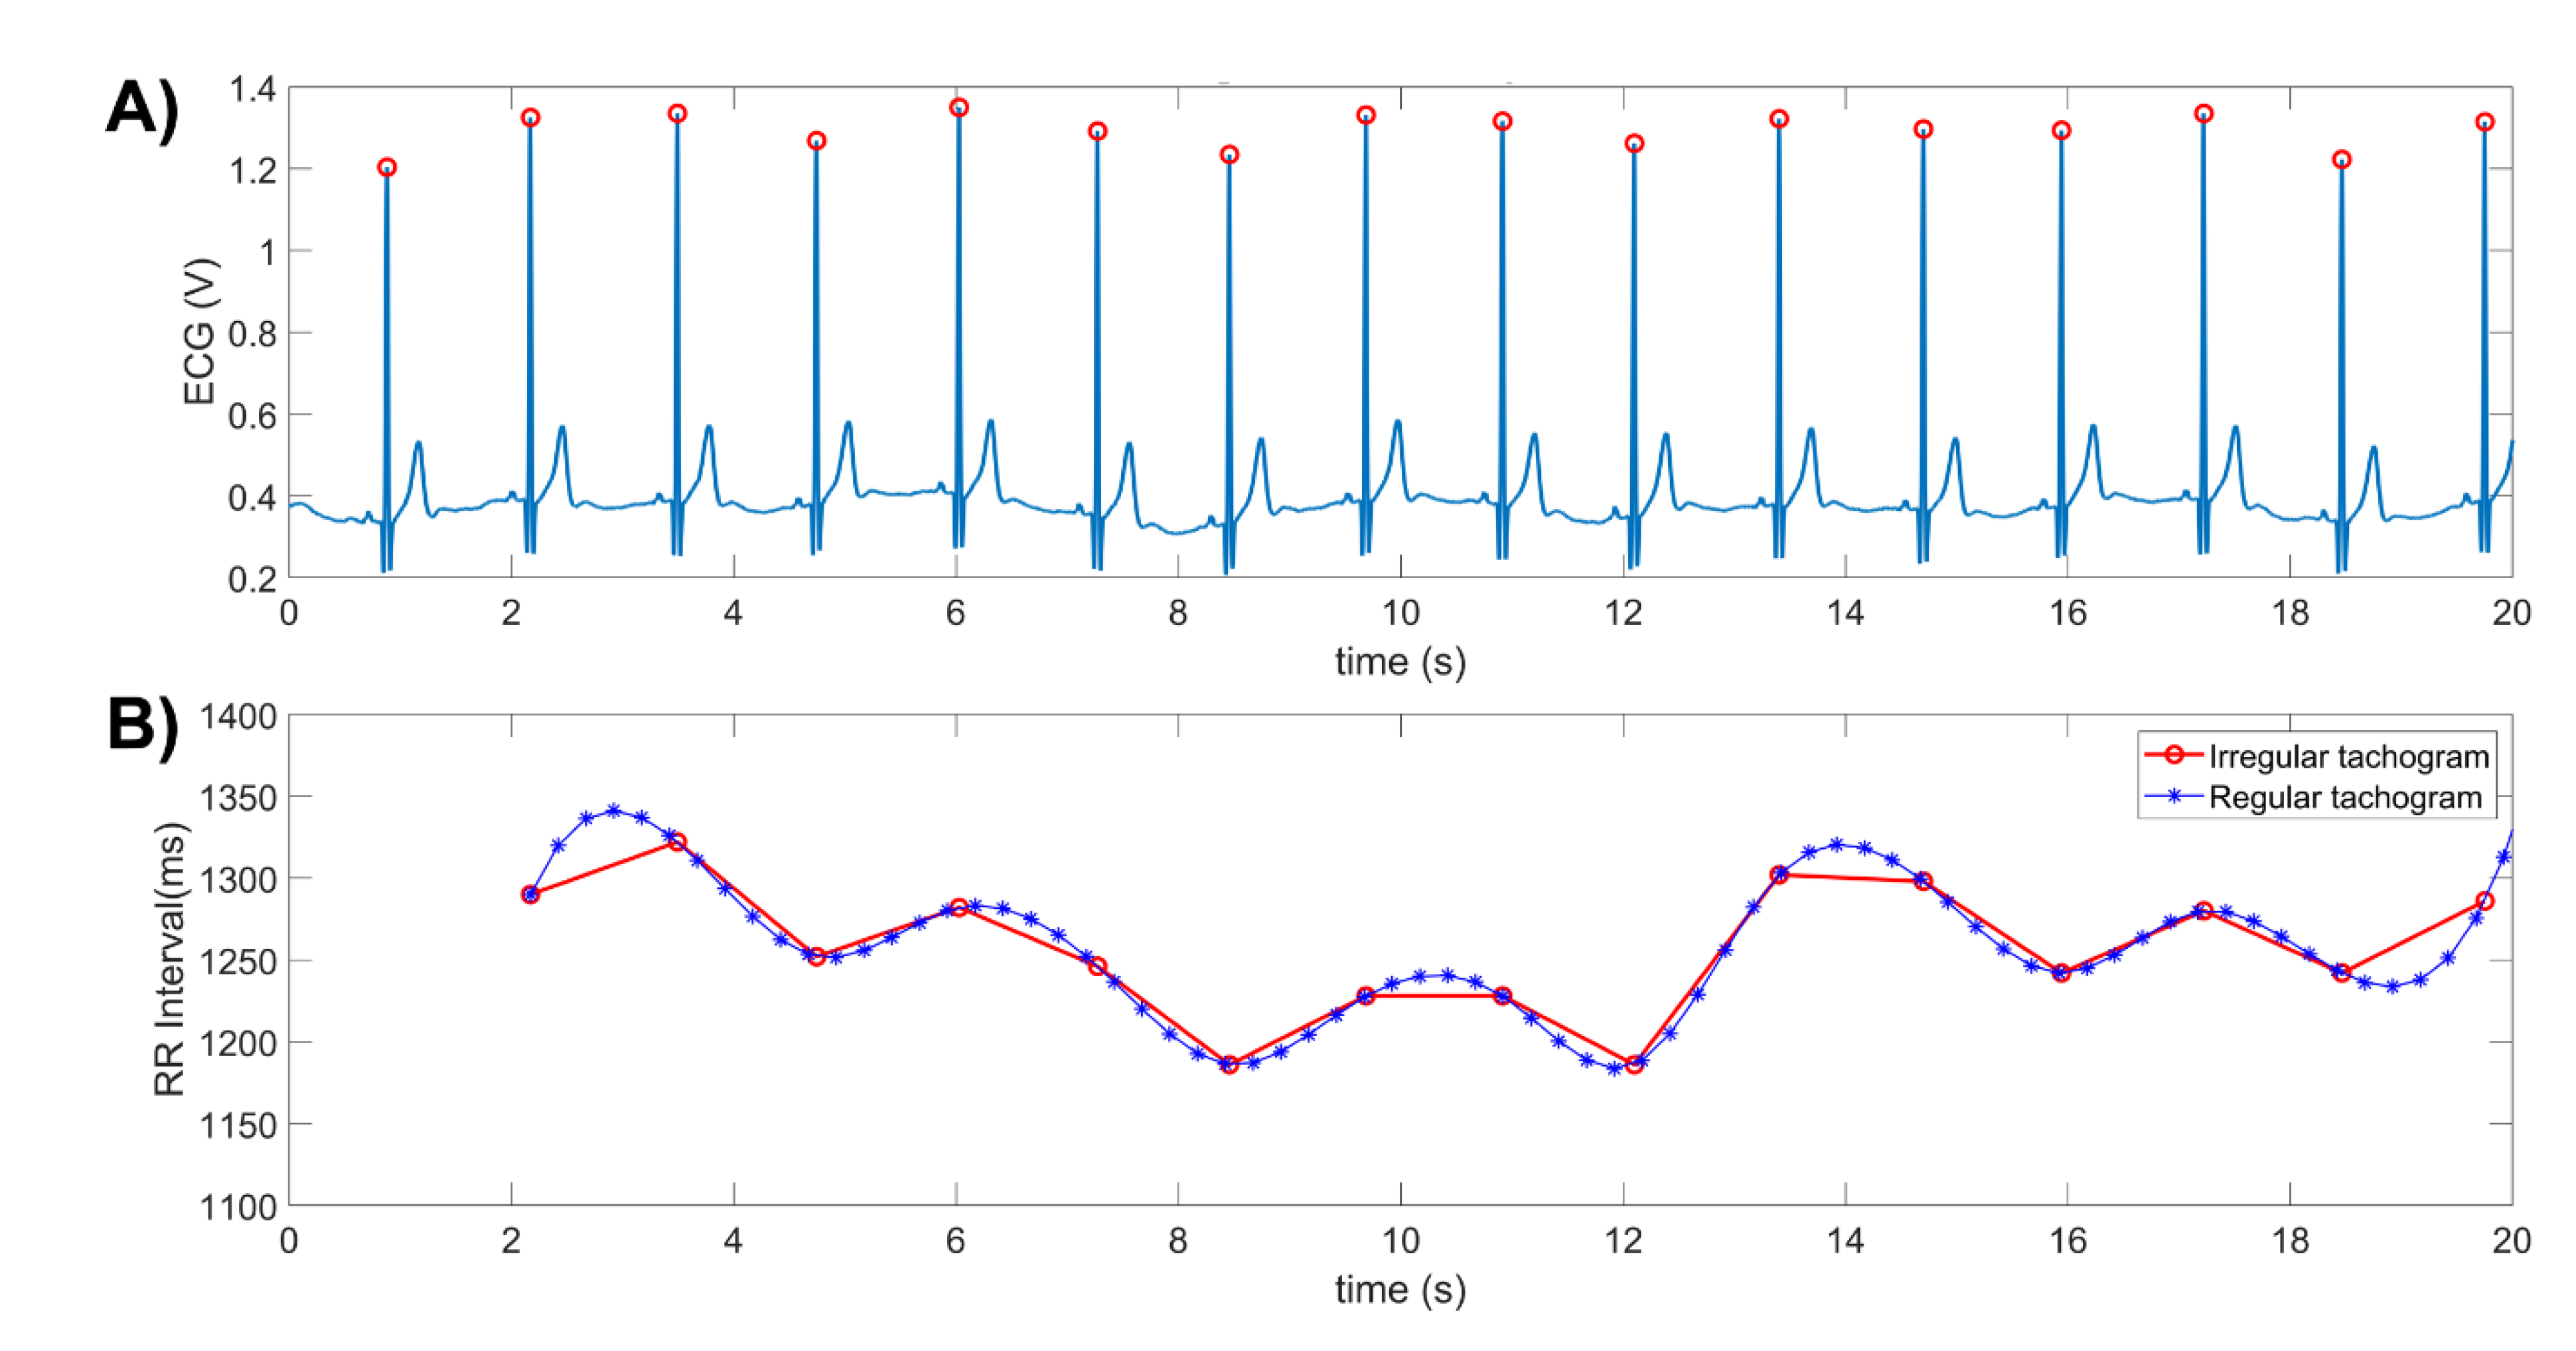
2.5. Electrocardiogram (ECG) Recording and Heart Rate Variability (HRV) Analysis
2.6. Statistical Analysis
3. Results
4. Discussion
Study Limitations and Perspectives
5. Conclusions
Author Contributions
Funding
Institutional Review Board Statement
Informed Consent Statement
Data Availability Statement
Acknowledgments
Conflicts of Interest
References
- Luyckx, V.A.; Tonelli, M.; Stanifer, J.W. The global burden of kidney disease and the sustainable development goals. Bull. World Health Organ. 2018, 96, 414–422. [Google Scholar] [CrossRef] [PubMed]
- Romagnani, P.; Remuzzi, G.; Glassock, R.; Levin, A.; Jager, K.J.; Tonelli, M.; Massy, Z.; Wanner, C.; Anders, H.J. Chronic kidney disease. Nat. Rev. Dis. Prim. 2017, 3, 17088. [Google Scholar] [CrossRef] [PubMed]
- Kooman, J.P.; Katzarski, K.; van der Sande, F.M.; Leunissen, K.M.; Kotanko, P. Hemodialysis: A model for extreme physiology in a vulnerable patient population. Semin. Dial. 2018, 31, 500–506. [Google Scholar] [CrossRef] [PubMed]
- Guzmán-Hernández, E.A.; Segura-Cobos, D.; Ibarra-Barajas, M. Regulación de la liberación de renina durante la hipertensión renovascular. Rev. Biomed. 2015, 26, 33–40. [Google Scholar] [CrossRef] [Green Version]
- Miller, A.J.; Arnold, A.C. The renin–angiotensin system in cardiovascular autonomic control: Recent developments and clinical implications. Clin. Auton. Res. 2019, 29, 231–243. [Google Scholar] [CrossRef] [PubMed]
- Borghi, C.; SIIA Task Force; Rossi, F.; SIF Task Force. Role of the renin-angiotensin-aldosterone system and its pharmacological inhibitors in cardio-vascular diseases: Complex and Critical Issues. High Blood Press. Cardiovasc. Prev. 2015, 22, 429–444. [Google Scholar] [CrossRef] [PubMed]
- Putri, A.Y.; Thaha, M. Role of oxidative stress on chronic kidney disease progression. Acta Med. Indones. 2014, 46, 244–252. [Google Scholar] [PubMed]
- Landmesser, U.; Harrison, D.G. Oxidative stress and vascular damage in hypertension. Coron. Artery Dis. 2001, 12, 455–461. [Google Scholar] [CrossRef]
- Veloza, L.; Jiménez, C.; Quiñones, D.; Polanía, F.; Pachón-Valero, L.C.; Rodríguez-Treviño, C.Y. Variabilidad de la frecuencia cardiaca como factor predictor de las enfermedades cardiovasculares. Rev. Colomb. Cardiol. 2019, 26, 205–210. [Google Scholar] [CrossRef]
- Malik, M.; Bigger, J.T.; Camm, A.J.; Kleiger, R.E.; Malliani, A.; Moss, A.J.; Schwartz, P.J. Heart rate variability. Standards of measurement, physiological interpretation, and clinical use. Task Force of the European Society of Cardiology and the North American Society of Pacing and Electrophysiology. Eur. Heart J. 1996, 17, 354–381. [Google Scholar] [CrossRef] [Green Version]
- Rodas, G.; Carballido, C.; Ramos, L. Variabilidad de la frecuencia cardiaca: Concepto, medidas y relación con aspectos clínicos (I). Arch. Med. Deporte 2018, 25, 41–47. [Google Scholar]
- Barnas, M.G.; Boer, W.H.; Koomans, H.A. Hemodynamic patterns and spectral analysis of heart rate variability during dialysis hypotension. J. Am. Soc. Nephrol. 1999, 10, 2577–2584. [Google Scholar] [CrossRef]
- Martínez-Memije, R.; Becerra-Luna, B.; Cartas-Rosado, R.; Infante-Vázquez, O.; Lerma, C.; Pérez-Grovas, H.; Rodríguez-Chagolla, J.M. Estimation of the very low frequency components in heart rate variability during hemodiafiltration. IFMBE Proc. 2020, 75, 145–150. [Google Scholar]
- Becerra-Luna, B.; Martínez-Memije, R.; Cartas-Rosado, R.; Infante-Vázquez, O.; Sánchez-García, J.C.; Sánchez-Pérez, G. Optimal window for the estimation of very low frequency content in heart rate variability analysis. In World Congress on Medical Physics and Biomedical Engineering; Lhotska, L., Sukupova, L., Lacković, I., Ibbott, G., Eds.; IFMBE Proceedings Series; Springer Nature: Singapore, 2019; Volume 68, pp. 331–334. [Google Scholar]
- Becerra-Luna, B.; Cartas-Rosado, R.; Sánchez-García, J.C.; Martínez-Memije, R.; Infante-Vázquez, O.; Lerma, C.; Pérez-Grovas, H.; Rodríguez-Chagolla, J.M.; Sánchez-Pérez, G.; Cadena-Méndez, M. Heart rate variability assessment using time–frequency analysis in hypotensive and non-hypotensive patients in hemodialysis. Appl. Sci. 2020, 10, 6074. [Google Scholar] [CrossRef]
- Cartas-Rosado, R.; Becerra-Luna, B.; Martínez-Memije, R.; Infante-Vázquez, O.; Lerma, C.; Pérez-Grovas, H.; Rodríguez-Chagolla, J.M. Continuous wavelet transform based processing for estimating the power spectrum content of heart rate variability during hemodiafiltration. Biomed. Signal Process. Control 2020, 62, 102031. [Google Scholar] [CrossRef]
- Sassi, R.; Cerutti, S.; Lombardi, F.; Malik, M.; Huikuri, H.V.; Peng, C.K.; Schmidt, G.; Yamamoto, Y. Advances in heart rate variability signal analysis: Joint position statement by the e-Cardiology ESC Working Group and the European Heart Rhythm Association co-endorsed by the Asia Pacific Heart Rhythm Society. Europace 2015, 17, 1341–1353. [Google Scholar] [CrossRef]
- Lerma, C.; Minzoni, A.; Infante, O.; José, M.V. A mathematical analysis for the cardiovascular control adaptations in chronic renal failure. Artif. Organs 2004, 28, 398–409. [Google Scholar] [CrossRef]
- Park, K.W.; Kyun Bae, S.; Lee, B.; Hun Baek, J.; Woo Park, J.; Jin Moon, S.; Yoon, S.Y. The effect of on-line hemodiafiltration on heart rate variability in end-stage renal disease. Kidney Res. Clin. Pract. 2013, 32, 127–133. [Google Scholar] [CrossRef] [Green Version]
- Reeves, P.B.; Mc Causland, F.R. Mechanisms, clinical implications, and treatment of intradialytic hypotension. Clin. J. Am. Soc. Nephrol. 2018, 13, 1297–1303. [Google Scholar] [CrossRef] [Green Version]
- Taylor, J.A.; Carr, D.L.; Myers, C.W.; Eckberg, D.L. Mechanisms underlying very low frequency RR-interval oscillations in humans. Circulation 1998, 98, 547–555. [Google Scholar] [CrossRef] [Green Version]
- Sibbel, S.; Maroni, B.J.; Brunelli, S.M. The effect of altitude on erythropoiesis-stimulating agent dose, hemoglobin level, and mortality in hemodialysis patients. J. Nephrol. 2017, 30, 821–829. [Google Scholar] [CrossRef] [PubMed] [Green Version]
- Hurtado, A.M.; Palacios, A.; Figueroa, J.; Gonzales Polar, J.; Kaluguina deYrigoin, A.; Teresa Lopera, M. Niveles de hemoglobina en pacientes en hemodiálisis a nivel del mar y a mayor altitud, y su relación con la calidad de vida. Rev. Soc. Peru. Med. Int. 2019, 26, 171–177. [Google Scholar]
- Tenorio-López, F.A.; Zarco-Olvera, G.; Sánchez-Mendoza, A.; Rosas-Peralta, M.; Pastelín-Hernández, G.; del Valle-Mondragón, L. Simultaneous determination of angiotensins II and 1–7 by capillary zone electrophoresis in plasma and urine from hypertensive rats. Talanta 2010, 80, 1702–1712. [Google Scholar] [CrossRef]
- Tenorio-López, F.A.; del Valle-Mondragón, L.; Pastelín-Hernández, G. Validation of spectrophotometric analytical method for cuantifying stable metabolites of nitric oxide in biological fluids. Rev. Mex. Cienc. Farm. 2005, 36, 31–41. [Google Scholar]
- Campos, C.; Guzmán, R.; López-Fernández, E.; Casado, A. Evaluation of the copper(II) reduction assay using bathocuproinedisulfonic acid disodium salt for the total antioxidant capacity assessment: The CUPRAC–BCS assay. Anal. Biochem. 2009, 392, 37–44. [Google Scholar] [CrossRef] [PubMed]
- Govindan, R.B.; Massaro, A.N.; Kota, S.; Grabowski, R.C.; Wilson, J.D.; Plessis, A.D. Effect of EKG sampling rate on heart rate variability analysis. In Proceedings of the 2019 41st Annual International Conference of the IEEE Engineering in Medicine and Biology Society (EMBC), Berlin, Germany, 23–27 July 2019; pp. 6780–6783. [Google Scholar]
- Clifford, G.D.; Tarassenko, L. Quantifying errors in spectral estimates of HRV due to beat replacement and resampling. IEEE Trans. Biomed. Eng. 2005, 52, 630–638. [Google Scholar] [CrossRef] [Green Version]
- Daugirdas, J.T. Dialysis hypotension: A hemodynamic analysis. Kidney Int. 1991, 39, 233–246. [Google Scholar] [CrossRef] [Green Version]
- Karas, M.; Lacourcière, Y.; LeBlanc, A.R.; Nadeau, R.; Dubé, B.; Florescu, M.; Lamarre-Cliche, M.; Poirier, L.; Larochelle, P.; de Champlain, J. Effect of the renin–angiotensin system or calcium channel blockade on the circadian variation of heart rate variability, blood pressure and circulating catecholamines in hypertensive patients. J. Hypertens. 2005, 23, 1251–1260. [Google Scholar] [CrossRef]
- Fauchald, P. Transcapillary colloid osmotic gradient and body fluid volumes in renal failure. Kidney Int. 1986, 29, 895–900. [Google Scholar] [CrossRef] [Green Version]
- Burton, J.O.; Jefferies, H.J.; Selby, N.M.; McIntyre, C.W. Hemodialysis-induced repetitive myocardial injury results in global and segmental reduction in systolic cardiac function. Clin. J. Am. Soc. Nephrol. 2009, 4, 1925–1931. [Google Scholar] [CrossRef] [Green Version]
- Ritz, E.; Rambausek, M.; Mall, G.; Ruffmann, K.; Mandelbaum, A. Cardiac changes un uremia and their possible relationship to cardiovascular instability on dialysis. Nephrol. Dial. Transplant. 1990, 5, 93–97. [Google Scholar] [CrossRef] [PubMed]
- Converse, R.L., Jr.; Jacobsen, T.N.; Jost, C.M.; Toto, R.D.; Grayburn, P.A.; Obregon, T.M.; Fouad-Tarazi, F.; Victor, R.G. Paradoxical withdrawal of reflex vasoconstriction as a cause of hemodialysis-induced hypotension. J. Clin. Investig. 1992, 90, 1657–1665. [Google Scholar] [CrossRef] [PubMed] [Green Version]
- Badder, E.M.; Seaton, J.; Harrison, T.S. Cardiac output, vascular resistance and catecholamine release in hemorrhaged anephric dogs. Trans. Am. Soc. Artif. Intern. Organs 1981, 27, 330–335. [Google Scholar] [PubMed]
- Daugirdas, J.T.; Ing, T.S.; Chen, W.T.; Vestal, R.E.; Izzo, J.L., Jr.; Hano, J.E.; Norusis, M.J. Hemodynamic response to volume depletion in acutely uremic dogs. Am. J. Physiol. 1984, 247, 229–236. [Google Scholar] [CrossRef] [PubMed]
- Oparil, S.; Vassaux, C.; Sanders, C.A.; Haber, E. Role of renin in acute postural homeostasis. Circulation 1970, 41, 65–89. [Google Scholar] [CrossRef] [PubMed] [Green Version]
- Textor, S.C.; Gavras, H.; Tifft, C.P.; Bernard, D.B.; Idelson, B.; Brunner, H.R. Norepinephrine and renin activity in chronic renal failure. Evidence for interacting roles in hemodialysis hypertension. Hypertension 1981, 3, 294–299. [Google Scholar] [CrossRef] [Green Version]
- Chandra, P.; Sands, R.L.; Gillespie, B.W.; Levin, N.W.; Kotanko, P.; Kiser, M.; Finkelstein, F.; Hinderliter, A.; Pop-Busui, R.; Rajagopalan, S.; et al. Predictors of heart rate variability and its prognostic significance in chronic kidney disease. Nephrol. Dial. Transplant. 2012, 27, 700–709. [Google Scholar] [CrossRef] [Green Version]
- Lerma, C.; González, H.; Pérez-Grovas, H.; José, M.V.; Infante, O. Preserved autonomic heart rate modulation in chronic renal failure patients in response to hemodialysis and orthostatism. Clin. Exp. Nephrol. 2015, 19, 309–318. [Google Scholar] [CrossRef]
- Hörl, M.P.; Hörl, W.H. Hemodialysis-associated hypertension: Pathophysiology and therapy. Am. J. Kidney Dis. 2002, 39, 227–244. [Google Scholar] [CrossRef]
- Malik, U.; Raizada, V. Some aspects of the renin-angiotensin-system in hemodialysis patients. Kidney Blood Press. Res. 2015, 40, 614–622. [Google Scholar] [CrossRef]
- Dickson, M.E.; Sigmund, C.D. Genetic basis of hypertension: Revisiting angiotensinogen. Hypertension 2006, 48, 14–20. [Google Scholar] [CrossRef] [PubMed]
- Romero, C.A.; Tabares, A.H.; Orias, M. Is isolated diastolic hypertension an important phenotype? Curr. Cardiol. Rep. 2021, 23, 177. [Google Scholar] [CrossRef] [PubMed]
- Struthers, A.D.M.; Pai, S.; Seidelin, P.H.; Coutie, W.J.; Morton, J.J. Evidence in humans for a postsynaptic interaction between noradrenaline and angiotensin II with regard to systolic but not diastolic blood pressure. J. Hypertens. 1987, 5, 671–676. [Google Scholar] [CrossRef] [PubMed]


| Variable | Intrahemodialysis Time | ||
|---|---|---|---|
| 0.0 h | 1.5 h | 3.0 h | |
| Systolic blood pressure (mmHg) | 134 ± 18 | 127 ± 18 | 127 ± 28 |
| Diastolic blood pressure (mmHg) | 75 ± 13 | 75 ± 11 | 73 ± 22 |
| Heart rate (bmp) | 80 ± 13 | 71 ± 11 * | 75 ± 12 |
| Central temperature (°C) | 33.3 ± 1.2 | 33.2 ± 1.2 | 33.1 ± 1.5 |
| Peripheral temperature (°C) | 27.6 ± 4.1 | 26.8 ± 4.2 | 26 ± 3.1 |
| Log10 (angiotensin II) (pg/mL) | 1.21 ± 0.38 | 1.22 ± 0.40 | 1.21 ± 0.38 |
| Log10 (angiotensin 1–7) (pg/mL) | 1.31 ± 0.23 | 1.30 ± 0.24 | 1.29 ± 0.25 |
| Nitric oxide (pmol/mL) | 80.38 ± 38.85 | 74.84 ± 36.92 | 77.41 ± 37.77 |
| Total antioxidant capacity (mmol/L) | 78.02 ± 36.59 | 69.38 ± 30.46 | 74.62 ± 34.68 |
| Log10 (VLF) ms2 | 2.68 ± 0.40 | 2.94 ± 0.49 * | 2.90 ± 0.46 * |
| Normalized VLF | 0.59 ± 0.16 | 0.56 ± 0.18 | 0.64 ± 0.17 |
| Log10 (LF) ms2 | 2.39 ± 0.57 | 2.65 ± 0.67 * | 2.49 ± 0.72 |
| Normalized LF | 0.31 ± 0.13 | 0.31 ± 0.16 | 0.28 ± 0.13 |
| Log10 (HF) ms2 | 1.82 ± 0.64 | 2.15 ± 0.86 * | 1.91 ± 0.85 & |
| Normalized HF | 0.10 ± 0.08 | 0.13 ± 0.10 | 0.09 ± 0.07 & |
| Log10 (LF/HF) | 0.57 ± 0.33 | 0.50 ± 0.47 | 0.59 ± 0.33 |
| Variable | Log10 (Angiotensin II) (pmol/mL) | Log10 (Angiotensin 1–7) (pmol/mL) | Nitric Oxide (pmol/mL) | Total Antioxidant Capacity (mmol/L) | |
|---|---|---|---|---|---|
| Mean ± SD | 1.21 ± 0.38 | 1.30 ± 0.24 | 77.5 ± 37.8 | 74 ± 33.9 | |
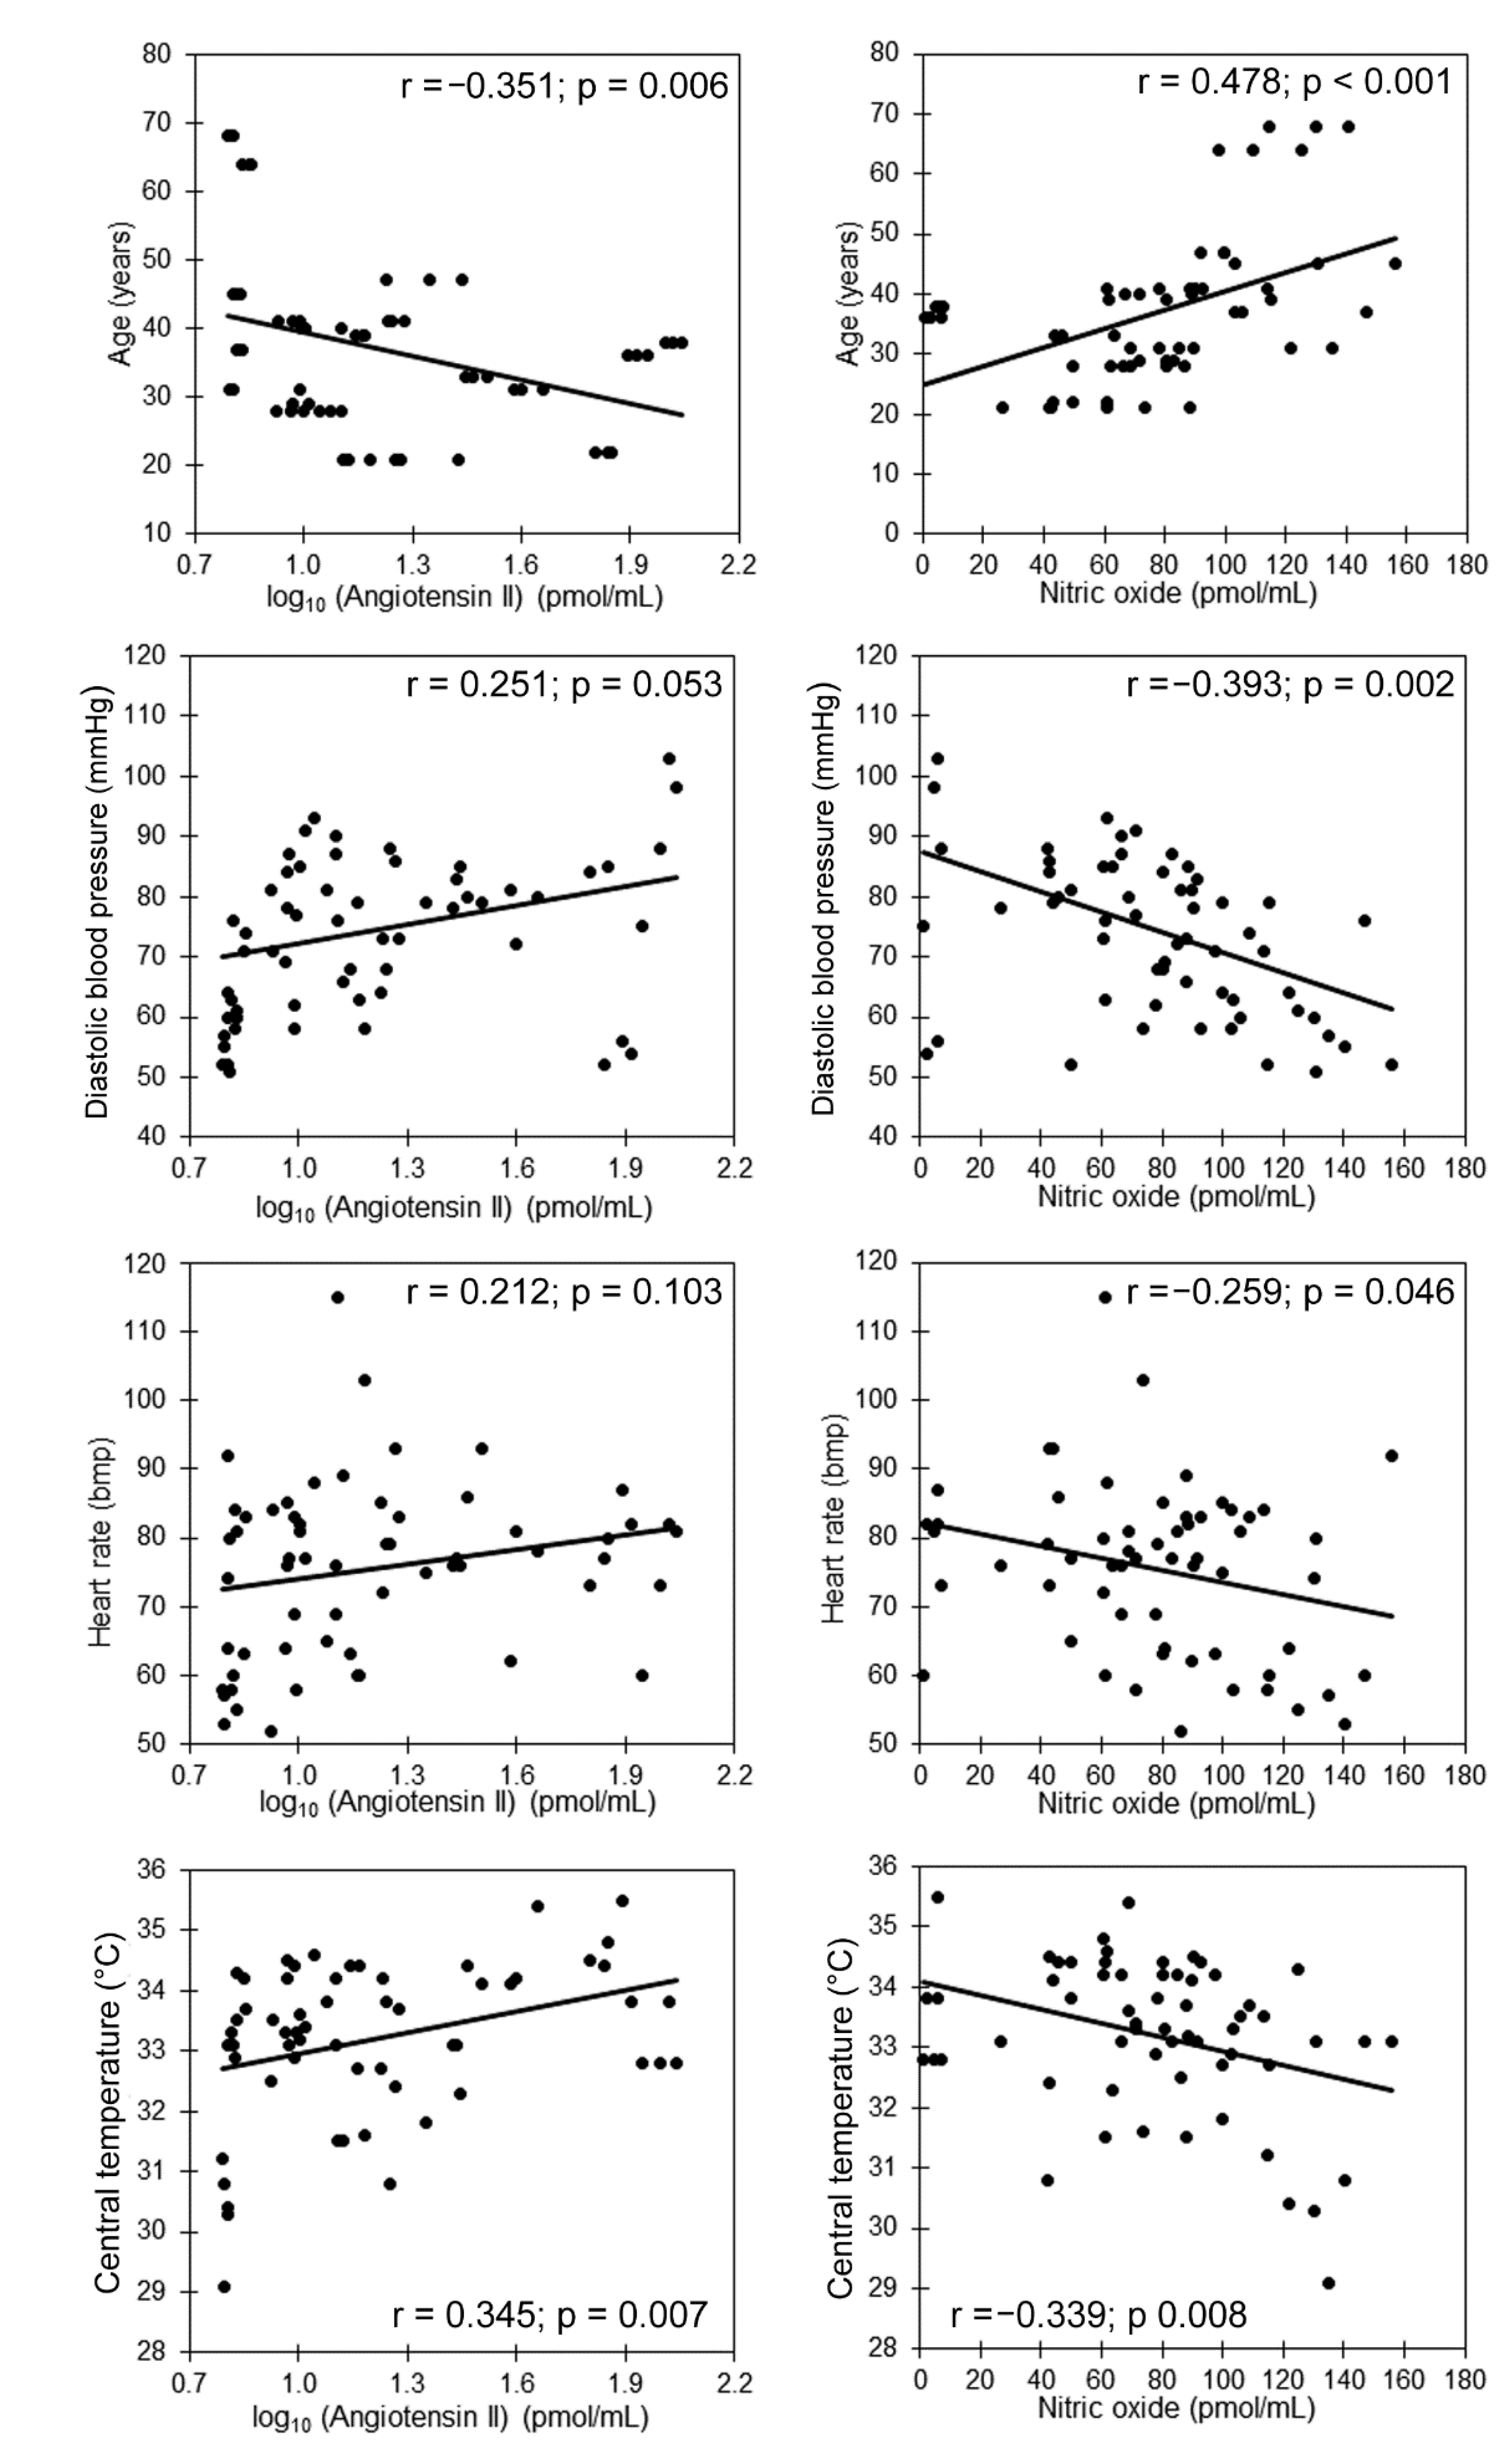
| Age (years) | 37 ± 12 | −0.351 ** | 0.180 | 0.478 ** | 0.050 |
| Body mass index (Kg/m2) | 23.3 ± 3.1 | −0.001 | −0.115 | 0.155 | −0.002 |
| Systolic blood pressure (mmHg) | 129 ± 22 | 0.123 | −0.031 | −0.253 | −0.157 |
| Diastolic blood pressure (mmHg) | 74 ± 16 | 0.251 | −0.136 | −0.393 ** | −0.335 ** |
| Heart rate (bpm) | 75 ± 13 | 0.212 | −0.116 | −0.259 * | 0.021 |
| Core temperature (°C) | 33.2 ± 1.3 | 0.354 ** | −0.118 | −0.339 ** | −0.314 * |
| Peripheral temperature (°C) | 26.8 ± 3.9 | −0.020 | −0.039 | −0.049 | −0.121 |
| Temperature difference (°C) | 6.4 ± 3.7 | 0.140 | 0.001 | −0.067 | 0.016 |
| Log10 (VLF) ms2 | 2.84 ± 0.46 | −0.071 | −0.079 | −0.040 | −0.192 |
| Normalized VLF | 0.59 ± 0.17 | 0.390 ** | 0.038 | −0.149 | −0.116 |
| Log10 (LF) ms2 | 2.51 ± 0.66 | −0.229 | 0.148 | 0.037 | 0.097 |
| Normalized LF | 0.30 ± 0.14 | −0.262 * | −0.140 | 0.138 | 0.063 |
| log10 (HF) ms2 | 1.96 ± 0.79 | −0.363 * | 0.054 | 0.133 | −0.010 |
| Normalized HF | 0.11 ± 0.08 | −0.383 ** | 0.155 | 0.083 | 0.138 |
| Log10 (LF/HF) | 0.55 ± 0.038 | 0.359 ** | −0.367 ** | −0.213 | −0.146 |
| Variables | Standardized β | β (C.I.95%) | p | R2 |
|---|---|---|---|---|
| Predicted HRV Index: Normalized VLF | 0.574 | |||
| Log10 (angiotensin II) (pmol/mL) | 0.531 | −0.244 (0.127–0.361) | <0.001 | |
| Age (years) | 0.438 | 0.006 (0.003–0.010) | 0.001 | |
| Diastolic blood pressure (mmHg) | 0.070 | 0.001 (−0.002–0.003) | 0.565 | |
| Heart rate (bpm) | 0.245 | 0.003 (0.001–0.007) | 0.044 | |
| Core temperature (°C) | −0.165 | −0.022 (−0.055–0.010) | 0.173 | |
| Predicted HRV Index:Normalized LF | 0.167 | |||
| Log10 (angiotensin II) (pmol/mL) | −0.351 | −0.128 (−0.232–−0.024) | 0.016 | |
| Age (years) | −0.317 | −0.004 (−0.007–0.001) | 0.032 | |
| Diastolic blood pressure (mmHg) | −0.166 | −0.001 (−0.004–0.001) | 0.222 | |
| Heart rate (bpm) | −0.151 | −0.002 (−0.005–0.001) | 0.262 | |
| Core temperature (°C) | 0.150 | 0.016 (−0.013–0.045) | 0.265 | |
| Predicted HRV Index:Normalized HF | 0.340 | |||
| Log10 (angiotensin II) (pmol/mL) | −0.531 | −0.116 (−0.171–−0.061) | <0.001 | |
| Age (years) | −0.393 | −0.003 (−0.004–−0.001) | 0.003 | |
| Diastolic blood pressure (mmHg) | 0.131 | 0.001 (−0.001–0.002) | 0.278 | |
| Heart rate (bpm) | −0.265 | −0.002 (−0.003–0.001) | 0.029 | |
| Core temperature (°C) | 0.096 | 0.006 (−0.009–0.021) | 0.420 | |
| Predicted HRV Index:log10 (LF/HF) | 0.263 | |||
| Log10 (angiotensin II) (pmol/mL) | 0.468 | 0.472 (0.202–0.742) | 0.001 | |
| Age (years) | 0.247 | 0.008 (−0.001–0.016) | 0.074 | |
| Diastolic blood pressure (mmHg) | −0.164 | −0.004 (−0.010–0.002) | 0.202 | |
| Heart rate (bpm) | 0.258 | 0.008 (0.001–0.015) | 0.044 | |
| Core temperature (°C) | −0.105 | −0.031 (−0.105–0.043) | 0.405 | |
Publisher’s Note: MDPI stays neutral with regard to jurisdictional claims in published maps and institutional affiliations. |
© 2022 by the authors. Licensee MDPI, Basel, Switzerland. This article is an open access article distributed under the terms and conditions of the Creative Commons Attribution (CC BY) license (https://creativecommons.org/licenses/by/4.0/).
Share and Cite
del Valle-Mondragón, L.; Becerra-Luna, B.; Cartas-Rosado, R.; Infante, O.; Pérez-Grovas, H.; Lima-Zapata, L.I.; Lerma, C.; Rodríguez-Chagolla, J.; Martínez-Memije, R. Correlation between Angiotensin Serum Levels and Very-Low-Frequency Spectral Power of Heart Rate Variability during Hemodialysis. Life 2022, 12, 1020. https://doi.org/10.3390/life12071020
del Valle-Mondragón L, Becerra-Luna B, Cartas-Rosado R, Infante O, Pérez-Grovas H, Lima-Zapata LI, Lerma C, Rodríguez-Chagolla J, Martínez-Memije R. Correlation between Angiotensin Serum Levels and Very-Low-Frequency Spectral Power of Heart Rate Variability during Hemodialysis. Life. 2022; 12(7):1020. https://doi.org/10.3390/life12071020
Chicago/Turabian Styledel Valle-Mondragón, Leonardo, Brayans Becerra-Luna, Raúl Cartas-Rosado, Oscar Infante, Héctor Pérez-Grovas, Larissa I. Lima-Zapata, Claudia Lerma, José Rodríguez-Chagolla, and Raúl Martínez-Memije. 2022. "Correlation between Angiotensin Serum Levels and Very-Low-Frequency Spectral Power of Heart Rate Variability during Hemodialysis" Life 12, no. 7: 1020. https://doi.org/10.3390/life12071020