Article

RNA-Seq Analysis Demonstrates Different Strategies Employed by Tiger Nuts (Cyperus esculentus L.) in Response to Drought Stress

1
Legume Crop Laboratory, Agriculture College, Heilongjiang Bayi Agricultural University, Daqing 163319, China
2
Economic Crop Research Laboratory, Economic Crops Institute, Jilin Academy of Agricultural Sciences, Changchun 130033, China
3
National Cereals Technology Engineering Research Center, Daqing 163319, China
*
Authors to whom correspondence should be addressed.
Life 2022, 12(7), 1051; https://doi.org/10.3390/life12071051
Submission received: 24 June 2022 / Revised: 4 July 2022 / Accepted: 11 July 2022 / Published: 14 July 2022
(This article belongs to the Special Issue Phytohormones and Stress Response in Plants)

Abstract

:
Drought stress, an important abiotic stress, has affected global agricultural production by limiting the yield and the quality of crops. Tiger nuts (Cyperus esculentus L.) are C4 crops in the Cyperaceae family, which have high-quality wholesome ingredients. However, data on mechanisms underlying the response of tiger nuts to drought stress are few. Here, the variety of Jisha 1 and 15% polyethylene glycol (PEG; a drought stress simulator) were used to study the mechanisms of stress response in tiger nuts. Our evaluation of the changes in physiological indicators such as electrolyte leakage (El), malondialdehyde (MDA), hydrogen peroxide (H2O2), superoxide anion (O2) and activities of reactive oxygen species (ROS) showed that 12 h was the most suitable time point to harvest and analyze the response to drought stress. Thereafter, we performed transcriptome (RNA-Seq) analysis in the control (CK) and stress treatment groups and showed that there was a total of 1760 differentially expressed genes (DEGs). Gene Ontology (GO) analysis showed that the DEGs were enriched in abscisic acid (ABA) terms, and pathways such as starch and sucrose metabolism (ko00500), phenylpropanoid biosynthesis (ko00940) and plant hormone signal transduction (ko04075) were significantly enriched in the Kyoto Encyclopedia of Genes and Genomes (KEGG) analysis. In addition, quantitative real-time PCR (qRT-PCR) analysis of the DEGs demonstrated an upregulation of ABA and lignin content, as well as enzyme activities in enriched pathways, which validated the RNA-Seq data. These results revealed the pathways and mechanisms adopted by the tiger nuts in response to drought stress.

1. Introduction

Tiger nut (Cyperus esculentus) is a C4 plant of the Cyperaceae family, which has a high yield and contains underground tubers with high nutrient value [1]. The tiger nut crop is widespread in tropical, temperate, and cooler zones [2] and originated from the Mediterranean area. It was domesticated and utilized as an important food source in Ancient Egypt [3,4]. The underground tubers of the tiger nuts do not only have a huge amount of nutrients, including starch, oil, sugars, protein, dietary fibers, vitamins C and E and minerals [4,5], but bioactive substances, such as phytosterols, alkaloids, saponins, tannins, flavonoids and terpenoids, as well [6,7]. These ingredients have beneficial effects in patients with diabetes, cardiovascular disease and obesity [7,8]. Since the tiger nut is an ideal foodstuff for children and seniors [9], it has become a crop of immense interest. Although tiger nuts are widely cultivated, there is limited research data on its biology [10]. Abiotic stress is one of the most important factors that may affect tiger nut yield [8].
Drought stress is an important abiotic stress and a key limiting factor which negatively affect crop productivity, owing to the global water shortage [11]. Drought stress causes significant losses in agricultural productivity, desertification, soil erosion and ecological degradation [12]. In addition, drought stress contributes to changes in the physiology and metabolism of plants, which lead to substantial reductions in the yield [13]. Drought stress can suppress the leaf area and the total chlorophyll content, produce reactive oxygen species (ROS), make leaves wilt and restrict root growth [14,15]. In addition, drought stress can also modulate activities of many oxidation-protective enzymes such as peroxidase (POD), superoxide dismutase (SOD), catalase (CAT) and ascorbate peroxidase (APX) [16], as well as the expression of some genes whose functions are associated with stress [17]. On the other hand, drought stress accumulates abscisic acid (ABA) in plants, which regulates stomatal closure and defends plants from stress [18]. ABA could induce the starch and sucrose metabolism to enhance stress tolerance [19]. Although drought stress affects all plant growth and development stages, the bud stage is the most sensitive and affects subsequent plant growth periods [20].
RNA-Seq analysis is a new analytical tool [21], which has become a method of choice because of its ability to perform more in-depth data analysis and because it can examine the whole genome [22]. Previous studies have used RNA-Seq analysis to obtain precise transcriptome information under abiotic stresses [23,24], and demonstrated some mechanisms of response to drought in species such as soybean (Glycine max) [25], chickpea (Cicer arietinum) [26], lentil (Lens culinaris) [27] and wheat (Triticum aestivum) [28]. However, data on the mechanisms of response of tiger nut (Cyperus esculentus) to drought stress remain scant. Here, we assessed physiological indicators such as MDA, H2O2, O2, El and ROS activities (including SOD, POD, CAT and APX) to define the suitable time for analysis, and then employed RNA-Seq analysis to evaluate the mechanisms adopted by the tiger nuts in responding to drought.

2. Materials and Methods

2.1. Plant Materials and Treatments

The “Jisha 1” plant material was provided by the Economic Botany Institute of Jilin Academy of Agricultural Sciences. Plump seeds were sterilized with 10% NaClO for 5 min and rinsed with distilled water five times. Then, the seeds were placed in a 30 °C incubator without light for five days for cultivation. The consistent growth sprouts were selected as plant materials for further experiments. A 15% PEG concentration (the solvent was distilled water) was used to simulate drought stress (D), while distilled water treatment was set as control treatment (CK) [29]. The samples were collected after 0 h, 3 h, 6 h, 12 h, 24 h and 48 h of treatment, respectively. Ten sprouts in the same treatment were deemed as an experimental unit. The experiments were replicated five times.

2.2. Analysis of Physiological Indicators

Samples of 0.5 g of fresh roots were used to test the trends of the physiological indicators, which were associated with abiotic stress in plants. Electrolyte leakage (El) of samples was tested using the methods of Sutinen [30], while the malondialdehyde (MDA) of each sample was measured using the ELISA Kit (M0106, Michy, Suzhou, China) following the manufacturer’s instructions; Hydrogen peroxide (H2O2) concentration was tested using ELISA Kit (M0107, Michy, Suzhou, China) following the manufacturer’s instructions [31]; and superoxide anion (O2) was measured using ELISA Kit (M0114, Michy, Suzhou, China) following the manufacturer’s instructions. All of these physiological indicators had five replicates.
In addition, 0.5 g fresh roots samples were used to test the trends of the activities in the ROS system. The activities of POD, SOD, CAT and APX were extracted by ELISA Kits. The activities of POD were determined using ELISA Kit (M0105, Michy, Suzhou, China) following the manufacturer’s instructions; the activities of SOD were tested using ELISA Kit (M0101, Michy, Suzhou, China) following the manufacturer’s instructions; the activities of CAT were measured using ELISA Kit (M0103, Michy, Suzhou, China) following the manufacturer’s instructions; and the activities of APX were determined using ELISA Kit (M0403, Michy, Suzhou, China) following the manufacturer’s instructions. The activities of these enzymes were analyzed in five replicates while the data of the activities were read by a microplate reader (SpectraMax® 190, Molecular Devices, Los Angeles, CA, USA).

2.3. RNA-Seq Analysis

The tender roots at the bud stage under two treatments for 12 h were used as samples for RNA-Seq analysis, and each treatment had three biological replicates. These samples were rapidly frozen in liquid nitrogen. And then RNA was extracted by RNApure Plant Kit (CW0559, CWBIO, Beijing, China) following the manufacturer’s instructions. The RNA was measured in 1% agarose gel electrophoresis and NanoDrop instrumentation (OneC, Thermo, Waltham, MA, USA) using the methods of Zhang [20], which determined whether the quality of the RNA was qualified. The qualified RNA of these samples underwent RNA-Seq by Bio-maker (Beijing, China), while those with no reference genome were analyzed by Biocloud (https://international.biocloud.net/, accessed on 1 January 2022). UniGene was analyzed by Trinity software [32], while the differentially expressed genes (DEGs) were assessed by DESeq2 software [33]. In addition, Gene Ontology (GO) and Kyoto Encyclopedia of Genes and Genomes (KEGG) databases were used for gene and pathway enrichment analyses [34].

2.4. QRT-PCR Analysis

The extracted RNA in RNA-Seq was also used to synthesize single-strand cDNA using Evo M-MLV RT Premix for qPCR (AG11706, Accurate Biology, Hunan, China). The qRT-PCR was performed in a Light Cycler 480II system (Roche, Roche Diagnostics, Basel, Switzerland) using Hieff UNICON® Universal Blue qPCR SYBR Green Master Mix (11184E, Yeasen, Shanghai, China). The reversed transcription products were diluted 10-fold and then used for qRT-PCR in a 20 µL reaction volume. While the qRT-PCR conditions were used according to the manufacturer’s instructions (Table S1). Primers for DEGs were designed by the NCBI database, and CeUCE2 was used as reference for the qRT-PCR [34] analysis (Table S2). The relative expression levels of the selected DEGs were calculated with biological and technological replicates, using the 2−ΔCt method [17].

2.5. Validation of the Physiological Indicators in Enriched Pathways

The ABA content was determined by HPLC-MS/MS (AB SCIEX, shimadzuLc-20AD and AB5500, Framingham, MA, USA) at the Quality Inspection Center (Dalian, China) [35]. The physiological indicators (such as starch, sucrose and lignin) [36] and the enzyme activities [37] in the enriched pathways were compared between the control and stress treatment groups and were determined by ELISA Kit (Michy, Suzhou, China) with five replicates and a microplate reader. Data were analyzed using SPSS19.0 (Armonk, NY, USA), and a p < 0.05 was used to demonstrate statistical significance.

3. Results

3.1. The Physiological Trends under Stress

The roots of tiger nuts at the bud stage under control (CK) and drought stress were analyzed for the 0 h, 3 h, 6 h, 12 h, 24 h and 48 h time points. The membrane lipid peroxidation indicators such as El, MDA, H2O2 and O2 were tested for stress trends. The results showed that the four indicators had increased significantly under drought stress compared with CK between 3 h and 12 h, but growth slowed after 12 h (Figure 1A–D). These findings illustrated that 12 h was the optimum time point to harvest and analyze the mechanisms of stress response by the plants.
In addition, we determined the four enzymatic activities in the ROS (including SOD, POD, CAT and APX) at the defined sampling time points. The assessment of the activities of SOD, POD, CAT and APX showed that drought stress significantly increased the enzymes’ activities compared with CK, and the increment slowed after 12 h (Figure 2A–D). These findings were in sync with the indicators in membrane lipid peroxidation, thus demonstrating that 12 h is an optimum sampling time point for studying the mechanisms of response to drought stress.

3.2. RNA-Seq Analysis

There were 5.74 Gb of RNA-Seq data in each sample, while Q20 was more than 97.91% and Q30 was more than 94.04% (Table S3). The quality of the RNA-Seq data was confirmed and then used for further analysis. The data were uploaded in National Centre for Biotechnology Information (NCBI) database, with the accession number PRJNA821655 (Table S4).
The UniGene dataset was used as a reference for further analyses while the DEGs were assessed by DESeq2 (Table 1). Out of the total DEGs, 854 DEGs were upregulated, while 906 were downregulated (Figure 3).

3.3. Enrichment Analysis

These DEGs underwent GO and KEGG enrichment analysis. In the GO enrichment analysis, the DEGs were enriched in three classes (Figure 4A). The q-value of 55 GO terms was less than 0.05, which were the significantly enriched terms, while four terms were associated with their response to ABA. These included the cellular response to abscisic acid stimulus (GO:0071215), the response to abscisic acid (GO:0009737), the cellular response to hormone stimulus (GO:0032870) and the abscisic-acid-activated signaling pathway (GO:0009738). The GO analysis demonstrated that ABA participates in responding to stress. On the other hand, the KEGG enrichment analysis showed that there was significant enrichment of DEGs in four KEGG pathways (q-value < 0.05), which included ribosome (ko03010), starch and sucrose metabolism (ko00500), phenylpropanoid biosynthesis (ko00940) as well as plant hormone signal transduction (ko04075) (Figure 4B). These pathways might be mediating the responses to drought stress.

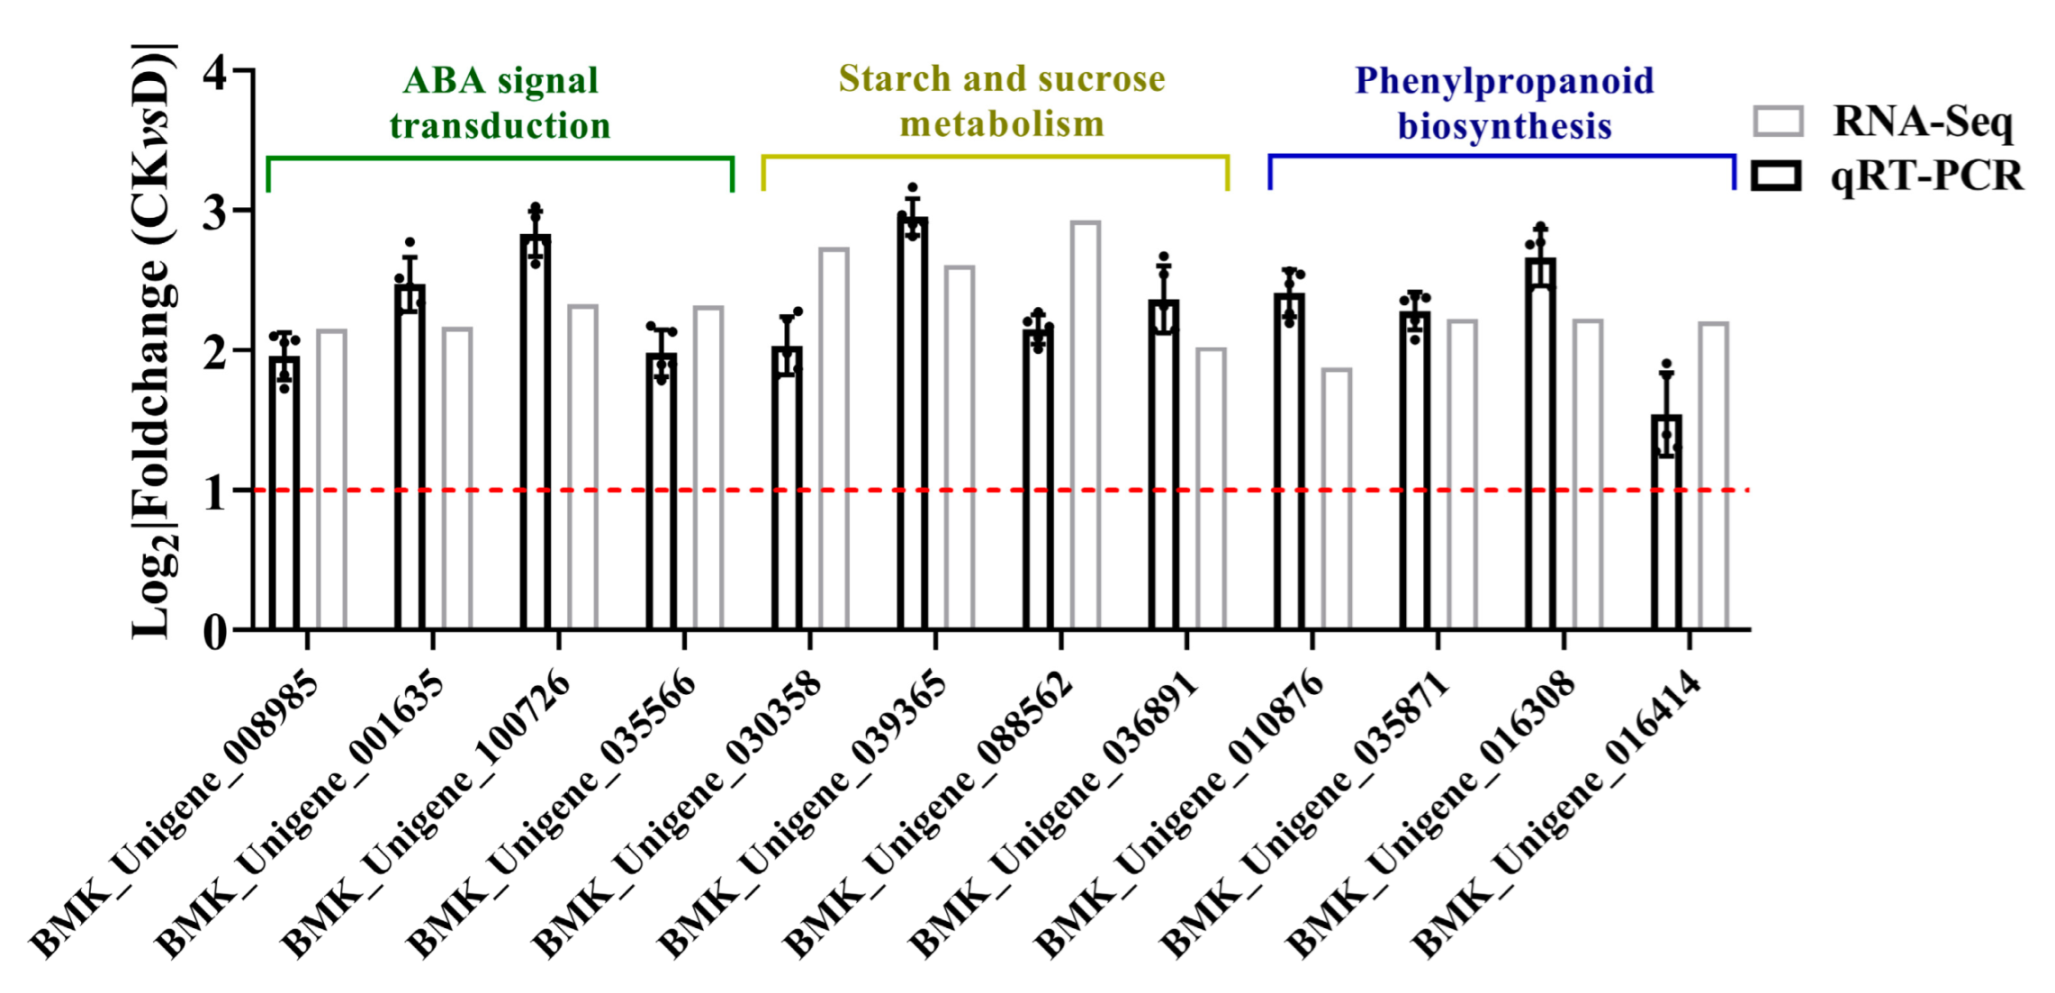
3.4. QRT-PCR Analysis

Twelve DEGs were selected for qRT-PCR analysis. The data showed that three parts of four DEGs were involved in three enriched pathways, including ABA signal transduction, starch and sucrose metabolism and phenylpropanoid biosynthesis. The qRT-PCR results showed differences in the expression compared with the RNA-Seq findings, while the trends in CK and drought stress were similar (Figure 5).

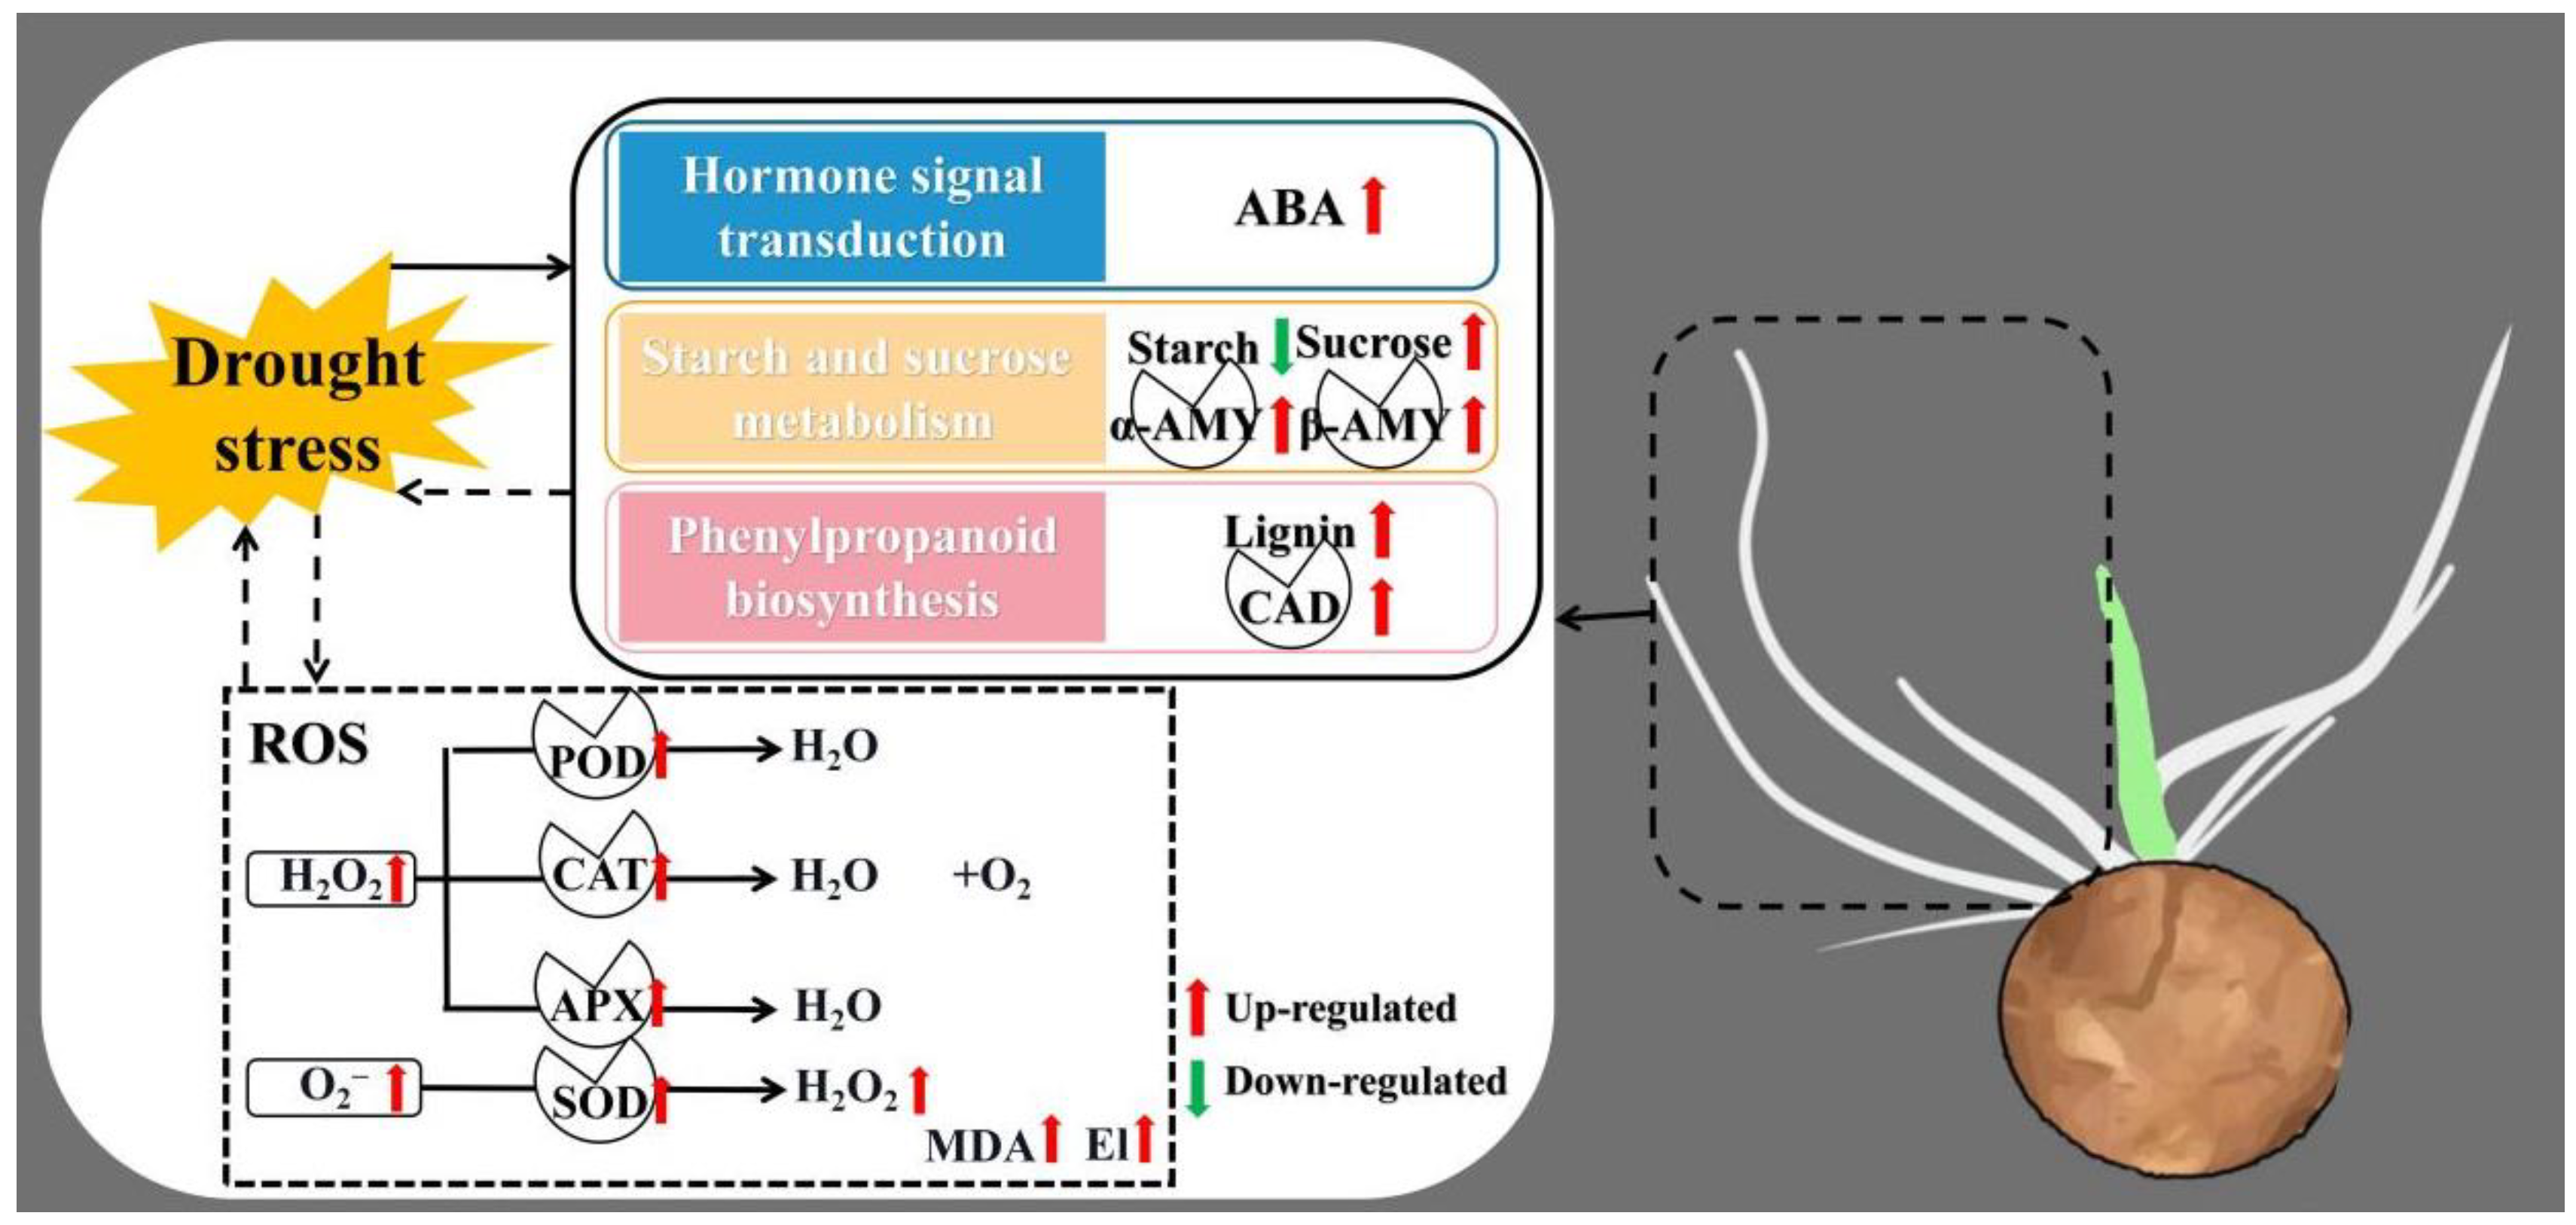
3.5. Enriched Pathways Analysis

The plant hormone signal transduction pathway (ko04075) was enriched in both the GO and KEGG analyses. Similarly, the ABA channel was also enriched (Figure 6A), together with the DEGs as shown in Figure 6B. In addition, the data showed that the ABA content had increased significantly (p < 0.05) under drought stress (Figure 6C), which showed that the ABA-specific pathway was enriched in response to stress.
KEGG analysis showed that the starch and sucrose metabolism pathway (ko00500) was also enriched (Figure 7A). The expression of DEGs in the ko00500 pathway was significantly changed (Figure 7B). In addition, there was an increase in the sucrose content while the starch content was suppressed with the increasing activities significantly (p < 0.05) of alpha-amylase and beta-amylase (Figure 7C–F). Therefore, these results revealed that the starch and sucrose metabolism pathway was involved in responses to drought stress.
In addition, there was enrichment in phenylpropanoid biosynthesis pathway (ko00940) (Figure 8A), and the expression of DEGs in the ko00500 pathway had significant changes (Figure 8B). Similarly, lignin content had increased significantly (p < 0.05) and there were significant shifts (p < 0.05) in the activities of cinnamyl-alcohol dehydrogenase (CAD) (Figure 8C,D). These results revealed that phenylpropanoid biosynthesis was one of the pathways that mediates responses to stress.

4. Discussion

The bud stage is the most sensitive stage in plants under abiotic stresses, which could affect growth in later stages [38]. Drought stress limits the growth, development and survival rate of plants, leading to tremendous losses in yield, thus threatening global agricultural production [39]. In our study, 15% PEG was used to simulate drought stress [29,40,41,42]. Therefore, the analysis of the response of sprouts to drought stress at the bud stage is important for actual agricultural production [43]. Previous studies have shown that roots can be used to study responses to drought stress in common bean (Phaseolus vulgaris) [44], rice (Oryza sativa) [45], soybean (Glycine max) [46] and peanut (Arachis hypogaea) [47]. In this study, 15% PEG was used to simulate the drought stress and roots of the tiger nuts were used as sample tissues, as previously described [48,49].
Drought-exposed plants exert different mechanisms to regulate the responses to stress [39]. A 12 h duration under drought stress has been shown to be an optimal sampling time to study stress responses [50]. Exposing plants to stress for a short time does not cause changes in the phenotype, but physiological indicators might change significantly [51]. El is an indicator which reflects the state of a plant’s membrane system [52]. El increases when plants are subjected to stress or other damaging stimuli [53]. The El was shown to increase under drought stress, but the rate of increase after 12 h was not significant. MDA content is a parameter which reflects antioxidant potential, and indirectly reflects the degree of tissue peroxidative damage [54]. There was significant increase in the MDA content under stress before 12 h, which was not observed after the 12 h time point. In addition, H2O2 and O2 reflect the plant’s resilience under stress [55]. Our study showed that 12 h of exposure to stress increased the levels of H2O2 and O2. On the other hand, the ROS system plays a dual role in the growth and development of plants [56], and enzyme activities directly reflect ROS in plants. In this study, the POD, SOD, CAT and APX activities increased more within 12 h of exposure. In line with previous data, these data revealed that 12 h was a suitable sampling time to study the mechanisms involved in responding to drought stress in tiger nuts [50,57,58].
There are many mechanisms involved in responding to abiotic stress, especially drought stress, in plants [59]. Drought stress induces ABA accumulation and triggers rapid biochemical and physiological responses [60]. The ABA pathway is a well-established pathway which has been shown to respond to drought stress [61]. In this study, DEGs were enriched in ABA-associated pathways in the GO and KEGG analyses, while the ABA content changed under drought stress, which demonstrated that ABA-associated pathways participate in responding to drought stress in tiger nuts. The starch and sucrose metabolism pathway is closely associated with ABA accumulation [62,63,64], which was also associated with responses to drought stress [36]. Starch is made in chloroplasts in leaves which the content decreased under drought stress [65], while sucrose is produced in leaves following photosynthesis, which the content increased to balance osmotic pressure within plant cells under drought stress [64]. Also in this study, the starch and sucrose metabolism pathway was an enriched pathway in the KEGG analysis, which showed an increase in the sucrose content with changes in amylase activities (α and β amylase), while the content of starch was reduced. This could be because the starch was converted to sugar, which increased osmotic pressure in responding to stress. In addition, lignin was recognized as having an important role in drought resistance [66] while the CAD enzyme was used to characterize drought tolerance [67]. Here, the phenylpropanoid biosynthesis (ko00940), as a stress-resistant pathway [68], was enriched in the KEGG analysis, while the contents of lignin and CAD activities were significantly changed (Figure 9). In addition, the three pathways have been reported to participate in responding to abiotic stress in Hibiscus cannabinus, Miscanthus and tomato (Solanum lycopersicum) [69,70,71]. Our study demonstrated the mechanisms underlying the drought stress responses by tiger nuts, which enhances drought tolerance.

5. Conclusions

Our analyses showed that 12 h was a suitable sampling time for tiger nuts when studying stress responses. A comparative analysis of the RNA-Seq data under drought stress showed a total of 1760 DEGs, where 854 genes were upregulated while 906 genes were suppressed. These DEGs were enriched in ABA-associated terms in the GO analysis, while the starch and sucrose metabolism (ko00500), phenylpropanoid biosynthesis (ko00940) and plant hormone signal transduction (ko04075) pathways were significantly enriched in the KEGG analysis. Taken together, our data revealed the mechanisms that underly the responses exerted by tiger nuts to drought stress.

Supplementary Materials

The following supporting information can be downloaded at: https://www.mdpi.com/article/10.3390/life12071051/s1, Table S1: The qRT-PCR program used in this study; Table S2: QRT-PCR primers for differentially expressed genes (DEGs); Table S3: The quality analysis of the RNA-Seq data; Table S4: The RNA-Seq data in National Centre for Biotechnology Information (NCBI) database.

Author Contributions

Z.M. and Z.W.: methodology, data curation and writing—original draft; J.L. and Y.C.: data curation; H.Y., Y.G., X.Y. and J.Z.: conceptualization and methodology; Y.S. and C.L.: software; S.W. and K.L.: formal analysis and preparation of materials; J.D. and Q.Z.: conceptualization, data curation and funding acquisition. All authors have read and agreed to the published version of the manuscript.

Funding

This study was financially supported by the National Key Research and Development Program of China (2019YFD1002603); the Jilin Province Major Science and Technology Project (20200505004NC); and the Jilin Province Innovation Platform (Base) and Talent Project (20210506014ZP).

Institutional Review Board Statement

Not applicable.

Informed Consent Statement

Not applicable.

Data Availability Statement

All data are contained within the article.

Conflicts of Interest

The authors declare no conflict of interest.

References

  1. Yang, X.; Niu, L.; Zhang, Y.; Ren, W.; Yang, C.; Yang, J.; Xing, G.; Zhong, X.; Zhang, J.; Slaski, J.; et al. Morpho-Agronomic and Biochemical Characterization of Accessions of Tiger Nut (Cyperus esculentus) Grown in the North Temperate Zone of China. Plants 2022, 11, 923. [Google Scholar] [CrossRef] [PubMed]
  2. De Castro, O.; Gargiulo, R.; Del Guacchio, E.; Caputo, P.; De Luca, P. A molecular survey concerning the origin of Cyperus esculentus (Cyperaceae, Poales): Two sides of the same coin (weed vs. crop). Ann. Bot. 2015, 115, 733–745. [Google Scholar] [CrossRef] [PubMed] [Green Version]
  3. Zohari, D. The origin and early spread of agriculture in the Old World. In Developments in Agricultural and Managed Forest Ecology; Elsevier: Amsterdam, The Netherlands, 1986; Volume 16, pp. 3–20. [Google Scholar]
  4. Maduka, N.; Ire, F. Tigernut plant and useful application of tigernut tubers (Cyperus esculentus)—A review. Curr. J. Appl. Sci. Technol 2018, 29, 1–23. [Google Scholar] [CrossRef]
  5. Bado, S.; Bazongo, P.; Son, G.; Kyaw, M.T.; Forster, B.P.; Nielen, S.; Lykke, A.M.; Ouédraogo, A.; Bassolé, I.H. Physicochemical Characteristics and Composition of Three Morphotypes of Cyperus esculentus Tubers and Tuber Oils. J. Anal. Methods Chem. 2015, 2015, 673547. [Google Scholar] [CrossRef] [Green Version]
  6. Adekanmi, O.K.; Oluwatooyin, O.F.; Yemisi, A.A.; Yemisi, A. Influence of processing techniques on the nutrients and antinutrients of tigernut (Cyperus esculentus L.). World J. Dairy Food Sci. 2009, 4, 88–93. [Google Scholar]
  7. Chukwuma, E.R.; Obioma, N.; Christopher, O.I. The phytochemical composition and some biochemical effects of Nigerian tigernut (Cyperus esculentus L.) tuber. Pak. J. Nutr. 2010, 9, 709–715. [Google Scholar] [CrossRef] [Green Version]
  8. Adejuyitan, J. Tigernut processing: Its food uses and health benefits. Am. J. Food Technol. 2011, 6, 197–201. [Google Scholar] [CrossRef] [Green Version]
  9. Defelice, M.S.W.T. Yellow Nutsedge Cyperus esculentus L.—Snack Food of the Gods1. Weed Technol. 2002, 16, 901–907. [Google Scholar] [CrossRef]
  10. Yu, Y.; Lu, X.; Zhang, T.; Zhao, C.; Guan, S.; Pu, Y.; Gao, F. Tiger Nut (Cyperus esculentus L.): Nutrition, Processing, Function and Applications. Foods 2022, 11, 601. [Google Scholar] [CrossRef]
  11. Chourasiya, D.; Agnihotri, R.; Prakash, A.; Pal, K.K.; Sharma, M.P. Bioprotection of Soybean Plants from Drought Stress by Application of Bacterial and Fungal Endophytes. In Root Biology; Springer: Berlin/Heidelberg, Germany, 2018; pp. 281–301. [Google Scholar]
  12. Dubey, A.; Kumar, A.; Malla, M.A.; Chowdhary, K.; Singh, G.; Gudasalamani Ravikanth, H.; Sharma, S.; Saati-Santamaria, Z.; Menéndez, E.; Dames, J.F. Approaches for the amelioration of adverse effects of drought stress on crop plants. Front. Biosci. 2021, 26, 928–947. [Google Scholar]
  13. Ahmad, P.; Hameed, A.; Abd-Allah, E.F.; Sheikh, S.A.; Wani, M.R.; Rasool, S.; Jamsheed, S.; Kumar, A. Biochemical and molecular approaches for drought tolerance in plants. In Physiological Mechanisms and Adaptation Strategies in Plants under Changing Environment; Springer: Berlin/Heidelberg, Germany, 2014; pp. 1–29. [Google Scholar]
  14. Hashem, A.; Kumar, A.; Al-Dbass, A.M.; Alqarawi, A.A.; Al-Arjani, A.-B.F.; Singh, G.; Farooq, M.; Abd_Allah, E.F. Arbuscular mycorrhizal fungi and biochar improves drought tolerance in chickpea. Saudi J. Biol. Sci. 2019, 26, 614–624. [Google Scholar] [CrossRef] [PubMed]
  15. Dubey, A.; Kumar, A.; Khan, M.L. Role of biostimulants for enhancing abiotic stress tolerance in Fabaceae plants. In The Plant Family Fabaceae; Springer: Berlin/Heidelberg, Germany, 2020; pp. 223–236. [Google Scholar]
  16. Goswami, A.; Banerjee, R.; Raha, S. Drought resistance in rice seedlings conferred by seed priming. Protoplasma 2013, 250, 1115–1129. [Google Scholar] [CrossRef] [PubMed]
  17. Zhang, Q.; Geng, J.; Du, Y.; Zhao, Q.; Zhang, W.; Fang, Q.; Yin, Z.; Li, J.; Yuan, X.; Fan, Y. Heat shock transcription factor (Hsf) gene family in common bean (Phaseolus vulgaris): Genome-wide identification, phylogeny, evolutionary expansion and expression analyses at the sprout stage under abiotic stress. BMC Plant Biol. 2022, 22, 33. [Google Scholar] [CrossRef] [PubMed]
  18. Osakabe, Y.; Yamaguchi-Shinozaki, K.; Shinozaki, K.; Tran, L.S.P. ABA control of plant macroelement membrane transport systems in response to water deficit and high salinity. New Phytol. 2014, 202, 35–49. [Google Scholar] [CrossRef] [PubMed]
  19. Ali, F.; Bano, A.; Fazal, A. Recent methods of drought stress tolerance in plants. Plant Growth Regul. 2017, 82, 363–375. [Google Scholar] [CrossRef]
  20. Zhang, Q.; Li, M.; Xia, C.Y.; Zhang, W.J.; Yin, Z.G.; Zhang, Y.L.; Fang, Q.X.; Liu, Y.C.; Zhang, M.Y.; Zhang, W.H. Transcriptome-based analysis of salt-related genes during the sprout stage of common bean (Phaseolus vulgaris) under salt stress conditions. Biotechnol. Biotechnol. Equip. 2021, 35, 1086–1098. [Google Scholar] [CrossRef]
  21. Bashir, K.; Matsui, A.; Rasheed, S.; Seki, M. Recent advances in the characterization of plant transcriptomes in response to drought, salinity, heat, and cold stress. F1000Research 2019, 8, 658. [Google Scholar] [CrossRef] [Green Version]
  22. Hanada, K.; Higuchi-Takeuchi, M.; Okamoto, M.; Yoshizumi, T.; Shimizu, M.; Nakaminami, K.; Nishi, R.; Ohashi, C.; Iida, K.; Tanaka, M. Small open reading frames associated with morphogenesis are hidden in plant genomes. Proc. Natl. Acad. Sci. USA 2013, 110, 2395–2400. [Google Scholar] [CrossRef] [Green Version]
  23. Klepikova, A.V.; Kasianov, A.S.; Gerasimov, E.S.; Logacheva, M.D.; Penin, A.A. A high resolution map of the Arabidopsis thaliana developmental transcriptome based on RNA-seq profiling. Plant J. 2016, 88, 1058–1070. [Google Scholar] [CrossRef]
  24. Krizek, B.A.; Bequette, C.J.; Xu, K.; Blakley, I.C.; Fu, Z.Q.; Stratmann, J.W.; Loraine, A.E. RNA-Seq links the transcription factors AINTEGUMENTA and AINTEGUMENTA-LIKE6 to cell wall remodeling and plant defense pathways. Plant Physiol. 2016, 171, 2069–2084. [Google Scholar] [CrossRef] [Green Version]
  25. Song, L.; Pan, Z.; Chen, L.; Dai, Y.; Wan, J.; Ye, H.; Nguyen, H.T.; Zhang, G.; Chen, H. Analysis of whole transcriptome RNA-seq data reveals many alternative splicing events in soybean roots under drought stress conditions. Genes 2020, 11, 1520. [Google Scholar] [CrossRef]
  26. Mahdavi Mashaki, K.; Garg, V.; Nasrollahnezhad Ghomi, A.A.; Kudapa, H.; Chitikineni, A.; Zaynali Nezhad, K.; Yamchi, A.; Soltanloo, H.; Varshney, R.K.; Thudi, M. RNA-Seq analysis revealed genes associated with drought stress response in kabuli chickpea (Cicer arietinum L.). PLoS ONE 2018, 13, e0199774. [Google Scholar] [CrossRef] [PubMed] [Green Version]
  27. Morgil, H.; Tardu, M.; Cevahir, G.; Kavakli, İ.H. Comparative RNA-seq analysis of the drought-sensitive lentil (Lens culinaris) root and leaf under short-and long-term water deficits. Funct. Integr. Genom. 2019, 19, 715–727. [Google Scholar] [CrossRef] [PubMed]
  28. Chu, C.; Wang, S.; Paetzold, L.; Wang, Z.; Hui, K.; Rudd, J.C.; Xue, Q.; Ibrahim, A.M.; Metz, R.; Johnson, C.D. RNA-seq analysis reveals different drought tolerance mechanisms in two broadly adapted wheat cultivars ‘TAM 111’ and ‘TAM 112’. Sci. Rep. 2021, 11, 4301. [Google Scholar] [CrossRef] [PubMed]
  29. Rezayian, M.; Niknam, V.; Ebrahimzadeh, H. Penconazole and calcium ameliorate drought stress in canola by upregulating the antioxidative enzymes. Funct. Plant Biol. 2020, 47, 825–839. [Google Scholar] [CrossRef] [PubMed]
  30. Sutinen, M.L.; Palta, J.P.; Reich, P.B. Seasonal differences in freezing stress resistance of needles of Pinus nigra and Pinus resinosa: Evaluation of the electrolyte leakage method. Tree Physiol. 1992, 11, 241–254. [Google Scholar] [CrossRef] [Green Version]
  31. Mukherjee, S.P.; Choudhuri, M.A. Implications of water stress-induced changes in the levels of endogenous ascorbic acid and hydrogen peroxide in Vigna seedlings. Physiol. Plant. 1983, 58, 166–170. [Google Scholar] [CrossRef]
  32. Grabherr, M.G.; Haas, B.J.; Yassour, M.; Levin, J.Z.; Thompson, D.A.; Amit, I.; Adiconis, X.; Fan, L.; Raychowdhury, R.; Zeng, Q. Full-length transcriptome assembly from RNA-Seq data without a reference genome. Nat. Biotechnol. 2011, 29, 644–652. [Google Scholar] [CrossRef] [Green Version]
  33. Love, M.I.; Huber, W.; Anders, S. Moderated estimation of fold change and dispersion for RNA-seq data with DESeq2. Genome Biol. 2014, 15, 550. [Google Scholar] [CrossRef] [Green Version]
  34. Gene Ontology Consortium. Gene Ontology Consortium: Going forward. Nucleic Acids Res. 2015, 43, D1049–D1056. [Google Scholar] [CrossRef]
  35. Zhang, Q.; Zhang, W.-J.; Yin, Z.-G.; Li, W.-J.; Xia, C.-Y.; Sun, H.-Y.; Yang, Y.-M.; Wu, H.-B.; Zhang, S.; Zhao, H.-H. Genome-wide identification reveals the potential functions of the bZIP gene family in common bean (Phaseolus vulgaris) in response to salt stress during the sprouting stage. J. Plant Growth Regul. 2021, 1–16. [Google Scholar] [CrossRef]
  36. Du, Y.; Zhao, Q.; Chen, L.; Yao, X.; Zhang, H.; Wu, J.; Xie, F. Effect of Drought Stress during Soybean R2-R6 Growth Stages on Sucrose Metabolism in Leaf and Seed. Int. J. Mol. Sci. 2020, 21, 618. [Google Scholar] [CrossRef] [PubMed] [Green Version]
  37. Goffner, D.; Joffroy, I.; Grima-Pettenati, J.; Halpin, C.; Knight, M.E.; Schuch, W.; Boudet, A.M. Purification and characterization of isoforms of cinnamyl alcohol dehydrogenase from Eucalyptus xylem. Planta 1992, 188, 48–53. [Google Scholar] [CrossRef]
  38. Ma, Q.; Wu, C.; Liang, S.; Yuan, Y.; Liu, C.; Liu, J.; Feng, B. The alkali tolerance of broomcorn millet (Panicum miliaceum L.) at the germination and seedling stage: The case of 296 broomcorn millet genotypes. Front. Plant Sci. 2021, 12, 711429. [Google Scholar] [CrossRef] [PubMed]
  39. Ji, Y.; Lu, X.; Zhang, H.; Luo, D.; Zhang, A.; Sun, M.; Wu, Q.; Wang, X.; Huang, L. Transcriptome Reveals the Dynamic Response Mechanism of Pearl Millet Roots under Drought Stress. Genes 2021, 12, 1988. [Google Scholar] [CrossRef]
  40. Ahmad, A.; Aslam, Z.; Naz, M.; Hussain, S.; Javed, T.; Aslam, S.; Raza, A.; Ali, H.M.; Siddiqui, M.H.; Salem, M.Z. Exogenous salicylic acid-induced drought stress tolerance in wheat (Triticum aestivum L.) grown under hydroponic culture. PLoS ONE 2021, 16, e0260556. [Google Scholar] [CrossRef] [PubMed]
  41. Fan, R.; Su, X.; Guo, Y.; Sun, F.; Qu, Y.; Chen, Q. Cotton seedling drought tolerance is improved via salt preconditioning. Protoplasma 2021, 258, 263–277. [Google Scholar] [CrossRef]
  42. Jones, C.; De Vega, J.; Worthington, M.; Thomas, A.; Gasior, D.; Harper, J.; Doonan, J.; Fu, Y.; Bosch, M.; Corke, F. A comparison of differential gene expression in response to the onset of water stress between three hybrid Brachiaria genotypes. Front. Plant Sci. 2021, 12, 393. [Google Scholar] [CrossRef]
  43. Ishibashi, Y.; Yuasa, T.; Iwaya-Inoue, M. Mechanisms of maturation and germination in crop seeds exposed to environmental stresses with a focus on nutrients, water status, and reactive oxygen species. Adv. Exp. Med. Biol. 2018, 1081, 233–257. [Google Scholar]
  44. Wu, L.; Chang, Y.; Wang, L.; Wu, J.; Wang, S. Genetic dissection of drought resistance based on root traits at the bud stage in common bean. TAG Theor. Appl. Genet. Theor. Angew. Genet. 2021, 134, 1047–1061. [Google Scholar] [CrossRef]
  45. Kim, Y.; Chung, Y.S.; Lee, E.; Tripathi, P.; Heo, S.; Kim, K.-H. Root response to drought stress in rice (Oryza sativa L.). Int. J. Mol. Sci. 2020, 21, 1513. [Google Scholar] [CrossRef] [Green Version]
  46. Dubey, A.; Saiyam, D.; Kumar, A.; Hashem, A.; Abd_Allah, E.F.; Khan, M.L. Bacterial root endophytes: Characterization of their competence and plant growth promotion in soybean (Glycine max (L.) Merr.) under drought stress. Int. J. Environ. Res. Public Health 2021, 18, 931. [Google Scholar] [CrossRef] [PubMed]
  47. Jiang, C.; Li, X.; Zou, J.; Ren, J.; Jin, C.; Zhang, H.; Yu, H.; Jin, H. Comparative transcriptome analysis of genes involved in the drought stress response of two peanut (Arachis hypogaea L.) varieties. BMC Plant Biol. 2021, 21, 64. [Google Scholar] [CrossRef]
  48. Chakhchar, A.; Chaguer, N.; Ferradous, A.; Filali-Maltouf, A.; El Modafar, C. Root system response in Argania spinosa plants under drought stress and recovery. Plant Signal. Behav. 2018, 13, e1489669. [Google Scholar] [CrossRef] [Green Version]
  49. Siddiqui, M.N.; Léon, J.; Naz, A.A.; Ballvora, A. Genetics and genomics of root system variation in adaptation to drought stress in cereal crops. J. Exp. Bot. 2021, 72, 1007–1019. [Google Scholar] [CrossRef] [PubMed]
  50. Dev Sharma, A.; Kumar, S.; Singh, P. Expression analysis of a stress-modulated transcript in drought tolerant and susceptible cultivars of sorghum (Sorghum bicolor). J. Plant Physiol. 2006, 163, 570–576. [Google Scholar] [CrossRef] [PubMed]
  51. Xu, J.; Qiao, X.; Tian, Z.; Zhang, X.; Zou, X.; Cheng, Y.; Lu, G.; Zeng, L.; Fu, G.; Ding, X.; et al. Proteomic Analysis of Rapeseed Root Response to Waterlogging Stress. Plants 2018, 7, 71. [Google Scholar] [CrossRef] [Green Version]
  52. Song, H.; Huang, Y.; Gu, B. QTL-Seq identifies quantitative trait loci of relative electrical conductivity associated with heat tolerance in bottle gourd (Lagenaria siceraria). PLoS ONE 2020, 15, e0227663. [Google Scholar] [CrossRef]
  53. Guo, Y.; Zhao, S.; Zhu, C.; Chang, X.; Yue, C.; Wang, Z.; Lin, Y.; Lai, Z. Identification of drought-responsive miRNAs and physiological characterization of tea plant (Camellia sinensis L.) under drought stress. BMC Plant Biol. 2017, 17, 211. [Google Scholar] [CrossRef] [Green Version]
  54. Hamurcu, M.; Khan, M.K.; Pandey, A.; Ozdemir, C.; Avsaroglu, Z.Z.; Elbasan, F.; Omay, A.H.; Gezgin, S. Nitric oxide regulates watermelon (Citrullus lanatus) responses to drought stress. 3 Biotech 2020, 10, 494. [Google Scholar] [CrossRef]
  55. Mubarakshina, M.M.; Ivanov, B.N.; Naydov, I.A.; Hillier, W.; Badger, M.R.; Krieger-Liszkay, A. Production and diffusion of chloroplastic H2O2 and its implication to signalling. J. Exp. Bot. 2010, 61, 3577–3587. [Google Scholar] [CrossRef] [PubMed] [Green Version]
  56. Mittler, R. ROS Are Good. Trends Plant Sci. 2016, 22, 11–19. [Google Scholar] [CrossRef] [PubMed] [Green Version]
  57. Ashwini, N.; Sajeevan, R.S.; Udayakumar, M.; Nataraja, K.N. Identification of splice variant of OsGBF1 in Oryza sativa ssp. indica genotypes under salinity stress. 3 Biotech 2018, 8, 345. [Google Scholar] [CrossRef] [PubMed]
  58. Dos Reis, M.V.; Rouhana, L.V.; Sadeque, A.; Koga, L.; Clough, S.J.; Calla, B.; Paiva, P.D.O.; Korban, S.S. Genome-wide expression of low temperature response genes in Rosa hybrida L. Plant Physiol. Biochem. PPB 2020, 146, 238–248. [Google Scholar] [CrossRef] [PubMed]
  59. Ozturk, M.; Turkyilmaz Unal, B.; García-Caparrós, P.; Khursheed, A.; Gul, A.; Hasanuzzaman, M. Osmoregulation and its actions during the drought stress in plants. Physiol. Plant. 2021, 172, 1321–1335. [Google Scholar] [CrossRef]
  60. Ng, L.M.; Melcher, K.; Teh, B.T.; Xu, H.E. Abscisic acid perception and signaling: Structural mechanisms and applications. Acta Pharmacol. Sin. 2014, 35, 567–584. [Google Scholar] [CrossRef] [Green Version]
  61. Long, H.; Zheng, Z.; Zhang, Y.; Xing, P.; Wan, X.; Zheng, Y.; Li, L. An abscisic acid (ABA) homeostasis regulated by its production, catabolism and transport in peanut leaves in response to drought stress. PLoS ONE 2019, 14, e0213963. [Google Scholar] [CrossRef] [Green Version]
  62. Li, J.; Seng, S.; Li, D.; Zhang, F.; Liu, Y.; Yao, T.; Liang, J.; Yi, M.; Wu, J. Antagonism between abscisic acid and gibberellin regulates starch synthesis and corm development in Gladiolus hybridus. Hortic. Res. 2021, 8, 155. [Google Scholar] [CrossRef]
  63. Lv, X.; Ding, Y.; Long, M.; Liang, W.; Gu, X.; Liu, Y.; Wen, X. Effect of Foliar Application of Various Nitrogen Forms on Starch Accumulation and Grain Filling of Wheat (Triticum aestivum L.) Under Drought Stress. Front. Plant Sci. 2021, 12, 645379. [Google Scholar] [CrossRef]
  64. Mathan, J.; Singh, A.; Ranjan, A. Sucrose transport in response to drought and salt stress involves ABA-mediated induction of OsSWEET13 and OsSWEET15 in rice. Physiol. Plant. 2021, 171, 620–637. [Google Scholar] [CrossRef]
  65. Guo, J.; Qu, L.; Hu, Y.; Lu, W.; Lu, D. Proteomics reveals the effects of drought stress on the kernel development and starch formation of waxy maize. BMC Plant Biol. 2021, 21, 434. [Google Scholar] [CrossRef] [PubMed]
  66. Gu, H.; Wang, Y.; Xie, H.; Qiu, C.; Zhang, S.; Xiao, J.; Li, H.; Chen, L.; Li, X.; Ding, Z. Drought stress triggers proteomic changes involving lignin, flavonoids and fatty acids in tea plants. Sci. Rep. 2020, 10, 15504. [Google Scholar] [CrossRef] [PubMed]
  67. Mandoulakani, B.A.; Eyvazpour, E.; Ghadimzadeh, M. The effect of drought stress on the expression of key genes involved in the biosynthesis of phenylpropanoids and essential oil components in basil (Ocimum basilicum L.). Phytochemistry 2017, 139, 1–7. [Google Scholar] [CrossRef] [PubMed]
  68. An, X.; Jin, G.; Luo, X.; Chen, C.; Li, W.; Zhu, G. Transcriptome analysis and transcription factors responsive to drought stress in Hibiscus cannabinus. PeerJ 2020, 8, e8470. [Google Scholar] [CrossRef] [Green Version]
  69. De Vega, J.J.; Teshome, A.; Klaas, M.; Grant, J.; Finnan, J.; Barth, S. Physiological and transcriptional response to drought stress among bioenergy grass Miscanthus species. Biotechnol. Biofuels 2021, 14, 60. [Google Scholar] [CrossRef]
  70. Sharma, A.; Shahzad, B.; Rehman, A.; Bhardwaj, R.; Landi, M.; Zheng, B. Response of Phenylpropanoid Pathway and the Role of Polyphenols in Plants under Abiotic Stress. Molecules 2019, 24, 2452. [Google Scholar] [CrossRef] [Green Version]
  71. Lamin-Samu, A.T.; Farghal, M.; Ali, M.; Lu, G. Morpho-Physiological and Transcriptome Changes in Tomato Anthers of Different Developmental Stages under Drought Stress. Cells 2021, 10, 1809. [Google Scholar] [CrossRef]
Figure 1. The indicators in membrane lipid peroxidation analysis at different time points under drought stress. The grey columns with black squares represent drought stress, while white columns with black circles represent CK treatment. The different lower-case letters above the columns denote significant differences (α = 0.05, LSD). (A) The trends of electrolyte leakage (El); (B) The trends of malondialdehyde (MDA); (C) The trends of electrolyte hydrogen peroxide (H2O2); (D) The trends of superoxide anion (O2).
Life 12 01051 g001
Figure 2. The indicators in reactive oxygen species (ROS) analysis at different time points under drought stress. The grey columns with black squares represent drought stress while white columns with black circles demonstrate CK treatment. The different lower-case letters above the columns show significant differences (α = 0.05, LSD). (A) The activity profile of superoxide dismutase (SOD); (B) The activity profile of peroxidase (POD); (C) The activity profile of electrolyte catalase (CAT); (D) The activity profile of ascorbate peroxidase (APX).
Life 12 01051 g002
Figure 3. Expression plot showing RNA-Seq data. The red points show upregulated differentially expressed genes (DEGs), while the green points show downregulated DEGs.
Life 12 01051 g003
Figure 4. The GO and KEGG enrichment analysis of differentially expressed genes (DEGs) as shown by RNA-Seq analysis. (A) The GO enrichment analysis of the DEGs; the red, green and blue represent biological process, cellular component and molecular function, respectively; (B) The KEGG enrichment analysis of the DEGs, the circles from red to purple show the qvalues from low to high.
Life 12 01051 g004
Figure 5. The qRT-PCR analysis of differentially expressed genes (DEGs). The gray pillars show the RNA-Seq expression analysis while the black pillars demonstrate the qRT-PCR expression profile. The green-head DEGs were enriched in abscisic acid (ABA) signal transduction pathway, the yellow-head DEGs were enriched in starch and sucrose metabolism pathway, while the blue-head DEGs were enriched in phenypropanoid biosynthesis pathway. The log2|Foldchange (CK vs. D)| value of more than 1 was used to denote differentially expressed genes (DEGs).
Life 12 01051 g005
Figure 6. The abscisic acid (ABA) signal transduction pathway analysis in RNA-Seq. (A) Schematic diagram showing ABA signal transduction pathway; the red boxes represent upregulated modules, the green boxes represent downregulated modules, while the blue boxes represent upregulated and downregulated DEGs; (B) The expression profile of DEGs in modules enriched in pathways, the color from blue to red represent the expression from low to high; (C) The ABA content analysis under CK and drought treatments. The grey columns with black squares represent drought stress while white columns with black circles represent CK treatment. The different lower-case letters above the columns denote significant differences (α = 0.05, LSD).
Life 12 01051 g006
Figure 7. The starch and sucrose metabolism pathway analysis in RNA-Seq. The grey columns with black squares represent drought stress while white columns with black circles represent CK treatment. The different lower-case letters above the columns show significant differences (α = 0.05, LSD). (A) The schematic diagram of starch and sucrose metabolism pathway; the red boxes represent upregulated modules while green boxes represented downregulated modules, the blue boxes represent upregulated and downregulated DEGs contain; (B) The expression profile of DEGs in modules enriched in pathways, the color from blue to red represent the expression from low to high; (C) The sucrose content analysis under CK and drought treatments; (D) The starch content analysis under CK and drought treatments; (E) The activities of alpha-amylase analysis under CK and drought treatments; (F) The activities of beta-amylase analysis under CK and drought treatments.
Life 12 01051 g007
Figure 8. The phenypropanoid biosynthesis pathway analysis in RNA-Seq. The grey columns with black squares represent drought stress, while white columns with black circles represent CK treatment. The different lowercase letters above the columns show significant differences (α = 0.05, LSD). (A) Schematic diagram of phenypropanoid biosynthesis pathway, the red boxes represent upregulated modules while green boxes represented downregulated modules, the blue boxes represent upregulated and downregulated DEGs; (B) The expression profile of DEGs in modules enriched in pathways, the color from blue to red represent the expression from low to high; (C) The lignin content analysis under CK and drought treatments; (D) The activities of cinnamyl-alcohol dehydrogenase (CAD) analysis under CK and drought treatments.
Life 12 01051 g008
Figure 9. Schematic representation of the mechanisms employed by tiger nuts in response to drought stress at bud stage, where red up-arrows indicate upregulation while green arrows show downregulation.
Life 12 01051 g009
Table 1. Analysis of differentially expressed genes (DEGs).
GroupsTotal DEGsUp DEGsDown DEGs
CK vs. D1760854906
Publisher’s Note: MDPI stays neutral with regard to jurisdictional claims in published maps and institutional affiliations.

