Article

Mineral Element Insiders and Outliers Play Crucial Roles in Biological Evolution

by
Eli K. Moore
1,*,
Daniella L. Martinez
1,
Naman Srivastava
2,
Shaunna M. Morrison
3 and
Stephanie J. Spielman
2,4
1
Department of Environmental Science, School of Earth and the Environment, Rowan University, Glassboro, NJ 08028, USA
2
Department of Biological Sciences, College of Science and Mathematics, Rowan University, Glassboro, NJ 08028, USA
3
Earth and Planets Laboratory, Carnegie Institution for Science, Washington, DC 20015, USA
4
Childhood Cancer Data Lab, Alex’s Lemonade Stand Foundation, Bala Cynwyd, PA 19004, USA
*
Author to whom correspondence should be addressed.
Life 2022, 12(7), 951; https://doi.org/10.3390/life12070951
Submission received: 28 April 2022 / Revised: 17 June 2022 / Accepted: 21 June 2022 / Published: 24 June 2022
(This article belongs to the Special Issue Frontiers of Astrobiology, Volume II)

Abstract

:
The geosphere of primitive Earth was the source of life’s essential building blocks, and the geochemical interactions among chemical elements can inform the origins of biological roles of each element. Minerals provide a record of the fundamental properties that each chemical element contributes to crustal composition, evolution, and subsequent biological utilization. In this study, we investigate correlations between the mineral species and bulk crustal composition of each chemical element. There are statistically significant correlations between the number of elements that each element forms minerals with (#-mineral-elements) and the log of the number of mineral species that each element occurs in, and between #-mineral-elements and the log of the number of mineral localities of that element. There is a lesser correlation between the log of the crustal percentage of each element and #-mineral-elements. In the crustal percentage vs. #-mineral-elements plot, positive outliers have either important biological roles (S, Cu) or toxic biological impacts (Pb, As), while negative outliers have no biological importance (Sc, Ga, Br, Yb). In particular, S is an important bridge element between organic (e.g., amino acids) and inorganic (metal cofactors) biological components. While C and N rarely form minerals together, the two elements commonly form minerals with H, which coincides with the role of H as an electron donor/carrier in biological nitrogen and carbon fixation. Both abundant crustal percentage vs. #-mineral-elements insiders (elements that follow the correlation) and less abundant outsiders (positive outliers from the correlation) have important biological functions as essential structural elements and catalytic cofactors.

1. Introduction

Earth’s crust is composed of a wide range of abundant rock-forming elements and trace elements [1,2]. The unique properties of each crustal element results in differential partitioning and diverse chemical relationships among the planet’s fundamental building blocks [3]. The abundance, availability, and atomic properties of chemical elements resulted in their “natural selection” for specific biochemical roles and functions [4]. Light metals that act as electrolytes (Na, Mg, K, Ca) and non-metals that can form stable organic compounds, particularly the big six biological elements (C, H, N, O, P, S), have higher availability in seawater than trace elements which can be used as catalysts (e.g., Fe, Mn, Cu, Ni, Co, Zn, V, Mo [4,5]). There is mounting evidence that Earth’s inorganic components, particularly transition metals, were crucial drivers in the abiotic synthesis of metabolic precursors and electron transfer processes from which life originated and evolved [6,7,8]. Indeed, the paleomineralogy of the Hadean eon (>4.0 billion years ago; Ga) included many common minerals that incorporated trace elements as minor constituents, resulting in great diversity of reactive sites on mineral surfaces to promote prebiotic chemical interactions [9].
Available chemical elements in aqueous solutions largely originate from the lithosphere due to physical and chemical continental weathering processes over geologic time [10,11]. Similar to the impact of the abundance of chemical elements on biological utilization, the abundance of chemical elements in Earth’s crust influences the diversity of different minerals that each element occurs in [12]. Furthermore, planetary redox conditions that have impacted biological evolution throughout Earth history [13,14,15] are also recorded in the mineral record, including biologically mediated minerals [16,17,18,19]. Minerals show different chemical interactions between various elements, and these interactions can be recurring in Earth’s crust [20,21]. The distribution of each element across Earth’s surface mineralogy and specific element interactions within mineral structures can be used to understand the intrinsic properties each element contributes to crustal composition, evolution, and subsequent biological utilization as has been performed recently for cobalt, vanadium, and cadmium [22,23,24].
The estimated bulk composition of Earth’s crust is primarily made up of abundant silicates, aluminum oxides, iron oxides, calcium oxides, and other trace elements [2,25]. While various abundant crustal elements have important biological functions, it is not clear if crustal abundance is the main driver of each element’s mineral distribution in terms of the number of mineral species of which the element is an essential constituent and the number of localities that contain said minerals, and if crustal abundance and mineral diversity of chemical elements correlate with biological utilization. The essential biological elements carbon (C), hydrogen (H), and nitrogen (N) are not included in the Rudnick and Gao (2003) recommended composition of the bulk continental crust. However, C, H, and N have greater mineral diversity than many crustal trace elements [26,27,28]. In this study, we compiled the number of mineral species, mineral localities, and chemistry data for each mineral-forming element from the Mineral Evolution Database (MED; https://rruff.info/evolution/; accessed on 3 February 2020 [29]). Statistical analyses were then performed on these data to identify potential trends between mineral element distribution, element crustal abundance, and biological function. Mineral chemistry network analysis was also performed to compare the evolution of various low abundance outlier elements with C, H, and N.

2. Materials and Methods

We used the R package dragon to construct mineral networks analyze mineral species, locality, and chemistry data from the MED ([19,29]; https://rruff.info/evolution/; accessed on 3 February 2020). Mineral species and their ideal chemical formulas are as defined by the International Mineralogical Association (IMA; https://rruff.info/ima/; accessed on 3 February 2020; [30]). We calculated the numbers of elements that each element forms minerals with (#-mineral-elements), defined as all the elements that occur in the IMA-approved chemical formula of a mineral species of a particular element, excluding the element itself [31,32,33]. For example, the carbon-containing mineral abellaite [NaPb2(CO3)2(OH)] contains five different elements (Na, Pb, C, O, H). The carbon-containing mineral siderite (FeCO3) contains three chemical elements (Fe, C, O). If you add up all the elements of those two minerals (Na, Pb, C, O, H, Fe), you have five elements total, excluding carbon. In total, there are 50 chemical elements in various combinations in the 417 total carbon minerals in this analysis with unambiguous chemical formulas.
Linear regressions were performed on mineral species, locality, chemistry, and elemental abundance data using R, and associated data wrangling and visualization were performed using the R tidyverse suite of data science packages [34]. Adherence to linear regression assumptions were performed using the R package performance [35], and log axis transformations were applied when necessary to meet model assumptions. For all linear regressions, we excluded short-lived radioactive elements, such as Tc, Po, At, Ra, and Pu, from all analyses, because they were not present in sufficient quantities to form minerals after the early Hadean Eon (>4.3 Ga). We additionally excluded any elements that form fewer than five minerals.
The crustal weight percent abundance of each element for the bulk continental crust was compiled from Rudnick and Gao (2003). Mineral chemistry networks were constructed using the R package dragon [19]. The networks included low-abundance outliers (scandium, Sc; gallium, Ga; bromine, Br; ytterbium, Yb) of the linear correlations between the crustal weight percent abundance and #-mineral-elements. The low-abundance outlier elements were used as the focal elements for additional mineral chemistry networks. Mineral chemistry networks were also constructed using essential biological elements C, H, and N that are omitted from the Rudnick and Gao (2003) crustal composition as focal elements.
The mineral chemistry networks included two types of nodes: minerals (represented by colored circles), and the constituent elements of each mineral (represented by colored circles with the chemical symbol of the element). In the network, each mineral has a network connection (referred to as an “edge”) with each of the elements in the mineral’s chemical formula. For example, the mineral chalcopyrite (CuFeS2) has network edges connected to Cu, Fe and S. Louvain community detection cluster analysis [36] was performed using dragon to identify associations among minerals and elements in the C, H, and N combined mineral chemistry network.

Code and Data Availability

All code and associated data needed to reproduce analyses are available from and documented in the repository https://github.com/spielmanlab/element_network_analysis; accessed on 3 February 2020. Crustal weight percent abundances calculated from Rudnick and Gao (2003) are available, along with associated code, in the R dragon package version >1.2.0 (https://github.com/sjspielman/dragon; accessed on 3 February 2020).

3. Results

We observed a strong positive relationship (R2 = 0.907; p = 9.82 × 10⁻³⁵) between #-mineral-elements and the log of the number of mineral species that each element occurs in (Figure 1A). Oxygen (O) forms minerals with 66 other elements and occurs in 3892 mineral species in this analysis (MED; https://rruff.info/evolution/; accessed on 3 February 2020; [29]), which is the largest number of elements that any element forms minerals with and the largest number of mineral species that any element occurs in [31,32,33]. Conversely, rare earth elements (REEs) occur in very few mineral species idealized chemical formulas and form minerals with a limited number of other elements, despite the fact that many different mineral natural kind clusters contain REEs based on their non-ideal atomic structures [37].
Similarly, we observed a strong positive relationship (R2 = 0.759; p = 1.81 × 10⁻²¹) between #-mineral-elements and the log of the number of localities that each element occurs at in each of its mineral species (Figure 1B). The hard base elements O and fluorine (F), and intermediate base elements sulfur (S) and chlorine (Cl) are among the elements that form minerals with the most other elements and occur at the largest number of localities. Hard acids and intermediate acids include elements that form minerals with many other elements and occur at many localities, and hard/intermediate acids also include elements that form minerals with few other elements and occur at a few localities (Table A1). In general, soft acids and soft bases form minerals with fewer other elements and occur at fewer localities than their intermediate and hard counterparts.
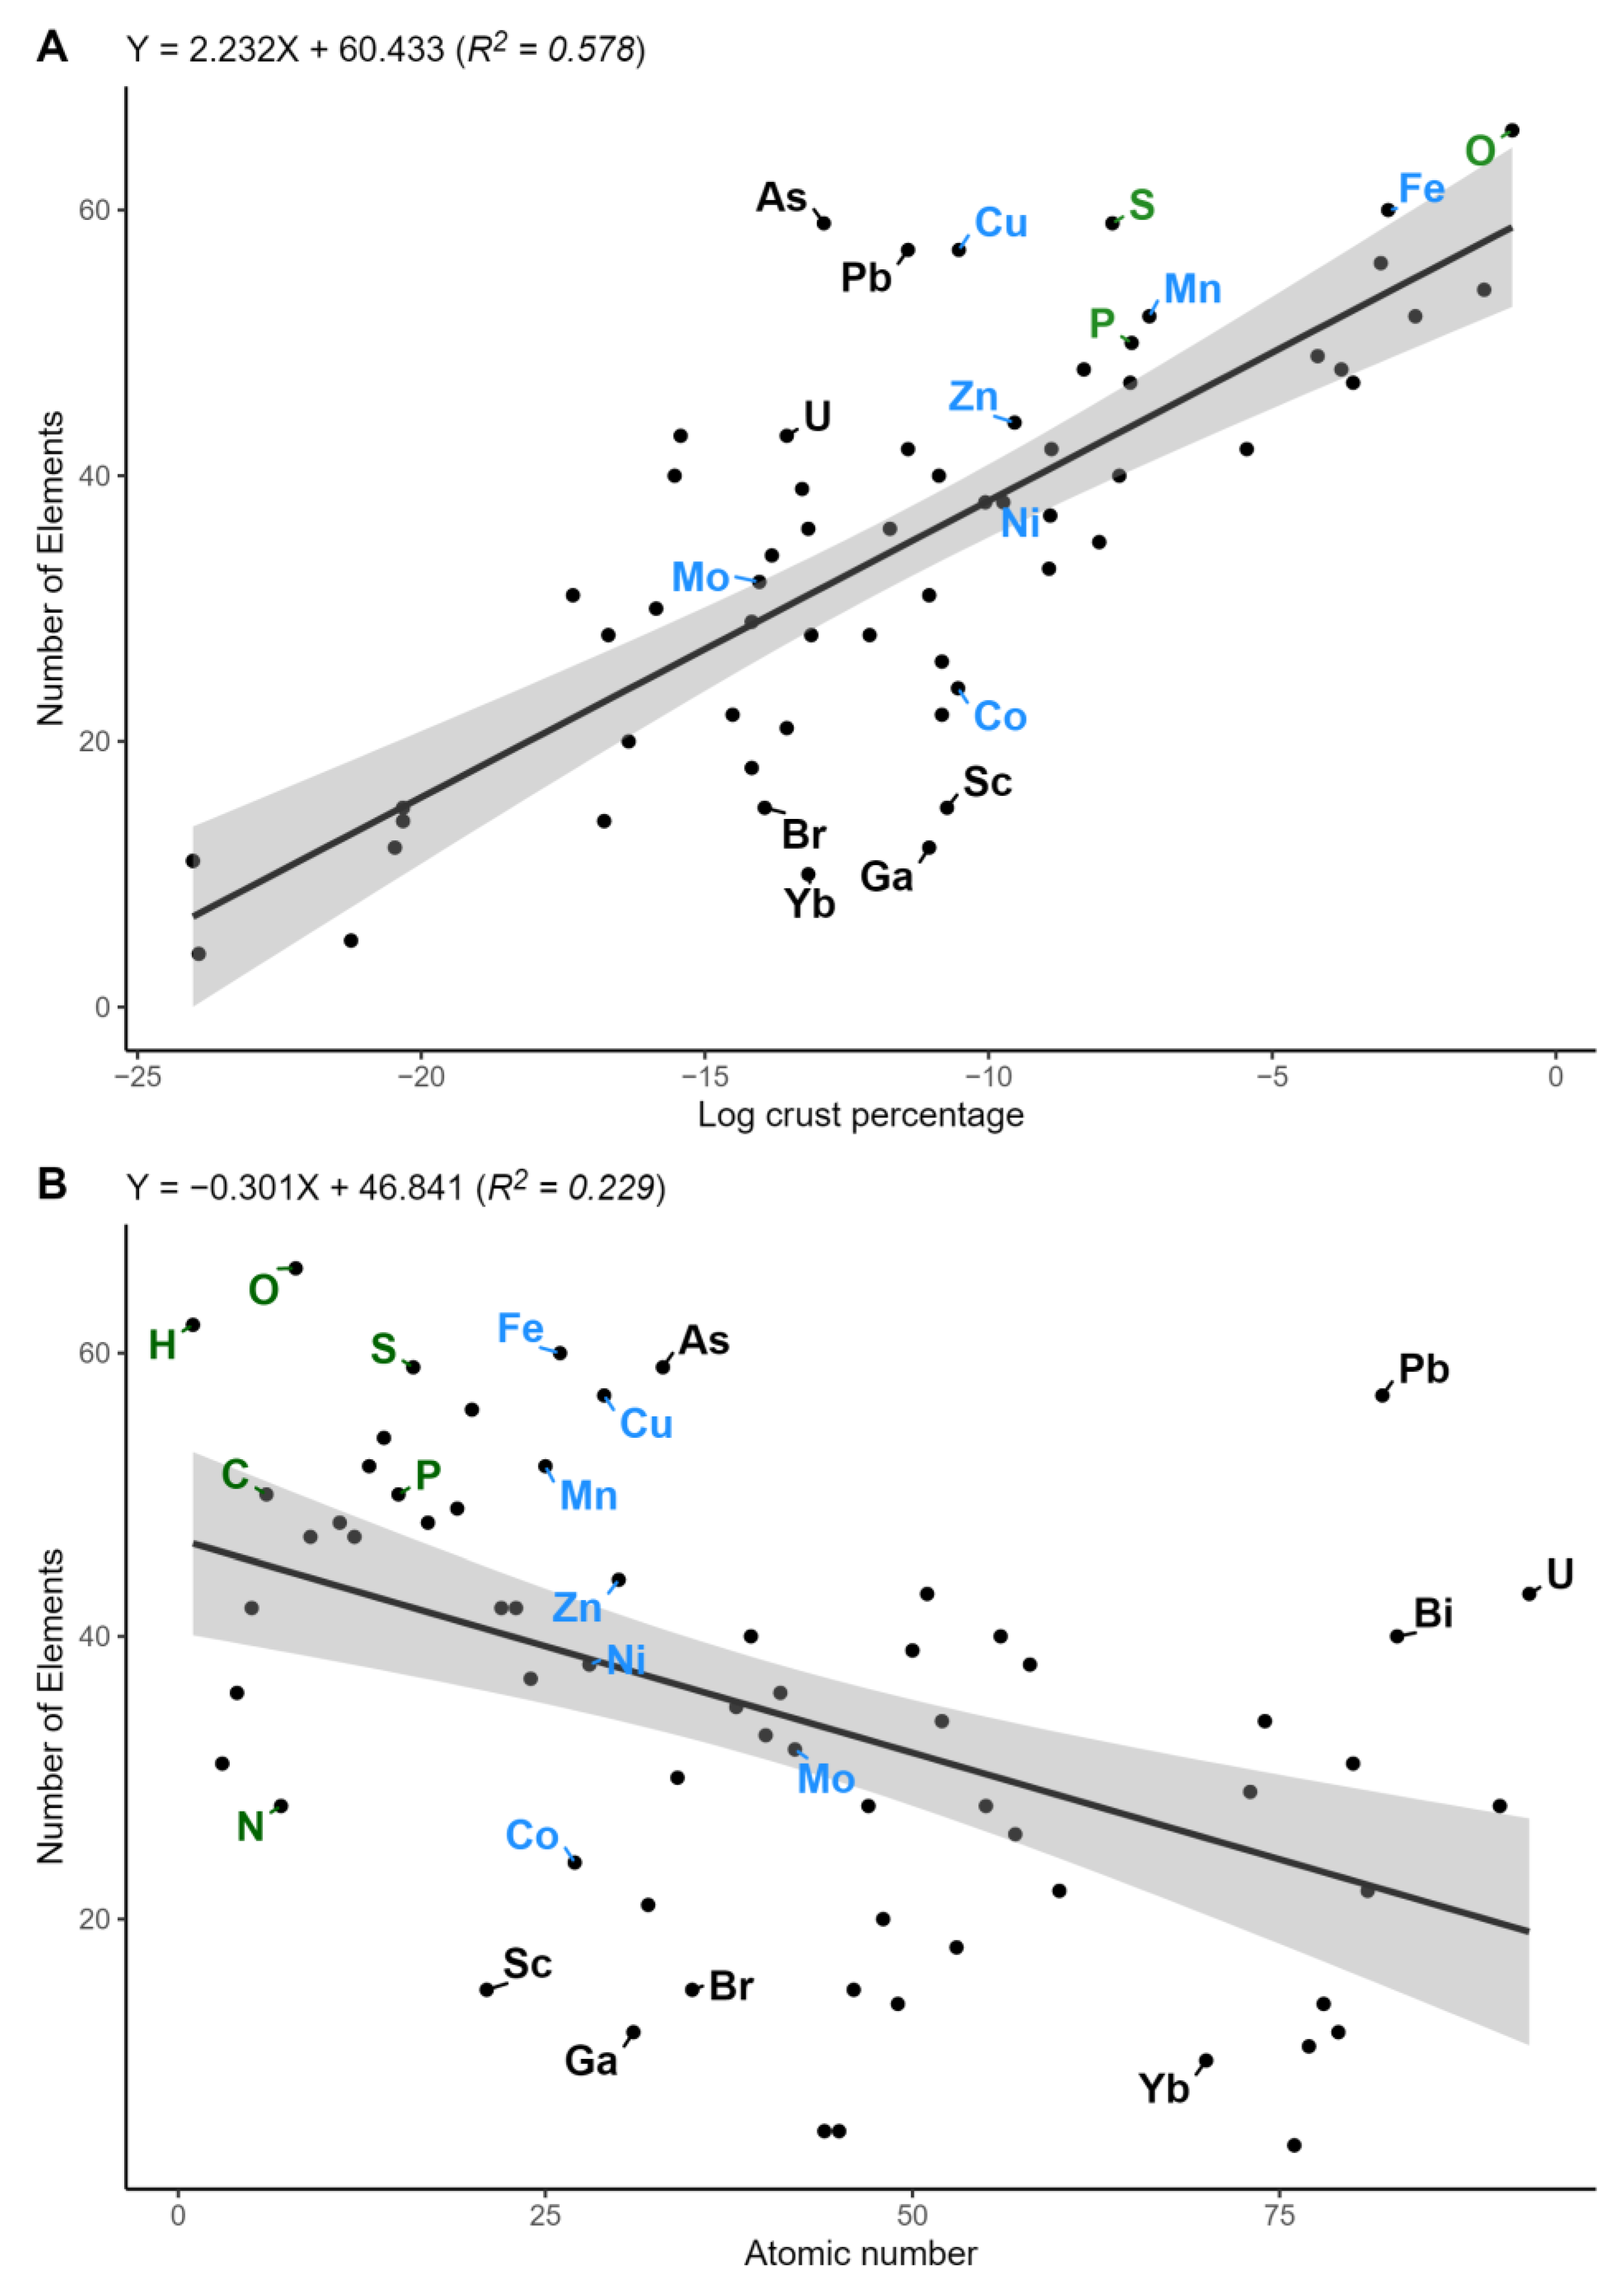
There is a moderately positive relationship (R2 = 0.578; p = 1.8 × 10⁻¹²) between the log of the crustal weight percent abundance of each element and #-mineral-elements (Figure 2A). However, the R2 value of the crustal abundance and number of mineral-forming elements correlation (0.578) is lower than those shown in Figure 1, and there are various outlier elements from the overall trend. The elements S, copper (Cu), lead (Pb), and arsenic (As) all form minerals with a larger number of other elements than expected in the trend, while the elements Sc, Ga, Br, and Yb (and other REEs) all form minerals with fewer elements than expected in the trend (note: despite occurring in few minerals, gallium typically occurs as a minor element in numerous aluminum minerals [38]). For example, arsenic (As) has a crustal weight percent abundance of 2.49 × 10⁻⁴% and forms minerals with 59 other elements, while Sc has a crustal weight abundance of 2.18 × 10⁻³% and forms minerals with 15 other elements. There is a negative correlation with a lower R2 value than the other correlations described above (R2 = 0.229; p = 5.5 × 10⁻⁵) between element atomic number and #-mineral-elements (Figure 2B). The essential biological elements C, H, O, P, and S follow the general trend that lower atomic number elements form minerals with a larger number of elements than higher-atomic-weight elements, but N forms minerals with fewer elements than do all other elements with an atomic number <21 (Sc). Lead is the highest-atomic-weight outlier, which forms minerals with many more elements than other high-atomic-weight elements.
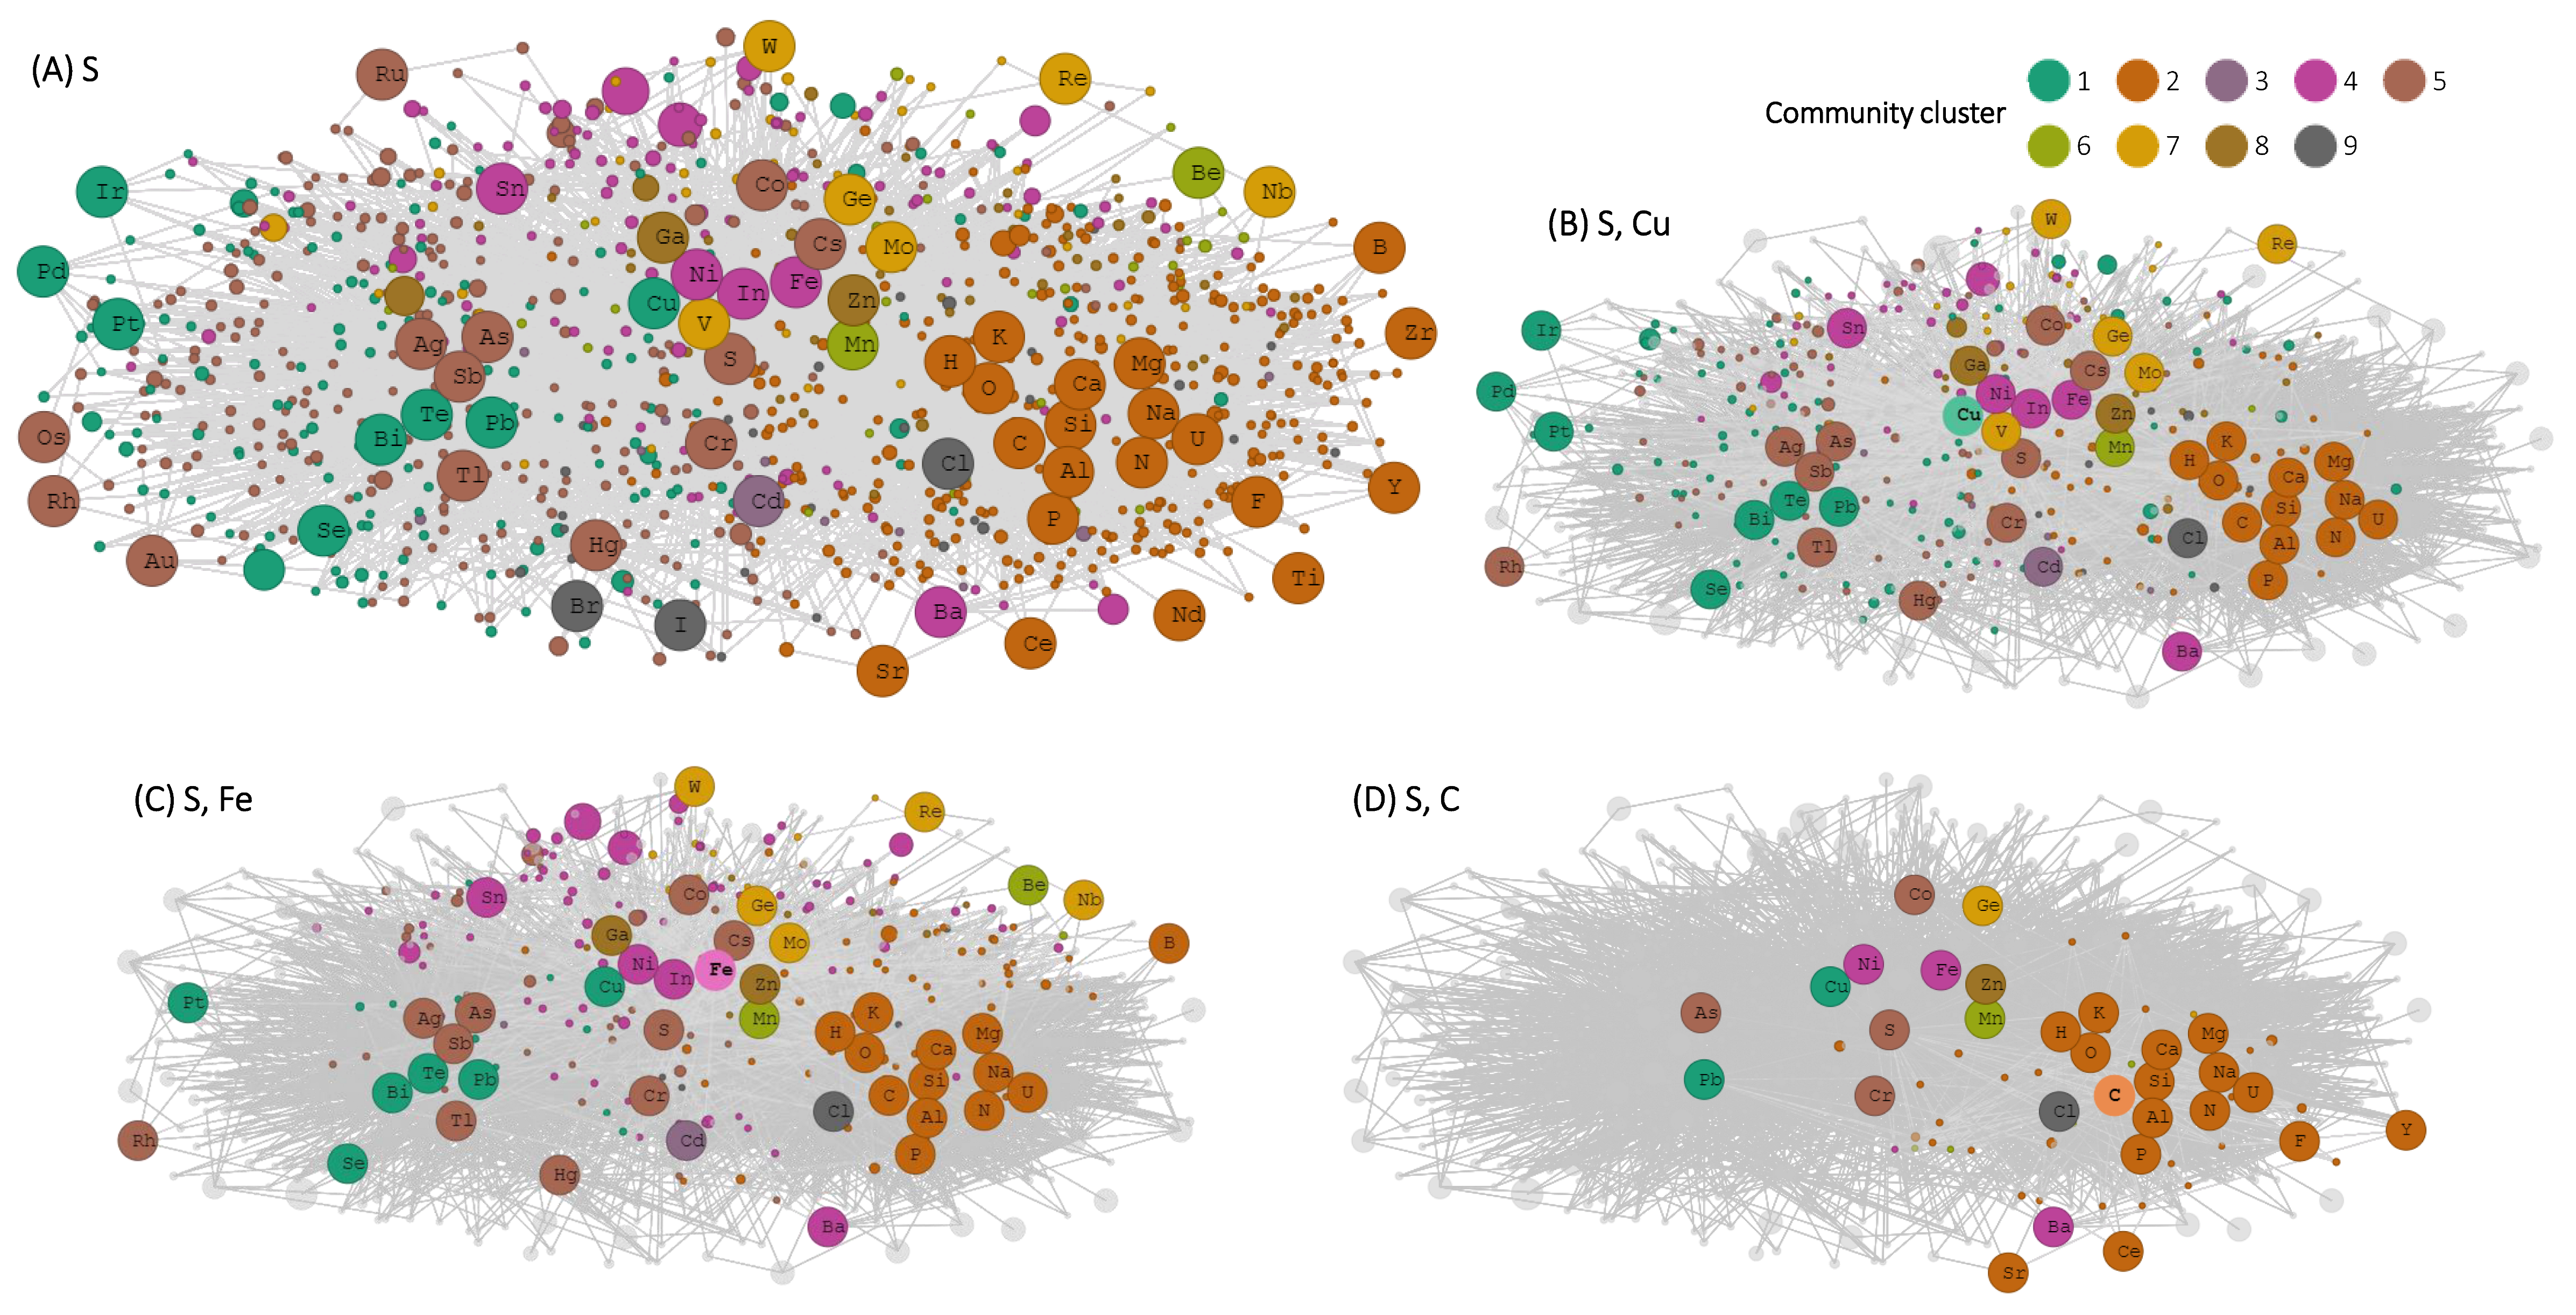
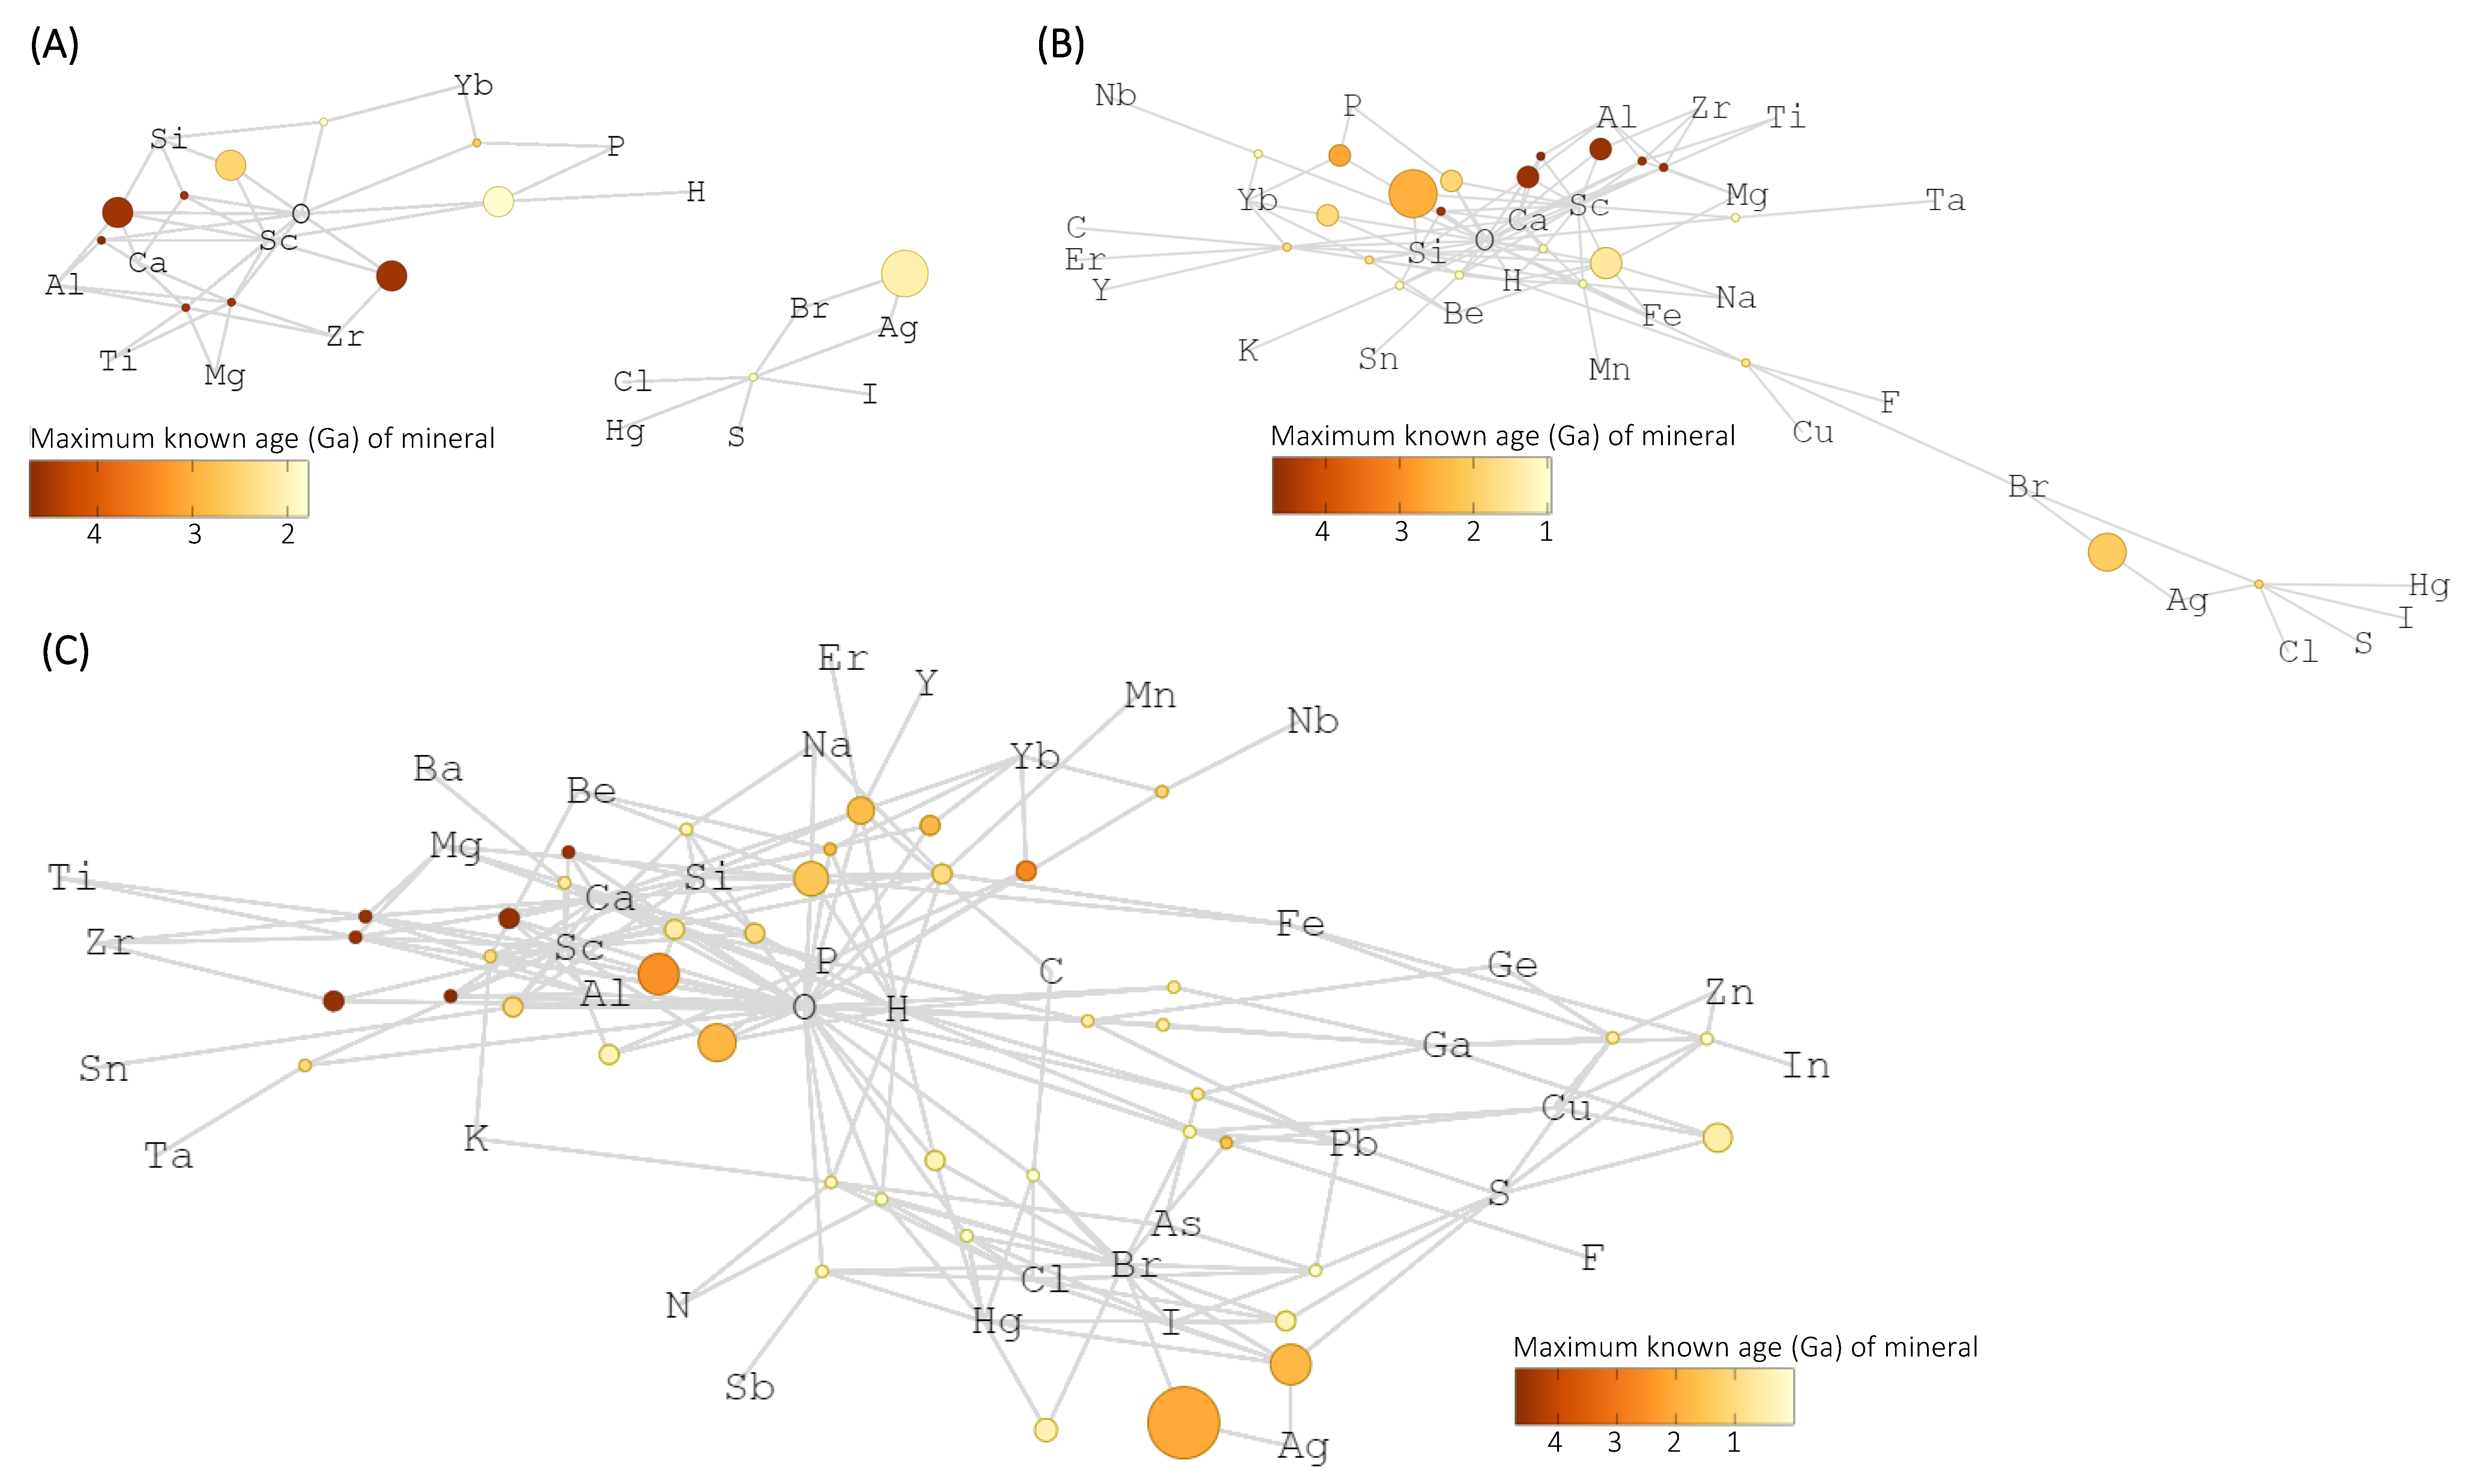
Mineral chemistry networks provide greater insight into chemical associations of positive and negative outlier elements described above. Sulfur forms minerals with many different elements, but transition metals cluster separately from carbon (Figure 3). The expanding mineral network of negative outlier elements Sc, Ga, Br, and Yb prior to >1.7 Ga contains very few minerals (12 minerals), is not fully connected until 1.5 Ga, and does not exceed 40 minerals until present day (Figure 4). Sulfur only forms one mineral with Br at >1.7 Ga, and does not form minerals with any other focal elements (Sc, Ga, Yb) in the network until 0.541 Ga when the oldest known occurrences of gallite (CuGaS2) and gallobeudantite [PbGa3(AsO4)(SO4)(OH)6] appear in the geologic record. Sulfur remains a rare mineral-forming element with Sc, Ga, Br, and Yb despite the large number of total S-containing minerals. Minerals containing Sc and Br occur at the largest number of localities in the Sc, Ga, Br, Yb network. Abundant crustal elements O, Mg, Ca, and Si are the most common mineral-forming elements with Sc. Conversely, the mineral bromargyrite (AgBr) makes up the majority of known Br mineral localities.
The elements C, H, and N occur in separate network communities in the combined C, H, and N mineral chemistry network at >3.5 Ga (Figure 5A). At >2.3 Ga and >0 Ga, the number of H-containing minerals increased much more than C and N, but C and N overlap to a greater extent than they did at >3.5 Ga in terms of the elements they each separately form minerals with (Figure 5B). Carbon- and hydrogen-containing minerals are primarily carbonate hydroxides and carbonate hydrates. There are many more H-containing minerals (2708) than C-containing minerals (417) and N-containing minerals (85) in this analysis, and the combined H, C, N network is dominated by H-containing minerals at present day (Figure 5C). Overall, C, H, and N occur in a larger number of minerals and form minerals with larger numbers of other elements than the trace elements that are included in the recommended bulk crustal composition [2].

4. Discussion

Abundant crustal elements and trace crustal elements each played important roles in the geochemistry of early life [39,40,41]. Some of the oldest rocks on Earth located in the Isua supracrustal belt in Western Greenland [42,43,44,45] contain geochemical evidence of early life and primitive metabolism [46,47]. The strong correlation between #-mineral-elements and the number of mineral species that each element occurs in (Figure 1; [31,32,33]), including essential biological elements and trace element catalysts, indicates that essential biological elements, trace element catalysts, and non-biological elements follow the same trend of incorporation into crystal lattice mineral structures. As expected, elements that form minerals with a wider range of different elements form more mineral species and occur at more localities. The essential biological elements C, H, O, P, and S [48] form minerals with a larger number of other elements than most other non-biological elements. The propensity of these elements to spontaneously form ordered mineral crystal lattices, and also be involved in electron transfer reactions and acid base reactions involved in energy transfer, supports their essential biological roles. Iron is the most abundant metal in biology [49,50] and forms minerals with more elements and occurs in more mineral species than do any other transition metal, as well as the elements P, C, and N.
Despite following the correlation between mineral-forming elements and mineral species (Figure 1), N forms minerals with fewer elements and occurs in fewer mineral species, and at fewer mineral localities than do the other essential biological elements (Figure 1). The number of elements with which N forms minerals, the number of N-containing minerals, and the number of N-containing mineral localities all fall more in the range of many non-biological elements. Additionally, the number of elements that N forms minerals with is lower than any other element with an atomic number equal to or less than Ca (Figure 2B). The limited presence of N in minerals in the lithosphere is largely influenced by biogeochemical cycles, resulting in loss of N from the biosphere to the atmosphere, and contributing to the large inert atmospheric reservoir of volatile N2 and subsequent biological N limitation [51,52]. Additionally, in the oxidizing conditions of the upper mantle N exists primarily as N2 which is readily degassed, while in the deeper reducing mantle N primarily exists as NH4+ [53,54]. Ammonium is soluble in mantle minerals as a trace constituent [27,55], and N3- can replace O2 in certain silicate minerals [56], but N is not incorporated into mineral crystal structures to the same extent as other elements in the mantle due in part to its volatility [57,58].
The majority of mineral-forming elements show a positive association between the element’s crustal percent weight abundance and #-mineral-elements. This trend aligns with the fact that sufficient amounts of a mineral’s constituent elements need to be available for uniform crystal structures and natural kinds to form [37,59,60]. However, there are multiple outliers to this trend, including consequential biological elements (Figure 2A). Indeed, the low R2 value of the correlation between atomic number and #-mineral-elements is due in part to mineral element outliers with unique physical properties and mineralization trends such as N and Pb (Figure 2B). Sulfur, Cu, Pb, and As form minerals with more elements than expected based on their crustal abundance. Among these positive outliers S and Cu have positive biological utility and greater crustal abundance than Pb and As, which are biologically toxic. The same reactive properties of S, Cu, Pb, and As that result in these elements occurring in more mineral species than expected based on their crustal abundance likely also drive their biological utility or toxicity.
Sulfur is an essential biological element [61,62,63], and protein active sites commonly include cysteine to provide sulfur-metal bonds and incorporate metal cofactor elements [64,65,66,67]. The S bonds therefore represent an interface between the organic amino acid protein sequence and the inorganic metal cofactor [68,69,70], which predominately includes elements with atomic numbers less than Zn (Figure 2B). Sulfur forms minerals with a wide range of elements, particularly transition metals and carbon (Figure 3A). However, transition metals such as Fe and Cu cluster separately from C in the S mineral chemistry network (Figure 3B–D). The S network community cluster 2, which contains C, also contains the biologically essential elements H, N, O and P, and biological trace elements potassium (K), calcium (Ca), magnesium (Mg), sodium (Na), silicon (Si), and aluminum (Al). There are 72 S-containing minerals that also contain both Fe and Cu, and 43 S-containing minerals that also contain C. The interactions of S with a wide range of different elements, including transition metals and carbon, in mineral chemical formulas coincide with the biological role of S to link the structural and redox properties of organic and inorganic elements [71,72]. Copper is also an important biological metal used as a cofactor in many protein catalytic sites, particularly proteins involved in energetically favorable aerobic metabolic pathways that evolved later than deeply rooted sulfur-based metabolisms [7,73,74].
The positive outlier elements Pb and As are mainly of consequence to biology due to their toxicity to a wide range of different types of organisms [75,76,77,78]. Indeed, the Great Oxidation Event (GOE) at 2.4 to 2.3 Ga [79] coincided with a sharp increase in arsenate (AsO43−) and arsenic sulfides in marine shales, resulting in the emergence of a new selective pressure on the survival of marine microbial communities due to the widespread appearance of toxic, oxidized chemical species such as arsenate in seawater [80]. Furthermore, chondritic and non-chondritic meteorites in the early stages of solar system formation incorporate 41 different mineral-forming elements, including the earliest known appearances of mineral species that contain As, Pb, and the earliest known examples of galena (PbS), altaite (PbTe), and various arsenides [81,82,83]. Conversely, the elements Sc, Ga, Br, and Yb form minerals with fewer elements than expected based on their crustal abundance (Figure 2A). Scandium, gallium, bromine, and ytterbium are widely dispersed in the lithosphere, but rarely occur as a constituent element in the nominal formula of mineral species [84,85,86,87]. Specifically, Br is commonly a trace element in chlorine- (Cl) and iodine-containing minerals, rather than forming minerals containing Br in the nominal formula [88]. The combined Sc, Ga, Br, Yb network is not fully connected at 1.7 Ga, such that the single Br-containing mineral at this time does not contain any elements that also form minerals with Sc, Ga, or Yb (Figure 4A). Sulfur is a minor element in the combined Sc, Ga, Br, Yb network until 0.6 Ga (Figure 4). The combined Sc, Ga, Br, Yb network includes two distinct groups that contain either O or S, with limited overlap. Similarly, the elements Sc, Ga, Br, and Yb are also not important biological elements like the positive outlier elements S and Cu, and are not consequential toxic elements like the positive outlier elements Pb and As.
The essential biological elements C and N rarely form minerals together, such that ~95% of C-containing mineral species do not contain N and ~84% of N-containing mineral species do not contain C. Furthermore, there are no mineral species that contain both C and N that have a maximum known age >2.3 Ga (Figure 5). This highlights the importance of nitrogen and carbon fixation metabolic pathways to reduce gaseous nitrogen and oxidized carbon to biologically usable forms [51,89]. Indeed, the majority of minerals that contain both C and N derive from guano and other urine related sources over the Phanerozoic [38,90]. The combined C, H, N network at ≥2.3 Ga community cluster 5 that contains N only includes one biological metal element (Cu), but in the combined C, H, N network at >0 Ga the community cluster that contains N (community cluster 5) also includes the biological elements Cu, O, Zn, and Ni indicating greater chemical connection of biological elements with N (Figure 5). There are numerous different paragenetic processes (e.g., near-surface weathering/oxidation, subsurface hydrothermal deposition, and igneous lithologies) that lead to the formation of C-, H-, or N-containing minerals (described in great detail by [91]), and C and H form minerals in many more paragenetic modes than nitrogen. Hydrogen is the common electron source/carrier to reduce N and C (H comes from H2O for C fixation) in each of these processes [15,92]. Similarly, the vast majority of C-containing minerals (70.4%) and N-containing minerals (89.8%) also contain H, and all mineral species that contain both C and N also contain H. The geochemical trends of C, N, and H reflect biological redox relationships of these crucial elements.

5. Conclusions

Strong correlations between #-mineral-elements and the number of mineral species that an element occurs in, as well as between #-mineral-elements and the number of mineral localities of that element, highlight the relationships between geochemistry, the distribution of each element, and potential biological roles. Nitrogen forms minerals with fewer elements and occurs in fewer element species at fewer localities than the other essential biological elements (C, H, O, P, S), which reflects the unique biogeochemistry of N. The correlation between crustal percentage of each element and #-mineral-elements, and the biological importance or significance of positive outliers (S, Cu, Pb, As) vs. the inconsequential negative outliers (Sc, Ga, Br, Yb), reflects the link between geochemical reactivity and biological function/impact. The positive outlier element S is an important bridge element between organic (e.g., amino acids) and inorganic (metal cofactors) biological components. The element H is crucial in the reduction and biological fixation of N and C, and a common mineral forming element with N and C. Both abundant crustal percentage vs. #-mineral-elements insiders and less abundant outsiders have important biological functions as essential structural elements and catalytic cofactors. The unique properties that make specific chemical elements crucial to biology are also reflected in the chemistry and distribution of these elements in minerals and the geosphere. The trends observed in this study can help generate hypotheses for astrobiological studies on Earth and beyond investigating relationships between planetary geochemistry and prebiotic chemistry. Inherent reactivity and capacity for diverse ordered chemistry among biologically essential (C, H, N, O, P, S) and cofactor (Fe, Cu, Mn, Zn, Ni, Co, Mo) chemical elements reflected in the geosphere (mineral crystal lattices) and biosphere (amino acids and metal cofactors), under a wide range of environmental conditions that may be present on other worlds, support the possibility of the emergence of life elsewhere in the universe.

Author Contributions

Conceptualization, E.K.M. and S.J.S.; methodology, E.K.M., D.L.M., N.S. and S.J.S.; software, S.J.S.; validation, E.K.M., D.L.M., N.S. and S.J.S.; formal analysis, E.K.M., D.L.M., N.S. and S.J.S.; investigation, E.K.M., D.L.M., N.S. and S.J.S.; resources, E.K.M. and S.J.S.; data curation, S.J.S. and S.M.M.; writing—original draft preparation, E.K.M., D.L.M., N.S. and S.J.S.; writing—review and editing, E.K.M., D.L.M., N.S., S.J.S. and S.M.M.; visualization, E.K.M., D.L.M., N.S. and S.J.S.; supervision, E.K.M. and S.J.S.; project administration, E.K.M. and S.J.S.; funding acquisition, E.K.M. and S.J.S. All authors have read and agreed to the published version of the manuscript.

Funding

This project was funded in part by NSF EAR2020520, the NASA Astrobiology Institute (Cycle 8) ENIGMA: Evolution of Nanomachines In Geospheres and Microbial Ancestors (80NSSC18M0093), and the 4D Deep-Time Data Driven Initiative at the Carnegie Institution for Science.

Data Availability Statement

All code and associated data needed to reproduce analyses are available from and documented in the repository https://github.com/spielmanlab/element_network_analysis; accessed on 3 February 2020. Crustal weight percent abundances calculated from Rudnick and Gao (2003) are available, along with associated code, in the R dragon package version >1.2.0 (https://github.com/sjspielman/dragon; accessed on 3 February 2020).

Acknowledgments

Data presented in this manuscript can be accessed from the Mineral Evolution Database [MED; https://rruff.info/evolution/; accessed on 3 February 2020] and within the dragon package. We also acknowledge Josh Golden, Robert Downs, and Alex Pires at the University of Arizona, and Robert Hazen from the Carnegie Geophysical Laboratory for data support with the MED and helpful insight. dragon is freely available as an open-source package and is accessible from CRAN (https://cran.r-project.org/; accessed on 3 February 2020) to analyze data from the Mineral Evolution Database.

Conflicts of Interest

The authors declare no conflict of interest.

Appendix A

Table A1. Mineral data for each chemical element included in this study: the number of elements that each element forms minerals with (#-Mineral-Elements); the number of minerals that each element occurs in the idealized chemical formula (Minerals); the number of localities that each element occurs at in mineral form; the Hard-Soft Acid-Base (HSAB) classification of each element; and the percent weight of each element in Earth’s crust (crust percent weight). Elements with “NA” Crust Percent Weight” did not have crust percent weight included in Rudnick and Gao (2003).
#-Mineral- Crust Percent
ElementElementMineralsLocalitiesHSABWeight
Ag281723166Soft acid5.58 × 10−8
Al5288110,322Hard acid0.083816762
As596344664Hard acid2.49 × 10−6
Au12315616Soft acid1.29 × 10−9
B422321295Soft acid1.10 × 10−5
Ba402182904Hard acid4.54 × 10−4
Be361211352Hard acid1.89 × 10−6
Bi402121821Int. acid1.79 × 10−7
Br151388Soft base8.76 × 10−7
C504179650Soft baseNA
Ca56115211,362Hard acid0.045629216
Cd2025253Soft acid7.97× 10−8
Ce38132893Hard acid4.28 × 10−5
Cl483522219Int. base2.43 × 10−4
Co24671334Int. acid2.65 × 10−5
Cr37761115Hard acid1.34 × 10−4
Cs282382Hard acid1.99 × 10−6
Cu576679489Int. acid2.69 × 10−5
F473803775Hard base5.51 × 10−4
Fe6098614,730Int. acid0.051949338
Ga1277Hard acid1.59 × 10−5
Ge212964Hard acid1.29 × 10−6
H62270813,356Hard acidNA
Hg31101773Soft acid2.99 × 10−8
I1824126Soft base6.97 × 10−7
In141046Int. acid5.18 × 10−8
Ir111371Soft acid3.69 × 10−11
K494406449Hard acid0.014965767
La2642154Hard acid1.99 × 10−5
Li31115728Hard acid1.59 × 10−5
Mg475836611Hard acid0.027989626
Mn525232492Int. acid7.71 × 10−4
Mo32642427Int. acid7.97 × 10−7
N2885167Int. baseNA
Na489234877Hard acid0.022740134
Nb36141677Hard acid7.97 × 10−6
Nd222558Hard acid1.99 × 10−5
Ni381371590Int. acid5.88 × 10−5
O66389221,754Hard base0.462294236
Os4544Soft acid4.08 × 10−11
P505492931Soft base5.65 × 10−4
Pb575066728Int. acid1.10 × 10−5
Pd1568184Soft acid1.49 × 10−9
Pt1426217Soft acid1.49 × 10−9
RE3232111NANA
Rh5945Soft acidNA
Ru5660Soft acid5.98 × 10−10
S59101614,012Int. base4.02 × 10−4
Sb432352984Hard acid1.99 × 10−7
Sc151340Hard acid2.18 × 10−5
Se30118370Soft base1.29 × 10−7
Si54132116,057Hard acid0.28214177
Sn39821384Hard acid1.69 × 10−6
Sr35118651Hard acid3.19 × 10−4
Ta2954347Int. acid6.97 × 10−7
Te34161870Soft baseNA
Th2833497Hard acid5.58 × 10−6
Ti423123300Hard acid0.004298094
Tl227052Soft acid4.98 × 10−7
U432811694Hard acid1.29 × 10−6
V42206882Hard acid1.37 × 10−4
W34371218Int. acid9.96 × 10−7
Y40115650Hard acid1.89 × 10−5
Yb1058Hard acid1.89 × 10−6
Zn442556089Int. acid7.17 × 10−5
Zr331181482Hard acid1.31 × 10−4

References

  1. Goldschmidt, V.M. The Principles of Distribution of Chemical Elements in Minerals and Rocks. The Seventh Hugo Müller Lecture, Delivered before the Chemical Society on March 17th, 1937. J. Chem. Soc. 1937, 655–673. [Google Scholar] [CrossRef]
  2. Rudnick, R.L.; Gao, S. 3.01-Composition of the Continental Crust. In Treatise on Geochemistry; Holland, H.D., Turekian, K.K., Eds.; Pergamon: Oxford, UK, 2003; Volume 3, pp. 1–64. ISBN 978-0-08-043751-4. [Google Scholar]
  3. McDonough, W.F.; Sun, S.-S. The Composition of the Earth. Chem. Geol. 1995, 120, 223–253. [Google Scholar] [CrossRef]
  4. Williams, R.J.P. The Bakerian Lecture, 1981 Natural Selection of the Chemical Elements. Proc. R. Soc. Lond. Ser. B Boil. Sci. 1981, 213, 361–397. [Google Scholar] [CrossRef]
  5. Da Silva, J.J.R.F.; Williams, R.J.P. The Uptake of Elements by Biological Systems. Struct. Bond. 1976, 29, 69–121. [Google Scholar]
  6. Martin, W.; Baross, J.; Kelley, D.; Russell, M.J. Hydrothermal Vents and the Origin of Life. Nat. Rev. Microbiol. 2008, 6, 805–814. [Google Scholar] [CrossRef] [PubMed]
  7. Moore, E.K.; Jelen, B.I.; Giovannelli, D.; Raanan, H.; Falkowski, P.G. Metal Availability and the Expanding Network of Microbial Metabolisms in the Archaean Eon. Nat. Geosci. 2017, 10, 629–636. [Google Scholar] [CrossRef]
  8. Muchowska, K.B.; Varma, S.J.; Moran, J. Synthesis and Breakdown of Universal Metabolic Precursors Promoted by Iron. Nature 2019, 569, 104. [Google Scholar] [CrossRef]
  9. Morrison, S.M.; Runyon, S.E.; Hazen, R.M. The Paleomineralogy of the Hadean Eon Revisited. Life 2018, 8, 64. [Google Scholar] [CrossRef] [Green Version]
  10. Berner, R.A.; Lasaga, A.C.; Garrels, R.M. The Carbonate-Silicate Geochemical Cycle and Its Effect on Atmospheric Carbon Dioxide over the Past 100 Million Years. Am. J. Sci. 1983, 283, 641–683. [Google Scholar] [CrossRef]
  11. Lipp, A.G.; Shorttle, O.; Sperling, E.A. The Composition and Weathering of the Continents over Geologic Time. Geochem. Perspect. Lett. 2021, 17, 21–26. [Google Scholar] [CrossRef]
  12. Hazen, R.M.; Papineau, D.; Bleeker, W.; Downs, R.T.; Ferry, J.M.; McCoy, T.J.; Sverjensky, D.A.; Yang, H. Mineral Evolution. Am. Mineral. 2008, 93, 1693–1720. [Google Scholar] [CrossRef]
  13. Anbar, A.D.; Knoll, A.H. Proterozoic Ocean Chemistry and Evolution: A Bioinorganic Bridge? Science 2002, 297, 1137–1142. [Google Scholar] [CrossRef] [PubMed] [Green Version]
  14. Fike, D. Earth’s Redox Evolution. Nat. Geosci. 2010, 3, 453–454. [Google Scholar] [CrossRef]
  15. Jelen, B.I.; Giovannelli, D.; Falkowski, P.G. The Role of Microbial Electron Transfer in the Coevolution of the Biosphere and Geosphere. Annu. Rev. Microbiol. 2016, 70, 45–62. [Google Scholar] [CrossRef] [PubMed]
  16. Sidborn, M.; Neretnieks, I. Long Term Redox Evolution in Granitic Rocks: Modelling the Redox Front Propagation in the Rock Matrix. Appl. Geochem. 2007, 22, 2381–2396. [Google Scholar] [CrossRef]
  17. Hazen, R.M.; Ferry, J.M. Mineral Evolution: Mineralogy in the Fourth Dimension. Elements 2010, 6, 9–12. [Google Scholar] [CrossRef]
  18. Tosca, N.J.; Johnston, D.T.; Mushegian, A.; Rothman, D.H.; Summons, R.E.; Knoll, A.H. Clay Mineralogy, Organic Carbon Burial, and Redox Evolution in Proterozoic Oceans. Geochim. Cosmochim. Acta 2010, 74, 1579–1592. [Google Scholar] [CrossRef] [Green Version]
  19. Spielman, S.J.; Moore, E.K. Dragon: A New Tool for Exploring Redox Evolution Preserved in the Mineral Record. Front. Earth Sci. 2020, 8, 585087. [Google Scholar] [CrossRef]
  20. Hazen, R.M.; Downs, R.T.; Eleish, A.; Fox, P.; Gagné, O.C.; Golden, J.J.; Grew, E.S.; Hummer, D.R.; Hystad, G.; Krivovichev, S.V.; et al. Data-Driven Discovery in Mineralogy: Recent Advances in Data Resources, Analysis, and Visualization. Engineering 2019, 5, 397–405. [Google Scholar] [CrossRef]
  21. Hummer, D.R. Fractal Distribution of Mineral Species among the Crystallographic Point Groups. Am. Mineral. 2021, 106, 1574–1579. [Google Scholar] [CrossRef]
  22. Moore, E.K.; Hao, J.; Prabhu, A.; Zhong, H.; Jelen, B.I.; Meyer, M.; Hazen, R.M.; Falkowski, P.G. Geological and Chemical Factors that Impacted the Biological Utilization of Cobalt in the Archean Eon. J. Geophys. Res. Biogeosci. 2018, 123, 743–759. [Google Scholar] [CrossRef]
  23. Moore, E.K.; Hao, J.; Spielman, S.J.; Yee, N. The Evolving Redox Chemistry and Bioavailability of Vanadium in Deep Time. Geobiology 2020, 18, 127–138. [Google Scholar] [CrossRef] [PubMed]
  24. Srivastava, N.; Spielman, S.J.; Morrison, S.M.; Moore, E.K. Geological Factors Impacted Cadmium Availability and Use as an Alternative Cofactor for Zinc in the Carbon Fixation Pathways of Marine Diatoms. J. Geophys. Res. Biogeosci. 2021, 126, e2020JG005966. [Google Scholar] [CrossRef]
  25. Taylor, S.R.; McLennan, S.M. The Geochemical Evolution of the Continental Crust. Rev. Geophys. 1995, 33, 241–265. [Google Scholar] [CrossRef]
  26. Ingrin, J.; Blanchard, M. Diffusion of Hydrogen in Minerals. Rev. Mineral. Geochem. 2006, 62, 291–320. [Google Scholar] [CrossRef]
  27. Li, Y.; Wiedenbeck, M.; Shcheka, S.; Keppler, H. Nitrogen Solubility in Upper Mantle Minerals. Earth Planet. Sci. Lett. 2013, 377–378, 311–323. [Google Scholar] [CrossRef]
  28. Morrison, S.M.; Buongiorno, J.; Downs, R.T.; Eleish, A.; Fox, P.; Giovannelli, D.; Golden, J.J.; Hummer, D.R.; Hystad, G.; Kellogg, L.H.; et al. Exploring Carbon Mineral Systems: Recent Advances in C Mineral Evolution, Mineral Ecology, and Network Analysis. Front. Earth Sci. 2020, 8, 208. [Google Scholar] [CrossRef]
  29. Golden, J.J. Mineral Evolution Database: Data Model for Mineral Age Associations. Master’s Thesis, University of Arizona, Tucson, AZ, USA, 2019. [Google Scholar]
  30. Lafuente, B.; Downs, R.T.; Yang, H.; Stone, N. The Power of Databases: The RRUFF Project. In Highlights in Mineralogical Crystallography; Armbruster, T., Danisi, R.M., Eds.; W. De Gruyter: Berlin, Germany, 2015; pp. 1–30. [Google Scholar]
  31. Krivovichev, V.G.; Charykova, M.V. Number of Minerals of Various Chemical Elements: Statistics 2012 (a New Approach to an Old Problem). Geol. Ore Depos. 2014, 56, 553–559. [Google Scholar] [CrossRef]
  32. Christy, A.G. Causes of Anomalous Mineralogical Diversity in the Periodic Table. Mineral. Mag. 2015, 79, 33–49. [Google Scholar] [CrossRef]
  33. Krivovichev, S.V.; Krivovichev, V.G.; Hazen, R.M. Structural and Chemical Complexity of Minerals: Correlations and Time Evolution. Eur. J. Mineral. 2018, 30, 231–236. [Google Scholar] [CrossRef] [Green Version]
  34. Wickham, H.; Averick, M.; Bryan, J.; Chang, W.; McGowan, L.D.; François, R.; Grolemund, G.; Hayes, A.; Henry, L.; Hester, J.; et al. Welcome to the Tidyverse. J. Open Source Softw. 2019, 4, 1686. [Google Scholar] [CrossRef]
  35. Lüdecke, D.; Ben-Shachar, M.S.; Patil, I.; Waggoner, P.; Makowski, D. Performance: An R Package for Assessment, Comparison and Testing of Statistical Models. J. Open Source Softw. 2021, 6, 3139. [Google Scholar] [CrossRef]
  36. Blondel, V.D.; Guillaume, J.-L.; Lambiotte, R.; Lefebvre, E. Fast Unfolding of Communities in Large Networks. J. Stat. Mech. 2008, 2008, P10008. [Google Scholar] [CrossRef] [Green Version]
  37. Hazen, R.M. An Evolutionary System of Mineralogy: Proposal for a Classification of Planetary Materials Based on Natural Kind Clustering. Am. Mineral. 2019, 104, 810–816. [Google Scholar] [CrossRef]
  38. Hazen, R.M.; Grew, E.S.; Downs, R.T.; Golden, J.; Hystad, G. Mineral Ecology: Chance and Necessity in The Mineral Diversity of Terrestrial Planetsthe Canadian Mineralogist. Can. Mineral. 2015, 53, 295–324. [Google Scholar] [CrossRef]
  39. Moorbath, S. Palaeobiology: Dating Earliest Life. Nature 2005, 434, 155. [Google Scholar] [CrossRef]
  40. Hazen, R.M. Genesis: Rocks, Minerals, and the Geochemical Origin of Life. Elements 2005, 1, 135–137. [Google Scholar] [CrossRef]
  41. Pearce, J.A. Geochemical Fingerprinting of the Earth’s Oldest Rocks. Geology 2014, 42, 175–176. [Google Scholar] [CrossRef] [Green Version]
  42. Baadsgaard, H.; Nutman, A.P.; Bridgwater, D.; Rosing, M.; McGregor, V.R.; Allaart, J.H. The Zircon Geochronology of the Akilia Association and Isua Supracrustal Belt, West Greenland. Earth Planet. Sci. Lett. 1984, 68, 221–228. [Google Scholar] [CrossRef]
  43. Dymek, R.F.; Klein, C. Chemistry, Petrology and Origin of Banded Iron-Formation Lithologies from the 3800 MA Isua Supracrustal Belt, West Greenland. Precambr. Res. 1988, 39, 247–302. [Google Scholar] [CrossRef]
  44. Nutman, A.P.; Bennett, V.C.; Friend, C.R.L.; Norman, M.D. Meta-Igneous (Non-Gneissic) Tonalites and Quartz-Diorites from an Extensive ca. 3800 Ma Terrain South of the Isua Supracrustal Belt, Southern West Greenland: Constraints on Early Crust Formation. Contrib. Miner. Pet. 1999, 137, 364–388. [Google Scholar] [CrossRef]
  45. Appel, P.W.U.; Moorbath, S.; Touret, J.L.R. Earlly Archean processes and the Isua Greenstone Belt, West Greenland. Introduction to the Isua special issue. Precambr. Res. 2003, 126, 173–394. [Google Scholar] [CrossRef]
  46. Schidlowski, M. A 3800-Million-Year Isotopic Record of Life from Carbon in Sedimentary Rocks. Nature 1988, 333, 313–318. [Google Scholar] [CrossRef]
  47. Rosing, M.T. 13C-Depleted Carbon Microparticles in >3700-Ma Sea-Floor Sedimentary Rocks from West Greenland. Science 1999, 283, 674–676. [Google Scholar] [CrossRef]
  48. Clark, B.C.; Kolb, V.M.; Steele, A.; House, C.H.; Lanza, N.L.; Gasda, P.J.; VanBommel, S.J.; Newsom, H.E.; Martínez-Frías, J. Origin of Life on Mars: Suitability and Opportunities. Life 2021, 11, 539. [Google Scholar] [CrossRef]
  49. Frey, P.A.; Reed, G.H. The Ubiquity of Iron. ACS Chem. Biol. 2012, 7, 1477–1481. [Google Scholar] [CrossRef]
  50. Lindley, P.F. Iron in Biology: A Structural Viewpoint. Rep. Prog. Phys. 1996, 59, 867–933. [Google Scholar] [CrossRef]
  51. Canfield, D.E.; Glazer, A.N.; Falkowski, P.G. The Evolution and Future of Earth’s Nitrogen Cycle. Science 2010, 330, 192–196. [Google Scholar] [CrossRef] [Green Version]
  52. Zerkle, A.L. Biogeodynamics: Bridging the Gap between Surface and Deep Earth Processes|Philosophical Transactions of the Royal Society A: Mathematical, Physical and Engineering Sciences. Philos. Trans. R. Soc. A 2018, 376, 20170401. [Google Scholar] [CrossRef] [Green Version]
  53. Mikhail, S.; Sverjensky, D.A. Nitrogen Speciation in Upper Mantle Fluids and the Origin of Earth’s Nitrogen-Rich Atmosphere. Nat. Geosci. 2014, 7, 816–819. [Google Scholar] [CrossRef]
  54. Zerkle, A.L.; Poulton, S.W.; Newton, R.J.; Mettam, C.; Claire, M.W.; Bekker, A.; Junium, C.K. Onset of the Aerobic Nitrogen Cycle during the Great Oxidation Event. Nature 2017, 542, 465–467. [Google Scholar] [CrossRef] [Green Version]
  55. Watenphul, A.; Wunder, B.; Wirth, R.; Heinrich, W. Ammonium-Bearing Clinopyroxene: A Potential Nitrogen Reservoir in the Earth’s Mantle. Chem. Geol. 2010, 270, 240–248. [Google Scholar] [CrossRef] [Green Version]
  56. Huppertz, H.; Schnick, W. Ba2Nd7Si11N23—A Nitridosilicate with a Zeolite-Analogous Si–N Structure. Angew. Chem. Int. Ed. Engl. 1997, 36, 2651–2652. [Google Scholar] [CrossRef]
  57. Zhang, Y.; Zindler, A. Distribution and Evolution of Carbon and Nitrogen in Earth. Earth Planet. Sci. Lett. 1993, 117, 331–345. [Google Scholar] [CrossRef]
  58. Tolstikhin, I.N.; Marty, B. The Evolution of Terrestrial Volatiles: A View from Helium, Neon, Argon and Nitrogen Isotope Modelling. Chem. Geol. 1998, 147, 27–52. [Google Scholar] [CrossRef]
  59. Deer, W.A.; Howie, R.A.; Zussman, J. An Introduction to the Rock-Forming Minerals, 3rd ed.; The Minerological Society: London, UK, 1966; ISBN 978-0-903056-33-5. [Google Scholar]
  60. Middlemost, E.A.K. Naming Materials in the Magma/Igneous Rock System. Earth-Sci. Rev. 1994, 37, 215–224. [Google Scholar] [CrossRef]
  61. Canfield, D.E.; Raiswell, R. The Evolution of the Sulfur Cycle. Am. J. Sci. 1999, 299, 697–723. [Google Scholar] [CrossRef]
  62. Jacob, C.; Giles, G.I.; Giles, N.M.; Sies, H. Sulfur and Selenium: The Role of Oxidation State in Protein Structure and Function. Angew. Chem. Int. Ed. 2003, 42, 4742–4758. [Google Scholar] [CrossRef]
  63. Bentley, R. Role of Sulfur Chirality in the Chemical Processes of Biology. Chem. Soc. Rev. 2005, 34, 609–624. [Google Scholar] [CrossRef]
  64. Neurath, H. The Proteins Composition, Structure, and Function V1; Academic Press Inc.: New York, NY, USA, 1963; ISBN 978-0-323-16138-1. [Google Scholar]
  65. Lippard, S.J. Iron Sulfur Coordination Compounds and Proteins. Acc. Chem. Res. 1973, 6, 282–288. [Google Scholar] [CrossRef]
  66. Vahrenkamp, H. Sulfur Atoms as Ligands in Metal Complexes. Angew. Chem. Int. Ed. Engl. 1975, 14, 322–329. [Google Scholar] [CrossRef]
  67. Stiefel, E.I. Transition Metal Sulfur Chemistry: Biological and Industrial Significance and Key Trends. In Transition Metal Sulfur Chemistry; ACS Symposium Series; American Chemical Society: Washington, DC, USA, 1996; Volume 653, pp. 2–38. ISBN 978-0-8412-3476-5. [Google Scholar]
  68. Rees, D.C.; Howard, J.B. The Interface Between the Biological and Inorganic Worlds: Iron-Sulfur Metalloclusters. Science 2003, 300, 929–931. [Google Scholar] [CrossRef] [PubMed]
  69. Meyer, J. Iron–Sulfur Protein Folds, Iron–Sulfur Chemistry, and Evolution. JBIC J. Biol. Inorg. Chem. 2008, 13, 157–170. [Google Scholar] [CrossRef]
  70. Mutter, A.C.; Tyryshkin, A.M.; Campbell, I.J.; Poudel, S.; Bennett, G.N.; Silberg, J.J.; Nanda, V.; Falkowski, P.G. De Novo Design of Symmetric Ferredoxins that Shuttle Electrons in vivo. Proc. Natl. Acad. Sci. USA 2019, 116, 14557–14562. [Google Scholar] [CrossRef] [Green Version]
  71. Beinert, H.; Holm, R.H.; Münck, E. Iron-Sulfur Clusters: Nature’s Modular, Multipurpose Structures. Science 1997, 277, 653–659. [Google Scholar] [CrossRef]
  72. Beinert, H. A Tribute to Sulfur. Eur. J. Biochem. 2000, 267, 5657–5664. [Google Scholar] [CrossRef] [Green Version]
  73. Linder, M.C.; Hazegh-Azam, M. Copper Biochemistry and Molecular Biology. Am. J. Clin. Nutr. 1996, 63, 797S–811S. [Google Scholar] [CrossRef]
  74. Solomon, E.I.; Heppner, D.E.; Johnston, E.M.; Ginsbach, J.W.; Cirera, J.; Qayyum, M.; Kieber-Emmons, M.T.; Kjaergaard, C.H.; Hadt, R.G.; Tian, L. Copper Active Sites in Biology. Chem. Rev. 2014, 114, 3659–3853. [Google Scholar] [CrossRef] [Green Version]
  75. Goyer, R.A. Lead Toxicity: Current Concerns. Environ. Health Perspect. 1993, 100, 177–187. [Google Scholar] [CrossRef]
  76. Hughes, M.F. Arsenic Toxicity and Potential Mechanisms of Action. Toxicol. Lett. 2002, 133, 1–16. [Google Scholar] [CrossRef] [Green Version]
  77. Sharma, P.; Dubey, R. Lead Toxicity in Plants. Braz. J. Plant Physiol. 2005, 17, 35–52. [Google Scholar] [CrossRef] [Green Version]
  78. Finnegan, P.; Chen, W. Arsenic Toxicity: The Effects on Plant Metabolism. Front. Physiol. 2012, 3, 182. [Google Scholar] [CrossRef] [PubMed] [Green Version]
  79. Farquhar, J.; Bao, H.; Thiemens, M. Atmospheric Influence of Earth’s Earliest Sulfur Cycle. Science 2000, 289, 756–758. [Google Scholar] [CrossRef] [PubMed] [Green Version]
  80. Fru, E.C.; Somogyi, A.; Albani, A.E.; Medjoubi, K.; Aubineau, J.; Robbins, L.J.; Lalonde, S.V.; Konhauser, K.O. The Rise of Oxygen-Driven Arsenic Cycling at ca. 2.48 Ga. Geology 2019, 47, 243–246. [Google Scholar] [CrossRef] [Green Version]
  81. Nyström, J.O.; Wickman, F.E. The Ordovician Chondrite from Brunflo, Central Sweden, II. Secondary Minerals. Lithos 1991, 27, 167–185. [Google Scholar] [CrossRef]
  82. Karwowski, Ł.; Muszyński, A. Multimineral Inclusions in the Morasko Coarse Octahedrite. Meteorit. Planet. Sci. 2008, 43, 5232. [Google Scholar]
  83. Hazen, R.M.; Morrison, S.M. An Evolutionary System of Mineralogy, Part V: Aqueous and Thermal Alteration of Planetesimals (~4565 to 4550 Ma). Am. Mineral. 2021, 106, 1388–1419. [Google Scholar] [CrossRef]
  84. Burton, J.D.; Culkin, F.; Riley, J.P. The Abundances of Gallium and Germanium in Terrestrial Materials. Geochim. Cosmochim. Acta 1959, 16, 151–180. [Google Scholar] [CrossRef]
  85. Eby, G.N. Scandium Geochemistry of the Oka Carbonatite Complex, Oka, Quebec. Am. Mineral. 1973, 58, 819–825. [Google Scholar]
  86. Combs, D.W. Mineralogy, Petrology and Bromine Geochemistry of Selected Samples of the Salado Salt, Lea and Eddy Counties, New Mexico: A Potential Horizon for the Disposal of Radioactive Waste; United States Department of Energy Office of Scientific and Technical Information: Oak Ridge, TN, USA, 1975; p. 87. [Google Scholar]
  87. Steeman, E.; Temmerman, E.; Verbeek, F. Pulse Polarographic Determination of Ytterbium in Minerals. Bull. Sociétés Chim. Belg. 1977, 86, 499–502. [Google Scholar] [CrossRef]
  88. Hazen, R.M.; Golden, J.; Downs, R.T.; Hystad, G.; Grew, E.S.; Azzolini, D.; Sverjensky, D.A. Mercury (Hg) Mineral Evolution: A Mineralogical Record of Supercontinent Assembly, Changing Ocean Geochemistry, and the Emerging Terrestrial Biosphere. Am. Mineral. 2012, 97, 1013–1042. [Google Scholar] [CrossRef]
  89. Falkowski, P.G.; Fenchel, T.; Delong, E.F. The Microbial Engines that Drive Earth’s Biogeochemical Cycles. Science 2008, 320, 1034–1039. [Google Scholar] [CrossRef] [PubMed] [Green Version]
  90. Hazen, R.M.; Ausubel, J.H. On the Nature and Significance of Rarity in Mineralogy. Am. Mineral. 2016, 101, 1245–1251. [Google Scholar] [CrossRef] [Green Version]
  91. Hazen, R.M.; Morrison, S.M. On the Paragenetic Modes of Minerals: A Mineral Evolution Perspective. Am. Mineral. 2022; in press. [Google Scholar]
  92. Kim, J.D.; Senn, S.; Harel, A.; Jelen, B.I.; Falkowski, P.G. Discovering the Electronic Circuit Diagram of Life: Structural Relationships among Transition Metal Binding Sites in Oxidoreductases. Philos. Trans. R. Soc. B Biol. Sci. 2013, 368, 20120257. [Google Scholar] [CrossRef] [Green Version]
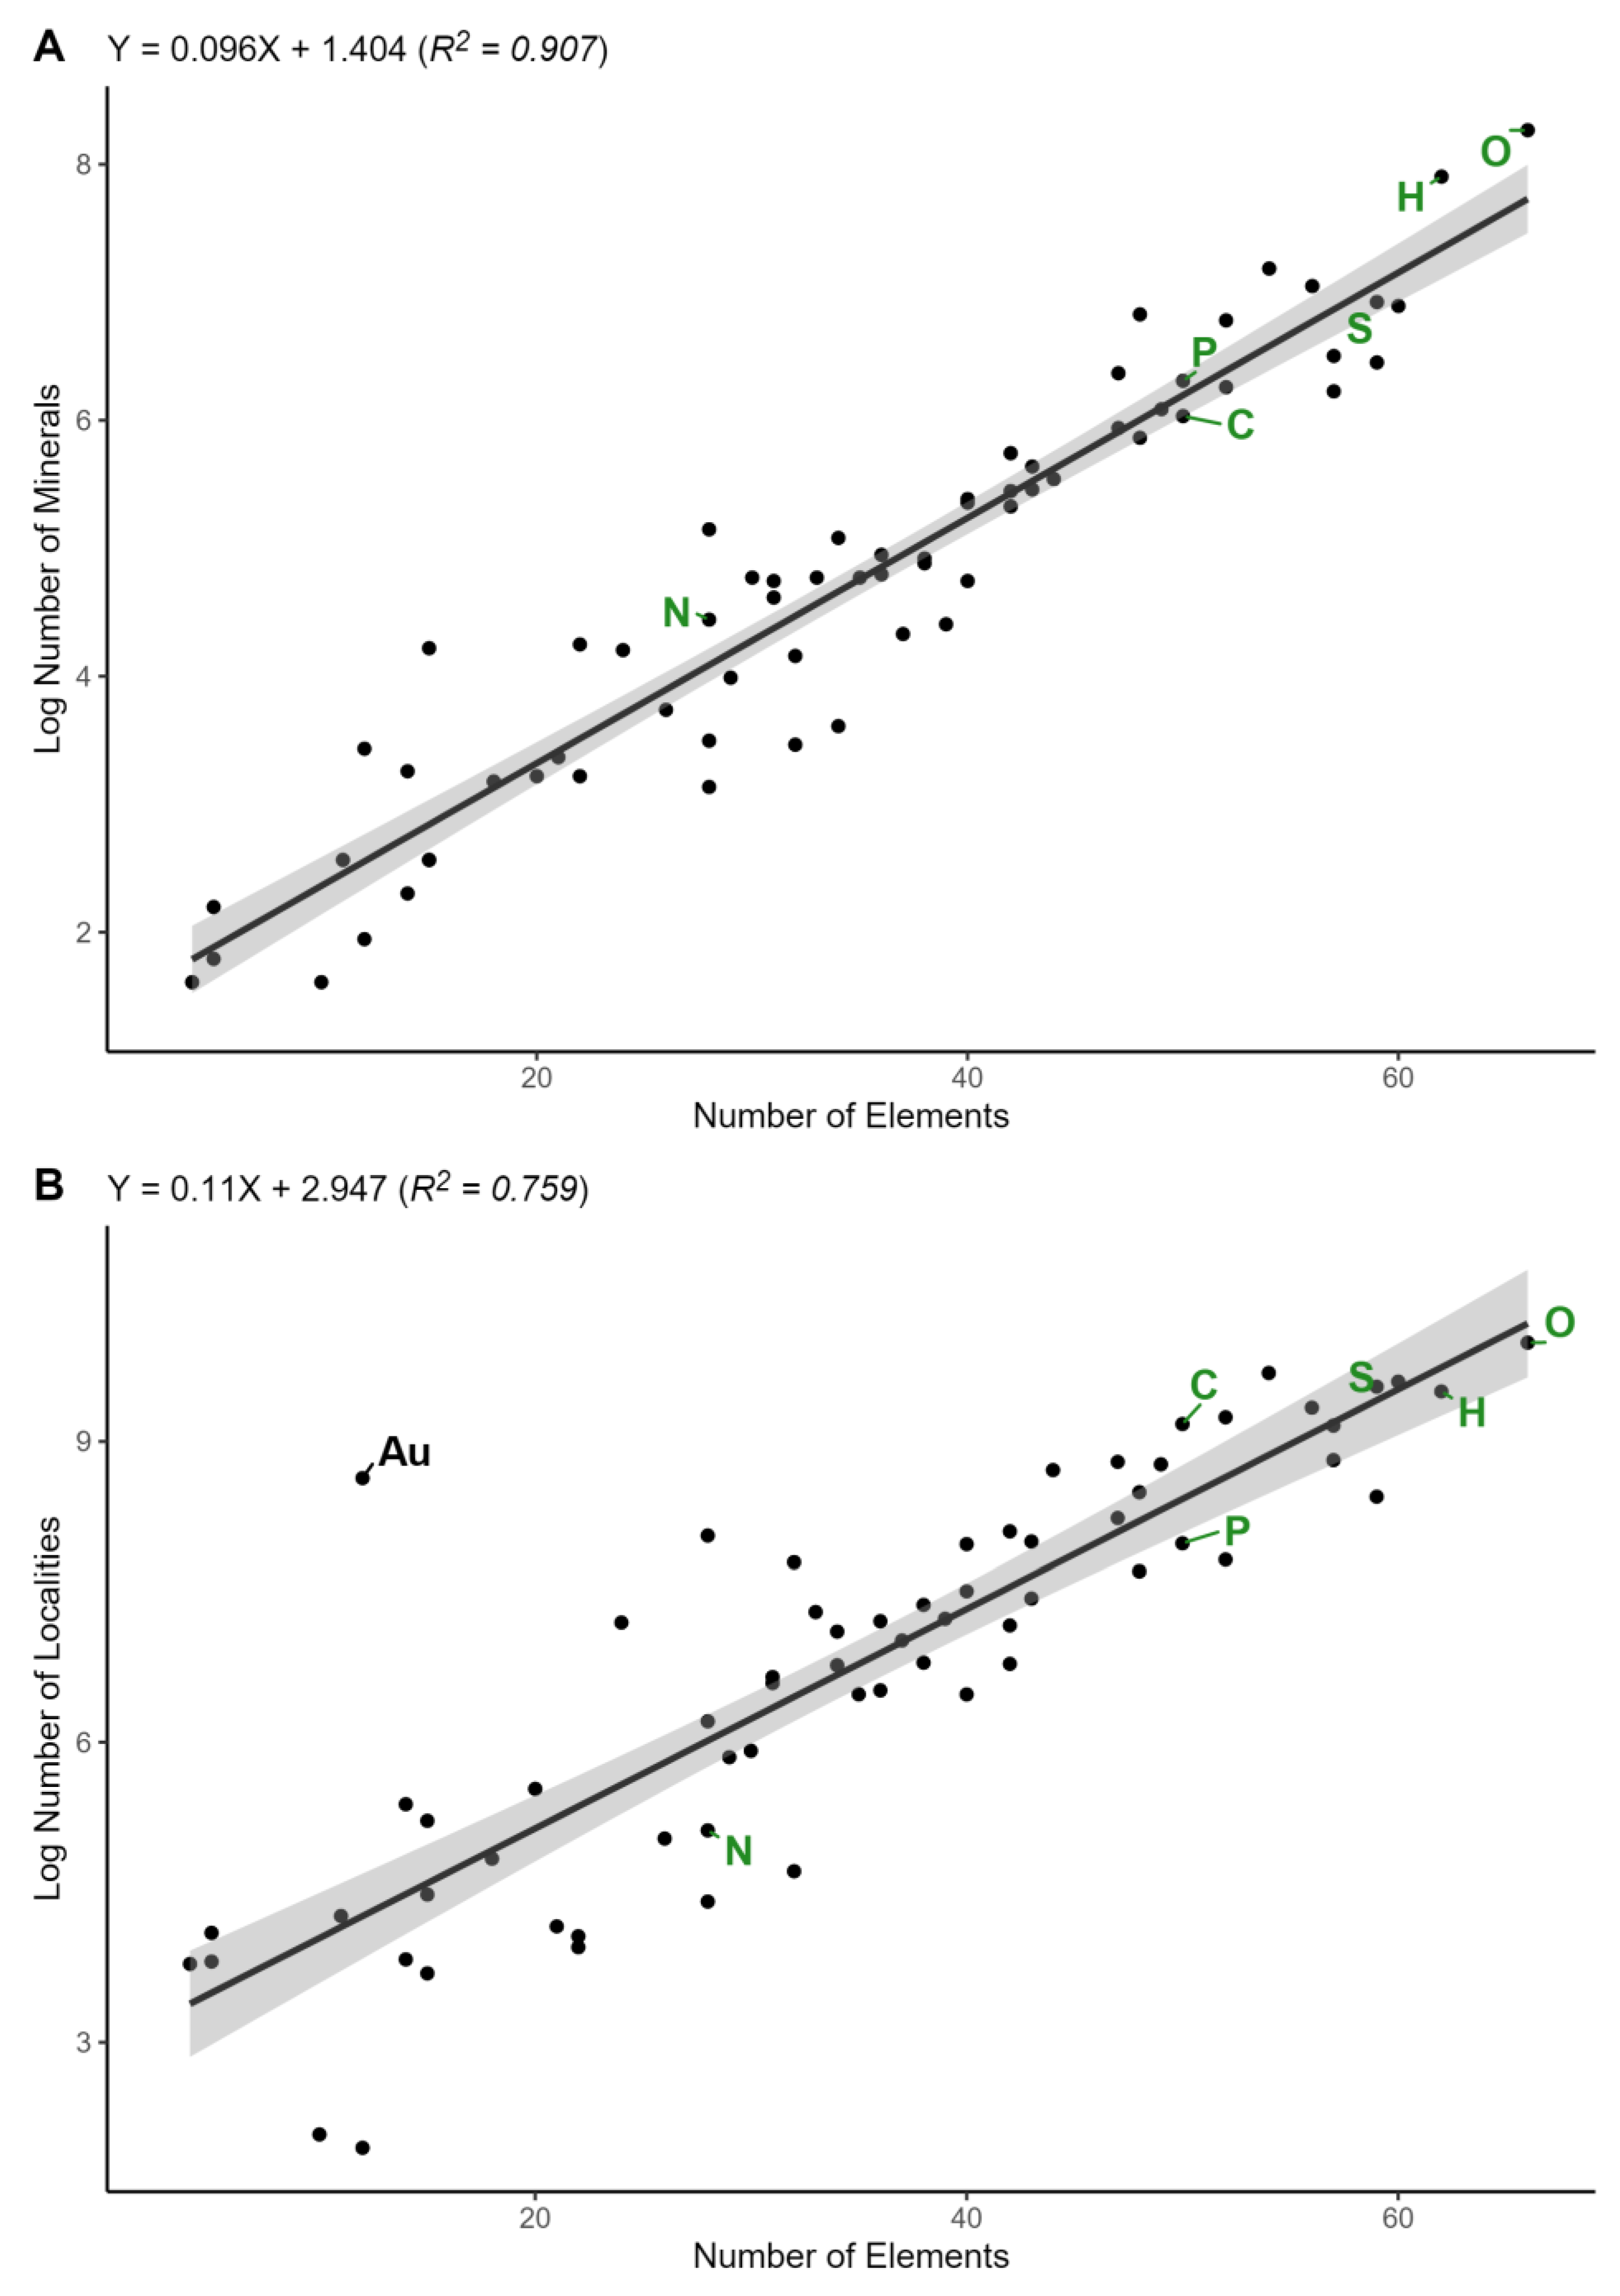
Figure 1. (A) Plot of the number of elements that each chemical element forms minerals with (#-mineral-elements) vs. the log of the number of minerals that each element occurs in the idealized chemical formula. (B) Plot of #-mineral-elements vs. the log of the number of mineral localities that each element occurs at. Essential biological elements (carbon, C; hydrogen, H; nitrogen, N; oxygen, O; phosphorus, P; sulfur, S) are labeled in green font and the abundant positive outlier non-biological element (gold, Au) is labeled in black font. A mineral locality is a location where a mineral occurs.
Life 12 00951 g001
Figure 2. (A) Plot of the log of crustal percentage of each element (crustal abundance data compiled from Rudnick and Gao, 2003) vs. number of elements (#-mineral-elements). (B) Plot of the atomic number of each element vs. #-mineral-elements. Essential biological elements (carbon, C; hydrogen, H; nitrogen, N; oxygen, O; phosphorus, P; sulfur, S) are labeled in green font (the following essential biological elements were not included in the Rudnick and Gao (2003) study and subsequently not included in (A): carbon, C; hydrogen, H; nitrogen, N). Non-biological positive and negative outlier elements (arsenic, As; lead, Pb; Scandium, Sc; Gallium, Ga; ytterbium, Yb; bromine, Br; bismuth, Bi; uranium, U) are labeled in black font. Biological metals (iron, Fe; manganese, Mn; copper, Cu; zinc, Zn; nickel, Ni; molybdenum, Mo; cobalt, Co) are labeled in blue font.
Life 12 00951 g002
Figure 3. (A) Bipartite mineral chemistry network of all S-containing minerals. The network contains element nodes and mineral nodes. Element nodes are represented by circles with chemical element symbols, mineral nodes are represented by smaller unlabeled colored circles. Element and mineral nodes are colored by Louvain network community [36]. (B) Same network as 3A, but with only minerals that contain S and Cu highlighted. (C) Same network as 3A, but with only minerals that contain S and Fe highlighted. (D) Same network as 3A, but with only minerals that contain S and C highlighted.
Life 12 00951 g003
Figure 4. Combined bipartite mineral chemistry network of all Sc-containing minerals, Ga-containing minerals, Br-containing minerals, and Yb-containing minerals at (A) >1.7 billion years ago (Ga); (B) >0.6 Ga; (C) >0 Ga. Mineral nodes are colored by maximum known age.
Life 12 00951 g004
Figure 5. Combined bipartite mineral chemistry network of all H-containing minerals, C-containing minerals, and N-containing minerals at (A) >3.5 billion years ago (Ga); (B) >2.3 Ga; (C) >0 Ga. Element and mineral nodes are colored by Louvain network community [36].
Life 12 00951 g005
Publisher’s Note: MDPI stays neutral with regard to jurisdictional claims in published maps and institutional affiliations.