Article

Anthocyanin Accumulation and Molecular Analysis of Correlated Genes by Metabolomics and Transcriptomics in Sister Line Apple Cultivars

Zhengzhou Fruit Research Institute, Chinese Academy of Agricultural Sciences, Zhengzhou 450009, China
*
Author to whom correspondence should be addressed.
Life 2022, 12(8), 1246; https://doi.org/10.3390/life12081246
Submission received: 3 August 2022 / Revised: 12 August 2022 / Accepted: 13 August 2022 / Published: 16 August 2022

Abstract

:
Red coloration in apples, an important quality trait, is primarily attributed to the accumulation of anthocyanins. Centuries of breeding have produced a wide variety of apples with different levels of anthocyanins in response to genetic and environmental stimuli. The Huashuo apple shows a much darker red color than its sister line, Huarui. Thirteen different anthocyanins were detected in Huashuo and Huarui apples, of which ten were significantly more abundant in Huashuo apples, confirming that the color difference is indeed attributed to high anthocyanins accumulation rather than the types of anthocyanins. In particular, the contents of cyanidin 3-O-galactoside levels were highest among anthocyanins in both cultivars, reaching >5000 μg·g−1 at the last color transition stage in Huashuo apples, while only >3000 μg·g−1 in Huarui apples. Moreover, the expression of most structural genes, especially DFR, CHI, and 4CL associated with anthocyanin synthesis, were higher in Huashuo apples than in Huarui apples. Combined transcriptomics, metabolomics, and qRT-PCR analysis revealed that six transcription factors from the MYB and bZIP transcription factor families likely play key roles in the dark coloring of Huashuo apples. These results provide deeper insights into apple coloring and suggest a series of candidate genes for breeding anthocyanin-rich cultivars.

1. Introduction

Apple skin color, particularly anthocyanin-based coloration, is a key factor in fruit quality and market acceptance. Anthocyanins play several important roles in plants, including resistance to environmental stresses, protection against diseases, and pollination [1,2]. Additionally, anthocyanins have strong free radical scavenging and antioxidant capacity, which are important health-promoting properties [3], and are classified into six categories based on their molecular structures, namely malvidins, petunidins, pelargonidins, peonidins, delphinidins, and cyanidins [4].
Flowers with anthocyanin as the primary pigment show a wide range of colors, ranging from orange–red to red, purple, blue, and black. The red peel is mainly composed of three anthocyanins—cyanidin 3-O-galactoside, cyanidin 3-O-glucoside, and cyanidin 3-O-arabinoside—among which, cyanidin 3-O-galactoside is the primary component of the apple peel, while the other two are present in various amounts in different apple varieties [5]. In addition, apple peel contains small amounts of other anthocyanins, such as cyanidin 7-O-arabinoside, cyanidin 3-O-rhamnoside, and cyanidin 3-O-rutoside [5].
The anthocyanin synthesis pathway is a branch of phenylpropanoid biosynthesis [6] that involves a series of enzymes encoded by structural genes and is relatively conserved among plant species [7]. The structural genes affecting phenylpropanoid synthesis mainly include phenylalanine ammonia-lyase (PAL), cinnamic acid 4-hydroxylase (C4H), and 4-coumarate CoA ligase (4CL). The key branch point from monolignol biosynthesis to anthocyanins biosynthesis is catalyzed by chalcone synthase (CHS), chalcone isomerase (CHI), flavanone 3-hydroxylase (F3H), dihydroflavonol-4-reductase (DFR), anthocyanidin synthase (ANS), and UDP-glucose: flavonoid 3-O-glucosyltransferase (UFGT). CHS, CHI, and F3H are upstream structural genes, while DFR, ANS, and UFGT are downstream structural genes. The latter are usually key genes affecting anthocyanin synthesis, and their expression affects the anthocyanin content in tissues [8,9]. During apple fruit development, the co-expression of CHS, F3H, DFR, ANS, and UFGT is positively correlated with anthocyanin accumulation [10,11]. However, the expression patterns of these enzymes in apples differ among varieties, developmental stages, and tissues [12].
Transcription factors (TFs) are involved in the color regulation of plant organs. Anthocyanin biosynthesis is regulated by the MYB-bHLH-WD40 (MBW) protein complex [13,14]. MYB is a well-studied TF family in plants and classified into four categories based on the number of domains: 1R-MYB, R2R3-MYB, 3R-MYB, and 4R-MYB, of which R2R3-MYB is the most abundant [9,15,16,17]. Several MYB family TFs involved in anthocyanin synthesis have been identified in apples, including MdMYB1 [11], MdMYBA [18], MdMYB10 [19], MdMYB110a [20], MdMYB3 [21], MdMYB9, MdMYB11 [22], and MdMYB90-like [23]. MYB TFs negatively regulating anthocyanin synthesis have also been reported. For example, the anthocyanin content in red apple calli is significantly reduced if MdMYB16 [24] or MdMYB111 [25] is overexpressed. A recent study found that MdMYB306-like inhibited the anthocyanins synthesis in apple peels by interacting with MdMYB17 and MdbHLH33 [26]. Studies have identified more TFs in anthocyanin accumulation, such as B-box protein [27,28,29,30], NAC [31], WRKY [32,33], and bZIP [34,35].
High-throughput methods, such as transcriptomic and metabolomic approaches, have been widely used to explore coloring-related mechanisms in fruits, including apples [36,37,38]. The Huashuo apple is a hybrid of Huaguan and American No.8 apples cultivated by the Zhengzhou Fruit Research Institute, Chinese Academy of Agricultural Sciences [39]. Huashuo apples have been cultivated in China. The Huashuo apple has a deeper red color than its sister line, Huarui, with both planted in Zhaotong City (Yunnan Province, China). This study determines why the coloring of the Huashuo apple differs from that of the Huarui apples using transcriptome and metabolome analysis. The mechanism underlying the Huashuo-specific coloration may provide a theoretical basis and gene resources for the breeding of apple color-dominant traits, which may appeal to consumers, thereby enhancing market value.

2. Materials and Methods

2.1. Plant Materials

Two apple cultivars, Huashuo (YS) and Huarui (YR), were planted in the orchard located at Zhaotong Apple Industry Research Institute (Zhaotong, China). The trees were five years old, planted at 3.5 × 1.5 m intervals between and along rows, and grafted onto M26 interstock. Nine trees with consistent and healthy growth were selected for sampling from each cultivar, with three trees selected as biological replicates. Samples were collected over the color transition period of 105, 110, 120, and 130 days after full blossom (DAFB); similarly, 15 fruits were collected from the three biological replicate. After separating the peel from the cortex (1 mm thick), some of the mixed peel samples were collected for pigment measurement while the remaining samples were frozen in liquid nitrogen and stored at −80 °C for subsequent metabolome and transcriptome analyses.

2.2. Measurement of Apple Skin Color Traits

2.2.1. Relative Total Anthocyanin Content

Anthocyanin was determined as previously reported, with modifications [40,41]. Apple peel samples (5 g) were crushed into powder and extracted with 20 mL of 1% HCl in methanol (v/v) for 24 h at 4 °C in the dark. Subsequently, the mixture was filtered, and absorbance of the filtrate was measured at 530 nm using an ultraviolet spectrophotometer (Shimadzu UV-2450, Kyoto, Japan). The relative anthocyanin concentration was calculated using the following formula:
N = 10 × A530nm/m
where A530nm refers to the absorbance value of the sample at 530 nm, m represents the mass of the sample, and N is the relative anthocyanin concentration of per gram fresh weight (Uint/g FW).

2.2.2. Measurement of Anthocyanin Metabolites by HPLC-ESI-MS/MS

Anthocyanin metabolites were obtained from Metware Biotechnology Co., Ltd. (Wuhan, China). Apple peel samples were freeze-dried in a vacuum freeze dryer (LGJ-22, Sihuan Tech Co., Beijing, China) for 64 h in the vacuum environment as the temperature gradually rose from −50 °C to 30 °C, and crushed using an MM 400 mixer mill (Retsch Co., Haan, Germany) and zirconia beads for 1.5 min at 30 Hz. The crushed samples (50 mg) were mixed with 0.5 mL of 50% aqueous methanol (including 0.1% HCL, v/v), vortexed for 5 min, ultrasonicated for 5 min, centrifuged for 5 min, and the supernatants were isolated; this process was repeated twice. The combined supernatants were filtered through a SCAA-104 membrane (0.22 μm pore size; ANPEL, Shanghai, China) and analyzed using a UPLC-ESI-MS/MS system (UPLC, ExionLC™ AD, https://sciex.com.cn/); MS, Applied Biosystems 6500 Triple Quadrupole, https://sciex.com.cn/). The analytical conditions were as follows: UPLC: column, WatersACQUITY BEH C18 (1.7 µm, 2.1 mm × 100 mm); solvent system, water (0.1% formic acid), methanol (0.1% formic acid); gradient program, 95:5 (v/v) at 0 min, 50:50 (v/v) at 6 min, 5: 95 v/v at 12 min, hold for 2 min, 95:5 (v/v) at 14 min, hold for 2 min; flow rate, 0.35 mL/min; temperature, 40 °C; injection volume, 2 μL. ESI-MS/MS: ion source, ESI, source temperature 550 °C; ion spray voltage (IS) 5500 V; curtain gas (CUR) was set at 35 psi. In Q-Trap 6500+, each ion pair was scanned and detected according to the optimized declustering potential (DP) and collision energy (CE).

2.3. RNA Sequencing and Analysis

Total RNA from each peel sample was extracted using a Column Plant RNA Extraction Kit (Sangon Biotech Co., Shanghai, China). The quality and concentration of the RNA samples were determined using an Agilent 2100 Bioanalyser (Agilent Technologies, Santa Clara, CA, USA), Qubit 3.0 fluorometer (Invitrogen, Waltham, MA, USA), and NanoDrop 2000 spectrophotometer (Thermo Fisher Scientific, Waltham, MA, USA). High-quality total RNA (1 μg) was used to synthesize first-strand cDNA with the Prime Script RT Reagent Kit with gDNA Eraser (TaKaRa Bio, Dalian, China).
The raw RNA-Seq data were cleaned by removing adaptor sequences and low-quality reads using Cutadapt v1.18 and Trimmomatic-0.38 software, respectively [42,43]. The clean reads were mapped to the Malus domestic v1.1 genome (https://phytozome-next.jgi.doe.gov/, accessed on 25 November 2021) using the hisat2 software for assembly. Gene expression levels were estimated using HTseq [44]. Pearson correlation coefficients between biological replicates were calculated using the corrplot package in R [45].

2.4. WGCNA and Visualization of Gene Networks

Weighted gene co-expression network analysis (WGCNA) [46] was performed (soft threshold for 16, minimum module size for 100, and combined cutting height for 0.3) on the gene expression profile, including 10 different anthocyanins and the total anthocyanin content. Correlation analysis was conducted between the identified modules and the total anthocyanin metabolism in the peel. Modules with the highest correlation were selected based on the Pearson correlation coefficient (PCC).

2.5. Quantitative Real-Time PCR (qRT-PCR) Validation of RNA-Seq Results

Six genes were selected for qRT-PCR analysis to examine the different expression profiles. Methods for RNA extraction and cDNA synthesis are provided in Section 2.3. qRT-PCR was performed in a 10 μL reaction volume using SYBR Premix Ex Taq (TaKaRa, Dalian, China) on a Quant Studio 7 Flex Real-Time PCR System (Applied Biosystems, Foster City, CA, USA) according to the manufacturer’s protocol. The primers were designed using Primer 5.0 software; sequences are listed in Table S1. The primers for actin served as the internal control: forward primer, 5′-TGACCGAATGAGCAAGGAAATTACT-3′, and reverse primer, 5′-TACTCAGCTTTGGCAATCCACATC-3′. qRT-PCR was conducted with three biological replicates, all of which had three technical replicates. The reaction conditions were as follows: initial incubation at 50 °C for 2 min, followed by 95 °C for 2 min, and 38 cycles of 95 °C for 15 s, 60 °C for 15 s, and 72 °C for 20 s. The relative expression of the targeted genes was calculated using the negative delta-delta Ct method [47].

2.6. Function Prediction of Candidate Genes

The target protein sequence was uploaded to the online server STRING to predict the interaction network (https://cn.string-db.org/cgi/input.pl, accessed on 20 March 2022) with an option value of >0.700 [48,49,50]. The search box selected was the single protein by sequence; the organism was Malus domestica; the max number of interactors to show no more than 10.

2.7. Statistical Analyses

To visualize specific relationships, correlation network analysis was performed using the online server OmicStudio tools (https://www.omicstudio.cn/tool, accessed on 26 April 2022). The data were analyzed with Excel 2010 (Microsoft Corp., Redmond, WA, USA); Sigmaplot v14.0 (Systat Software, San Jose, CA, USA) software was used to create column and line charts. Significant differences in anthocyanin contents or gene expression levels in different samples were determined using Duncan’s multiple range test (p < 0.05) in the ANOVA (analysis of variance) program of SPSS 19.0 (SPSS Inc., Chicago, IL, USA).

3. Results

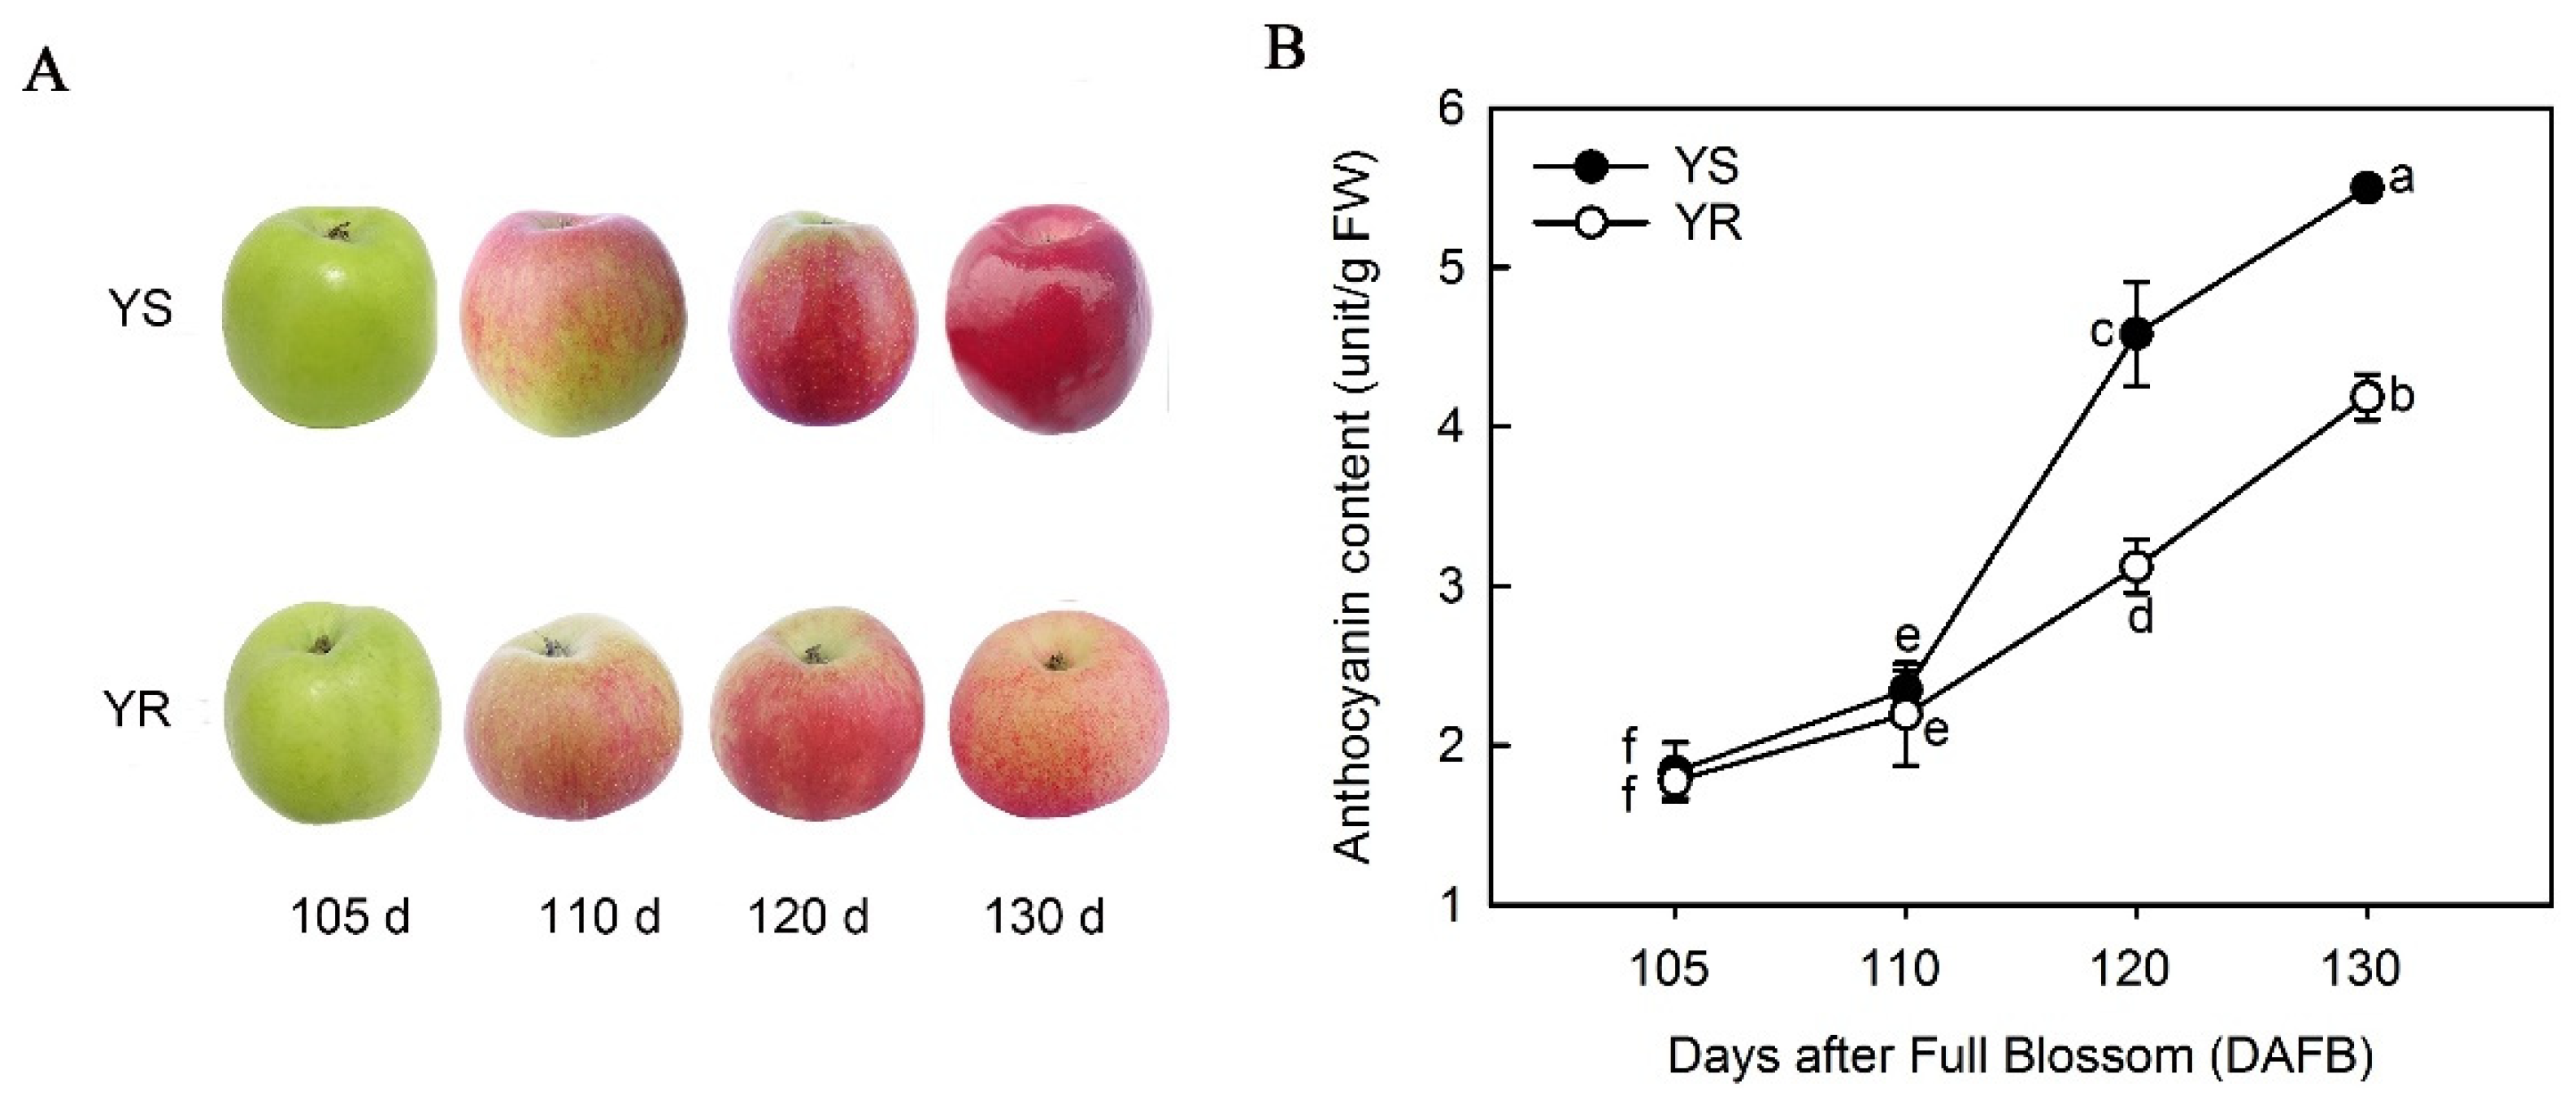
3.1. Differences in Anthocyanin Types and Total Content between Apple Cultivars

The total anthocyanin content of YS and YR was determined using ultraviolet spectrophotometry. Figure 1A illustrates the phenotype of YS and YR, showing different degrees of coloration over the color transition period; 130 DAFB was the commercial maturation stage of YS. The entire surface of YS was a strong red color at 130 DAFB, while YR was much lighter in color. The total anthocyanin content gradually increased over time, and was significantly higher in YS than YR at 120 and 130 DAFB (Figure 1B).
A total of 13 different anthocyanins were detected using HPLC-ESI-MS/MS, of which six were cyanidins, three were peonidins, two were pelargonidins, and the remaining two were delphinidins (Table S2). Changes in anthocyanin content were not consistent throughout the color transition period. Levels of cyanidin-3-O-rutinoside and delphinidin-3-O-arabinoside did not increase gradually during the color transition period, while delphinidin-3-O-glucoside was only detected in the last color transition stage of YR. Therefore, the 10 gradually accumulated anthocyanins were selected for analysis (Figure 2). Cyanidin-3-O-galactoside showed the highest level among all anthocyanins in both cultivars, reaching >5000 μg·g−1 g at 130 DAFB in YS, followed by cyanidin-3-O-arabinoside and cyanidin-3-O-xyloside. In the early color transition stages, some anthocyanins had higher levels in YR than in YS; however, most anthocyanins were significantly less abundant in YR than in YS at 130 DAFB (Figure 2).

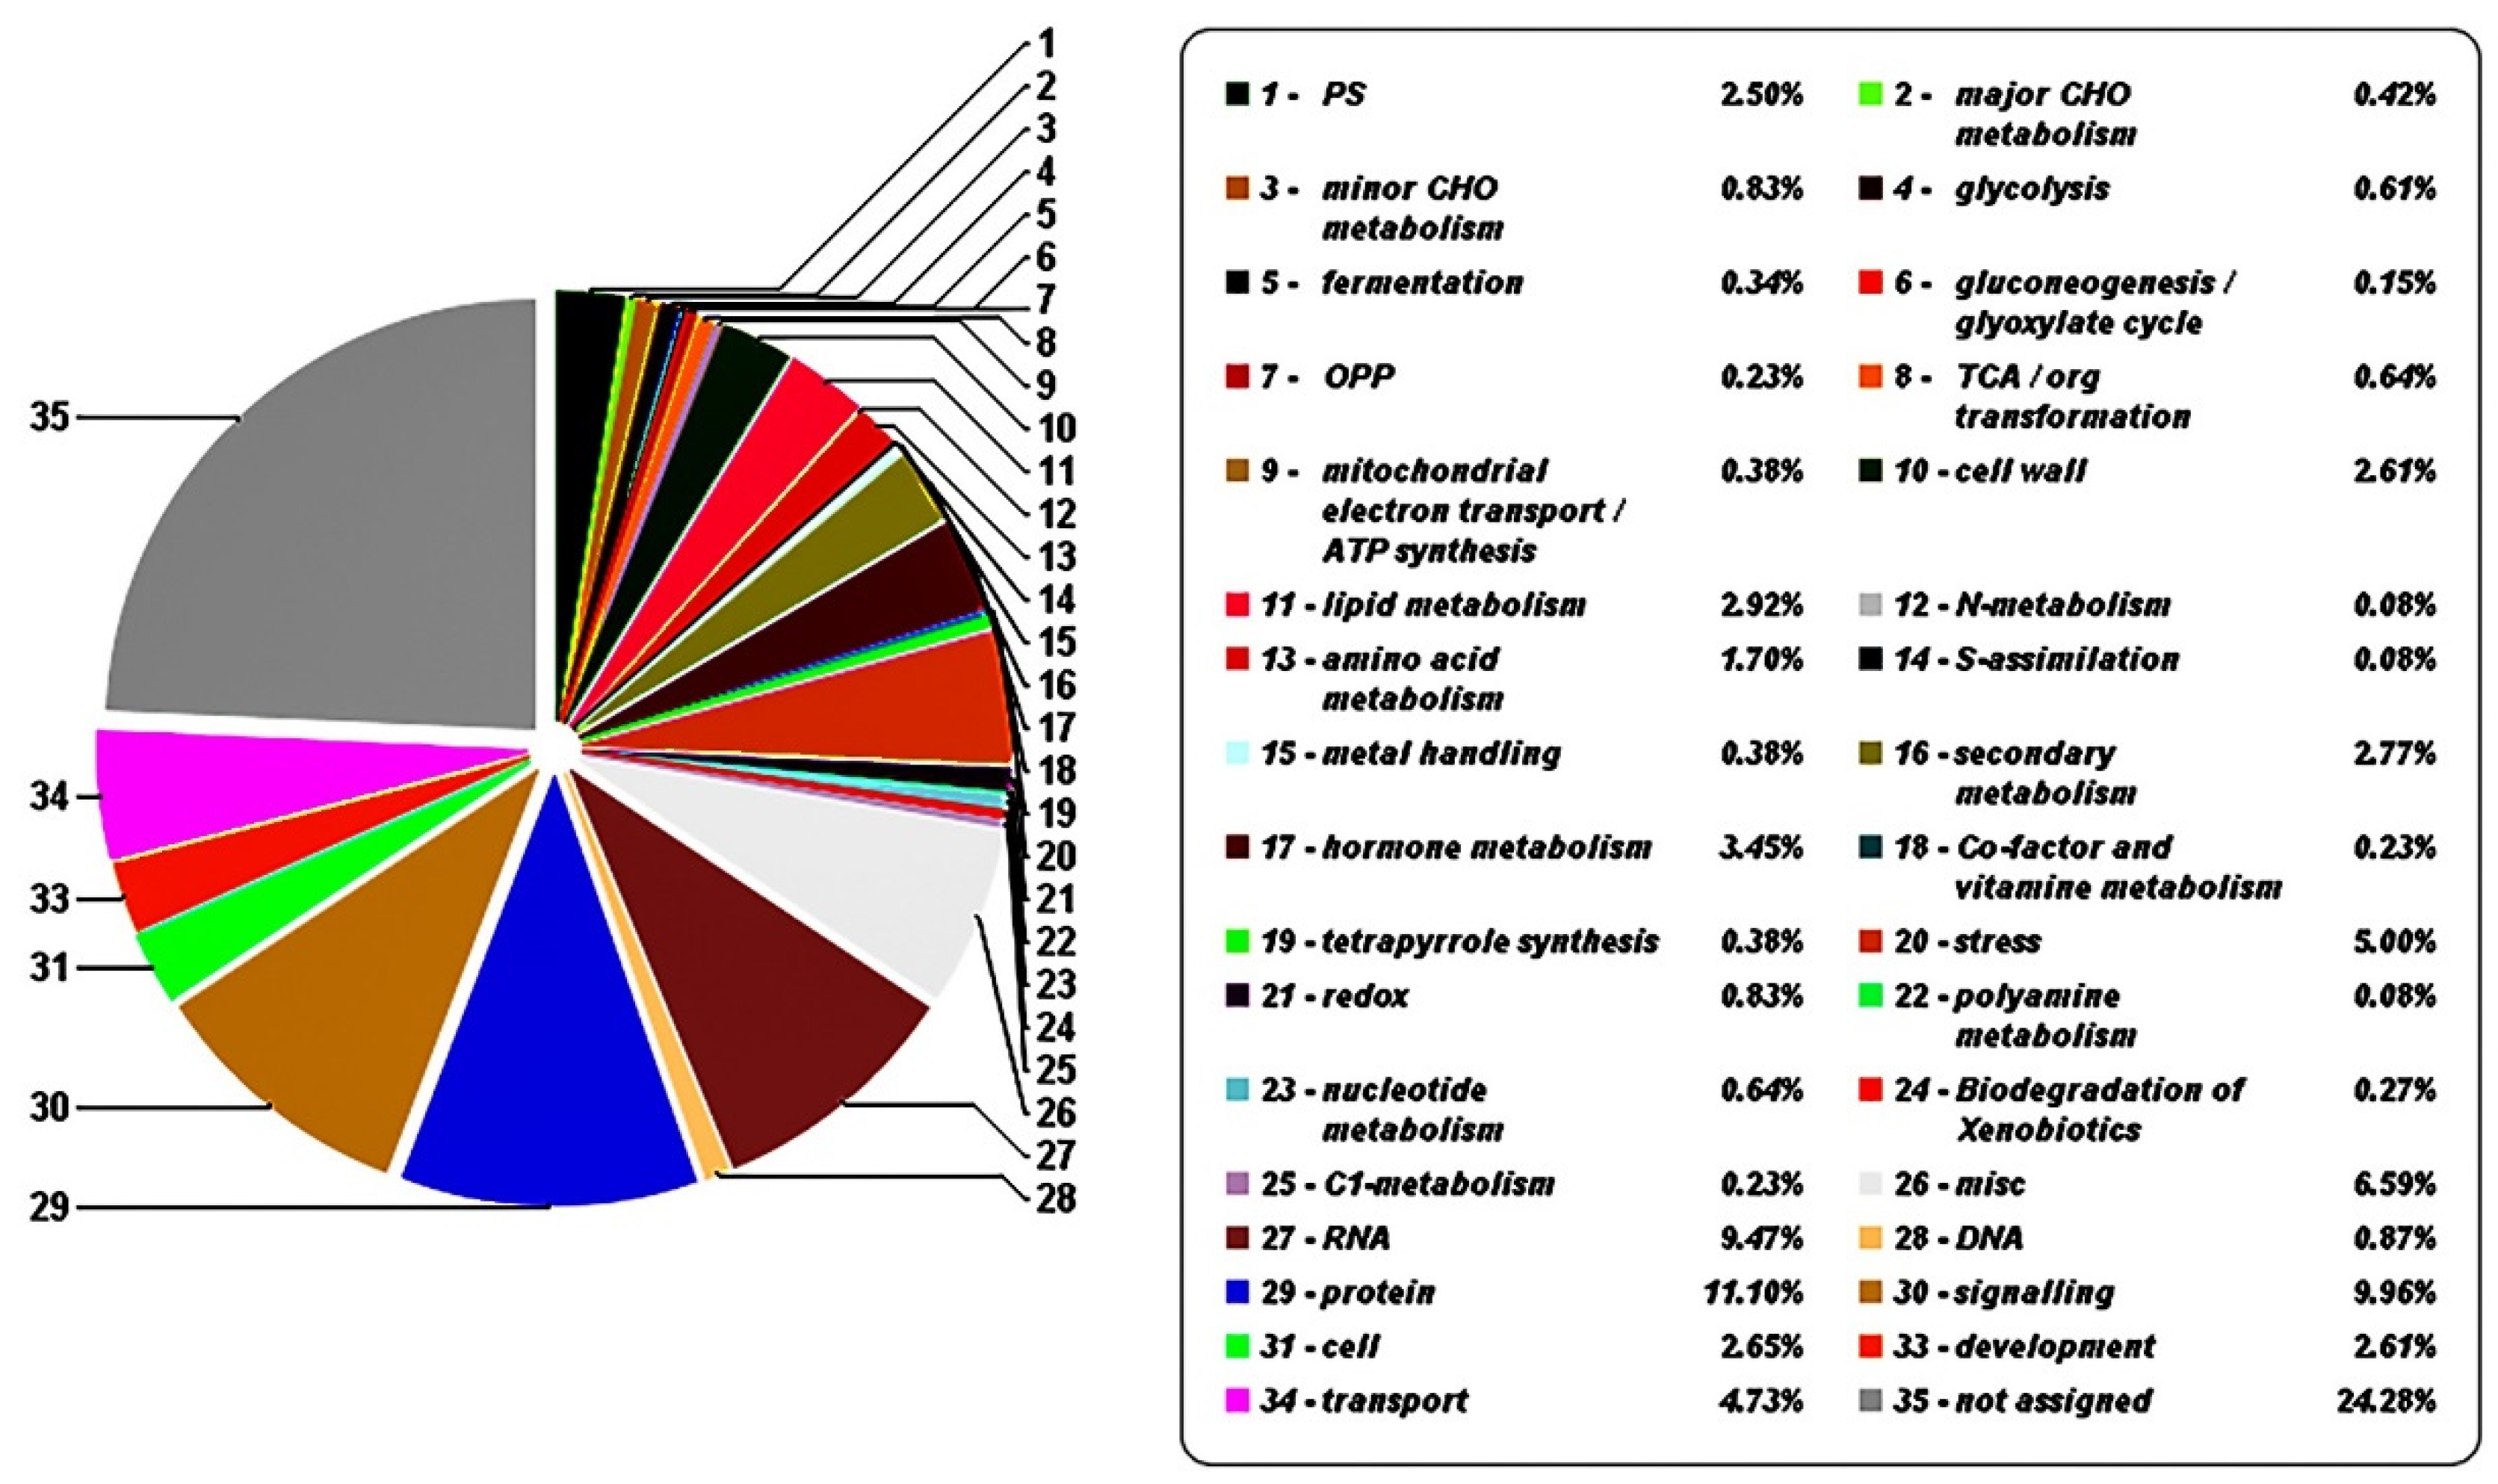
3.2. Transcriptome Sequencing and Analysis

Four sampling time points underwent transcriptome sequencing for each cultivar. Sample quality control data are shown in Table S3, including the total base count, average read length, Q20 base ratio, Q30 base ratio, and GC base ratio. Among these, the Q20 base ratio was over 97%, while the Q30 base ratio was >90%. In each sample, most genes were between 1–10 bp and 10–100 bp in length, with fewer genes between 0.5–1 bp or >100 bp in length (Figure S1). The average gene expression level in YS and YR fluctuated slightly, with the gene expression in HS showing a downward trend. Meanwhile, the gene expression in HR showed larger differences in average expression level (Figure S1). To further confirm the RNA-Seq results, qRT-PCR analysis was performed on randomly selected genes (Figure S2). It can be seen that the FPKM (Fragments Per Kilobase of exon model per Million mapped fragments) values by RNA-seq were consistent with the transcript levels by qRT-PCR, suggesting that the sequencing data are reliable.

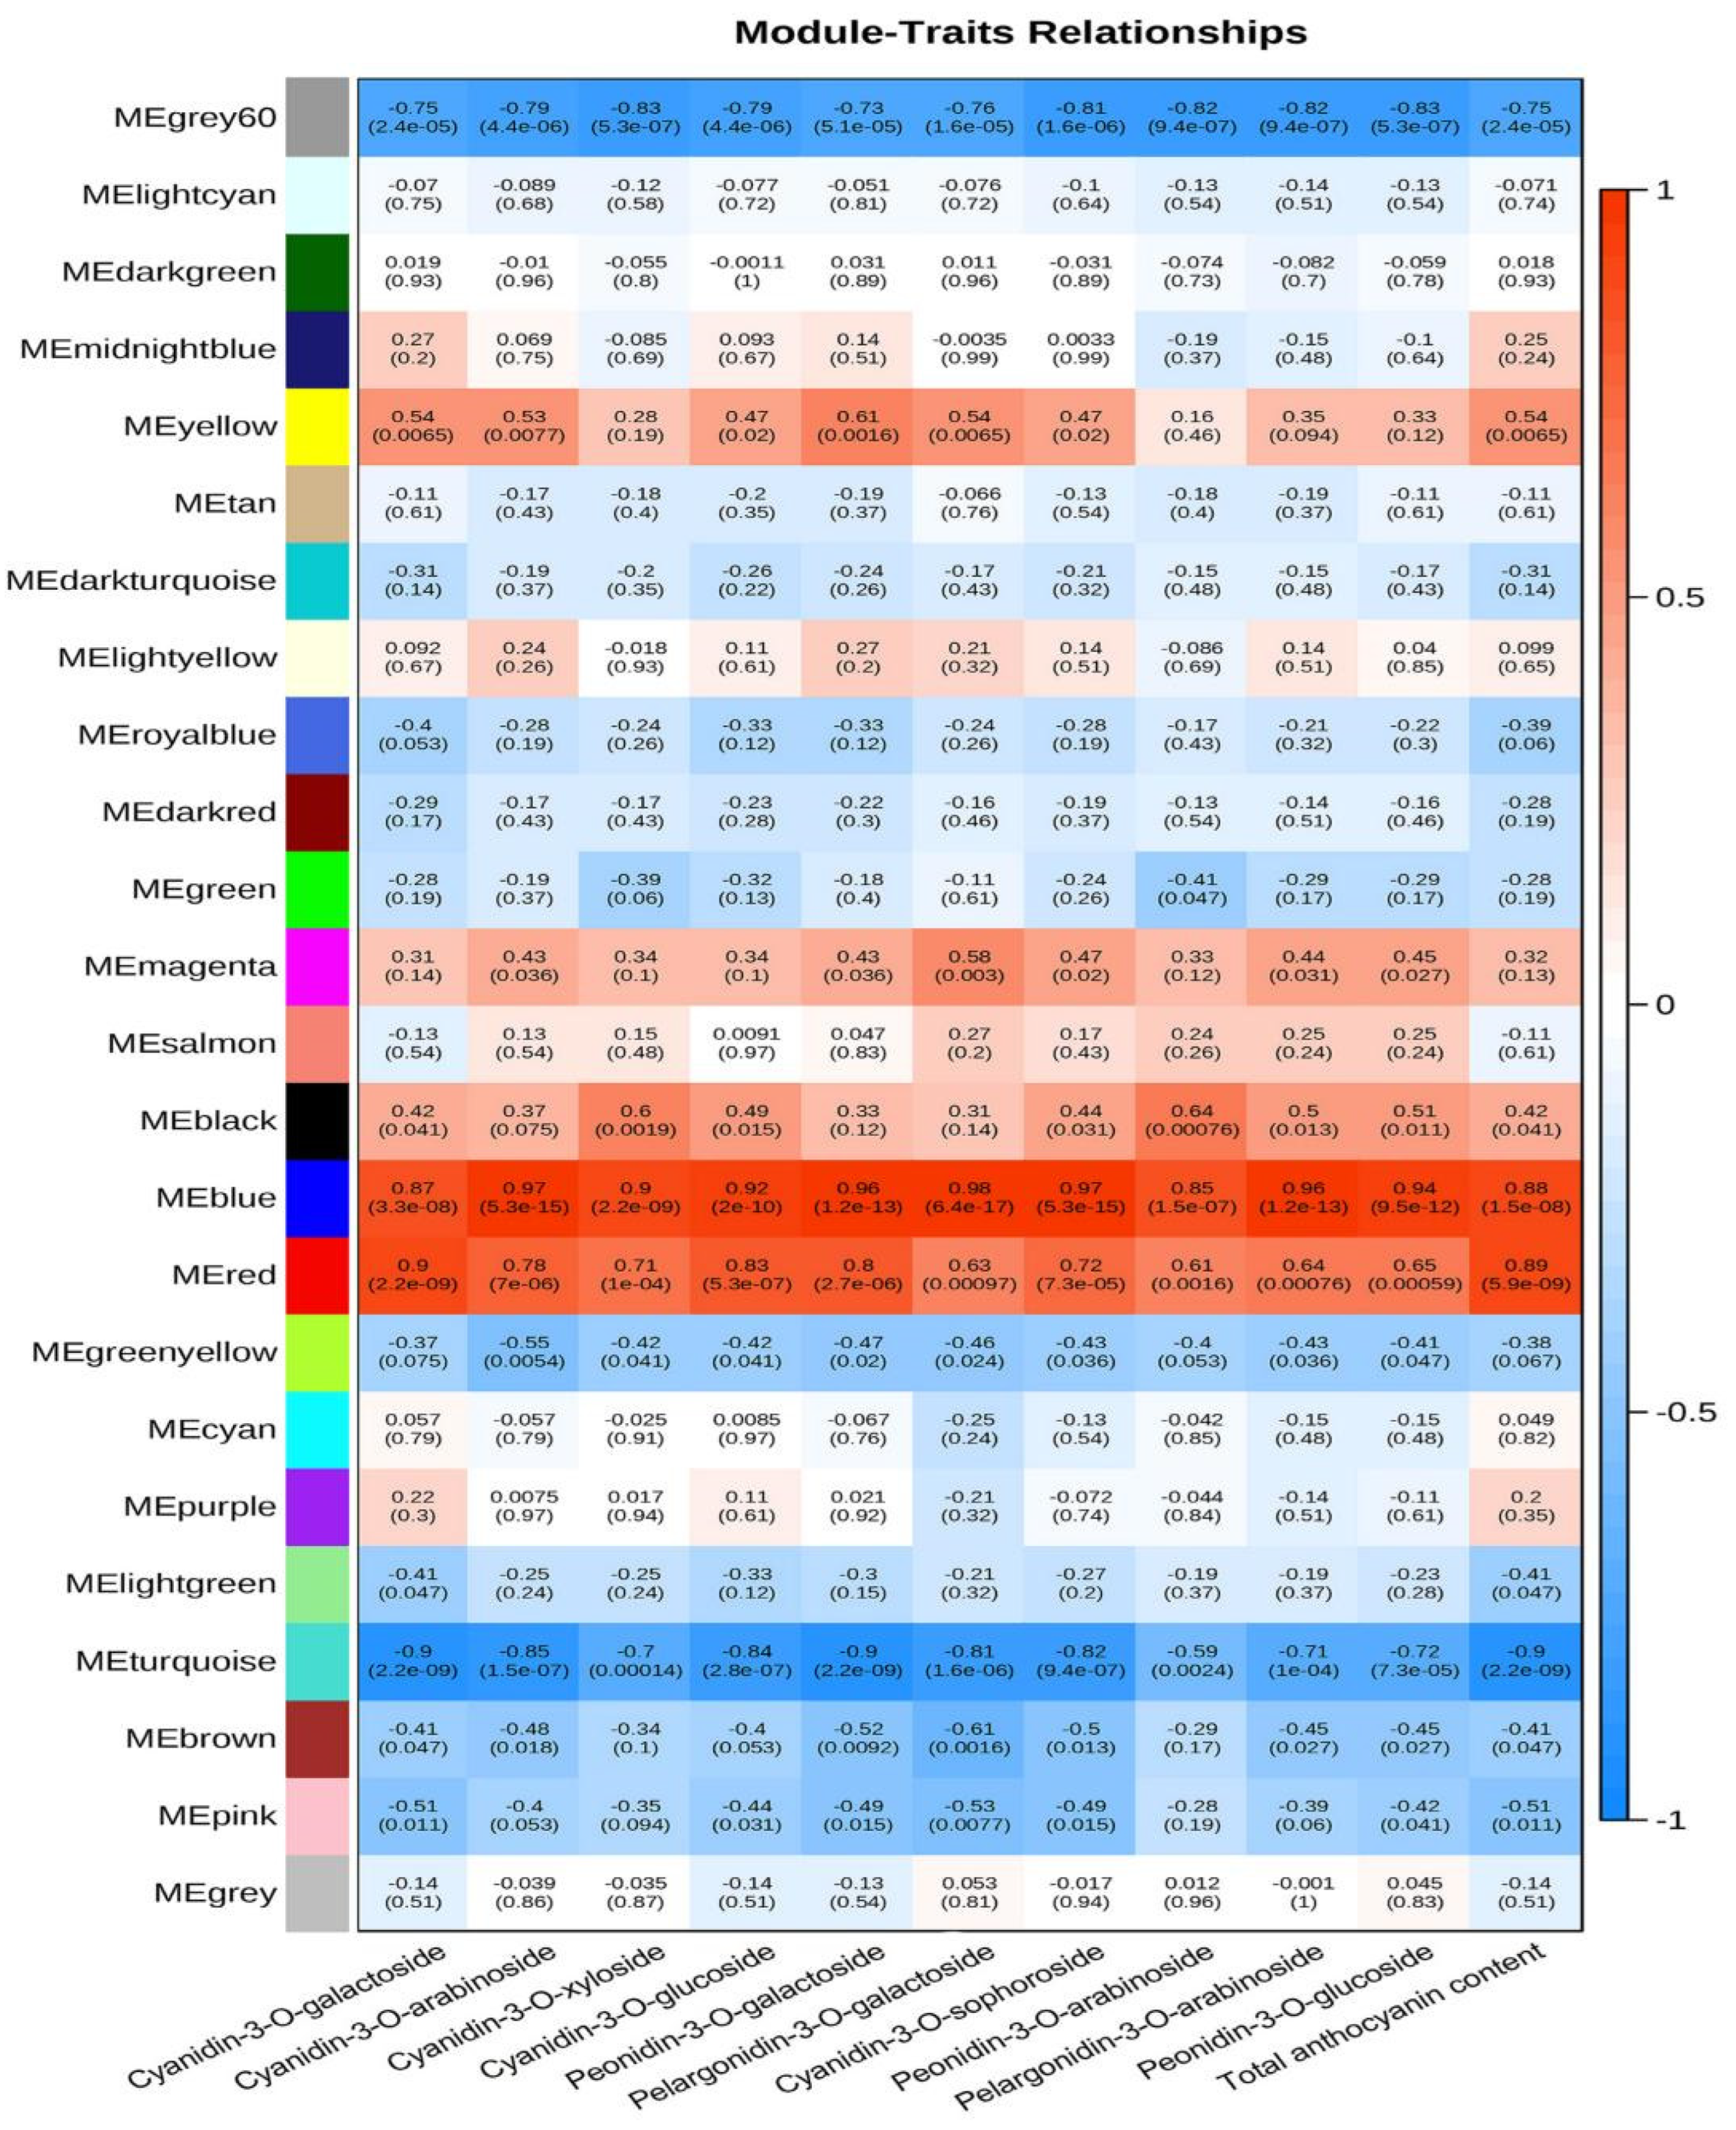
3.3. WGCNA Analysis of Anthocyanin Contents and Transcriptome Data

Ten different anthocyanins and total anthocyanin content underwent WGCNA analysis (Figure 3). Different modules represent a class of genes whose transcript levels were consistent with the accumulation of this type of anthocyanins. As shown in Figure 3, for the color of each module, the brighter the red, the higher positive correlation, while the brighter the blue, the higher negative correlation. Highly positive correlated genes were mainly distributed in the blue and red modules, while highly negative correlated genes were mainly distributed in the grey60 and turquoise modules. The screened genes based on the correlation value of ≥0.8 or ≤−0.8 were annotated using the plaBi database. Figure 4 shows the proportions of different gene categories. All genes were divided into 35 subclasses. Functions associated with signaling, RNA, protein, and stress transport accounted for a relatively high proportion. The 16th subclass was secondary metabolites, accounting for 2.77%, while the 17th subclass was hormone metabolism, accounting for 3.45%. TFs were in the 27th subclass, accounting for 9.47%.

3.4. Expression of Genes Associated with Regulation of Anthocyanin and Phenylpropanoid Metabolism

Several genes from the 16th subclass (Figure 4) were associated with anthocyanin and lignin synthesis, both of which belong to the phenylpropanoid pathway. These genes are schematically represented in Figure 5. Transcript levels of these genes gradually increased throughout the color transition period. During the four sampling time points, transcript levels of structural genes upstream of anthocyanin synthesis pathway, including PAL, C4H, CHS, CHI, and DFR, were higher in YS than in YR. The expression trends of PAL, CHI, and DFR determined by qRT-PCR were consistent with those of the transcriptome data (Figure S2). Moreover, the transcript levels of genes associated with flavonol and lignin synthesis, such as FLS (flavonol synthase), CCoAOMT (caffeoyl CoA O-methyltransferase), CCR (caffeoyl CoA reductase), C3H (p-coumarate 3-hydroxylase), HCT (hydroxycinnamoyl-coA shikimate/quinate hydroxycinnamoyl transferase), and CAD (cinnamoyl alcohol dehydrogenase), also gradually increased as the color deepened. C4H had two copies with similar expression levels over the entire color transition period; CHI had three copies, one of which had significantly higher levels than the other two during the entire color transition period. FLS had two copies with inconsistent expression levels, although the expression levels of these copies gradually increased throughout the color transition period. Regarding genes associated with lignin synthesis, the expression levels of HCT, CCoAOMT, and CAD in YS were much higher than those in YR.
Furthermore, some hormone-related genes may also play key roles in anthocyanin accumulation. WGCNA revealed that the absolute value of the correlations between these genes and anthocyanin levels reached >0.8 (Table S4). Among them, the transcripts of CTK (cytokinin), JA (jasmonic acid), ETH (ethylene), and SA (salicylic acid) were positively correlated with the anthocyanin content. Meanwhile, ABA (abscisic acid) had one transcript that was negatively correlated with anthocyanin accumulation, while BR (brassinolide) and GA (gibberellic acid) had two. Among the 12 transcripts of auxin, 7 were positively correlated with anthocyanin content and 5 were negatively correlated (Table S4).

3.5. Key Transcription Factors and Structure Genes Associated with Anthocyanin Accumulation and Their Interaction Network
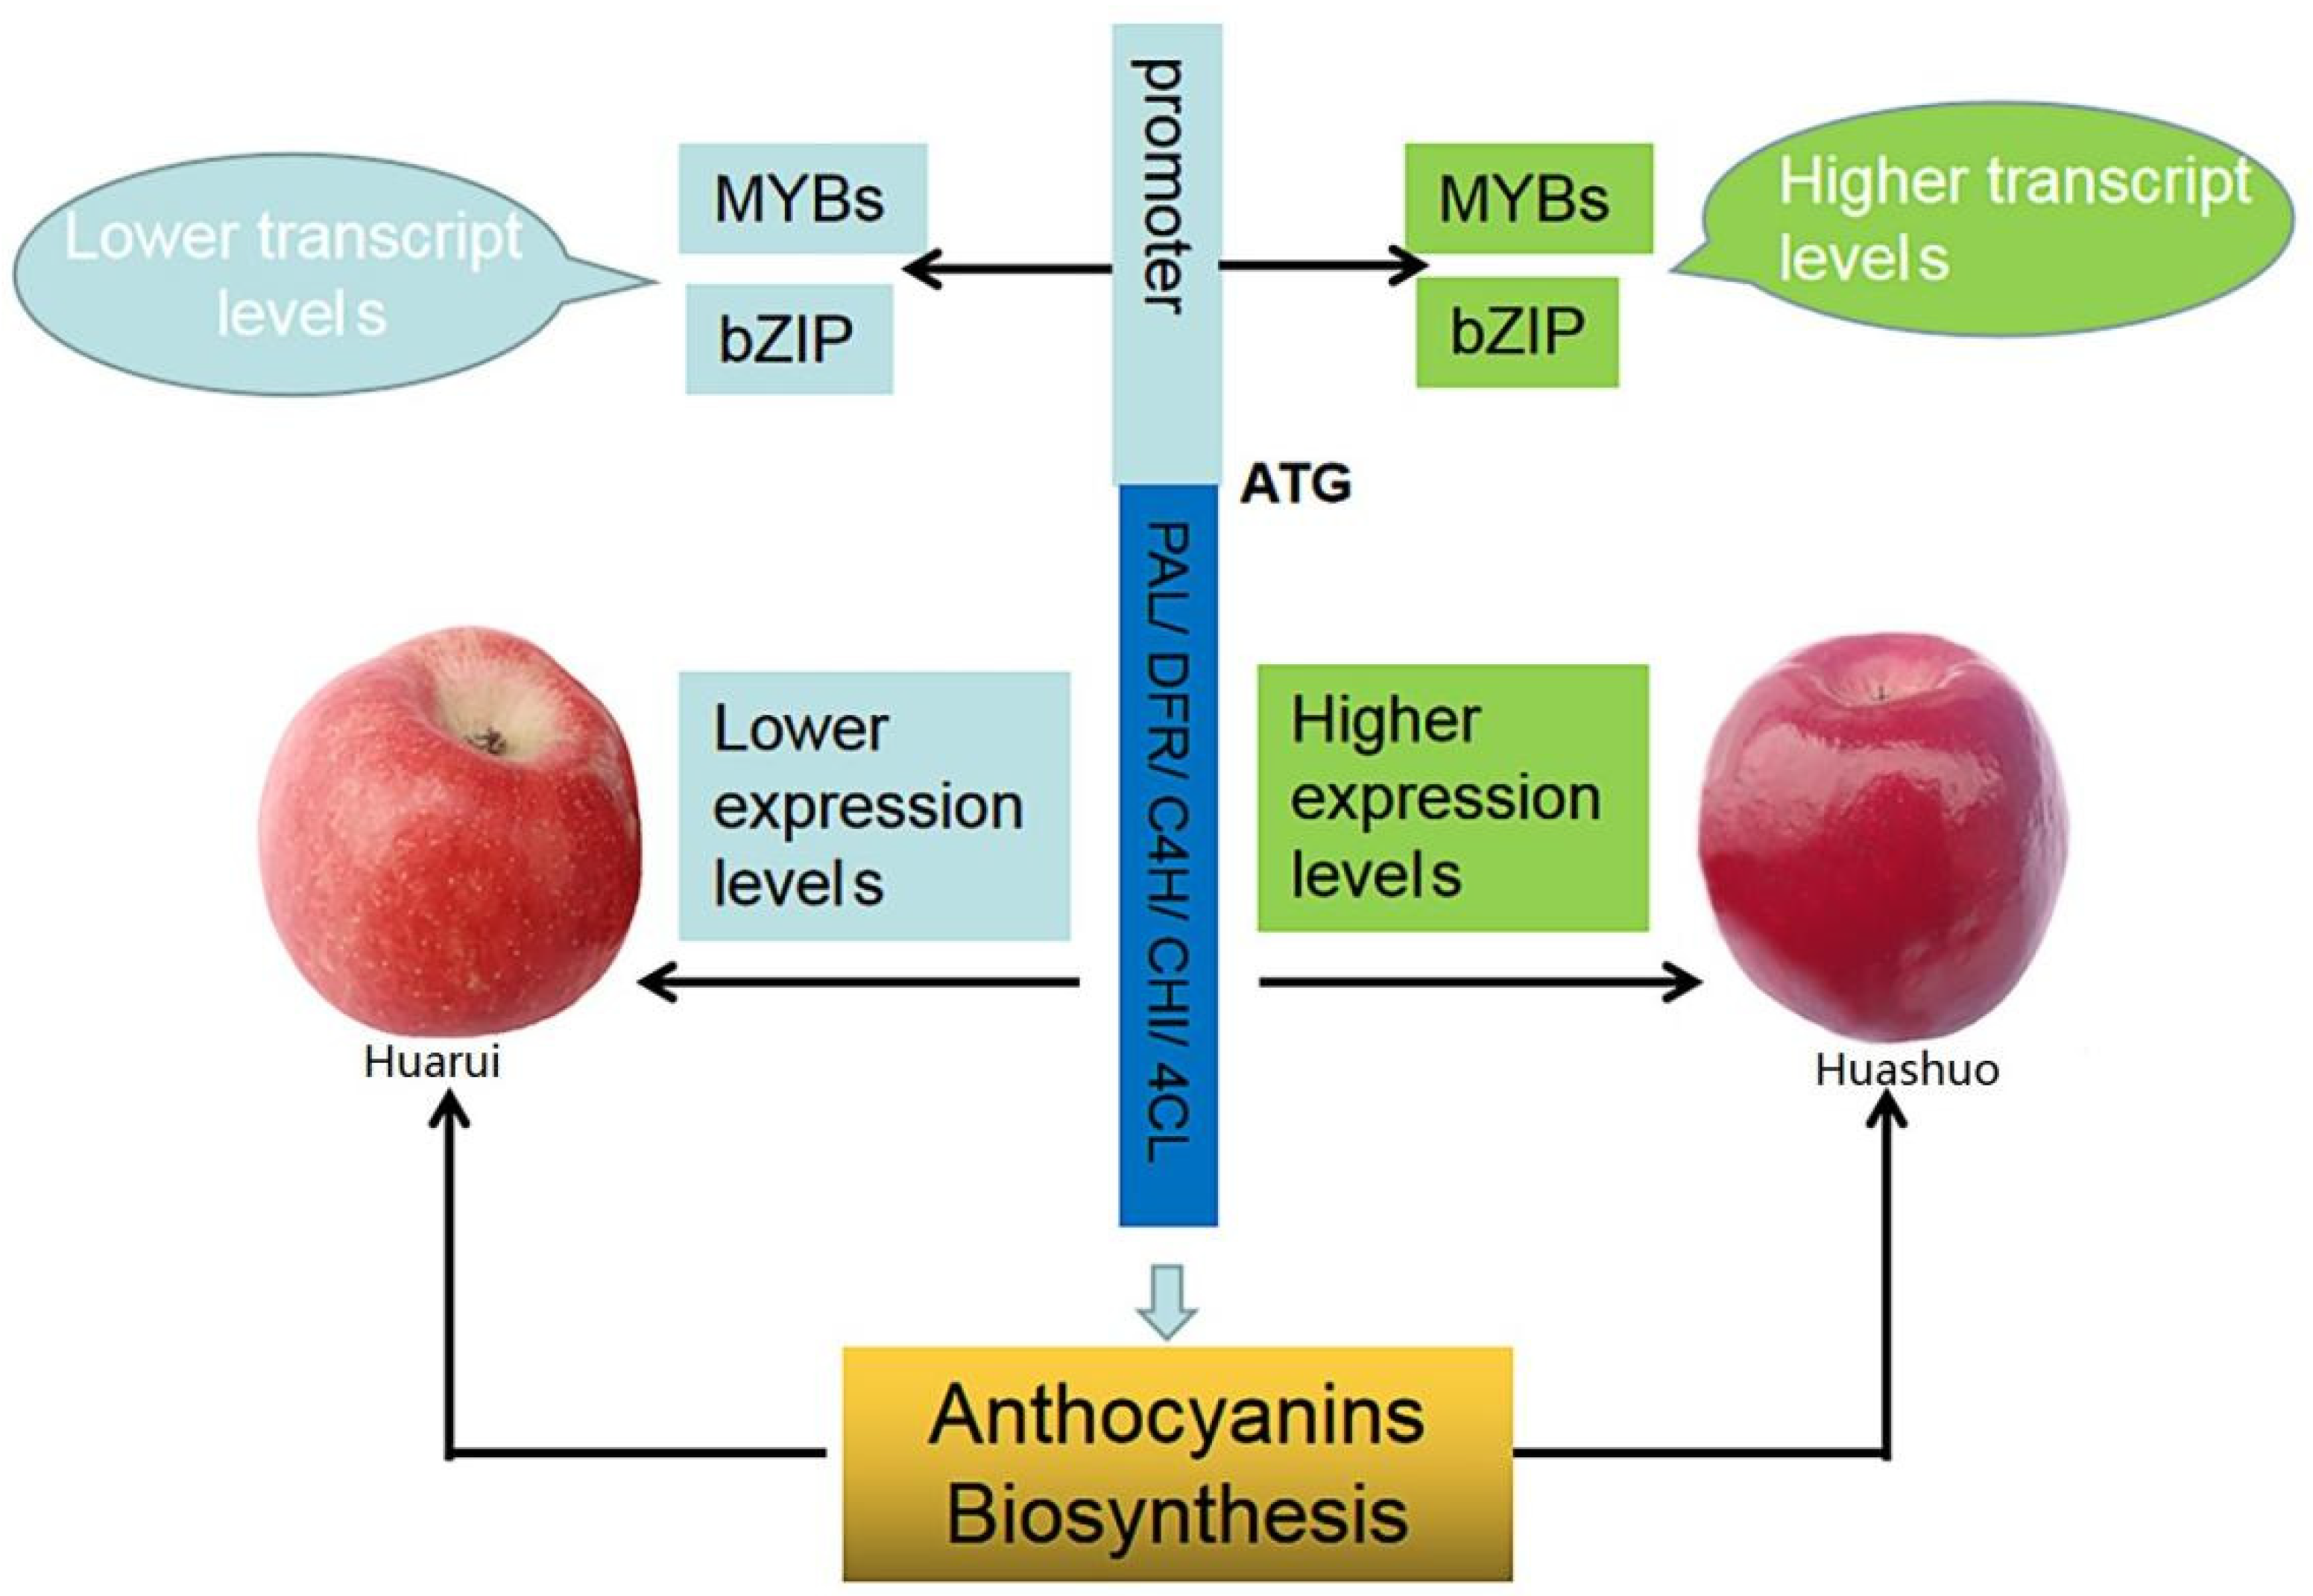
Several AP2/EREBP, ARF, C2C2, C2H2, HB, bHLH, MYB, and WRKY family TFs correlated with anthocyanin accumulation (Table S5), six of which were predicted to interact with anthocyanin-related proteins using the STRING server (Figure 6). Among them, five TFs belonged to the MYB family, while one belonged to the bZIP family. MDP0000140609 was most likely MYB12 and annotated as an anthocyanin regulatory protein, and the interactions with F3H, TT1 (transparent testa 1), and TTG1 (transparent testa glabra1-like, a WD40 protein) were experimentally determined, while the interactions with ANR (anthocyanidin reductase, catalyze anthocyanidin to form proanthocyanidin) was predicted (Figure 6A). MDP0000250597 was annotated as MYB308-like protein and could interact with ANR, naringenin,2-oxoglutarate 3-dioxygenase, ALY (always early) proteins, PRP8 (pre-mRNA-processing-splicing factor 8), REVEILLE3, REVEILLE3-like, and SYF2 (pre-mRNA-splicing factor 2) (Figure 6B). MDP0000284922 was predicted to be similar to the MYB-related 306-like protein in the string database, while the annotation in the plaBi database was putative MYB109 protein; this was predicted to interact with DFR and naringenin,2-oxoglutarate 3-dioxygenase, but the interaction with DFR was not verified (Figure 6C). MYB16 (MDP0000950559) was involved in the response to UV-B according to the gene annotation, and interacted with TT1 and GATA7, and also was predicted to interact with other proteins such as MYBs, KUA1 (KUODA1)-like, and stress-enhanced protein 2 (Figure 6D). MDP0000074681 was annotated as MYB-related TF family, possibly MYB1R1-like protein, and predicted to interact with MYB16, MADS23 (MADS-box transcription factor 23), molybdate transporter 1, molybdate transporter 1-like, NADH kinase, NADH kinase-like, MYBR7, HMGB15 (high mobility group B protein 15), HBP-1B(c38)-like (hex-motif-specific DNA-binding protein 1B subfamily c38), and another unnamed MYB (Figure 6E). The HY5-like (MDP0000834642), which belongs to the bZIP family, was predicted to interact with HY5, which integrates light and hormone signaling pathways, and several COP1 (constitutive photomorphogenesis protein 1), COP1-like, FHY3 (far-red elongated hypocotyl 3)-like, and FHY3-like isoform proteins (Figure 6F).
According to the prediction results of the above key TFs, some TFs can interact with F3H or DFR which are directly involved in anthocyanin biosynthesis. In addition, we selected other genes, 4CL and CHI, which the transcription levels in the whole color transient period in YS were much higher than that in YR, for interaction analysis. Since the correlation between the dynamic accumulation of anthocyanin and the transcription level of F3H was <0.8, we only selected DFR, 4CL, and CHI for protein interaction prediction (Figure S3). DFR (MDP0000607969) can interact with FLS, ANS, F3H, and other proteins related to anthocyanin biosynthesis (Figure S3A). The 4CL (MDP0000691789) can interact with proteins of anthocyanin synthesis (F3H, PAL, and probable CHI3) and lignin synthesis (CCoAOMT, CCR1-like) related, along with some other enzymes (naringenin,2-oxoglutarate 3-dioxygenase and feruloyl CoA ortho-hydroxylase 1-like) (Figure S3B). The CHI (MDP0000205890) can interact with 4CL, ANS, F3H, CHI isoform, anthocyanin synthesis-related proteins, and other enzymes.

4. Discussion

The anthocyanin biosynthesis pathway is a well-studied secondary metabolite pathway in plants [52]. The mechanism of action of structural genes has been well described, while several TFs involved in the regulation of anthocyanin biosynthesis have been identified. Herein, we have identified the material basis for the coloration differences between sister lines Huashuo and Huarui, discovered associated key TFs, and analyzed the expression of structural genes over the entire color transition period for both cultivars.
Anthocyanin accumulation is responsible for the apple skin’s observed red color [53]. Cyanidin-3-O-galactoside, the primary anthocyanin in apple peel, accounts for >85% of the total anthocyanin content. Other anthocyanins, such as cyanidin 3-O-arabinoside and cyanidin 3-O-glucoside have also been identified in apple peel [53,54]. Tsao et al. [55] suggested that cyanidin 3-O-galactoside is unique and only found in red apple peels. In the current study, the anthocyanin content increased as the peel’s red color gradually deepened. Moreover, cyanidin 3-O-galactoside levels were highest among anthocyanins in both YS and YR (Figure 2), which is consistent with previous findings [53,56]. The difference in peel coloring between the two cultivars was primary attributed to the high accumulation of anthocyanins, not differences in anthocyanin type, since a gradual increase in anthocyanins levels was detected in both cultivars. Moreover, some anthocyanins were not detected in the early color transition stages for either YS or YR, possibly due to their low concentrations.
Anthocyanins are synthesized via the phenylpropanoid pathway. Phenylpropanoid metabolism produces structurally diverse plant secondary metabolites such as anthocyanins, flavonoids, lignins, and proanthocyanidins [57]. Anthocyanin biosynthesis is related to the key structural genes involved in flavonoid and anthocyanin biosynthesis, such as PAL, CHS, CHI, F3H, DFR, ANS, and UFGT [56]. PAL is a key rate-limiting enzyme in the flavonoid pathway located upstream of the anthocyanin synthesis pathway [58]. In this study, the expression of PAL in YS and YR gradually increased during the color transition period; at each time point, PAL expression in YS was higher than that in YR, which might have accelerated anthocyanin accumulation in YS (Figure 5). C4H expression remained at a high level in both cultivars, even in the first color transition stage. Previous studies have reported that anthocyanin production in plants does not always correlate with the transcriptional activity of the first two genes, CHS and CHI [59,60]; our findings indicated a high correlation between transcript levels of these genes with anthocyanins accumulation. Although not every transcript had the same expression level, one of these genes might have played a major role in anthocyanin accumulation (Figure 5). Kim et al. [61] isolated cDNA clones for F3H, DFR, ANS, and UFGT from apple skins, and reported preferential expression in apple skin tissue, especially red skin, which was light induced. In the current study, DFR expression in YS was significantly higher than that in YR, while the correlation with anthocyanin content reached 0.91, suggesting that DFR might be the key gene promoting anthocyanin accumulation.
Specific genes involved in the lignin and flavonoid biosynthesis pathways were also identified in the current study. The expression of these genes gradually increased as the fruit ripened and red color deepened. Anthocyanin and lignin biosynthesis are metabolically interconnected and diverged in their central metabolite, 4-coumaroyl CoA. C4H is known to play a key role in lignin biosynthesis [62]. Ring et al. [63] suggested that the downregulation of CHS and concomitant induction of FaPRX27 expression diverted the flux from anthocyanins to lignin. CHS expression was much higher than that of genes associated with the lignin and flavonol synthesis pathway genes during the color transition period in YS and YR, indicating that many substrates are involved in the synthesis of anthocyanins. These results highlight the competition between the different phenolic pathways for their common precursors.
Hormones can regulate anthocyanin formation [52]. Endogenous ABA and ETH are important inducing factors for the accumulation and synthesis of anthocyanin. Further, IAA (indole-3-acetic acid) has been shown to restrain the accumulation of sugars and anthocyanin synthesis in blueberries, although the regulatory function of GA3 remains unclear [64]. Li et al. [65] suggested that IAA had a positive regulatory effect on the synthesis of anthocyanins in apples, whereas GA had the opposite effect. A previous study also showed that application of ETH to strawberries at the immature stage repressed anthocyanin biosynthesis [66]. These findings demonstrate that hormones may play different roles in different maturation stages of different species. In the current study, various hormones were strongly correlated with anthocyanin accumulation (Table S4), suggesting that different transcripts of the same hormone may promote or inhibit anthocyanin accumulation through various mechanisms, such as interaction with MYB, bZIP, or other TFs.
In addition to its key structural genes, anthocyanin biosynthesis is regulated by several TFs, such as members of the MYB, MADS-box, bHLH, WD40, bZIP, and WRKY families [67,68]. Numerous TFs, including AP2/EREBP, MYB, bHLH, C2C2, WRKY, C2H2, HAP, HB, and AS2 families, were identified in the correlation analysis between the transcriptome and anthocyanin metabolome (Table S5), of which only six were predicted to be related to anthocyanin accumulation. Studying interaction networks contributes to a better understanding of protein biological functions and molecular processes. The anthocyanin type, correlation value, and positive or negative correlation with specific TFs are shown in Figure S4. Five MYBs and one bZIP TF were predicted to interact with anthocyanin-related proteins such as F3H, DFR, 4CL, TT1, TTG, and other TFs or intermediate enzymes (Figure 6). The TT1 gene encodes a WIP-type zinc finger protein and is required for correct expression of proanthocyanidin-specific genes in the seed coat of Arabidopsis thaliana, but also affects CHS, a key gene related to anthocyanin synthesis [69]. The TTG1 is a WD40 protein and controls the biosynthesis of anthocyanins and proanthocyanidins by interacting with bHLH proteins [70]. Among the five MYB TFs, MYB12 (MDP0000140609) showed interaction with F3H, TT1, TTG, ANR, and naringenin,2-oxoglutarate 3-dioxygenase (an intermediate in flavonoid biosynthesis in plants), all of which are linked to anthocyanin metabolism but also other TFs such as WRKY27 and EGL1-like (Figure 6A). It was reported that MdWRKY72 promotes anthocyanin accumulation by indirectly binding to the MdHY5 promoter and directly binding to the MdMYB1 promoter [33]. Mao et al. [32] reported that the MdHY5-MdWRKY41-MdMYB TF cascade regulates the anthocyanin and proanthocyanidin biosynthesis in red-fleshed apples. Therefore, WRKY27 may interact with MYB12 to regulate anthocyanin accumulation. The bHLH TF EGL1 (enhancer of glabra 1)-like might participate in anthocyanin synthesis as EGL1 was thought to play a role in anthocyanin synthesis in pepper [Zhou 2020], furthermore, EGL3 which was known to regulate anthocyanin biosynthesis in Arabidopsis [71]. AHA10, a P-type proton pump which MYB12 interacted with, was reported to play a role in the formation of proanthocyanidins [72], so we speculate that it may indirectly affect the synthesis and transportation of anthocyanins. MYB308-like showed interaction with ANR and naringenin,2-oxoglutarate 3-dioxygenase (Figure 6B), hence, it might affect the final content of anthocyanin. Of other TFs, ALY protein is required for the meiotic cell cycle and is essential for spermatogenesis [73], REVEILLE 3 is an MYB-like TF that plays a photoperiod role in growth regulation [74], and PRP8 and SYF2 are pre-mRNA-splicing-related proteins according to the annotation of the STRING database. All of these proteins can interact with MYB308-like, indicating that MYB308-like might participate in multiple life processes, not only affecting the anthocyanin metabolism. The MYB-related 306-like exhibited interaction with the anthocyanin synthesis structural gene DFR and naringenin,2-oxoglutarate 3-dioxygenase (Figure 6C), suggesting that it might have a function in anthocyanin accumulation. According to the gene annotation by plaBi database, MYB16 encodes a R2R3 MYB protein which is involved in the response to UV-B, and one of its target genes is C4H; this indicated it might participate in anthocyanin accumulation. Moreover, the interaction of the MYB16 protein with TT1 also suggested that they might be involved in anthocyanin biosynthesis. While MYB1R1-like exhibited interaction with MYB16 (Figure 6D,E), suggesting that it might indirectly affect anthocyanin accumulation. Several MYB genes have been reported to regulate anthocyanin biosynthesis by directly or indirectly interacting with the structural genes. For instance, MdMYB90-like regulates anthocyanin biosynthesis directly through the activation of anthocyanin biosynthesis genes (MdCHS and MdUFGT), and indirectly through the activation of other genes (MdMYB1 and MdbHLH3) that activate anthocyanin biosynthesis [23]. The MYB16 and MYB1R1-like proteins’ interaction with other proteins such as KUA1-like, stress-enhanced protein2, GATA7, MYBR2, MYBR7, MYBS3-like, MADS23, HMGB15, HBP-1b(c38)-like, NADH kinase-like, and molybdate transporter 1 indicated that they were associated with diverse functions in plants.
Another TF family, bZIP, was also reported to play a role in anthocyanin biosynthesis in apples. bZIP family TFs MdHY5 [34] and MdbZIP44 promoted anthocyanin accumulation by regulating downstream anthocyanin biosynthesis genes in apples [75]. In the current study, we identified a bZIP TF HY5-like (Figure 6F) which was predicted to interact with HY5, a light-induced gene that promotes anthocyanin accumulation by regulating the expression of MdMYB10 and downstream anthocyanin biosynthesis genes [34]. Therefore, we believe that the HY5-like may also play a vital role in light-induced color change in apple peel. The HY5-like protein showed interaction with the COP1, COP1-like, or isoform proteins, which are known as the RING-finger E3 ubiquitin–protein ligase constitutive photomorphogenesis protein. According to one study in Arabidopsis, COP1 is a light-inactivable repressor of photomorphogenic development and negatively regulates HY5 [76]. The COP1 was reported to interact with MdMYB1 to regulate light-induced anthocyanin biosynthesis and red fruit coloration in apples [77]. As is well known, MdMYB1 is a crucial regulator of fruit coloration in apples [11]. Thus, all of the above showed that HY5-like might be a critical TF related to anthocyanin metabolism. Other proteins that interacted with HY5-like were named FHY3-like or FHY3-like isoform. It was reported that FHY3 is a far-red elongated hypocotyl protein involved in regulation of gene expression by the phytochrome A-signaling pathway [78], while the HY5 can also regulate stimulus-induced development of root and hypocotyl [79], so the interaction between HY5-like and FHY3-like (or isoform) proteins suggested that they might be involved in regulating the light signal and the hypocotyl elongation.
The role of TFs is essential as they can regulate multiple downstream response genes at the same time. Some of the TFs screened in the current study are known to be associated with the structural gene of anthocyanin synthesis, while others were predicted to interact with other TFs that regulate anthocyanin accumulation. We speculate that the differential expression of the six TFs induce changes in the expression of anthocyanin synthesis-related structural genes and alter endogenous hormones levels, resulting in phenotypic differences between YS and YR (Figure 7); this complicated process warrants further investigation. Most proteins predicted to interact with the DFR, 4CL, and CHI structural genes were anthocyanin-associated structural genes (Figure S3). In addition to the regulation of TFs, protein interactions of structural genes may also influence phenotype; however, further research is required to verify this hypothesis.

5. Conclusions

The molecular mechanisms underlying anthocyanin accumulation in YS and YR were analyzed using metabolomics, transcriptomic, qRT-PCR, and interaction analysis. At least 13 anthocyanins were detected in the peels of YS and YR, with cyanidin-3-O-galactoside identified as the major anthocyanin. The higher accumulation of anthocyanins in YS, rather than different types of anthocyanins, resulted in a different phenotype compared with YR. The transcriptome data revealed that most anthocyanin biosynthesis-related genes and at least six TFs were significantly correlated with anthocyanin accumulation, which likely contributes to the differential accumulation of anthocyanin in the sister apple lines. Our study findings provide a series of candidate genes with potential applications in the breeding of anthocyanin-rich cultivars.

Supplementary Materials

The following supporting information can be downloaded at: https://www.mdpi.com/article/10.3390/life12081246/s1, Figure S1: Number and average expression of genes in each sample of transcriptome; Figure S2: qRT PCR validation of expression levels of 6 randomly selected genes identified by RNA sequencing; Figure S3: Interaction network analysis for MdDFR, Md4CL and MdCHI; Figure S4: Correlation network of metabolites and genes (six key transcription factor) involved in phenylpropanoid and flavonoid biosynthesis in YS and YR; Table S1: Primers used for qRT-PCR; Table S2: Type and content of anthocyanins tested in this project; Table S3: Statistics of all sample quality control data. Table S4: Hormones related to anthocyanin accumulation; Table S5: Main transcription factor information.

Author Contributions

Project design, C.S. and D.G.; materials collection, Z.W. and Z.Y.; scientific experiments, J.L. and L.L.; data analysis, C.S.; writing—original draft preparation, C.S.; writing—review and editing, M.L. and D.G.; project administration, C.S. and D.G. All authors have read and agreed to the published version of the manuscript.

Funding

This study was supported by grants from the National Key Research and Development Program (2019YFD1001400), Scientific and Technological Research in Henan Province (212102110428), and the Central Public-interest Scientific Institution Basal Research Fund (1610192020104, 1610192022103).

Institutional Review Board Statement

The research content of the manuscript does not involve ethical issues.

Informed Consent Statement

The research content of the manuscript does not involve human issues.

Data Availability Statement

Sequence data from this work can be found in the NCBI database (SRA data: PRJNA857470).

Acknowledgments

We thank Xingkai Lu and Daoping Zhang for their help with the sampling process in Yunnan.

Conflicts of Interest

The authors declare no conflict of interest.

References

  1. Lev-Yadun, S.; Gould, K.S. Role of anthocyanins in plant defence. In Anthocyanins; Winefifield, C., Davies, K., Gould, K.S., Eds.; Springer: New York, NY, USA, 2008; pp. 22–28. [Google Scholar]
  2. Zhang, Y.; Butelli, E.; Martin, C. Engineering anthocyanin biosynthesis in plants. Curr. Opin. Plant Biol. 2014, 19, 81–90. [Google Scholar] [CrossRef] [PubMed]
  3. Butelli, E.; Titta, L.; Giorgio, M.; Mock, H.P.; Matros, A.; Peterek, S.; Schijlen, E.G.; Hall, R.D.; Bovy, A.G.; Luo, J. Enrichment of tomato fruit with health-promoting anthocyanins by expression of select transcription factors. Nat. Biotechnol. 2008, 26, 1301–1308. [Google Scholar] [CrossRef] [PubMed]
  4. Li, X.; Li, Y.; Zhao, M.; Hu, Y.; Meng, F.; Song, X.; Tigabu, M.; Chiang, V.L.; Sederoff, R.; Ma, W.; et al. Molecular and metabolic insights into anthocyanin biosynthesis for leaf color change in chokecherry (Padus virginiana). Int. J. Mol. Sci. 2021, 22, 10697. [Google Scholar] [CrossRef]
  5. Liu, Y.; Zhang, X.; Zhao, Z. Effects of fruit bagging on anthocyanins, sugars, organic acids, and color properties of ‘granny smith’ and ‘golden delicious’ during fruit maturation. Eur. Food Res. Technol. 2013, 236, 329–339. [Google Scholar] [CrossRef]
  6. Jaakola, L. New insights into the regulation of anthocyanin biosynthesis in fruits. Trends Plant Sci. 2013, 18, 477–483. [Google Scholar] [CrossRef]
  7. Qian, M.; Yu, B.; Li, X.; Sun, Y.; Zhang, D.; Teng, Y. Isolation and expression analysis of anthocyanin biosynthesis genes from the red Chinese sand pear, Pyrus pyrifolia nakai cv. Mantianhong, in response to methyl jasmonate treatment and UV-B/VIS conditions. Plant Mol. Biol. Rep. 2014, 32, 428–437. [Google Scholar] [CrossRef]
  8. Telias, A.; Bradeen, J.M.; Luby, J.J.; Hoover, E.E.; Allen, A.C. Regulation of anthocyanin accumulation in apple peel. Hortic. Rev. 2011, 38, 357. [Google Scholar]
  9. Xu, F.; Cao, S.; Shi, L.; Chen, W.; Su, X.; Yang, Z. Blue light irradiation affects anthocyanin content and enzyme activities involved in postharvest strawberry fruit. J. Agric. Food Chem. 2014, 62, 4778–4783. [Google Scholar] [CrossRef]
  10. Kondo, S.; Hiraoka, K.; Kobayashi, S.; Honda, C.; Terahara, N. Changes in the expression of anthocyanin biosynthetic genes during apple development. J. Am. Soc. Hortic. 2002, 127, 971–976. [Google Scholar] [CrossRef]
  11. Takos, A.M.; Jaffe, F.W.; Jacob, S.R.; Bogs, J.; Robinson, S.P.; Walker, A.R. Light-induced expression of a MYB gene regulates anthocyanin biosynthesis in red apples. Plant Physiol. 2006, 142, 1216–1232. [Google Scholar] [CrossRef]
  12. Ma, C.; Liang, B.; Chang, B.; Yan, J.; Liu, L.; Wang, Y.; Yang, Y.; Zhao, Z. Transcriptome profiling of anthocyanin biosynthesis in the peel of ‘Granny Smith’ apples (Malus domestica) after bag removal. BMC Genom. 2019, 20, 353. [Google Scholar] [CrossRef] [PubMed]
  13. Ramsay, N.A.; Glover, B.J. MYB–bHLH–WD40 protein complex and the evolution of cellular diversity. Trends Plant Sci. 2005, 10, 63–70. [Google Scholar] [CrossRef] [PubMed]
  14. Bai, S.; Tao, R.; Yin, L.; Ni, J.; Yang, Q.; Yan, X.; Yang, F.; Guo, X.; Li, H.; Teng, Y. Two B-box proteins, PpBBX18 and PpBBX21, antagonistically regulate anthocyanin biosynthesis via competitive association with Pyrus pyrifolia elongated hypocotyl 5 in the peel of pear fruit. Plant J. 2019, 100, 1208–1223. [Google Scholar] [CrossRef] [PubMed]
  15. Dubos, C.; Stracke, R.; Grotewold, E.; Weisshaar, B.; Martin, C.; Lepiniec, L. MYB transcription factors in arabidopsis. Trends Plant Sci. 2010, 15, 573–581. [Google Scholar] [CrossRef]
  16. Xie, X.B.; Li, S.; Zhang, R.F.; Zhao, J.; Chen, Y.C.; Zhao, Q.; Yao, Y.X.; You, C.X.; Zhang, X.S.; Hao, Y.J. The bHLH transcription factor MdbHLH3 promotes anthocyanin accumulation and fruit colouration in response to low temperature in apples. Plant Cell Environ. 2012, 35, 1884–1897. [Google Scholar] [CrossRef] [PubMed]
  17. Lloyd, A.; Brockman, A.; Aguirre, L.; Campbell, A.; Bean, A.; Cantero, A.; Gonzalez, A. Advances in the MYB–bHLH–WD repeat (MBW) pigment regulatory model: Addition of a WRKY factor and co-option of an anthocyanin MYB for betalain regulation. Plant Cell Physiol. 2017, 58, 1431–1441. [Google Scholar] [CrossRef]
  18. Ban, Y.; Honda, C.; Hatsuyama, Y.; Igarashi, M.; Bessho, H.; Moriguchi, T. Isolation and functional analysis of a MYB transcription factor gene that is a key regulator for the development of red coloration in apple skin. Plant Cell Physiol. 2007, 48, 958–970. [Google Scholar] [CrossRef]
  19. Espley, R.V.; Hellens, R.P.; Putterill, J.; Stevenson, D.E.; Kutty-Amma, S.; Allan, A.C. Red colouration in apple fruit is due to the activity of the MYB transcription factor, MDMYB10. Plant J. 2007, 49, 414–427. [Google Scholar] [CrossRef]
  20. Chagné, D.; Lin-Wang, K.; Espley, R.V.; Volz, R.K.; How, N.M.; Rouse, S.; Brendolise, C.; Carlisle, C.M.; Kumar, S.; De Silva, N. An ancient duplication of apple MYB transcription factors is responsible for novel red fruit-flesh phenotypes. Plant Physiol. 2013, 161, 225–239. [Google Scholar] [CrossRef]
  21. Vimolmangkang, S.; Han, Y.; Wei, G.; Korban, S.S. An apple MYB transcription factor, mdMYB3, is involved in regulation of anthocyanin biosynthesis and flower development. BMC Plant Biol. 2013, 13, 176. [Google Scholar] [CrossRef]
  22. An, X.H.; Tian, Y.; Chen, K.Q.; Liu, X.J.; Liu, D.D.; Xie, X.B.; Cheng, C.G.; Cong, P.H.; Hao, Y.J. MdMYB9 and MdMYB11 are involved in the regulation of the ja-induced biosynthesis of anthocyanin and proanthocyanidin in apples. Plant Cell Physiol. 2015, 56, 650–662. [Google Scholar] [CrossRef] [PubMed]
  23. Sun, C.; Wang, C.; Zhang, W.; Liu, S.; Wang, W.; Yu, X.; Song, T.; Yu, M.; Yu, W.; Qu, S. The R2R3-type MYB transcription factor MdMYB90-like is responsible for the enhanced skin color of an apple bud sport mutant. Hortic. Res. 2021, 8, 156. [Google Scholar] [CrossRef] [PubMed]
  24. Xu, H.; Wang, N.; Liu, J.; Qu, C.; Wang, Y.; Jiang, S.; Lu, N.; Wang, D.; Zhang, Z.; Chen, X. The molecular mechanism underlying anthocyanin metabolism in apple using the MdMYB16 and MdbHLH33 genes. Plant Mol. Biol. 2017, 94, 149–165. [Google Scholar] [CrossRef] [PubMed]
  25. Yang, G.X.; Xu, H.F.; Zhang, J.; Wang, N.; Fang, H.C.; Jiang, S.H.; Wang, Y.C.; Su, M.Y.; Chen, X.S. Functional identification of apple anthocyanin regulatory gene MdMYB111. Acta Hortic. Sin. 2019, 46, 832–840. [Google Scholar]
  26. Wang, S.; Zhang, Z.; Li, L.X.; Wang, H.B.; Zhou, H.; Chen, X.S.; Feng, S.Q. Apple MdMYB306-like inhibits anthocyanin synthesis by directly interacting with MdMYB17 and MdbHLH33. Plant J. 2022, 110, 1021–1034. [Google Scholar] [CrossRef]
  27. Bai, S.; Saito, T.; Honda, C.; Hatsuyama, Y.; Ito, A.; Moriguchi, T. An apple B-box protein, MdCOL11, is involved in UV-B- and temperature-induced anthocyanin biosynthesis. Planta 2014, 240, 1051–1062. [Google Scholar] [CrossRef]
  28. Fang, H.; Dong, Y.; Yue, X.; Hu, J.; Jiang, S.; Xu, H.; Wang, Y.; Su, M.; Zhang, J.; Zhang, Z.; et al. The B-box zinc finger protein MdBBX20 integrates anthocyanin accumulation in response to ultraviolet radiation and low temperature. Plant Cell Environ. 2019, 42, 2090–2104. [Google Scholar] [CrossRef]
  29. Plunkett, B.J.; Henry-Kirk, R.; Friend, A.; Diack, R.; Helbig, S.; Mouhu, K.; Tomes, S.; Dare, A.P.; Espley, R.V.; Putterill, J.; et al. Apple B-box factors regulate light-responsive anthocyanin biosynthesis genes. Sci. Rep. 2019, 9, 17762. [Google Scholar] [CrossRef]
  30. An, J.P.; Wang, X.F.; Espley, R.V.; Lin-Wang, K.; Bi, S.Q.; You, C.X.; Hao, Y.J. An apple B-box protein MdBBX37 modulates anthocyanin biosynthesis and hypocotyl elongation synergistically with MdMYBs and MdHY5. Plant Cell Physiol. 2020, 61, 130–143. [Google Scholar] [CrossRef]
  31. Sun, Q.; Jiang, S.; Zhang, T.; Xu, H.; Fang, H.; Zhang, J.; Su, M.; Wang, Y.; Zhang, Z.; Wang, N.; et al. Apple NAC transcription factor MdNAC52 regulates biosynthesis of anthocyanin and proanthocyanidin through MdMYB9 and MdMYB11. Plant Sci. 2019, 289, 110286. [Google Scholar] [CrossRef]
  32. Mao, Z.; Jiang, H.; Wang, S.; Wang, Y.; Yu, L.; Zou, Q.; Liu, W.; Jiang, S.; Wang, N.; Zhang, Z.; et al. The MdHY5-MdWRKY41-MdMYB transcription factor cascade regulates the anthocyanin and proanthocyanidin biosynthesis in red-fleshed apple. Plant Sci. 2021, 306, 110848. [Google Scholar] [CrossRef] [PubMed]
  33. Hu, J.; Fang, H.; Wang, J.; Yue, X.; Su, M.; Mao, Z.; Zou, Q.; Jiang, H.; Guo, Z.; Yu, L.; et al. Ultraviolet B-induced MdWRKY72 expression promotes anthocyanin synthesis in apple. Plant Sci. 2020, 292, 110377. [Google Scholar] [CrossRef] [PubMed]
  34. An, J.P.; Qu, F.J.; Yao, J.F.; Wang, X.N.; You, C.X.; Wang, X.F.; Hao, Y.J. The bZIP transcription factor MdHY5 regulates anthocyanin accumulation and nitrate assimilation in apple. Hortic. Res. 2017, 4, 17023. [Google Scholar] [CrossRef] [PubMed]
  35. Liu, H.; Su, J.; Zhu, Y.; Yao, G.; Allan, A.C.; Ampomah-Dwamena, C.; Shu, Q.; Lin-Wang, K.; Zhang, S.; Wu, J. The involvement of PyBZIPa in light-induced anthocyanin accumulation via the activation of PyUFGT through binding to tandem G-boxes in its promoter. Hortic. Res. 2019, 6, 134. [Google Scholar] [CrossRef]
  36. Karagiannis, E.; Michailidis, M.; Tanou, G.; Scossa, F.; Sarrou, E.; Stamatakis, G.; Samiotaki, M.; Martens, S.; Fernie, A.R.; Molassiotis, A. Decoding altitude-activated regulatory mechanisms occurring during apple peel ripening. Hortic. Res. 2020, 7, 120. [Google Scholar] [CrossRef]
  37. Jia, D.; Li, Z.; Dang, Q.; Shang, L.; Shen, J.; Leng, X.; Wang, Y.; Yuan, Y. Anthocyanin biosynthesis and methylation of the MdMYB10 promoter are associated with the red blushed-skin mutant in the red striped-skin “changfu 2” apple. J. Agric. Food Chem. 2020, 68, 4292–4304. [Google Scholar] [CrossRef]
  38. Zhang, L.; Hu, J.; Han, X.; Li, J.; Gao, Y.; Richards, C.M.; Zhang, C.; Tian, Y.; Liu, G.; Gul, H.; et al. A high-quality apple genome assembly reveals the association of a retrotransposon and red fruit colour. Nat. Commun. 2019, 10, 1494. [Google Scholar] [CrossRef]
  39. Yan, Z.L.; Zhang, H.T.; Zhang, R.P.; Liu, Z.Z.; Guo, G.N. Performance of new apple variety ‘huashuo’ in 14 producing areas in China. China Fruits 2016, 90–94. [Google Scholar]
  40. Xu, H.; Zou, Q.; Yang, G.; Jiang, S.; Fang, H.; Wang, Y.; Zhang, J.; Zhang, Z.; Wang, N.; Chen, X. MdMYB6 regulates anthocyanin formation in apple both through direct inhibition of the biosynthesis pathway and through substrate removal. Hortic. Res. 2020, 7, 72. [Google Scholar] [CrossRef]
  41. Pirie, A.; Mullins, M.G. Changes in anthocyanin and phenolics content of grapevine leaf and fruit tissues treated with sucrose, nitrate, and abscisic acid. Plant Physiol. 1976, 58, 468–472. [Google Scholar] [CrossRef]
  42. Martin, M. Cutadapt removes adapter sequences from high-throughput sequencing reads. EMBnet. J. 2011, 17, 10–12. [Google Scholar] [CrossRef]
  43. Bolger, A.M.; Lohse, M.; Usadel, B. Trimmomatic: A flexible trimmer for illumina sequence data. Bioinformatics 2014, 30, 2114–2120. [Google Scholar] [CrossRef] [PubMed]
  44. Anders, S.; Pyl, P.T.; Huber, W. Htseq—A python framework to work with high-throughput sequencing data. Bioinformatics 2015, 31, 166–169. [Google Scholar] [CrossRef] [PubMed]
  45. Wei, T.; Simko, V. R Package “Corrplot”: Visualization of a Correlation Matrix. Version 0.84. 2017. Available online: https://github.com/taiyun/corrplot (accessed on 27 November 2021).
  46. Langfelder, P.; Mehrabian, M.; Schadt, E.E.; Lusis, A.J.; Horvath, S. Weighted gene co-expression network analysis of adipose and liver reveals gene modules related to plasma HDL levels and containing candidate genes at loci identified in genome wide association studies. J. Am. Heart Assoc. 2008, 118, S_327. [Google Scholar]
  47. Schmittgen, T.D.; Livak, K.J. Analyzing real-time PCR data by the comparative CT method. Nat. Protoc. 2008, 3, 1101–1108. [Google Scholar] [CrossRef]
  48. Franceschini, A.; Szklarczyk, D.; Frankild, S.; Kuhn, M.; Simonovic, M.; Roth, A.; Lin, J.; Minguez, P.; Bork, P.; von Mering, C.; et al. STRING v9.1: Protein-protein interaction networks, with increased coverage and integration. Nucleic Acids Res. 2013, 41, 808–815. [Google Scholar] [CrossRef]
  49. Shumayla; Mendu, V.; Singh, K.; Upadhyay, S.K. Insight into the roles of proline-rich extensin-like receptor protein kinases of bread wheat (Triticum aestivum L.). Life 2022, 12, 941. [Google Scholar] [CrossRef]
  50. Rathour, M.; Alok, A.; Upadhyay, S.K. Investigation of roles of TaTALE genes during development and stress response in bread wheat. Plants 2022, 11, 587. [Google Scholar] [CrossRef]
  51. Ji, X.H.; Zhang, R.; Wang, N.; Yang, L.; Chen, X.S. Transcriptome profiling reveals auxin suppressed anthocyanin biosynthesis in red-fleshed apple callus (Malus sieversii f. niedzwetzkyana). Plant Cell Tissue Organ Cult. (PCTOC) 2015, 123, 389–404. [Google Scholar] [CrossRef]
  52. Gao, H.N.; Jiang, H.; Cui, J.Y.; You, C.X.; Li, Y.Y. Review: The effects of hormones and environmental factors on anthocyanin biosynthesis in apple. Plant Sci. 2021, 312, 111024. [Google Scholar] [CrossRef]
  53. Honda, C.; Moriya, S. Anthocyanin biosynthesis in apple fruit. Hortic. J. 2018, 87, 305–314. [Google Scholar] [CrossRef]
  54. Sun, B.H.; Francis, F. Apple anthocyanins: Identification of cyanidin-7-arabinoside. J. Food Sci. 1967, 32, 647–649. [Google Scholar] [CrossRef]
  55. Tsao, R.; Yang, R.; Young, J.C.; Zhu, H. Polyphenolic profiles in eight apple cultivars using high-performance liquid chromatography (HPLC). J. Agric. Food Chem. 2003, 51, 6347–6353. [Google Scholar] [CrossRef] [PubMed]
  56. Ubi, B.E.; Honda, C.; Bessho, H.; Kondo, S.; Wada, M.; Kobayashi, S.; Moriguchi, T. Expression analysis of anthocyanin biosynthetic genes in apple skin: Effect of UV-B and temperature. Plant Sci. 2006, 170, 571–578. [Google Scholar] [CrossRef]
  57. Wu, B.H.; Cao, Y.G.; Guan, L.; Xin, H.P.; Li, J.H.; Li, S.H. Genome-wide transcriptional profiles of the berry skin of two red grape cultivars (Vitis vinifera) in which anthocyanin synthesis is sunlight-dependent or-independent. PLoS ONE 2014, 9, e105959. [Google Scholar] [CrossRef]
  58. Zhang, L.; Fan, S.; An, N.; Zuo, X.; Gao, C.; Zhang, D.; Han, M. Identification and expression analysis of pal gene family in apple. Acta Agric. Zhejiangensis 2018, 30, 2031–2043. [Google Scholar]
  59. Gleitz, J.; Seitz, H.U. Induction of chalcone synthase in cell suspension cultures of carrot (Daucus carota L. spp. sativus) by ultraviolet light: Evidence for two different forms of chalcone synthase. Planta 1989, 179, 323–330. [Google Scholar] [CrossRef]
  60. Lancaster, J.; Dougall, D.K. Regulation of skin color in apples. Crit. Rev. Plant Sci. 1992, 10, 487–502. [Google Scholar] [CrossRef]
  61. Kim, S.H.; Lee, J.R.; Hong, S.T.; Yoo, Y.K.; An, G.; Kim, S.R. Molecular cloning and analysis of anthocyanin biosynthesis genes preferentially expressed in apple skin. Plant Sci. 2003, 165, 403–413. [Google Scholar] [CrossRef]
  62. Huang, L.N.; Wu, G.B.; Zhang, S.; Kuang, F.Y.; Chen, F.H. The identification and functional verification of the cinnamate 4-hydroxylase gene from wax apple fruit and its role in lignin biosynthesis during nitric oxide-delayed postharvest cottony softening. Postharvest Biol. Technol. 2019, 158, 110964. [Google Scholar] [CrossRef]
  63. Ring, L.; Yeh, S.-Y.; Hücherig, S.; Hoffmann, T.; Blanco-Portales, R.; Fouche, M.; Villatoro, C.; Denoyes, B.; Monfort, A.; Caballero, J.L.; et al. Metabolic interaction between anthocyanin and lignin biosynthesis is associated with peroxidase FaPRX27 in strawberry fruit. Plant Physiol. 2013, 163, 43–60. [Google Scholar] [CrossRef] [PubMed]
  64. Li, Y.; Nie, P.; Zhang, H.; Wang, L.; Wang, H.; Zhang, L. Dynamic changes of anthocyanin accumulation and endogenous hormone contents in blueberry. J. Beijing For. Univ. 2017, 39, 64–71. [Google Scholar]
  65. Li, W.F.; Mao, J.; Yang, S.J.; Guo, Z.G.; Ma, Z.H.; Dawuda, M.M.; Zuo, C.W.; Chu, M.Y.; Chen, B.H. Anthocyanin accumulation correlates with hormones in the fruit skin of ‘red delicious’ and its four generation bud sport mutants. BMC Plant Biol. 2018, 18, 363. [Google Scholar] [CrossRef] [PubMed]
  66. Figueroa, N.E.; Gatica-Meléndez, C.; Figueroa, C.R. Ethylene application at the immature stage of Fragaria chiloensis fruit represses the anthocyanin biosynthesis with a concomitant accumulation of lignin. Food Chem. 2021, 358, 129913. [Google Scholar] [CrossRef] [PubMed]
  67. Cheng, J.; Yu, K.; Shi, Y.; Wang, J.; Duan, C. Transcription factor VviMYB86 oppositely regulates proanthocyanidin and anthocyanin biosynthesis in grape berries. Front. Plant Sci. 2021, 11, 613677. [Google Scholar] [CrossRef]
  68. Wei, X.; Ju, Y.; Ma, T.; Zhang, J.; Fang, Y.; Sun, X. New perspectives on the biosynthesis, transportation, astringency perception and detection methods of grape proanthocyanidins. Crit. Rev. Food Sci. 2021, 61, 2372–2398. [Google Scholar] [CrossRef]
  69. Appelhagen, I.; Lu, G.-H.; Huep, G.; Schmelzer, E.; Weisshaar, B.; Sagasser, M. Transparent testa1 interacts with R2R3-MYB factors and affects early and late steps of flavonoid biosynthesis in the endothelium of Arabidopsis thaliana seeds. Plant J. 2011, 67, 406–419. [Google Scholar] [CrossRef]
  70. An, X.-H.; Tian, Y.; Chen, K.-Q.; Wang, X.-F.; Hao, Y.-J. The apple WD40 protein mdttg1 interacts with bHLH but not MYB proteins to regulate anthocyanin accumulation. J. Plant Physiol. 2012, 169, 710–717. [Google Scholar] [CrossRef]
  71. Feyissa, D.N.; Løvdal, T.; Olsen, K.M.; Slimestad, R.; Lillo, C. The endogenous GL3, but not EGL3, gene is necessary for anthocyanin accumulation as induced by nitrogen depletion in arabidopsis rosette stage leaves. Planta 2009, 230, 747–754. [Google Scholar] [CrossRef]
  72. Baxter, I.R.; Young, J.C.; Armstrong, G.; Foster, N.; Bogenschutz, N.; Cordova, T.; Peer, W.A.; Hazen, S.P.; Murphy, A.S.; Harper, J.F. A plasma membrane H+-ATPase is required for the formation of proanthocyanidins in the seed coat endothelium of Arabidopsis thaliana. Proc. Natl. Acad. Sci. USA 2005, 102, 2649–2654. [Google Scholar] [CrossRef]
  73. White-Cooper, H.; Leroy, D.; MacQueen, A.; Fuller, M.T. Transcription of meiotic cell cycle and terminal differentiation genes depends on a conserved chromatin associated protein, whose nuclear localisation is regulated. Development 2000, 127, 5463–5473. [Google Scholar] [CrossRef] [PubMed]
  74. Gray, J.A.; Shalit-Kaneh, A.; Chu, D.N.; Hsu, P.Y.; Harmer, S.L. The reveille clock genes inhibit growth of juvenile and adult plants by control of cell size. Plant Physiol. 2017, 173, 2308–2322. [Google Scholar] [CrossRef] [PubMed]
  75. An, J.P.; Yao, J.F.; Xu, R.R.; You, C.X.; Wang, X.F.; Hao, Y.J. Apple bZIP transcription factor MdbZIP44 regulates abscisic acid-promoted anthocyanin accumulation. Plant Cell Environ. 2018, 41, 2678–2692. [Google Scholar] [CrossRef]
  76. Ang, L.-H.; Chattopadhyay, S.; Wei, N.; Oyama, T.; Okada, K.; Batschauer, A.; Deng, X.-W. Molecular interaction between COP1 and HY5 defines a regulatory switch for light control of Arabidopsis development. Mol. Cell 1998, 1, 213–222. [Google Scholar] [CrossRef]
  77. Li, Y.Y.; Mao, K.; Zhao, C.; Zhao, X.Y.; Zhang, H.L.; Shu, H.R.; Hao, Y.J. MdCOP1 ubiquitin E3 ligases interact with MdMYB1 to regulate light-induced anthocyanin biosynthesis and red fruit coloration in apple. Plant Physiol. 2012, 160, 1011–1022. [Google Scholar] [CrossRef] [PubMed]
  78. Hudson, M.E.; Lisch, D.R.; Quail, P.H. The FHY3 and FAR1 genes encode transposase-related proteins involved in regulation of gene expression by the phytochrome a-signaling pathway. Plant J. 2003, 34, 453–471. [Google Scholar] [CrossRef]
  79. Oyama, T.; Shimura, Y.; Okada, K. The Arabidopsis HY5 gene encodes a bZIP protein that regulates stimulus-induced development of root and hypocotyl. Genes Dev. 1997, 11, 2983–2995. [Google Scholar] [CrossRef]
Figure 1. Changes in appearance and anthocyanin content during the color transition period. (A) Apple phenotypes. (B) Total anthocyanin content. Lowercase letters indicate significant differences at p < 0.05 using Duncan’s multiple range test. YS, Huashuo; YR, Huarui.
Life 12 01246 g001
Figure 2. Anthocyanin levels during the color transition period. Different lowercase letters indicate significant differences at p < 0.05 using Duncan’s multiple range test. YS, Huashuo; YR, Huarui.
Life 12 01246 g002
Figure 3. Association analysis of transcriptome and metabolome. Different module colors represent the correlation between the genes of the module and anthocyanins. The brighter the red (the value is closer to 1), the higher the positive correlation, while the brighter the blue (the value is closer to −1), the higher the negative correlation. The number in brackets represents significance (p value), with the smaller the value, the stronger the significance. The horizontal axis is the type of anthocyanins.
Life 12 01246 g003
Figure 4. Functional annotation of genes with correlation value of ≥0.8 or ≤−0.8. The left side shows the screened genes divided into different categories; the right side introduces the name of each part and their proportions in detail.
Life 12 01246 g004
Figure 5. Overview of modulation of the phenylpropanoid pathway. The pathway was adapted from Ji et al. [51]. For each gene, the eight squares from left to right represent YS1–4 and YR 1–4. The number of rows represents the number of transcripts. Different colors represent a downregulated or upregulated gene. YS, Huashuo; YR, Huarui; PAL, phenylalanine ammonia lyase; C4H, cinnamate-4-hydroxylase; 4CL, 4-coumaroyl-coA synthase; CHS, chalcone synthase; CHI, chalcone-flavanone isomerase; F3H, flavanone-3-hydroxylase; FLS, flavonol synthase; DFR, dihydroflavonol-4-reductas; UFGT, UDP-glucose: flavonoid-3-O-glucosyltransferase; CCoAOMT, caffeoyl CoA o-methyl transferase; CCR, caffeoyl CoA reductase; CAD, cinnamoyl alcohol dehydrogenase; UGT, UDP-glycosyltransferase; C3H, p-coumarate 3-hydroxylase; HCT, hydroxycinnamoyl-coA shikimate/quinate hydroxycinnamoyl transferase.
Life 12 01246 g005
Figure 6. Interaction network analysis for key transcription factors. (AF) sequentially represent the interaction network of six transcription factors (MYB12, MYB308-like, MYB-related 306-like, MYB16, MYB1R1-like, HY5-like) we screened. Colored nodes represent different proteins; the red is the target protein I upload. Node content: empty nodes represent proteins with unknown 3D structure, while filled nodes represent proteins with known or predicted 3D structure. Lines of different colors in the middle of nodes represent different relationships of proteins.
Life 12 01246 g006
Figure 7. Schematic diagram of differential accumulation of anthocyanin in apple sister lines YS and YR. YS, Huashuo; YR, Huarui.
Life 12 01246 g007
Publisher’s Note: MDPI stays neutral with regard to jurisdictional claims in published maps and institutional affiliations.

