Article

Photosynthesis, Nitrogen Allocation, Non-Structural Carbohydrate Allocation, and C:N:P Stoichiometry of Ulmus elongata Seedlings Exposed to Different Light Intensities

1
College of Life Sciences, Shanghai Normal University, Shanghai 200234, China
2
Institute of Ecology, Taizhou University, Taizhou 318000, China
3
Zhejiang Provincial Key Laboratory of Plant Evolutionary Ecology and Conservation, Taizhou University, Taizhou 318000, China
*
Author to whom correspondence should be addressed.
Life 2022, 12(9), 1310; https://doi.org/10.3390/life12091310
Submission received: 21 July 2022 / Revised: 16 August 2022 / Accepted: 23 August 2022 / Published: 25 August 2022
(This article belongs to the Special Issue Plant Ecophysiology and Plant Stress Physiology)

Abstract

:
The leaf photosynthetic capacity, leaf N partitioning, non-structural carbohydrate content, C, N, and P contents of endangered U. elongata seedlings exposed to different light intensities were compared in this study. The most favorable light condition for the survival and growth of U. elongata seedlings in the present study was 100% full sunlight, as this induced higher Pn, PNUE, PC, PR, PB, and NSC content relative to shade-treated seedlings. PNUE, PR, PC, and PB in U. elongata seedling leaves decreased under 40% and 10% full sunlight, while PL increased, indicating that shade increased the light capture efficiency of photosystem (PS) II but decreased electron transfer from PSII to PSI. Furthermore, leaf N content increased with shade intensity, revealing an adaptive strategy for poor light environments. Additionally, the smallest leaf biomass, Pn, WUE, and CE values and C:N and C:P ratios in stems and leaves were observed under 10% full sunlight. These results indicate that seedlings growing under 40% full sunlight will benefit U. elongata conservation.

1. Introduction

Light is a critical abiotic factor affecting the survival, growth, and development of plant [1]. Changes in light induce various physiological responses in plants [2], which have evolved complex physiological adaptations that allow them to withstand combinations of stresses imposed by unfavorable light levels [3]. Exploring the adaptive responses of plants to various light environments can help to elucidate the breadth of their environmental niches.
Low light decreases the photosynthesis and consequently reduces carbon accumulation and growth of a plant. The carbon gain hypothesis, which posits that seedlings of plants tend to maximize net carbon gain to perform optimally in low-light conditions [4,5], suggests that shade-tolerant species should increase investments of N to compounds capable of light capture (e.g., chlorophyll and other pigments) [6,7,8] and alter plant morphology to maximize light capture [9,10]. In addition, to effectively balance N allocation, plant may invest more N in light harvesting proteins to maximize the carbon gain in low-light conditions, whereas in RuBisCO and bioenergetic components to maximize carbon gain in high-light conditions [11,12]. When the carbon gain is greater than the carbon demand for growth, plants deposit photosynthates as nonstructural carbohydrate (NSC), which can be mobilized later to support the survival, growth, or other functions [4,13,14], such as the tolerance to shade [15,16].
Variation in the C, N, and P contents of plant tissues are owed to the balance between absorbance and storage [17]. The stoichiometry of leaves is more sensitive to shade treatments than that of roots because leaves are the major photosynthetic organ [18]. The C:N:P stoichiometry is related to plant survival and growth strategies, such as an organism’s capability of adapting to environmental stresses [19]. Shade treatments differentially affect the C:N:P stoichiometry of plant organs [18,20]. However, the specific mechanisms that induce changes in plant stoichiometry at the plant organ level in response to light intensity changes are understudied.
Ulmus elongata, a unique rare species with small populations in China [21], has been listed in the IUCN Red List of Endangered Species (Vulnerable VU level) and the first batch of National Key Protected Wild Plants (list II level) in China [22,23,24]. Most previous studies have focused on the conservation value and endangered status of U. elongata. The eco-physiological response of U. elongata to light with different intensities has not been studied [25]. Previous studies showed that U. elongata seedlings rarely establish under canopies and that its seeds are dispersed only over short distances, exacerbating its current conservation status [26,27]. Thus, assessment of the effect of shading on the physiology, especially the photosynthesis process of U. elongata, can be used to identify appropriate light intensities for U. elongata seedling establishment and thus inform U. elongata conservation efforts.
Here, the leaf photosynthetic capacity, leaf N partitioning, NSCs, C, N, and P contents, and C:N:P stoichiometry of U. elongata seedlings under different light intensity levels were measured. We aimed to determine the responses of U. elongata leaves under different light intensities with respect to (1) photosynthesis, (2) nitrogen allocation, (3) carbohydrate storage allocation, and (4) C:N:P stoichiometry. These results elucidate the optimal light-intensity conditions for U. elongata seedlings and provide a basic reference for the conservation of U. elongata.

2. Materials and Methods

2.1. Plant Materials

In 2017, seeds were planted at the Forestry Science Research Institute, Lishui City, Zhejiang Province, China. In 2019, the surviving seedlings were transferred to Taizhou University, Taizhou, Zhejiang Province, China (121°7′ E, 28°51′ N). The pot experiment was established in a greenhouse at Taizhou. Each seedling was transplanted into plastic pots filled with humidified nutrient soil. The 2-year-old seedlings were watered every day to pot water capacity. The soil physio-chemical traits were shown in Table S1.

2.2. Treatments

In March 2019, three treatments were established using a black nylon to control the light intensity. Treatments conducted with zero, one, or two layers of shading net correspond to 100%, 40%, and 10% full sunlight, respectively [28].

2.3. Photosynthetic Parameter Measurement

In July 2019, three healthy third leaves from the top of each selected U. elongata were used for the measurement of photosynthetic characteristics on a clear day. Three individuals from each treatment were randomly selected. The diurnal variation in air temperature (Ta), photosynthetically active radiation (PAR), and relative humidity (RH) under three treatments are shown in Figure S1. The photosynthetic parameters were measured with the LI-COR 6400 system (LI-COR 6400, Lincoln, NE, USA) at 1000 μmol·m−2·s−1 PAR, 400 μmol·mol−1 CO2, 60% relative humidity, and the leaf temperature was kept at 25 °C. The photosynthetic rate (Pn), intercellular CO2 concentration (Ci), stomatal conductance (Gs), and transpiration rate (Tr) of U. elongata were determined from 9:00 to 11:00 on a clear day. Water use efficiency (WUE) was calculated as Pn/Tr [29,30]. Carboxylation efficiency (CE) was the ratio of Pn to Ci, and the stomatal limitation (Ls) value was calculated as 1-(Ci/Ca) (here, Ca is the atmospheric CO2 concentration) [31,32].
The Pn—PAR curves were logged under PAR of 0, 20, 50, 100, 150, 400, 600, 800, 1000, 1200, 1500, and 2000 μmol·m−2·s−1 levels, using LED blue and red light sources [28]. The CO2 response curves were measured under saturated PAR. The parameters were measured at 500 μmol·s−1 gas flow rate, 60% RH, and the leaf temperature was kept at 25 °C. The PnCi curves were logged under Ci of 50, 100, 200, 300, 400, 600, 800, 1000, 1200, and 1500 μmol·mol−1 levels. The maximum electron transport rate (Jmax) and the maximum carboxylation rate (Vcmax) were calculated by the method of Long and Bernacchi [33]:
Vcmax = k × [Ci + Kc × (1 + O/Ko)]2/[Γ * + Kc × (1 + O/Ko)],
Jmax = [4 × (Amax + Rd) × (Ci + 2Γ *)]/[CiΓ *].
Here, Ci is the intercellular CO2 concentration, and O is the intercellular O2 concentration; Γ * is the CO2 compensation point; Ko and Kc are Michaelis–Menten constants for oxygenation and carboxylation, respectively; Rd is the dark respiration rate, and Amax is the light-saturated photosynthetic rate [28,33].

2.4. N Allocation

After the determination of the photosynthetic parameters, 20–30 leaves from each U. elongata seedling were selected. Leaf area (A, cm2) was measured using a WinFOLIA multipurpose area meter (Regent Instruments Inc., Sainte-Foy, Quebec, QC, Canada). Leaf biomass was measured after being oven-dried at 80 °C. MA (g·m−2) was the ratio of leaf biomass to leaf area [34]. Three replicates were used for every treatment.
Subsequently, dried leaves of U. elongata were ground into powder and the leaf N per unit mass (Nmass, g·g−1) was measured by ICP-OES (Optima 2100DV, PerkinElmer) after H2SO4-H2O2 solution digestion and dilution [35]. The leaf N per unit area (Narea, g·m−2) value was then determined as Nmass × MA, while the PNUE (μmol·g−1·s−1) was the ratio of Pn to Narea [36,37,38].
Fractions of leaf N allocated to RuBisCO (PR), bioenergetics (PB), light-harvesting (PL), and photosynthetic (PC) components were calculated using the following equation:
PR = Vcmax/(6.25 × Vcr × MA × Nmass),
PB = Jmax/(8.06 × Jmc × MA × Nmass),
PL = CChl/(Nmass × CB),
PC = PR + PB + PL.
Here, Nmass is the leaf N content per unit of leaf dry mass (g·g−1); MA is leaf dry mass per unit area (g·m−2); CChl is leaf chlorophyll content (mmol·g−1); Vcr and Jmc are the specific activity of RuBisCO and the potential rate of photosynthetic electron transport per unit cytochrome f, respectively; and CB is the ratio of leaf chlorophyll to leaf nitrogen invested [39,40,41,42]. CB, Vcr, and Jmc were calculated using the following equation:
[CB] = 1.94 + 12.6/[MA],
V cr ( J mc ) =   e ( c Δ H a R × T k ) / ( 1 + e Δ S × T k Δ H d R × T k ) .
Here, [MA] and [CB] are the values of MA and CB, respectively; MA is the leaf dry mass per unit area (g·m−2); CB is the ratio of leaf chlorophyll to leaf nitrogen invested in light harvesting; and R is the gas constant (8.314 J·K−1·mol−1), ∆S is the entropy term, c is the scaling constant, ∆Ha is the activation energy, Tk is the leaf temperature (K), and ∆Hd is the deactivation energy [36,37,39,43].

2.5. Determination of C, N, and P Contents

The biomass of roots, stems, and leaves of U. elongata were measured after they were kept at 80 °C. The dry root, stem, and leaf samples of U. elongata were also ground into powder with a Mixer Mill grinder (High speed multifunctional grinder, 4000 r/min, Yongkang Baoou Hardware Products Co., Yongkang, China). These powdered samples were passed through a screen with a 1-mm mesh. The C content was determined by the H2SO4/K2Cr2O7 oxidization-FeSO4 titration method [35,44]. After H2SO4-H2O2 solution digestion and dilution, total N and P content were determined by ICP-OES (Optima 2100DV, PerkinElmer) [35]. The N:P, C:P, and C:N ratios were calculated from the content ratio [45]. Three replicates were used for every treatment.

2.6. Determination of NSC Content

To determine the NSC content, 5 mL of distilled water was added into 50 mg of the powdered samples of U. elongata and the mixture was incubated for 45 min in a boiling water bath. The supernatant was collected. The process was performed twice to ensure complete extraction of all sugars [46]. The supernatant was dried and resolved in 10 mL of 30% (v/v) perchlorate. Soluble sugar and starch contents were determined at 630 nm using the anthrone colorimetric method according to a glucose standard curve. NSC content was calculated as the sum of soluble sugar and starch content [45,47]. Three replicates were used for every treatment. Soluble sugar-to-starch ratio (SSRs) was calculated as the soluble sugar content divided starch content.

2.7. Statistical Analyses

Data were analyzed with SPSS version 20.0 (IBM Corp., Armonk, NY, USA). We used a one-way analysis of variance with treatment as the fixed factor to test the significant difference of the photosynthetic parameters, PNUE, PR, PB, PL, PC, C, N, and P contents, N:P, C:P, C:N, sugar, starch, NSC, and SSRs. One-way ANOVA with the least significant difference (LSD) test was applied to detect significant differences at a p < 0.05 level. Figures were drawn with Origin 8.5 (Origin Lab., Northampton, MA, USA).

3. Results

3.1. Leaf Photosynthetic Capacity and Biomass Response to Light Intensity Levels

The photosynthetic parameters of U. elongata leaves changed significantly under different light intensities (Figure 1). As light intensity decreased, Pn decreased continuously with maximum and minimum values under 100% and 10% full sunlight, respectively (Figure 1A). The differences among treatments were significant (p < 0.05). The trend in Gs was similar to that of Pn (p < 0.05) (Figure 1B). Ci reached its minimum under 100% full sunlight, which was significantly different from those at 40% and 10% full sunlight (p < 0.05) (Figure 1C). Differences in Tr among the three treatments were significant (Figure 1D). Ls and Tr were at their lowest under 40% full sunlight, while WUE under 40% full sunlight was at its highest (p < 0.05; Table 1). CE decreased significantly with the decreasing of light intensity (Table 1). In addition, leaf biomass at 10% full sunlight was lower than that at 40% and 100% full sunlight (Figure S2).

3.2. N Allocation Responses to Light Intensity Levels

The fraction of leaf N allocated to photosynthetic components differed among light intensity levels (Table 2). PL increased with the decreasing of light intensity levels. PR and PB decreased as the light intensity decreased (p < 0.05), which indicates that the shade increased the light capture efficiency of PSII in U. elongata leaves. PNUE and PC were reduced as the light level decreased.

3.3. C, N, and P Contents and C:N:P Stoichiometry Response to Light Intensity Levels

Shade treatments significantly affected the allocation proportion of carbon, phosphorus, and nitrogen in the leaf, stem, and root tissues of U. elongata (Table 3; Figure 2). The leaf and root C contents were reduced as the light intensity decreased, while the stem C content increased as the light level decreased (Table 3). The leaf N content in U. elongata seedlings significantly increased from 100% to 10% full sunlight (p < 0.05) (Table 3). The highest stem N content was observed under 10% full sunlight. Leaf P content in U. elongata seedlings significantly decreased from 100% to 10% full sunlight, and the lowest root P content was observed under 10% full sunlight (Table 3). In contrast, the stem P content in U. elongata seedlings reached its maximum under 10% full sunlight (p < 0.05).
Shade treatments significantly affected the root, stem, and leaf C:N:P stoichiometries of U. elongata (Table 4). The C:N ratio in roots was highest under 40% full sunlight and was significantly different from that under 100% and 10% full sunlight, while the C:P and N:P ratios were highest under 10% full sunlight (Table 4). In U. elongata seedlings, the stem and leaf N:P ratios increased as the light intensity decreased. In contrast, the stem and leaf C:N ratios decreased as the light level decreased. The stem and leaf C:P ratios of U. elongata were highest under 40% full sunlight. These results indicated that the lowest N- and P-use efficiency and growth rate occurred under the deep shade treatment.

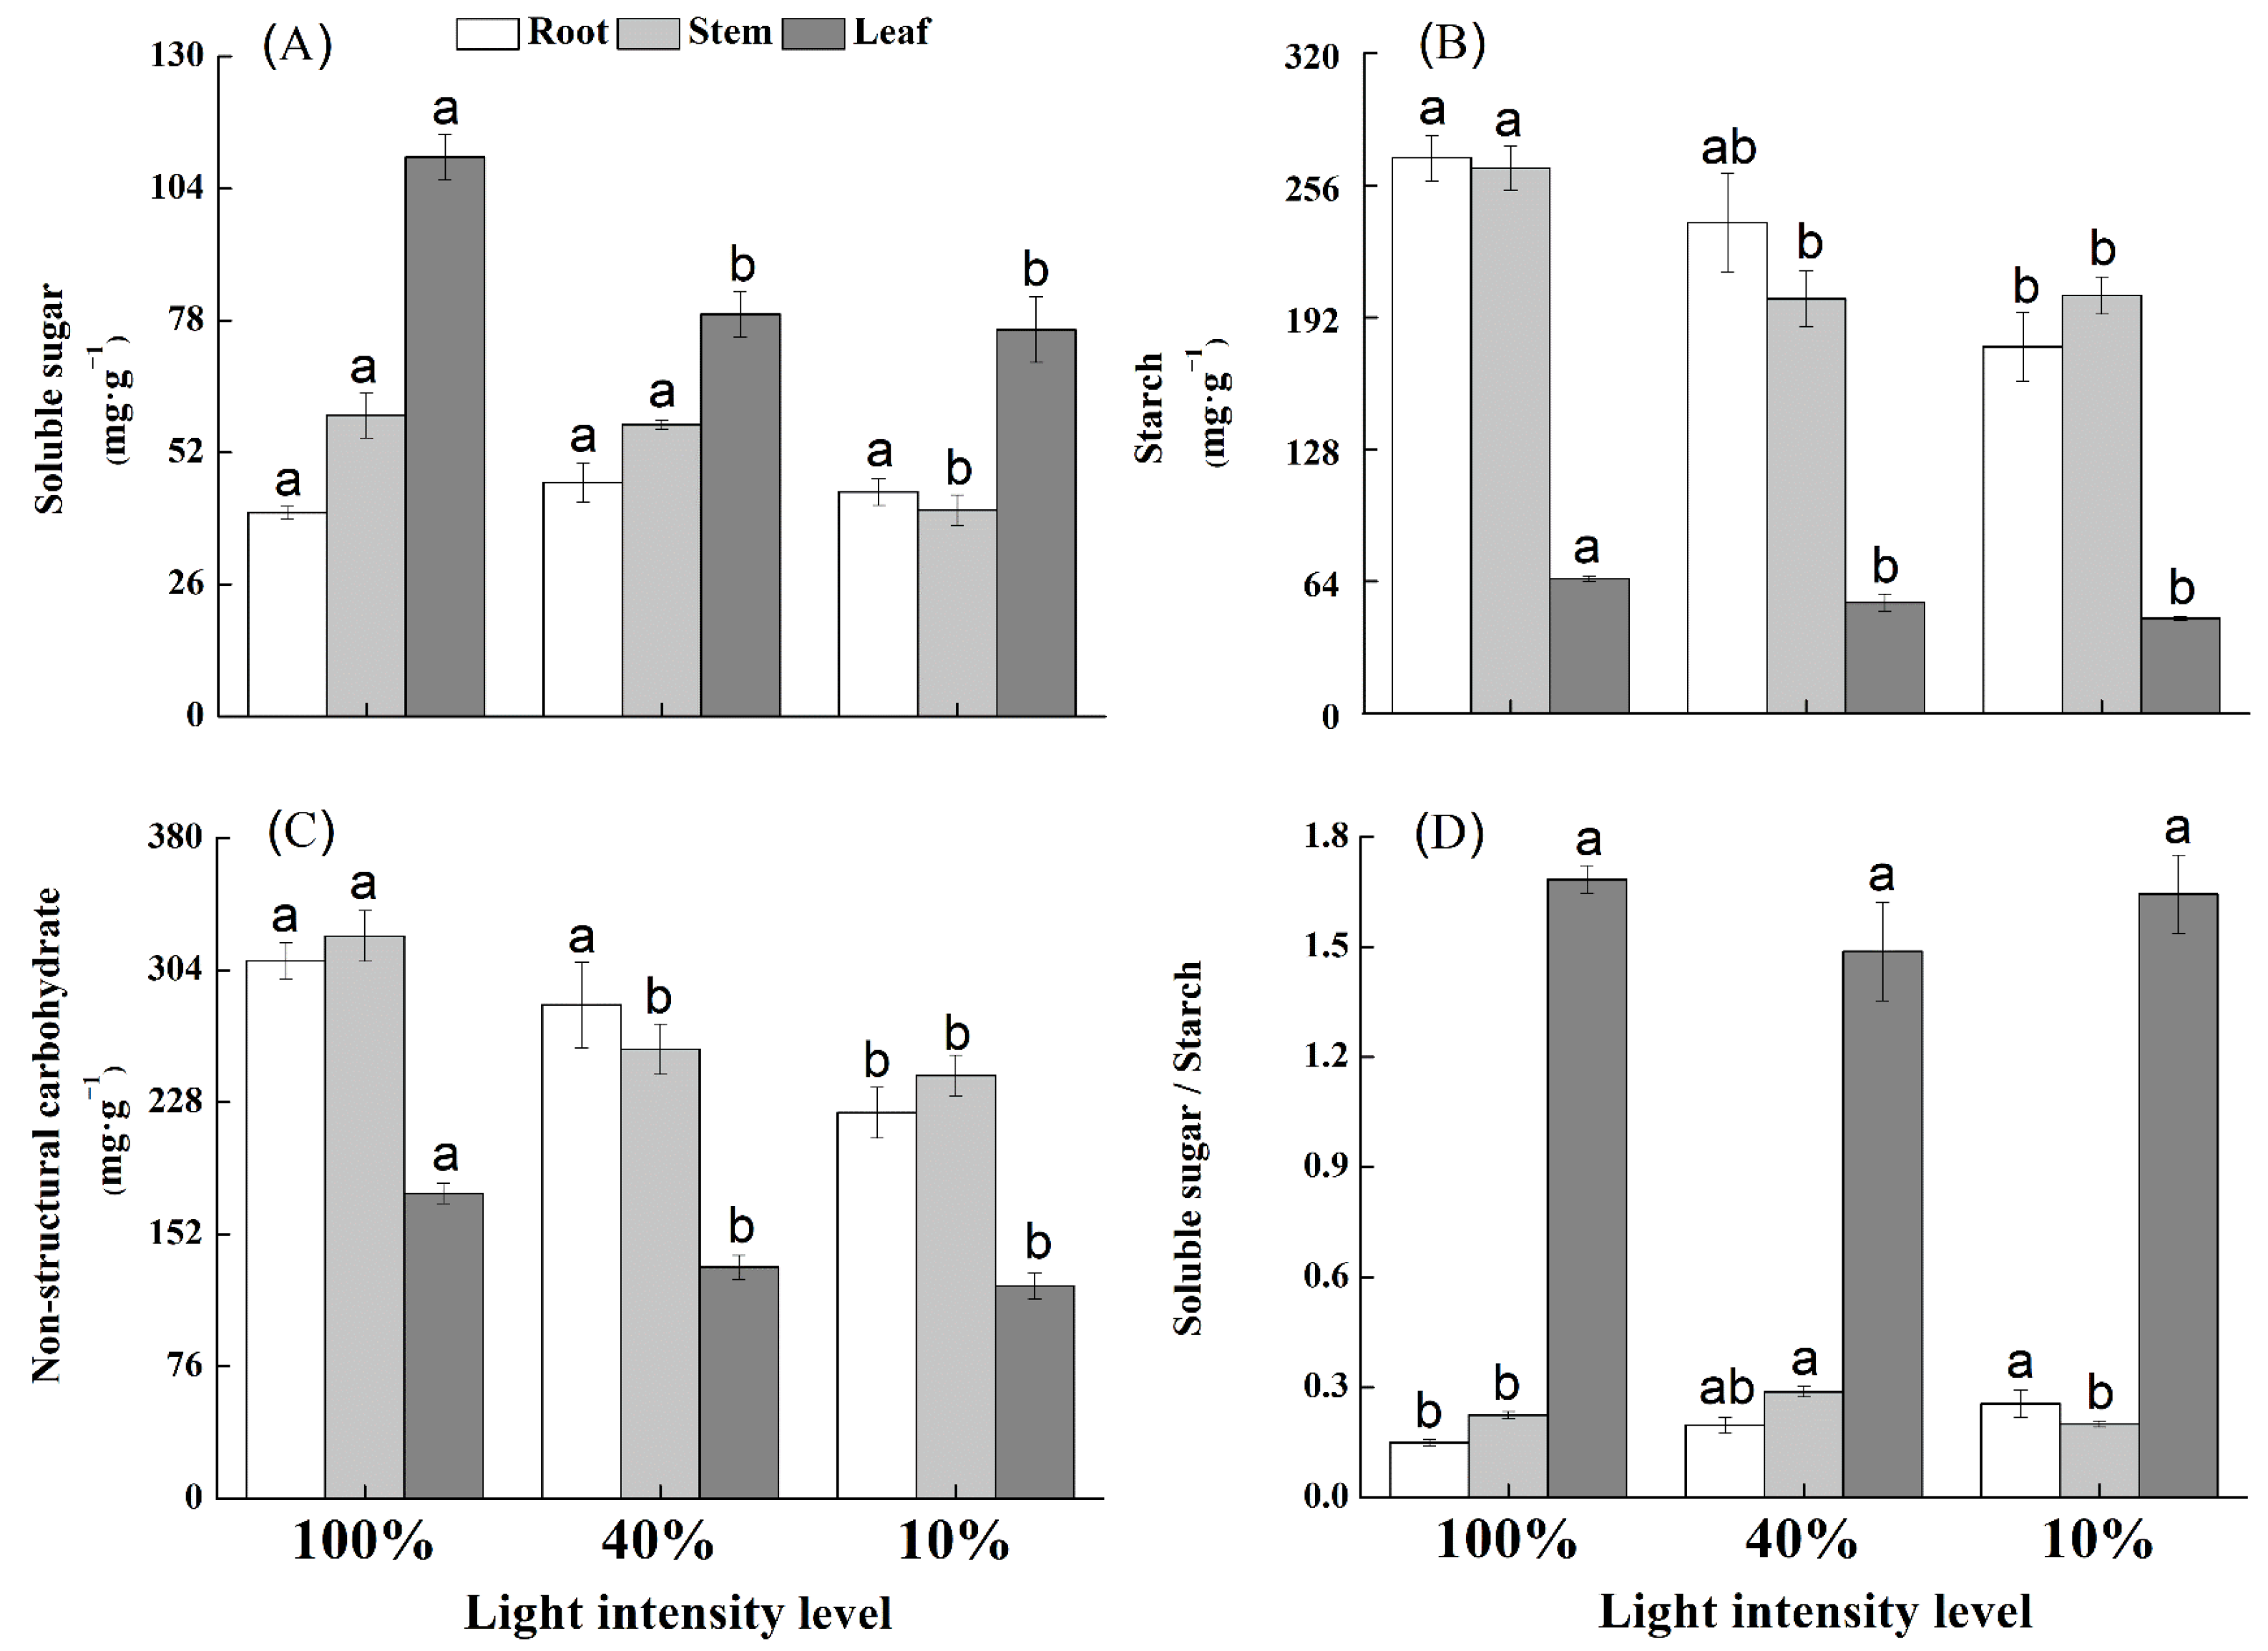
3.4. NSC Content in Response to Light Intensity Levels

The shade treatments had significant effects on leaf soluble sugar, starch, and NSC contents of U. elongata seedlings (Figure 3). The soluble sugar content in stem tissue was at its lowest under 10% full sunlight and significantly different from that under 100% and 40% full sunlight (Figure 3A). The root sugar content was similar among different light intensities, but the root starch content decreased significantly as the light level decreased from 100% to 40% full sunlight (Figure 3B). Starch and NSC contents in stem tissue under 100% full light were higher than shade treatments (40% and 10% full sunlight) (p < 0.05; Figure 3C).
In U. elongata, shade treatments significantly affected the root SSRs. The SSRs increased as the light level decreased (Figure 3D), indicating that soluble sugar is preferentially used by roots. Accordingly, the roots began to utilize the available starch under low light intensity (40% and 10% full sunlight). In U. elongata, light levels had a limited effect on stem SSRs, which peaked under 40% full sunlight and was relatively similar under the other light levels. This study showed no significant difference in leaf SSRs of U. elongata seedlings among the different light levels (p > 0.05).

4. Discussion

Light is a critical factor providing energy to photosynthesis [48]. However, plants evolve complex adaptation strategies to cope with light stress [28]. In our study, U. elongata seedlings grown under 100% sunlight had higher Pn than those seedlings grown under either of the shading treatments. The decrease in Pn in response to shade was consistent with the observed GS decrease. In contrast, Ci increased or remained unchanged under shade conditions. These results suggested that the decrease in Pn was related to nonstomatal limitations [49]. The significant decreases of Pn and GS in U. elongata seedlings under shading treatments might be owed to the inhibition of carboxylation efficiency, and/or reallocation of leaf nitrogen [11,12]. Notably, the carboxylation efficiency (CE) was reduced under both 40% and 10% full sunlight, which strongly suggests that the decrease in photosynthesis was caused by nonstomatal factors. These findings indicate that a light intensity less than that of 40% full sunlight imposes light limitation, resulting in a reduction in the photosynthetic enzymatic activity of U. elongata seedlings. On the other hand, the smallest leaf biomass, Pn, WUE, and CE values under 10% full sunlight indicated that 10% full sunlight led to a rapid decline in plant growth and development. Excessive shade has become the critical limiting factor for U. elongata seedling photosynthetic capacity. Similar results were indicated in endangered Tetrastigma hemsleyanum [29].
Relevant studies on N allocation have revealed that plants under low light invest more N in light harvesting proteins to maximize carbon gain, as was observed in Juglans nigra, Panax notoginseng, and Abies alba [6,11,42,50,51]. In contrast, high investment of N in RuBisCO and bioenergetic components, which increases the photosynthetic capacity under high light, was observed in Prunus persica and Picea abies [7,50,51]. Plants under shade conditions allocate more N to PL to capture more light energy, and less N to PB, PR, and PC. This N allocation possibly caused a time-lag response of carboxylation [42]. The allocation of leaf N to proteins, for example, PNUE and Pn, were affected by light intensity levels [11,50]. In the present study, PNUE, PR, PC, and PB decreased, and PL increased under low-light (i.e., 40% and 10% full sunlight) in the leaves of U. elongata seedlings. These results indicated that shade increased the light capture efficiency of PSII in U. elongata leaves but decreased the capacity of electron transport. This mechanism might contribute to the observed decreased in photosynthetic capacity under shading of U. elongata seedlings.
The leaf N allocation patterns were affected by CO2 fixation and light-harvesting proteins [11,12]. When the light availability increased, the plants increased N investment in the electron carriers, Calvin cycle enzymes, RuBisCO, and bioenergetic proteins to compete more pigment compounds, such as carotenoids and flavonoids, and antioxidants to protect leaves against excess light [11,51]. These results indicate that U. elongata under shade treatment has evolved to promote the absorbed N, being preferentially transferred from vegetative parts to photosynthetic pigments to obtain an imbalance between C accumulation and N supply [52]. Therefore, the balance between the acquisition and utilization of light energy of U. elongata seedlings may be regulated according to light intensity levels.
N is a critical component of all proteins, such as functional proteins, structural proteins, and photosynthetic proteins. It is necessary for plants to allocate more N to structural proteins for stronger structural defenses under light stress [17,53]. P is the main constitute of ribosomal RNA, which plays an important role in the synthesis of proteins [17]. In U. elongata, in contrast to the observed decrease in leaf P content, as light was reduced, an increasing tendency of leaf N revealed adaptive strategies for poor light environments. In contrast to the greater requirements for proteins and nucleic acids under 100% full sunlight condition, U. elongata seedlings may use more N resources to synthesize light-trapping proteins under shade treatments [46].
The allocation of nutrients (i.e., C, N, and P) among different plant tissues is critical for plant functional diversity [17,54]. The transport of nutrients caused by changes in the balance between element uptake and utilization efficiency may lead to different C, N, and P contents across plant organs [17,55]. In this study, the C, N, and P contents of U. elongata were significantly affected by both light intensity and organ type. Additionally, the variation in nutritional elements (C, N, P) in different organs of U. elongata under light stress suggested the existence of strategies in balancing nutritional metabolism and adapting to light stress [17].
In this study, we also found that C and N contents of the leaves of U. elongata seedlings were significantly higher than those in the stem and root tissues, indicating that the allocation of nutritional elements to leaves was prioritized compared with the stems and roots [17,56]. The stem C, N, and P contents of U. elongata seedlings significantly increased under 10% full sunlight. This can be explained by two distinct mechanisms. First, the total biomass of C, N, and P allocation to the above-ground (especially for stem organs) decreased in U. elongata seedlings under 10% full sunlight, which may lead to an increase in nutrient concentration (i.e., enrichment effect) [57]. Different plant size and biomass can cause the variation of nutritional elements in plant tissues according to a dilution effect [14]. The contents of nutritional elements in the stem also decrease with ontogenetic development [17,58]. Second, there was a higher proportion of C-enriched structural compounds in stem issues under 10% full sunlight, such as lignin and cellulose [46,59]. These results indicated that changes in the profiles of different nutrient elements of U. elongata seedlings may be related to the nutrient use efficiency under different intensity levels [17].
C:N:P stoichiometry reflects the trade-off between growth and stress tolerance [60]. We found lower C:N and C:P ratios in stem and leaf tissues under 10% full sunlight, indicating that the lowest nutrient use efficiency and growth rate occurred under the deep shade treatment. Variation in the C:N and C:P ratios throughout the growth season can be used to indicate the nutrient use efficiency of plants under different light intensity levels [17]. Thus, the C:N ratio in stem and leaf tissues increased from 10% to 100% full sunlight, indicating that the compounds with high C:N or C:P ratio accumulated in U. elongata seedlings under 100% full sunlight.
The leaf N:P ratio can be used to evaluate the limiting patterns of nutrients [52,61]. Generally, ratios of <14 and >16 are interpreted as indicating N and P limitation, respectively [17,62]. In the present study, the leaf N:P ratio of U. elongata was <14 under 100% full sunlight, while >16 under shade treatments. Additionally, when the light intensities increased from 10% to 100% full sunlight, the leaf N:P ratio decreased. These results indicate that the growth of U. elongata was much more limited by P than by N under shade treatments (i.e., 10% and 40% of full sunlight), which was consistent with the fact that U. elongata is a fast-growing plant and has a low N:P ratio under 100% full sunlight [17]. In addition, we found a similar trend in N:P variation in the leaf and stem tissues, which can be used to infer potential N- or P- limitation. This stoichiometric mechanism can clarify plant survival strategies in response to light intensity levels of U. elongata seedlings. In this study, higher C, N, and P contents under 100% full sunlight were found in roots, indicating active uptake of these nutrients. Further studies are needed to elucidate the underlying mechanism.
NSCs are an important energy source and comprise a necessary temporary solute source for transport metabolism and osmoregulation in plant growth and metabolism [63]. NSCs also function as physiological traits corresponding to ecologically adaptive strategies [63,64] and thus have been linked to the capacity to withstand stress such as high light intensity [46,64]. In the present work, we found that the 100% light intensity level resulted in significantly higher NSCs contents in the leaves of U. elongata seedlings. Liu et al. (2020) found that seedlings of Schima superba under light limitation used their carbon stores for growth [45]. Additionally, our results show that U. elongata seedlings tend to preferentially supply more stored NSCs in roots and stems relative to leaves. Increased available NSCs in the roots and stems may be used for root growth and defense against stress conditions such as 100% light intensity level [63,65], as U. elongata seedlings can extend their roots to increase their range of water and minerals absorption [65,66]. In the present study, we observed the lowest Pn and a relatively low total NSC content of U. elongata seedlings under 10% full sunlight, which may lead to their poor growth and survival under extremely shaded conditions.
The carbon starvation hypothesis is among the current leading hypotheses explaining the mechanism of plant mortality under stress—although it has not been verified, owing to a lack of available evidence [63]. Under 10% full sunlight, C starvation may occur when NSC cannot meet the requirements of the growth of seedling [67]. This may be explained by the fast-dying seedlings (U. elongata) having prioritized growth by consuming more NSCs for tissue growth, resulting in reduced metabolism and defense and then yielding an increase in U. elongata seedling mortality after deep shade treatment (e.g., 10% full sunlight) [63]. However, we did not determine when carbon starvation occurs in U. elongata seedlings under 10% full sunlight, and the threshold NSC and NSC content for carbon starvation in U. elongata should therefore be studied in future research. The SSRs reflect the nutrient utilization strategy of plants [45]. The SSRs of U. elongata seedling leaf, stem, and root tissues in response to light intensity levels of were studied. Overall, our results highlight their respective sensitivity, adaptive response under different light levels, and their most favorable light condition. Soluble sugar was preferred by the roots. The roots began to utilize starch under 40% and 10% full sunlight, indicating that the roots shift the carbohydrate use from growth to maintenance induced by the shade treatment in order to balance carbohydrate accumulation and plant growth. This type of trade-off between growth and defense benefits plants can create optimal living conditions under shade [68].

5. Conclusions

Changes in light intensity levels were observed to markedly affect the photosynthesis, nitrogen allocation, NSC allocation pattern, and C:N:P stoichiometry of U. elongata seedlings. Accordingly, 100% full sunlight was the most suitable light condition for seedling growth of U. elongata. More specifically, the seedlings grown under high light had higher Pn, PNUE, PC, PR, PB, and NSC content values relative to those grown under shade. Thus, U. elongata exhibited adaptive strategies to light stress. The species exhibited strong internal nutrient stability under 40% full sunlight. These results indicate that more than 40% full sunlight level might be the favorable light condition for the improvement of the efficiency of U. elongata in understory environments, which can promote the regeneration of U. elongata seedlings.

Supplementary Materials

The following supporting information can be downloaded at: https://www.mdpi.com/article/10.3390/life12091310/s1.

Author Contributions

Conceptualization, G.L. and Z.J.; methodology, Y.L.; investigation, J.L.; resources, Z.J.; data curation, G.L.; writing—original draft preparation, G.L.; writing—review and editing, Z.J.; visualization, J.L.; supervision, S.G.; project administration, Z.J.; funding acquisition, Z.J. All authors have read and agreed to the published version of the manuscript.

Funding

This research work was financially supported by Zhejiang Provincial Special Program for Forestry Development and Resource (2017-74).

Institutional Review Board Statement

Not applicable.

Informed Consent Statement

Not applicable.

Data Availability Statement

The data presented in this study are available from the corresponding author upon request.

Conflicts of Interest

The authors declare no conflict of interest.

Abbreviations

PnPhotosynthetic rate
GsStomatal conductance
CiIntercellular CO2 concentration
TrTranspiration rate
CECarboxylation efficiency
LsValue of stomatal limitation
WUEWater use efficiency
ALeaf area
NmassLeaf N per unit mass
NareaLeaf N per unit area
PNUEPhotosynthetic nitrogen use efficiency
NmassLeaf N content per unit of leaf dry mass
MALeaf dry mass per unit area
CChlLeaf chlorophyll content
VcrSpecific activity of RuBisCO
JmcPotential rate of photosynthetic electron transport per unit cytochrome f
CBRatio of leaf chlorophyll to leaf nitrogen invested in light harvesting
PCFractions of leaf N allocated to photosynthetic
PRFractions of leaf N allocated to RuBisCO
PBFractions of leaf N allocated to bioenergetics
PLFractions of leaf N allocated to light-harvesting
NSCNon-structural carbohydrate
SSRsThe ratio of soluble sugar to starch

References

  1. Haque, M.S.; Kjaer, K.H.; Rosenqvist, E.; Ottosen, C.O. Continuous light increases growth, daily carbon gain, antioxidants, and alters carbohydrate metabolism in a cultivated and a wild tomato species. Front. Plant Sci. 2015, 6, 522. [Google Scholar] [CrossRef] [PubMed]
  2. Smith, H.L.; McAusland, L.; Murchie, E.H. Don’t ignore the green light: Exploring diverse roles in plant processes. J. Exp. Bot. 2017, 68, 9. [Google Scholar] [CrossRef] [PubMed]
  3. Proietti, S.; Moscatello, S.; Riccio, F.; Downey, P.; Battistelli, A. Continuous lighting promotes plant growth, light conversion efficiency, and nutritional quality of Eruca vesicaria (L.) Cav. in controlled environment with minor effects due to light quality. Front. Plant Sci. 2021, 12, 730119. [Google Scholar] [CrossRef]
  4. Valladares, F.; Niinemets, Ü. Shade tolerance, a key plant feature of complex nature and consequences. Annu. Rev. Ecol. Evol. S. 2008, 39, 237–257. [Google Scholar] [CrossRef]
  5. Zhang, H.Y.; Wu, H.H.; Yu, Q.; Wang, Z.W.; Wei, C.Z.; Long, M.; Kattge, J.; Smith, M.; Han, X.G. Sampling date, leaf ageand root size: Implications for the study of plant C:N:P stoichiometry. PLoS ONE 2013, 8, e60360. [Google Scholar] [CrossRef]
  6. Frak, E.; Le, R.X.; Millard, P.; Dreyer, E.; Jaouen, G.; Saint, J.G.; Wendler, R. Changes in total leaf nitrogen and partitioning of leaf nitrogen drive photosynthetic acclimation to light in fully developed walnut leaves. Plant Cell Environ. 2001, 24, 1279–1288. [Google Scholar] [CrossRef]
  7. Roux, X.; Walcroft, A.S.; Daudet, F.A.; Sinoquet, H.; Chaves, M.M.; Rodrigues, A.; Osorio, L. Photosynthetic light acclimation in peach leaves: Importance of changes in mass:area ratio, nitrogen concentration, and leaf nitrogen partitioning. Tree Physiol. 2001, 21, 377–386. [Google Scholar] [CrossRef]
  8. Delagrange, S. Light- and seasonal-induced plasticity in leaf morphology, N partitioning and photosynthetic capacity of two temperate deciduous species. Environ. Exp. Bot. 2011, 70, 1–10. [Google Scholar] [CrossRef]
  9. Gilbert, D.L.; Bertling, I.; Savage, M.J. Radiation transmission through coloured shade netting and plastics and its effect on Eucalyptus grandis × E. nitens hybrid mini-hedge shoot internode length, stem diameter and leaf area. Acta Hortic. 2013, 1007, 773–780. [Google Scholar] [CrossRef]
  10. Givnish, T.J. Adaptation to sun and shade: A whole plant perspective. Aust. J. Plant Physiol. 1988, 15, 63–92. [Google Scholar] [CrossRef] [Green Version]
  11. Katahata, S.; Naramoto, M.; Kakubari, Y.; Mukai, Y. Seasonal changes in photosynthesis and nitrogen allocation in leaves of different ages in evergreen understory shrub Daphniphyllum humile. Trees-Struct. Func. 2007, 21, 619–629. [Google Scholar] [CrossRef]
  12. Hikosaka, K.; Terashima, I. A model of the acclimation of photosynthesis in the leaves of C3 plant to sun and shade with respect to nitrogen use. Plant Cell Environ. 1995, 18, 605–618. [Google Scholar] [CrossRef]
  13. Chapin, F.S.; Schulze, E.D.; Mooney, H.A. The ecology and economics of storage in plants. Annu Rev. Ecol. Syst. 1990, 21, 423–447. [Google Scholar] [CrossRef]
  14. Zhang, M.; Zhu, J.J.; Li, M.C.; Zhang, G.Q.; Yan, Q.L. Different light acclimation strategies of two coexisting tree species seedlings in a temperate secondary forest along five natural light levels. Forest Ecol. Manag. 2013, 306, 234–242. [Google Scholar] [CrossRef]
  15. Myers, J.A.; Kitajima, K. Carbohydrate storage enhances seedling shade and stress tolerance in a Neotropical forest. J. Ecol. 2007, 95, 383–395. [Google Scholar] [CrossRef]
  16. Villar-Salvador, P.; Uscola, M.; Jacobs, D.F. The role of stored carbohydrates and nitrogen in the growth and stress tolerance of planted forest trees. New Forest. 2015, 46, 813. [Google Scholar] [CrossRef]
  17. Li, H.L.; Crabbe, M.J.C.; Xu, F.L.; Wang, W.L.; Ma, L.H.; Niu, R.L.; Gao, X.; Li, X.X.; Zhang, P.; Ma, X. Seasonal variations in carbon, nitrogen and phosphorus concentrations and C:N:P stoichiometry in different organs of a Larix principis-rupprechtii Mayr. plantation in the Qinling Mountains, China. PLoS ONE 2017, 12, e0185163. [Google Scholar] [CrossRef]
  18. Jing, H.; Zhou, H.X.; Wang, G.L.; Xue, S.; Liu, G.B.; Duan, M.C. Nitrogen addition changes the stoichiometry and growth rate of different organs in pinus tabuliformis seedlings. Front. Plant Sci. 2017, 8, 1922. [Google Scholar] [CrossRef]
  19. Woods, H.; Makino, W.; Cotner, J.; Hobbie, S.; Harrison, J.; Acharya, K.; Elser, J. Temperature and the chemical composition of poikilothermic organisms. Funct. Ecol. 2003, 17, 237–245. [Google Scholar] [CrossRef]
  20. An, Z.; Niu, D.C.; Wen, H.Y.; Yang, Y.; Zhang, H.R.; Fu, H. Effects of N addition on nutrient resorption efficiency and C:N:P stoichiometric characteristics in Stipa bungeana of steppe grasslands in the Loess Plateau, China. Chin. J. Plant Ecol. 2011, 35, 801–807. [Google Scholar] [CrossRef]
  21. Luo, Y.; Chen, L.; Peng, Q.; Yang, G.; Zhang, W. Distribution pattern and community survey of Ulmus elongata, one of plant species with extremely small populations in China. South Chin. For. Sci. 2018, 46, 1–4, (In Chinese with English Summary). [Google Scholar]
  22. Fu, L.G. China Plant Red Data Book: Rare and Endangered Plants; Science Press: Beijing, China, 1991. (In Chinese) [Google Scholar]
  23. Zhou, Q.; Wu, S.Y.; Jiang, C.X.; Tong, Y.P.; Zhao, T.; Zhang, B.; Nong, X.H.; Jin, Z.X.; Hu, J.F. A new coumarin derivative from the stems of the endangered plant Ulmus elongata. Nat. Prod. Res. 2020, 1, 3562–3568. [Google Scholar] [CrossRef]
  24. IUCN. IUCN Red List of Threatened Species. Available online: https://www.iucnredlist.org/species/32459/9708624 (accessed on 29 March 2022).
  25. Gao, J.G.; Wu, Y.H.; Xu, G.D.; Li, W.Q.; Yao, G.H.; Ma, J.; Liu, P. Phylogeography of Ulmus elongata based on Fourier transform-infrared spectroscopy (FTIR), thermal gravimetric and differential thermal analyses. Biochem. Syst. Ecol. 2012, 40, 184e191. [Google Scholar] [CrossRef]
  26. Jiang, Y.S. The study on natural regeneration of Ulmus elongata. J. Fujian For. Sci. Technol. 2003, 30, 55–58, (In Chinese with English Summary). [Google Scholar]
  27. Liu, X.X.; Xu, G.D.; Wu, Y.H.; Ma, L.; Gao, J.G.; Zhang, Y.; Liu, P. Leaf characters of Ulmus elongata in fragmented habitats: Implications for conservation. Acta Ecol. Sin. 2017, 37, 346–353. [Google Scholar] [CrossRef]
  28. Zhang, Y.F.; Chen, C.; Jin, Z.X.; Yang, Z.N.; Li, Y.L. Leaf anatomy, photosynthesis, and chloroplast ultrastructure of Heptacodium miconioides seedlings reveal adaptation to light environment. Environ. Exp. Bot. 2022, 195, 104780. [Google Scholar] [CrossRef]
  29. Dai, Y.J.; Shen, Z.G.; Liu, Y.; Wang, L.L.; Hannaway, D.; Lu, H.F. Effects of shade treatments on the photosynthetic capacity, chlorophyll fluorescence, and chlorophyll content of Tetrastigma hemsleyanum Diels et Gilg. Environ. Exp. Bot. 2009, 65, 177–182. [Google Scholar] [CrossRef]
  30. Cernusak, L.A. Gas exchange and water-use efficiency in plant canopies. Plant Biol. 2020, 22, 52–67. [Google Scholar] [CrossRef]
  31. Nijs, I.; Ferris, R.; Blum, H.; Hendrey, G.; Impens, I. Stomatal regulation in a changing climate: A field study using Free Air Temperature Increase (FATI) and Free Air CO2 Enrichment (FACE). Plant Cell Environ. 1997, 20, 1041–1050. [Google Scholar] [CrossRef]
  32. Li, W.R.; Zhang, S.Q.; Shan, L. Responsibility of non-stomatal limitations for the reduction of photosynthesis-response of photosynthesis and antioxidant enzyme characteristics in alfalfa (Medicago sativa L.) seedlings to water stress and rehydration. Front. Agric. China 2007, 1, 255–264. [Google Scholar] [CrossRef]
  33. Long, S.P.; Bernacchi, C.J. Gas exchange measurements, what can they tell us about the underlying limitations to photosynthesis? Procedures and sources of error. J. Exp. Bot. 2003, 54, 2393–2401. [Google Scholar] [CrossRef] [PubMed]
  34. Yang, S.J.; Sun, M.; Zhang, Y.J.; Cochard, H.; Cao, K.F. Strong leaf morphological, anatomical, and physiological responses of a subtropical woody bamboo (Sinarundinaria nitida) to contrasting light environments. Plant Ecol. 2014, 215, 97–109. [Google Scholar] [CrossRef]
  35. Bao, S.D. The Method of the Soil and Agriculture Chemical Analysis; China Agriculture Press: Beijing, China, 2000. (In Chinese) [Google Scholar]
  36. Hou, W.F.; Trankner, M.; Lu, J.W.; Yan, J.Y.; Huang, S.Y.; Ren, T.; Cong, R.H.; Li, X.K. Interactive effects of nitrogen and potassium on photosynthesis and photosynthetic nitrogen allocation of rice leaves. BMC Plant Biol. 2019, 19, 302. [Google Scholar] [CrossRef]
  37. Dreccer, M.F.; Schapendonk, A.H.C.M.; Oijen, M.V.; Pot, C.S.; Rabbinge, R. Radiation and nitrogen use at the leaf and canopy level by wheat and oilseed rape during the critical period for grain number definition. Aust. J. Plant Physiol. 2000, 27, 899–910. [Google Scholar] [CrossRef]
  38. Hua, Q.; Ying, C.; Yan, X.; Yao, Y.; An, S. Leaf nitrogen partition between photosynthesis and structural defense in invasive and native tall form spartina alterniflora populations: Effects of nitrogen treatments. Biol. Invasions 2012, 14, 2039–2048. [Google Scholar] [CrossRef]
  39. Niinemets, Ü.; Tenhunen, J.D. A model separating leaf structural and physiological effects on carbon gain along light gradients for the shade-tolerant species Acer saccharum. Plant Cell Environ. 1997, 20, 845–866. [Google Scholar] [CrossRef]
  40. Niinemets, Ü.; Bilger, W.; Kull, O.; Tenhunen, J.D. Acclimation to high irradiance in temperature deciduous trees in the field: Changes in xanthophyll cycle pool size and in photosynthetic capacity along a canopy light gradient. Plant Cell Environ. 1998, 21, 1205–1218. [Google Scholar] [CrossRef]
  41. Feng, Y.L.; Auge, H.; Ebeling, S.K. Invasive Buddleja davidii allocates more nitrogen to its photosynthetic machinery than five native woody species. Oecologia 2007, 153, 501–510. [Google Scholar] [CrossRef]
  42. Chen, J.W.; Kuang, S.B.; Long, G.Q.; Meng, Z.G.; Li, L.G.; Chen, Z.J.; Zhang, G.H.; Yang, S.C. Steady-state and dynamic photosynthetic performance and nitrogen partitioning in the shade-demanding plant Panax notoginseng under different levels of growth irradiance. Acta Physiol. Plant. 2014, 36, 2409–2420. [Google Scholar] [CrossRef]
  43. Tang, J.C.; Sun, B.D.; Cheng, R.M.; Shi, Z.M.; Luo, D.; Liu, S.R.; Centritto, M. The effect of low irradiance on leaf nitrogen allocation and mesophyll conductance to CO2 in seedlings of four tree species in subtropical China. Plants 2021, 10, 2213. [Google Scholar] [CrossRef]
  44. Feng, Y.L.; Fu, G.L.; Zheng, Y.L. Specific leaf area relates to the differences in leaf construction cost, photosynthesis, nitrogen allocation, and use efficiencies between invasive and noninvasive alien congeners. Planta 2008, 228, 383–390. [Google Scholar] [CrossRef] [PubMed]
  45. Liu, Q.Q.; Huang, Z.J.; Wang, Z.N.; Chen, Y.F.; Wen, Z.M.; Liu, B.; Tigabu, M. Responses of leaf morphology, NSCs contents and C:N:P stoichiometry of Cunninghamia lanceolata and Schima superba to shading. BMC Plant Biol. 2020, 20, 354. [Google Scholar] [CrossRef]
  46. Xie, H.T.; Yu, M.K.; Cheng, X.R. Leaf non-structural carbohydrate allocation and C:N:P stoichiometry in response to light acclimation in seedlings of two subtropical shade-tolerant tree species. Plant Physiol. Bioch. 2018, 124, 146–154. [Google Scholar] [CrossRef]
  47. Guo, Q.Q.; Li, H.E.; Gao, C.; Yang, R. Leaf traits and photosynthetic characteristics of endangered Sinopodophyllum hexandrum (Royle) Ying under different light regimes in Southeastern Tibet Plateau. Photosynthetica 2019, 57, 548–555. [Google Scholar] [CrossRef]
  48. Liu, P.; Yang, Y.S.; Xu, G.D.; Hao, C.Y. Physiological response of rare and endangered seven-son-flower (Heptacodium miconioides) to light stress under habitat fragmentation. Environ. Exp. Bot. 2006, 57, 32–40. [Google Scholar] [CrossRef]
  49. Zhang, S.R.; Gao, R.F. Diurnal Changes of gas exchange, Chlorophyll fluorescence, and stomatal aperture of hybrid poplar clones subjected to midday light stress. Photosynthetica 1999, 37, 559–571. [Google Scholar] [CrossRef]
  50. Katahata, S.; Naramoto, M.; Kakubari, Y.; Mukai, Y. Photosynthetic capacity and nitrogen partitioning in foliage of the evergreen shrub, Daphniphyllum humile, along a natural light gradient. Tree Physiol. 2007, 27, 199–208. [Google Scholar] [CrossRef]
  51. Grassi, G.; Bagnaresi, U. Foliar morphological and physiological plasticity in Picea abies and Abies alba saplings along a natural light gradient. Tree Physiol. 2001, 21, 959–967. [Google Scholar] [CrossRef]
  52. Ye, Y.S.; Liang, X.Q.; Chen, Y.X.; Li, L.; Ji, Y.J.; Zhu, C.Y. Carbon, nitrogen and phosphorus accumulation and partitioning, and C:N:P stoichiometry in late-season rice under different water and nitrogen managements. PLoS ONE 2014, 9, e101776. [Google Scholar] [CrossRef]
  53. Guan, L.L.; Wen, D.Z. More nitrogen partition in structural proteins and decreased photosynthetic nitrogen-use efficiency of Pinus massoniana under in situ polluted stress. J. Plant Res. 2011, 124, 663–673. [Google Scholar] [CrossRef]
  54. Kerkhoff, A.J.; Fagan, W.F.; Elser, J.J.; Enquist, B.J. Phylogeneticand growth form variation in the scaling of nitrogen and phosphorus in the seed plants. Am. Nat. 2006, 168, 103–122. [Google Scholar] [CrossRef] [PubMed]
  55. Abbas, M.; Ebeling, A.; Oelmann, Y.; Ptacnik, R.; Roscher, C.; Weigelt, A.; Weisser, W.W.; Wilcke, W.; Hillebrand, H. Biodiversity effects on plant stoichiometry. PLoS ONE 2013, 8, e58179. [Google Scholar] [CrossRef] [PubMed] [Green Version]
  56. Yang, H.M.; Unkovich, M.; McNeill, A.; Wang, X.Z. Symbiotic N fixation and nitrate utilisation in irrigated lucerne (Medicago sativa) systems. Biol. Fert. Soils. 2011, 47, 377–385. [Google Scholar] [CrossRef]
  57. Sun, W.Z.; Shi, F.X.; Chen, H.M.; Zhang, Y.; Guo, Y.D.; Mao, R. Relationship between relative growth rate and C:N:P stoichiometry for the marsh herbaceous plants under water-level stress conditions. Glob. Ecol. Conserv. 2021, 25, e01416. [Google Scholar] [CrossRef]
  58. Elser, J.J.; Fagan, W.F.; Kerkhoff, A.J.; Swenson, N.G.; Enquist, B.J. Biological stoichiometry of plant production: Metabolism, scaling and ecological response to global change. New Phytol. 2010, 186, 593–608. [Google Scholar] [CrossRef]
  59. Li, H.; Li, J.; He, Y.L.; Li, S.J.; Liang, Z.S.; Peng, C.H.; Polle, A.; Luo, Z.B. Changes in carbon, nutrients and stoichiometric relations under different soil depths, plant tissues and ages in black locust plantations. Acta Physiol. Plant. 2013, 35, 2951–2964. [Google Scholar] [CrossRef]
  60. Ma, W.J.; Li, J.; Jimoh, S.O.; Zhang, Y.J.; Guo, F.H.; Ding, Y.; Li, X.L.; Hou, X.Y. Stoichiometric ratios support plant adaption to grazing moderated by soil nutrients and root enzymes. PeerJ 2019, 2019, e7047. [Google Scholar] [CrossRef]
  61. Tessier, J.T.; Raynal, D.J. Use of nitrogen to phosphorus ratios in plant tissue as an indicator of nutrient limitation and nitrogen saturation. J. Appl. Ecol. 2003, 40, 523–534. [Google Scholar] [CrossRef]
  62. Townsend, A.R.; Cleveland, C.C.; Asner, G.P.; Bustamante, M.M.C. Controls over foliar N:P ratios in tropical rain forests. Ecology 2007, 88, 107–118. [Google Scholar] [CrossRef]
  63. Qiu, Q.; Wang, J.H.; Su, Y.; Ma, J.W.; Li, J.Y.; He, Q. A test of the carbon starvation hypothesis in shrubs during drought-induced mortality. Pak. J. Bot. 2019, 51, 2023–2030. [Google Scholar] [CrossRef]
  64. Poorter, L.; Kitajima, K. Carbohydrate storage and light requirements of tropical moist and dry forest tree species. Ecology 2007, 88, 1000–1011. [Google Scholar] [CrossRef] [PubMed]
  65. Imaji, A.; Seiwa, K. Carbon allocation to defense, storage and growth in seedlings of two temperate broadleaved tree species. Oecologia 2010, 162, 273–281. [Google Scholar] [CrossRef] [PubMed]
  66. Wishart, J.; George, T.S.; Brown, L.K.; White, P.J.; Ramsay, G.; Jones, H.; Gregory, P.J. Field phenotyping of potato to assess root and shoot characteristics associated with drought tolerance. Plant Soil. 2014, 378, 351–363. [Google Scholar] [CrossRef]
  67. Yan, W.M.; Zhong, Y.Q.W.; Shangguan, Z.P. Rapid response of the carbon balance strategy in Robinia pseudoacacia and Amorpha fruticosa to recurrent drought. Environ. Exp. Bot. 2017, 138, 46–56. [Google Scholar] [CrossRef]
  68. Sergio, T.; Alberto, P.; Stefano, P.; Daniela, F. Influence of light and shoot development stage on leaf photosynthesis and carbohydrate status during the adventitious root formation in cuttings of Corylus avellana L. Front. Plant Sci. 2015, 6, 973. [Google Scholar] [CrossRef] [Green Version]
Figure 1. Photosynthetic parameters in Ulmus elongata leaves under different light intensity levels. (A) Net photosynthetic rate (Pn); (B) Stomatal conductance (Gs); (C) Intercellular CO2 concentration (Ci); (D) Transpiration rate (Tr). Data are presented as the mean ± SE. For each panel, bars labeled with different small letters indicate a significant difference at 0.05 levels.
Life 12 01310 g001
Figure 2. Allocation proportion of carbon (A), nitrogen (B), and phosphorus (C) in the leaf, stem, and root tissues of Ulmus elongata seedlings in response to light intensity levels. For each panel, bars labeled with different letters indicate a significant difference at 0.05 levels.
Life 12 01310 g002
Figure 3. Soluble sugar content (A), starch content (B), non-structural carbon (NSC) content (C), and soluble sugar-to-starch ratio (SSRs) (D) in leaf, stem, and root tissues of Ulmus elongata seedlings in response to light intensity levels. For each panel, bars labeled with different letters indicate a significant difference at 0.05 levels.
Life 12 01310 g003
Table 1. Effects of different light intensity levels on stomatal limitation (Ls), carboxylation efficiency (CE), and water use efficiency (WUE) in Ulmus elongata leaves. Data are presented as the mean ± SE. Different small letters indicate significant differences at 0.05 levels.
TreatmentLsCE
(mmol·m−2·s−1)
WUE
(mmol·mol−1)
100%0.086 ± 0.004 a39.96 ± 2.13 a2.38 ± 0.04 b
40%0.075 ± 0.007 b23.99 ± 1.18 b2.60 ± 0.07 a
10%0.083 ± 0.007 a19.18 ± 0.86 c1.45 ± 0.03 c
Table 2. Effects of different light intensity levels on the photosynthetic nitrogen use efficiency (PNUE) and fractions of leaf N allocated to RuBisCO (PR), bioenergetic (PB), light-harvesting (PL), and photosynthetic components (PC) in Ulmus elongata leaves. Data are presented as the mean ± SE. Different small letters indicate significant differences at 0.05 levels.
TreatmentPNUE
(μmol·g−1·s−1)
PR
(g·g−1)
PB
(g·g−1)
PL
(g·g−1)
PC
(g·g−1)
100%13.50 ± 1.385 a0.285 ± 0.015 a0.025 ± 0.001 a0.041 ± 0.006 b0.350 ± 0.019 a
40%10.33 ± 0.542 ab0.211 ± 0.019 b0.018 ± 0.002 b0.051 ± 0.008 ab0.280 ± 0.028 b
10%6.67 ± 1.167 b0.142 ± 0.007 c0.012 ± 0.001 c0.071 ± 0.002 a0.224 ± 0.007 b
Table 3. Carbon, nitrogen, and phosphorus contents in the leaf, stem, and root tissues of Ulmus elongata seedlings in response to light intensity levels. Data are presented as the mean ± SE. Different letters indicate significant difference at 0.05 levels.
TreatmentC
(mg·g−1)
N
(mg·g−1)
P
(mg·g−1)
Root100%200.76 ± 5.45 a7.93 ± 0.79 a2.15 ± 5.45 a
40%178.50 ± 14.37 ab4.14 ± 0.22 b2.53 ± 0.30 a
10%135.94 ± 15.00 b7.44 ± 1.12 a1.21 ± 0.16 b
Stem100%202.85 ± 6.27 b4.28 ± 0.17 b2.18 ± 0.07 b
40%225.19 ± 8.05 b5.32 ± 0.23 b2.06 ± 0.07 b
10%278.93 ± 14.10 a7.25 ± 0.44 a2.79 ± 0.14 a
Leaf100%468.44 ± 7.68 a14.15 ± 0.84 c1.49 ± 0.02 a
40%412.91 ± 52.66 a20.85 ± 0.47 b0.98 ± 0.04 b
10%284.17 ± 11.39 b25.76 ± 0.30 a0.84 ± 0.01 c
Table 4. Effects of different light intensity levels on the C, N, and P stoichiometry of Ulmus elongata seedlings. Data are presented as the mean ± SE. Different letters indicate a significant difference at 0.05 levels.
TreatmentC:NC:PN:P
Root100%25.76 ± 2.32 b96.10 ± 10.50 b3.79 ± 0.50 b
40%42.97 ± 1.35 a71.94 ± 7.22 c1.67 ± 0.15 c
10%18.57 ± 1.20 b113.19 ± 4.61 a6.16 ± 0.55 a
Stem100%47.48 ± 2.27 a92.98 ± 5.33 b1.97 ± 0.14 b
40%42.53 ± 2.65 ab109.18 ± 10.41 a2.58 ± 0.18 a
10%39.54 ± 0.55 b100.11 ± 7.65 ab2.60 ± 0.11 a
Leaf100%33.39 ± 2.36 a313.73 ± 1.57 b9.49 ± 0.67 c
40%19.76 ± 2.27 b417.04 ± 36.41 a21.27 ± 0.88 b
10%11.04 ± 0.47 c338.61 ± 7.91 b30.73 ± 0.60 a
Publisher’s Note: MDPI stays neutral with regard to jurisdictional claims in published maps and institutional affiliations.

