
Exploratory Analysis of the Role of Radiomic Features in the Differentiation of Oncocytoma and Chromophobe RCC in the Nephrographic CT Phase

 , and
, and
Abstract
:1. Introduction
2. Materials and Methods
2.1. Patients
2.2. Image Acquisition
2.3. Image Analysis
2.4. Statistical Analysis and Feature Selection
2.5. Model Elaboration
3. Results
4. Discussion
Supplementary Materials
Author Contributions
Funding
Institutional Review Board Statement
Informed Consent Statement
Data Availability Statement
Conflicts of Interest
References
- Van Oostenbrugge, T.J.; Fütterer, J.J.; Mulders, P.F.A. Diagnostic Imaging for Solid Renal Tumors: A Pictorial Review. Kidney Cancer 2018, 2, 79–93. [Google Scholar] [CrossRef]
- Souza, D.L.B.; Bernal, M.M. Incidence, Prevalence and Mortality of Kidney Cancer in Spain: Estimates and Projections for the 1998–2022 Period. Actas Urológicas Españolas 2012, 36, 521–526. [Google Scholar] [CrossRef] [PubMed]
- Capitanio, U.; Bensalah, K.; Bex, A.; Boorjian, S.A.; Bray, F.; Coleman, J.; Gore, J.L.; Sun, M.; Wood, C.; Russo, P.L. Epidemiology of renal cell carcinoma. Eur. Urol. 2019, 75, 74–84. [Google Scholar] [CrossRef] [PubMed]
- Dyer, R.; DiSantis, D.J.; McClennan, B.L. Simplified imaging approach for evaluation of the solid renal mass in adults. Radiology 2008, 247, 331–343. [Google Scholar] [CrossRef] [PubMed]
- Krishna, S.; Murray, C.A.; McInnes, M.D.; Chatelain, R.; Siddaiah, M.; Al-Dandan, O.; Narayanasamy, S.; Schieda, N. CT Imaging of Solid Renal Masses: Pitfalls and Solutions. Clin. Radiol. 2017, 72, 708–721. [Google Scholar] [CrossRef]
- Amin, M.B.; Paner, G.P.; Alvarado-Cabrero, I.; Young, A.N.; Stricker, H.J.; Lyles, R.H.; Moch, H. Chromophobe renal cell carcinoma: Histomorphologic characteristics and evaluation of conventional pathologic prognostic parameters in 145 cases. Am. J. Surg. Pathol. 2008, 32, 1822–1834. [Google Scholar] [CrossRef]
- Vera-Badillo, F.E.; Conde, E.; Duran, I. Chromophobe renal cell carcinoma: A review of an uncommon entity. Int. J. Urol. 2012, 19, 894–900. [Google Scholar] [CrossRef]
- Chao, D.H.; Zisman, A.; Pantuck, A.J.; Freedland, S.J.; Said, J.W.; Belldegrun, A.S. Changing concepts in the management of renal oncocytoma. Urology 2002, 59, 635–642. [Google Scholar] [CrossRef]
- Marko, J.; Craig, R.; Nguyen, A.; Udager, A.M.; Wolfman, D.J. Chromophobe Renal Cell Carcinoma with Radiologic-Pathologic Correlation. RadioGraphics 2021, 41, 1408–1419. [Google Scholar] [CrossRef]
- Raman, S.P.; Johnson, P.T.; Allaf, M.E.; Netto, G.; Fishman, E.K. Chromophobe renal cell carcinoma: Multiphase MDCT enhancement patterns and morphologic features. AJR Am. J. Roentgenol. 2013, 201, 1268–1276. [Google Scholar] [CrossRef]
- Fu, W.; Huang, G.; Moloo, Z.; Girgis, S.; Patel, V.H.; Low, G. Multimodality imaging characteristics of the common renal cell carcinoma subtypes: An analysis of 544 pathologically proven tumors. J. Clin. Imaging Sci. 2016, 6, 50. [Google Scholar] [CrossRef] [PubMed]
- Tikkakoski, T.; Päivänsalo, M.; Alanen, A.; Nurmi, M.; Taavitsainen, M.; Farin, P.; Apaja-Sarkkinen, M. Radiologic findings in renal oncocytoma. Acta Radiol. 1991, 32, 363–367. [Google Scholar] [CrossRef] [PubMed]
- Cochand-Priollet, B.; Molinie, V.; Bougaran, J.; Bouvier, R. Renal chromophobe cell carcinoma and oncocytoma: A comparative morphologic, histochemical, and immunohistochemical study of 124 cases. Arch. Pathol. Lab. Med. 1997, 121, 1081–1086. [Google Scholar]
- Israel, G.M.; Bosniak, M.A. How I do it: Evaluating renal masses. Radiology 2005, 236, 441–450. [Google Scholar] [CrossRef] [PubMed]
- Abdessater, M.; Kanbar, A.; Comperat, E.; Dupont-Athenor, A.; Alechinsky, L.; Mouton, M.; Sebe, P. Renal oncocytoma: An algorithm for diagnosis and management. Urology 2020, 143, 173–180. [Google Scholar] [CrossRef] [PubMed]
- Baboudjian, M.; Moser, D.; Yanagisawa, T.; Gondran-Tellier, B.; Compérat, E.M.; Ambrosetti, D.; Daniel, L.; Bastide, C.; Shariat, S.F.; Lechevallier, E.; et al. Benefit and harm of active surveillance for biopsy-proven renal oncocytoma: A systematic review and pooled analysis. Eur. Urol. Open Sci. 2022, 41, 8–15. [Google Scholar] [CrossRef] [PubMed]
- Van Timmeren, J.E.; Cester, D.; Tanadini-Lang, S.; Alkadhi, H.; Baessler, B. Radiomics in Medical Imaging—“How-to” Guide and Critical Reflection. Insights Imaging 2020, 11, 91. [Google Scholar] [CrossRef]
- Rogers, W.; Thulasi Seetha, S.; Refaee, T.A.G.; Lieverse, R.I.Y.; Granzier, R.W.Y.; Ibrahim, A.; Keek, S.A.; Sanduleanu, S.; Primakov, S.P.; Beuque, M.P.L.; et al. Radiomics: From Qualitative to Quantitative Imaging. Br. J. Radiol. 2020, 93, 20190948. [Google Scholar] [CrossRef]
- Lambin, P.; Leijenaar, R.T.; Deist, T.M.; Peerlings, J.; De Jong, E.E.; Van Timmeren, J.; Sanduleanu, S.; Larue, R.T.; Even, A.J.; Jochems, A.; et al. Radiomics: The bridge between medical imaging and personalized medicine. Nat. Rev. Clin. Oncol. 2017, 14, 749–762. [Google Scholar] [CrossRef]
- Kocak, B.; Kus, E.A.; Yardimci, A.H.; Bektas, C.T.; Kilickesmez, O. Machine Learning in Radiomic Renal Mass Characterization: Fundamentals, Applications, Challenges, and Future Directions. Am. J. Roentgenol. 2020, 215, 920–928. [Google Scholar] [CrossRef]
- Ursprung, S.; Beer, L.; Bruining, A.; Woitek, R.; Stewart, G.D.; Gallagher, F.A.; Sala, E. Radiomics of Computed Tomography and Magnetic Resonance Imaging in Renal Cell Carcinoma—A Systematic Review and Meta-Analysis. Eur. Radiol. 2020, 30, 3558–3566. [Google Scholar] [CrossRef] [PubMed]
- Bhandari, A.; Ibrahim, M.; Sharma, C.; Liong, R.; Gustafson, S.; Prior, M. CT-Based Radiomics for Differentiating Renal Tumours: A Systematic Review. Abdom. Radiol. 2021, 46, 2052–2063. [Google Scholar] [CrossRef] [PubMed]
- Suarez-Ibarrola, R.; Basulto-Martinez, M.; Heinze, A.; Gratzke, C.; Miernik, A. Radiomics Applications in Renal Tumor Assessment: A Comprehensive Review of the Literature. Cancers 2020, 12, 1387. [Google Scholar] [CrossRef] [PubMed]
- Wentland, A.L.; Yamashita, R.; Kino, A.; Pandit, P.; Shen, L.; Brooke Jeffrey, R.; Rubin, D.; Kamaya, A. Differentiation of Benign from Malignant Solid Renal Lesions Using CT-Based Radiomics and Machine Learning: Comparison with Radiologist Interpretation. Abdom. Radiol. 2022, 48, 642–648. [Google Scholar] [CrossRef]
- Dehghani Firouzabadi, F.; Gopal, N.; Homayounieh, F.; Anari, P.Y.; Li, X.; Ball, M.W.; Jones, E.C.; Samimi, S.; Turkbey, E.; Malayeri, A.A. CT Radiomics for Differentiating Oncocytoma from Renal Cell Carcinomas: Systematic Review and Meta-Analysis. Clin. Imaging 2023, 94, 9–17. [Google Scholar] [CrossRef]
- Alhussaini, A.J.; Steele, J.D.; Nabi, G. Comparative Analysis for the Distinction of Chromophobe Renal Cell Carcinoma from Renal Oncocytoma in Computed Tomography Imaging Using Machine Learning Radiomics Analysis. Cancers 2022, 14, 3609. [Google Scholar] [CrossRef]
- Sun, X.-Y.; Feng, Q.-X.; Xu, X.; Zhang, J.; Zhu, F.-P.; Yang, Y.-H.; Zhang, Y.-D. Radiologic-Radiomic Machine Learning Models for Differentiation of Benign and Malignant Solid Renal Masses: Comparison with Expert-Level Radiologists. Am. J. Roentgenol. 2020, 214, W44–W54. [Google Scholar] [CrossRef]
- Li, Y.; Huang, X.; Xia, Y.; Long, L. Value of Radiomics in Differential Diagnosis of Chromophobe Renal Cell Carcinoma and Renal Oncocytoma. Abdom. Radiol. 2020, 45, 3193–3201. [Google Scholar] [CrossRef]
- Baghdadi, A.; Aldhaam, N.A.; Elsayed, A.S.; Hussein, A.A.; Cavuoto, L.A.; Kauffman, E.; Guru, K.A. Automated Differentiation of Benign Renal Oncocytoma and Chromophobe Renal Cell Carcinoma on Computed Tomography Using Deep Learning. BJU Int. 2020, 125, 553–560. [Google Scholar] [CrossRef]
- Deng, Y.; Soule, E.; Cui, E.; Samuel, A.; Shah, S.; Lall, C.; Sundaram, C.; Sandrasegaran, K. Usefulness of CT Texture Analysis in Differentiating Benign and Malignant Renal Tumours. Clin. Radiol. 2020, 75, 108–115. [Google Scholar] [CrossRef]
- Li, X.; Ma, Q.; Nie, P.; Zheng, Y.; Dong, C.; Xu, W. A CT-Based Radiomics Nomogram for Differentiation of Renal Oncocytoma and Chromophobe Renal Cell Carcinoma with a Central Scar-Matched Study. BJR 2022, 95, 20210534. [Google Scholar] [CrossRef] [PubMed]
- Papanikolaou, N.; Matos, C.; Koh, D.M. How to Develop a Meaningful Radiomic Signature for Clinical Use in Oncologic Patients. Cancer Imaging 2020, 20, 33. [Google Scholar] [CrossRef]
- Zabihollahy, F.; Schieda, N.; Krishna, S.; Ukwatta, E. Automated classification of solid renal masses on contrast-enhanced computed tomography images using convolutional neural network with decision fusion. Eur. Rad. 2020, 30, 5183–5190. [Google Scholar] [CrossRef] [PubMed]
- Amadasun, M.; King, R. Textural features corresponding to textural properties. IEEE Trans. Syst. Man. Cybern. 1989, 19, 1264–1274. [Google Scholar] [CrossRef]
- Van Griethuysen, J.J.; Fedorov, A.; Parmar, C.; Hosny, A.; Aucoin, N.; Narayan, V.; Beets-Tan, R.G.; Fillion-Robin, J.C.; Pieper, S.; Aerts, H.J. Computational Radiomics System to Decode the Radiographic Phenotype. Cancer Res. 2017, 77, e104–e107. [Google Scholar] [CrossRef] [PubMed]
- Yu, H.; Scalera, J.; Khalid, M.; Touret, A.-S.; Bloch, N.; Li, B.; Qureshi, M.M.; Soto, J.A.; Anderson, S.W. Texture Analysis as a Radiomic Marker for Differentiating Renal Tumors. Abdom. Radiol. 2017, 42, 2470–2478. [Google Scholar] [CrossRef] [PubMed]
- Bodalal, Z.; Trebeschi, S.; Nguyen-Kim, T.D.L.; Schats, W.; Beets-Tan, R. Radiogenomics: Bridging imaging and genomics. Abdom. Radiol. 2019, 44, 1960–1984. [Google Scholar] [CrossRef]
- Jaggi, A.; Mastrodicasa, D.; Charville, G.W.; Jeffrey Jr, R.B.; Napel, S.; Patel, B. Quantitative image features from radiomic biopsy differentiate oncocytoma from chromophobe renal cell carcinoma. J. Med. Imaging 2021, 8, 054501. [Google Scholar] [CrossRef]
- Spadarella, G.; Stanzione, A.; Akinci D’Antonoli, T.; Andreychenko, A.; Fanni, S.C.; Ugga, L.; Kotter, E.; Cuocolo, R. Systematic Review of the Radiomics Quality Score Applications: An EuSoMII Radiomics Auditing Group Initiative. Eur. Radiol. 2022, 33, 1884–1894. [Google Scholar] [CrossRef]
- Zwanenburg, A.; Vallières, M.; Abdalah, M.A.; Aerts, H.J.; Andrearczyk, V.; Apte, A.; Ashrafinia, S.; Bakas, S.; Beukinga, R.J.; Boellaard, R. The Image Biomarker Standardization Initiative: Standardized Quantitative Radiomics for High-Throughput Image-Based Phenotyping. Radiology 2020, 295, 328–338. [Google Scholar] [CrossRef]
- Fournier, L.; Costaridou, L.; Bidaut, L.; Michoux, N.; Lecouvet, F.E.; de Geus-Oei, L.F.; Boellaard, R.; Oprea-Lager, D.E.; Obuchowski, N.A.; Caroli, A.; et al. Incorporating Radiomics into Clinical Trials: Expert Consensus Endorsed by the European Society of Radiology on Considerations for Data-Driven Compared to Biologically Driven Quantitative Biomarkers. Eur. Radiol. 2021, 31, 6001–6012. [Google Scholar] [CrossRef]


| Oncocytoma | Chromophobe | |
|---|---|---|
| Number of cases | 19 | 19 |
| Median age (range) | 69 (86–57) | 70 (85–38) |
| Sex | ||
| Female | 11 (57.9%) | 8 (42.1%) |
| Male | 8 (42.1%) | 11 (57.9%) |
| Laterality | ||
| Right | 8 (42.1%) | 11 (57.9%) |
| Left | 11 (57.9%) | 8 (42.1%) |
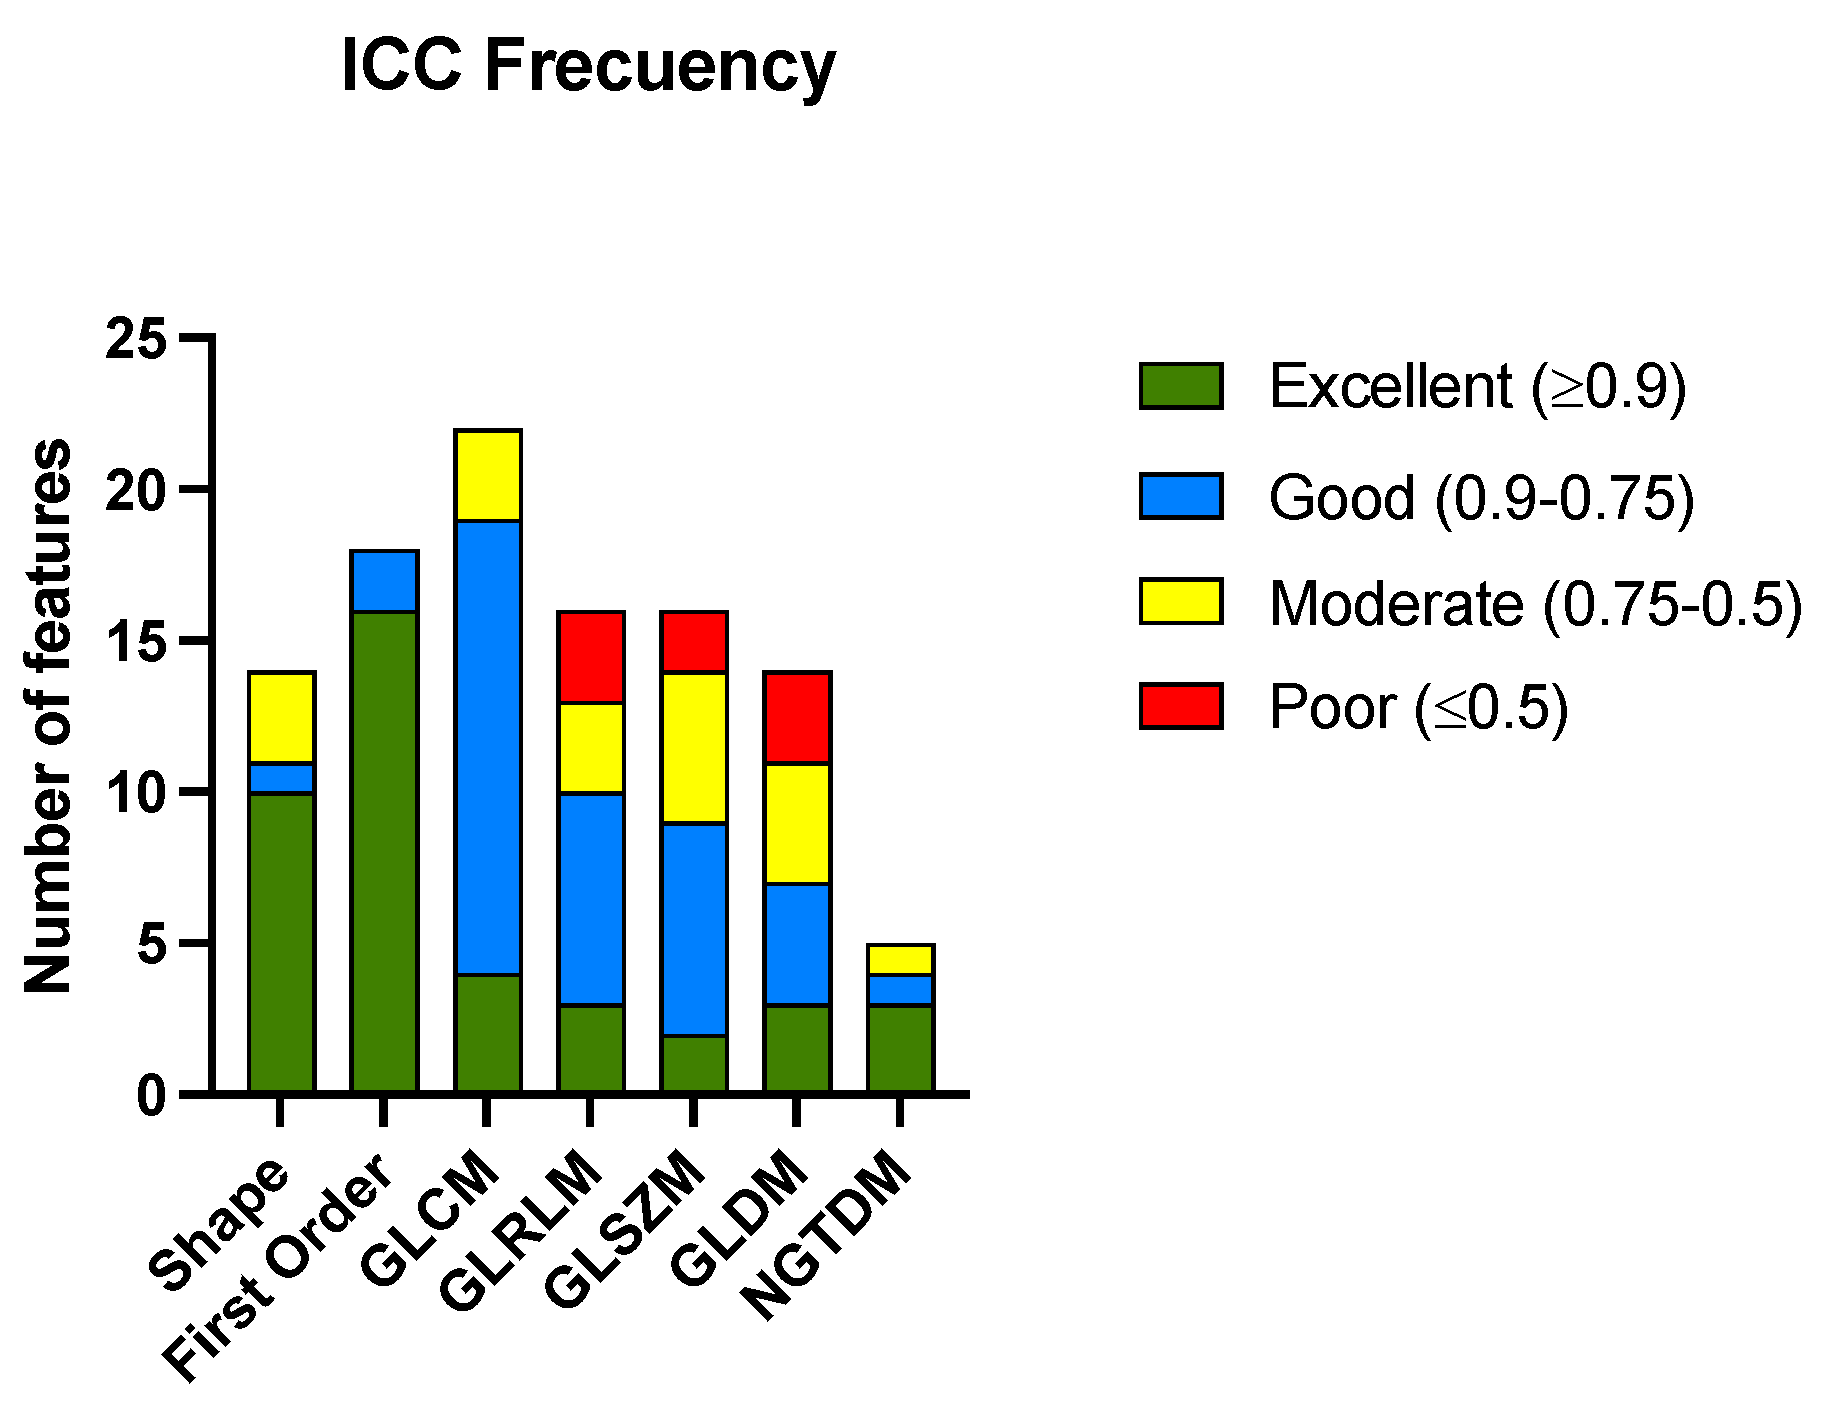
| Radiomic Group | Excellent | Good | Moderate | Poor |
|---|---|---|---|---|
| Shape | 10 (71.42) | 1 (7.14) | 3 (21.43) | 0 (0) |
| First order | 16 (88.89) | 2 (11.11) | 0(0) | 0 (0) |
| GLCM | 4 (18.18) | 15 (68.18) | 3 (13.64) | 0 (0) |
| GLRLM | 3 (18.75) | 7 (43.75) | 3 (18.75) | 3 (18.75) |
| GLSZM | 2 (12.50) | 7 (43.75) | 5 (31.25) | 2 (12.50) |
| GLDM | 3 (21.43) | 4 (28.57) | 4 (28.57) | 3 (21.43) |
| NGTDM | 3 (60.00) | 1 (20.00) | 1 (20.00) | 0(0) |
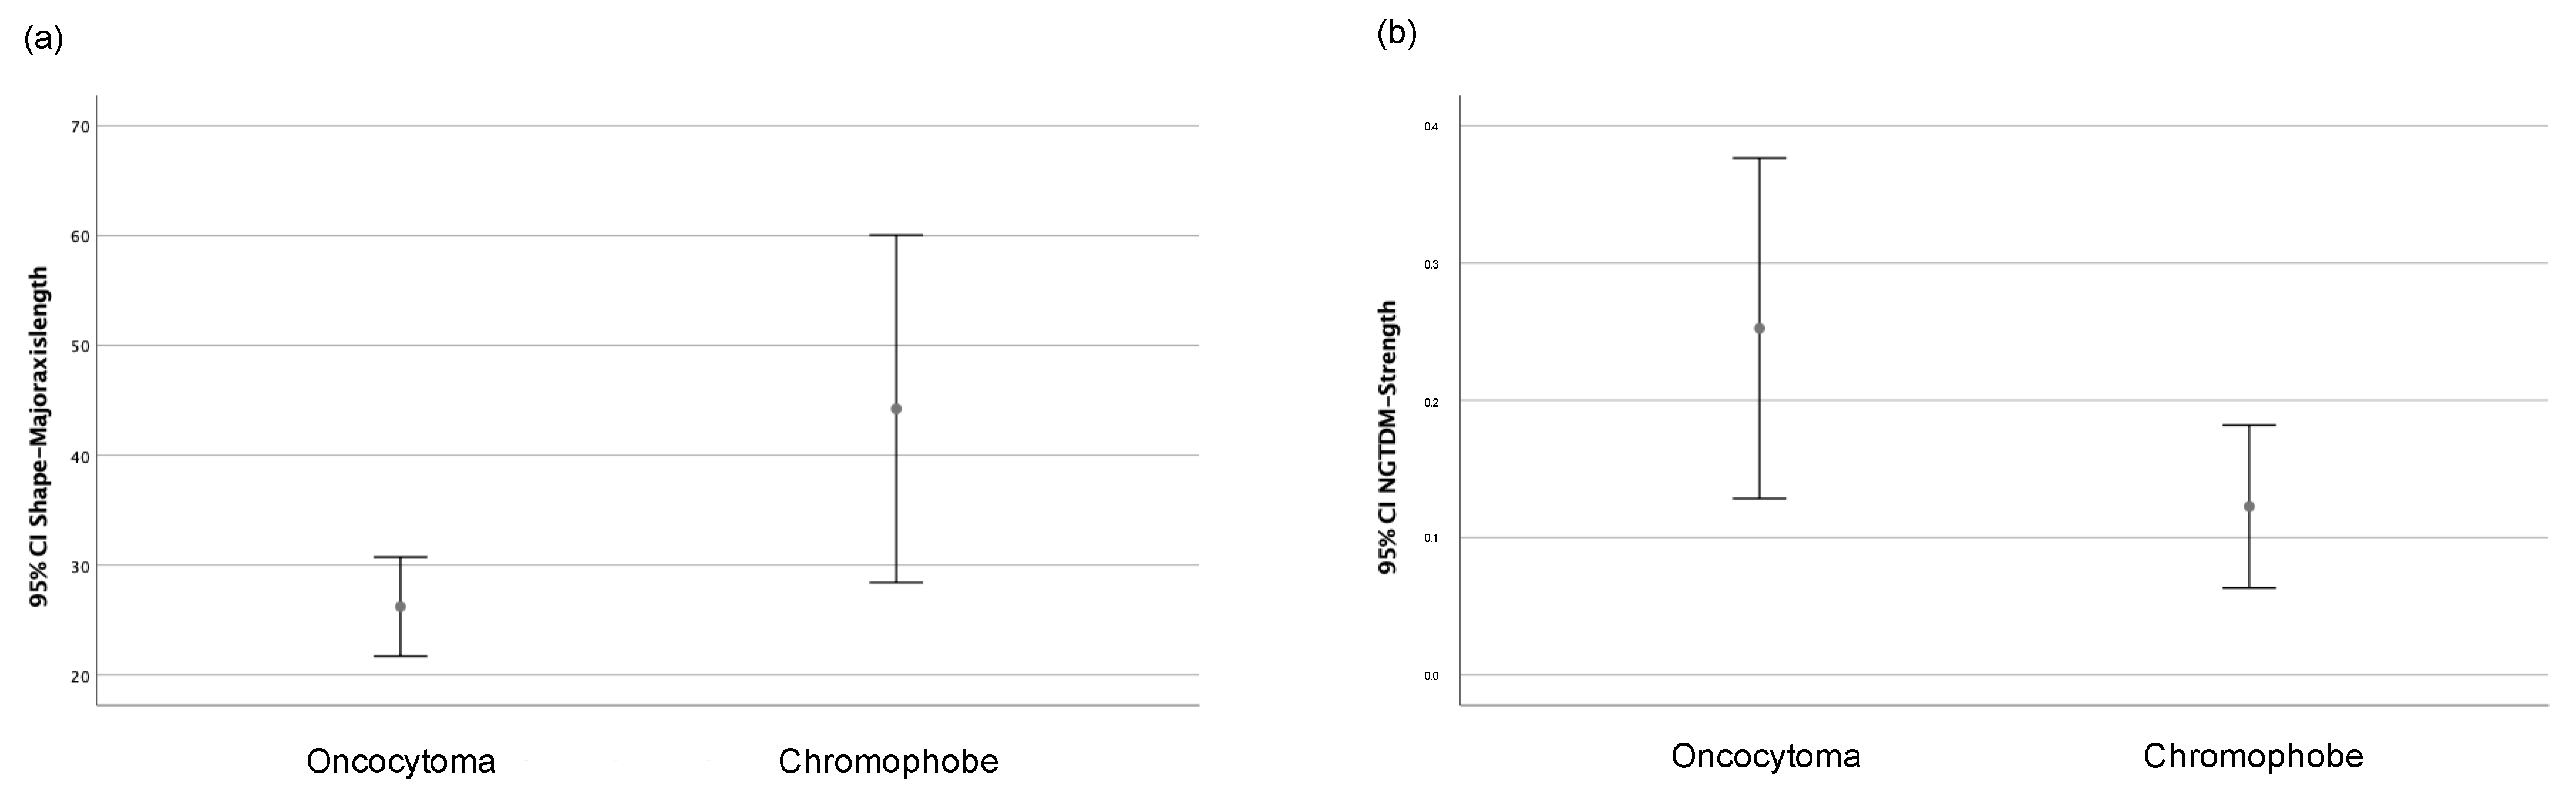
| Radiomic Feature | Oncocytoma | Chromophobe | p-Value |
|---|---|---|---|
| Major axis length (shape) | 25.62 (10.41) | 32.09 (22.62) | 0.02 * |
| 10th percentile (first order) | 734.28 (99.87) | 732.86 (105.68) | 0.96 |
| Interquartile range (first order) | 62.50 (20.48) | 52.19 (21.77) | 0.07 |
| Kurtosis (first order) | 3.47 (1.52) | 3.65 (1.72) | 0.28 |
| Minimum (first order) | 563.96 (108.25) | 557.75 (149.95) | 0.89 |
| Strength (NGTDM) | 0.15 (0.35) | 0.06 (0.17) | 0.04 * |
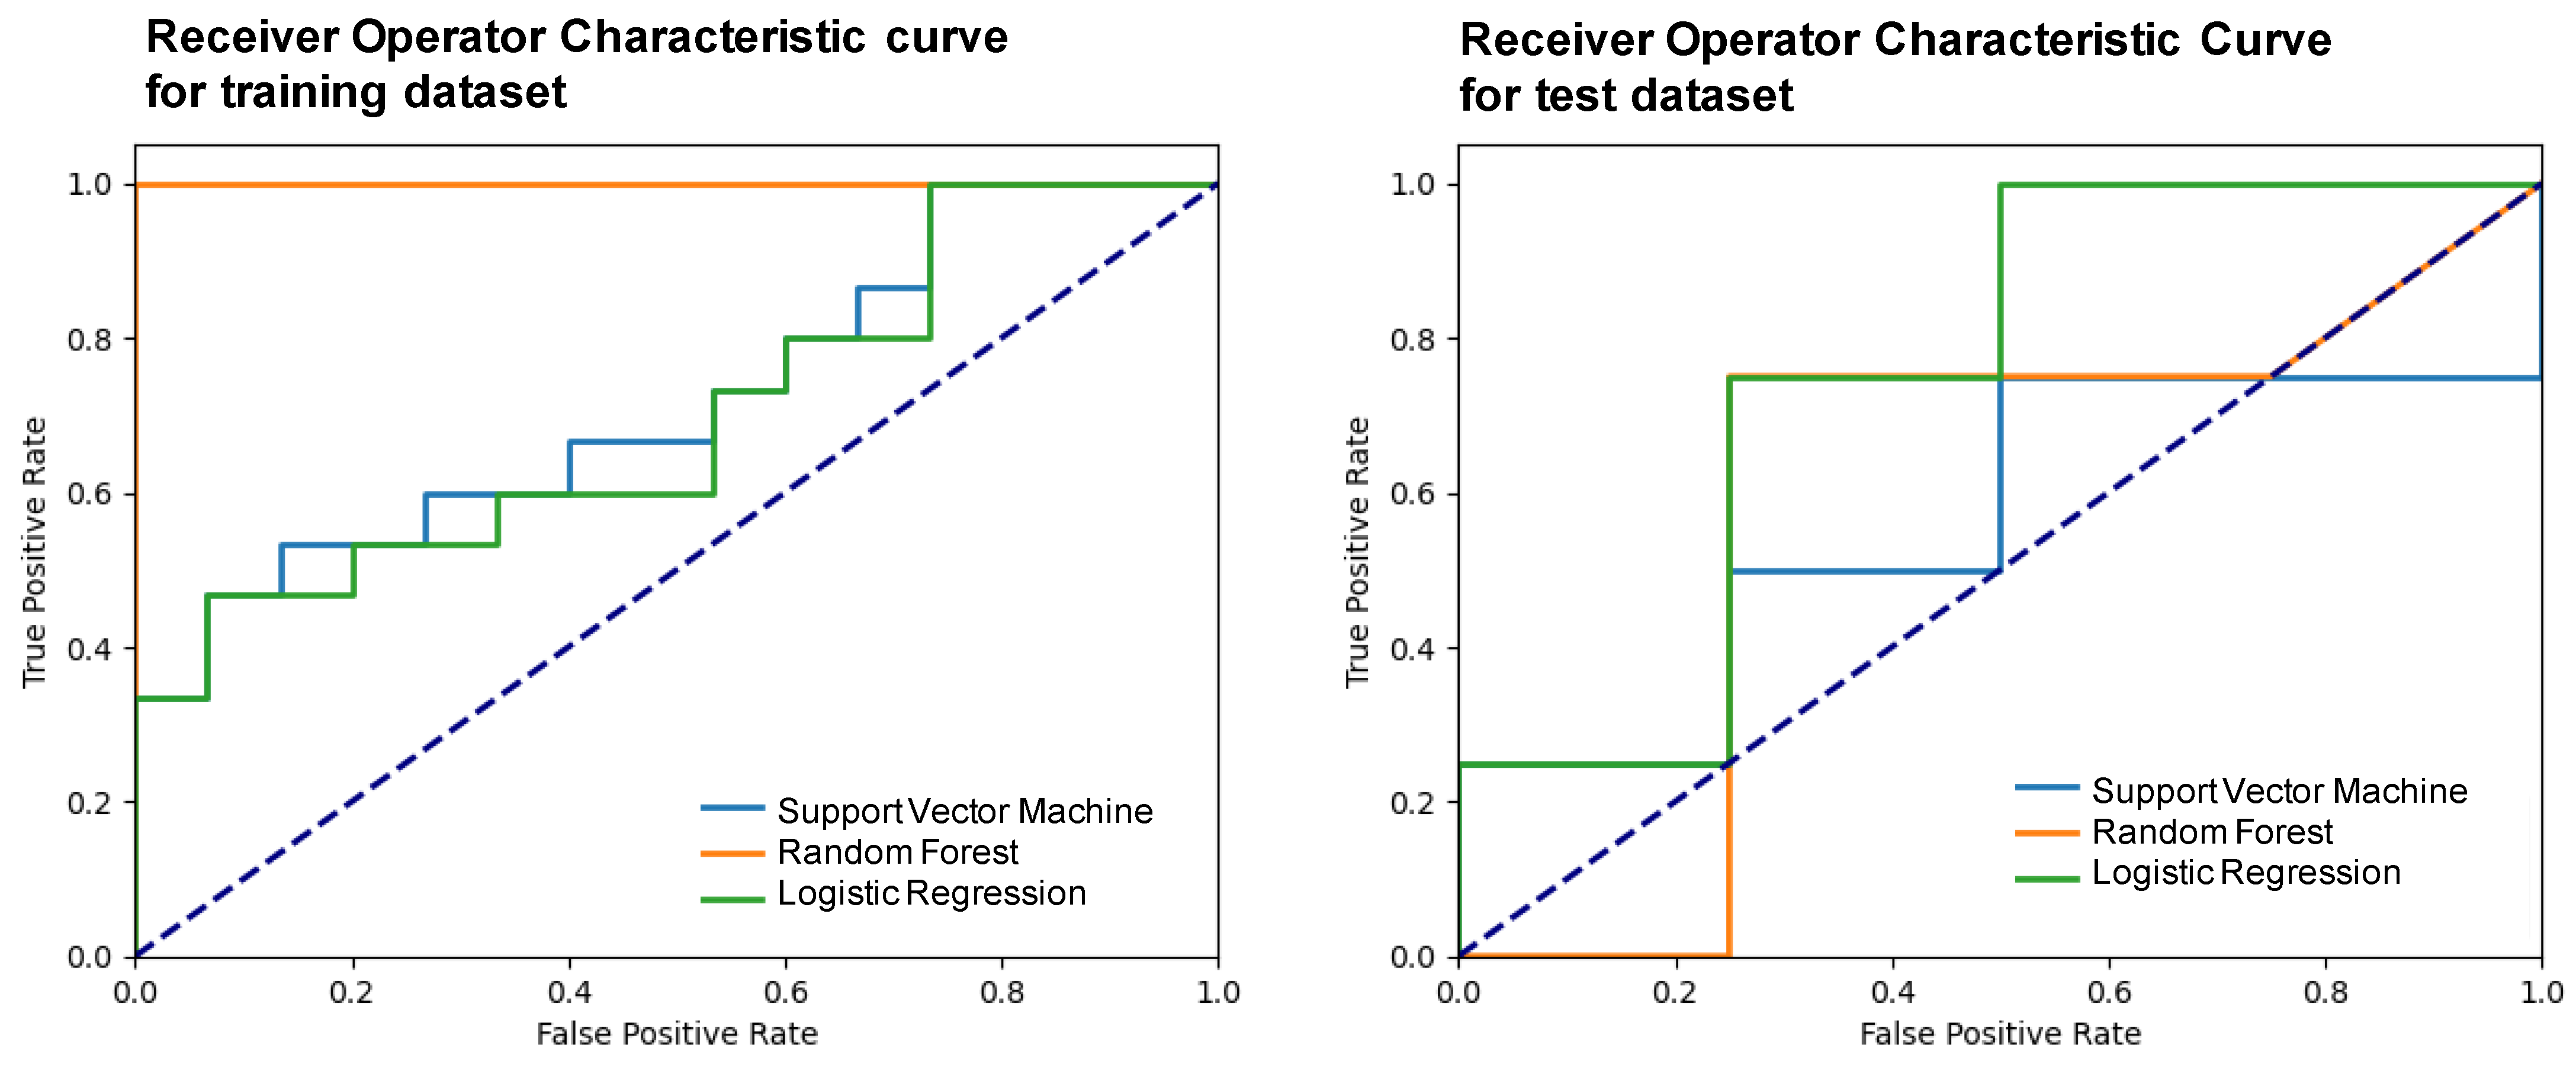
| Model | Accuracy | F1-Score | Precision | Recall | Specificity | NPV | AUC (95% CI) |
|---|---|---|---|---|---|---|---|
| Support vector machine | 0.50 (0.10) | 0.47 (0.12) | 0.50 (0.23) | 0.50 (0.10) | 0.25 (0.20) | 0.60 (0.38) | 0.56 (0.21–0.70) |
| Random forest | 0.75 (0.16) | 0.75 (0.20) | 0.75 (0.22) | 0.75 (0.16) | 0.63 (0.25) | 0.54 (0.14) | 0.59 (0.24–0.92) |
| Logistic regression | 0.75 (0.21) | 0.73 (0.21) | 0.83 (0.16) | 0.75 (0.19) | 0.63 (0.23) | 0.80 (0.20) | 0.75 (0.55–1.00) |
Disclaimer/Publisher’s Note: The statements, opinions and data contained in all publications are solely those of the individual author(s) and contributor(s) and not of MDPI and/or the editor(s). MDPI and/or the editor(s) disclaim responsibility for any injury to people or property resulting from any ideas, methods, instructions or products referred to in the content. |
© 2023 by the authors. Licensee MDPI, Basel, Switzerland. This article is an open access article distributed under the terms and conditions of the Creative Commons Attribution (CC BY) license (https://creativecommons.org/licenses/by/4.0/).
Share and Cite
Aymerich, M.; García-Baizán, A.; Franco, P.N.; Otero-García, M. Exploratory Analysis of the Role of Radiomic Features in the Differentiation of Oncocytoma and Chromophobe RCC in the Nephrographic CT Phase. Life 2023, 13, 1950. https://doi.org/10.3390/life13101950
Aymerich M, García-Baizán A, Franco PN, Otero-García M. Exploratory Analysis of the Role of Radiomic Features in the Differentiation of Oncocytoma and Chromophobe RCC in the Nephrographic CT Phase. Life. 2023; 13(10):1950. https://doi.org/10.3390/life13101950
Chicago/Turabian StyleAymerich, María, Alejandra García-Baizán, Paolo Niccolò Franco, and Milagros Otero-García. 2023. "Exploratory Analysis of the Role of Radiomic Features in the Differentiation of Oncocytoma and Chromophobe RCC in the Nephrographic CT Phase" Life 13, no. 10: 1950. https://doi.org/10.3390/life13101950
APA StyleAymerich, M., García-Baizán, A., Franco, P. N., & Otero-García, M. (2023). Exploratory Analysis of the Role of Radiomic Features in the Differentiation of Oncocytoma and Chromophobe RCC in the Nephrographic CT Phase. Life, 13(10), 1950. https://doi.org/10.3390/life13101950